
Abstract
The Laser Doppler technique (Laser-Doppler-Fluxmetry, LDF), a noninvasive method to estimate skin blood flow (LDF), is frequently used in research and clinical routine [1]. Here, the measurements were carried out with a new Laser Doppler system, the DOP-system, which allows to measure frequency spectra in four different frequency windows according to the velocities in venules (low velocity), capillaries (low to medium velocities), and in arteries (with high and very high velocities). However, the diagnostic reliability or the effectiveness of the LDF has not yet been evaluated sufficiently, which is indispensable, where medical diagnostics and therapy controls are concerned. For a valid interpretation of LDF values of individual patients, the knowledge of the reference range and the variability of the measured parameters is required.
In four successive studies the reference range (62 apparently healthy subjects), the circadian variability (8 subjects), the variability from day-to-day (6 subjects) and over one year with monthly measurements (6 subjects) were evaluated.
With the knowledge of the reference range, microcirculatory disorders can now be diagnosed using the DOP method. Following a standard measurement procedure there was no dependence of the measured data on the day or season of measurement.
Introduction
Laser Doppler measurements are frequently used in research and clinical routine. Laser Doppler fluxmetry (LDF) is one of these noninvasive methods to assess skin blood perfusion (blood flow, blood volume, and velocities of blood cells) measuring the flow of blood cells inside a volume without harming the tissue. Laser light epi-illuminates the tissue of interest and a fraction of the illumination light is reflected by blood cells flowing in the blood vessels of variable size. Light hitting moving blood cells undergoes a change in wavelength (Doppler shift) while light hitting static objects is unchanged. The magnitude and frequency distribution of these changes in wavelength are directly related to the number and velocity of the blood cells in the measuring volume. Reflected light is usually sampled from a tissue depth of up to 7 mm [1]. Since skin thickness can vary, it is possible that information on blood flow not only from skin but also from tissues under the skin can be sampled [2]. Light reflected from moving cells is in bands of frequencies corresponding to categories of blood vessels assessed. The magnitude of the reflected Laser-Doppler signal is the result of an overlay of many single signals which not only depend on the velocity of cells, but also on the amount of cells in the measured tissue volume with the respective velocity. So, an integral of cell velocities and cells numbers is measured. The measurement of this integral parameter does not allow, in principle, to calculate the single cell velocities and the numbers of respective cells. Therefore, the resulting dimensionless parameter is called blood flux or LD-amplitude to differentiate this parameter from the blood flow which has the dimension of ml/min. The resulting parameter is picked up by a returning fiber, converted into an electronic signal (LD-amplitude [–]) and analyzed. The LD-amplitude is useful for measuring the cutaneous blood flux in humans [3, 4] or animals [5]. This approach was first used in the 1980s [6, 8] and has since been applied for many tissues.
The diagnostic reliability or effectivity of LDF has not been tested sufficiently so far. Proof of reliability is undispensible, however, for medical diagnostics as well as for therapy control and follow-up [9]. To make a diagnosis, the results of LDF measurements of patients are compared to groups of measurements of e.g. apparently healthy probands (for definition see [10, 11]), so that a decision is reached of either “normal” (meaning “not ill”) or “pathological”.
Therefore, a clear interpretation of LDF values of individual patients requires the knowledge of the reference range and the variability of the measured parameters. Statistical methods are used to calculate the reference ranges from LDF measurements of healthy persons. Those results are described as “normal” which appeared in 95% of all examined healthy probands. For the calculation of the reference range, 95% of the measurements of all examined persons are exploited. Beside the reference range, the variability of a measurement parameter in the course of a day, from day to day and in the course of a year is of high importance. For these examinations the new Laser-Doppler-System, the DOP-system, of the Laser-Medicine Center Berlin was applied. Differing from other LD-systems, the measured frequency spectra are differentiated and assigned to four frequency bands (“windows”) in the DOP-system [12]. Blood cells with the highest velocities are assigned to the frequency window DOP4, blood cells with the lowest velocities to frequency window DOP1.
Materials and methods
In a first study in n = 62 apparently healthy probands the reference range for LD-values in the four frequency windows was assessed by comparison of the LD-values with blood cell velocities in the probands’ nailfolds measured by capillary microscopy. In three successive studies, the variabilities of LD-amplitudes in the course of a day (n = 8 probands), from day to day (n = 7 probands) and from month to month (n = 6 probands) were measured. The study was part of a quality management project performed in the Institute for Clinical Hemostasiology and Transfusion Medicine at the University Saarland in compliance with the Declaration of Helsinki/Somerset West [13].
LD-measurement-System
The DOP-system (Laser-medicine center Berlin) is based on an IBM-compatible computer equipped with two additional expansion boards and further provided with two LD gauge heads [12]. Each gauge head contains a focused Laser-Diode with a wave length of 670 mm and an emission power of 5 mW. The reflected light was received by two photodiodes, electronically pre-amplified in the gauge head and conducted via cable to the control- and converter board. The software controlled gauge heads, the tunable amplification and the real-time frequency analysis (FFT) of the signals with tunable filters enabled the immediate display and evaluation of the signals. All measurements were performed at room temperature without additional heating of the gauge head.
In a previous study, it could be shown that the LD-amplitudes were in good agreement with erythrocyte velocities in small channels in vitro (CV = 0.9) [14].
Capillary microscopy
The microscopic examinations were performed under standardized conditions, for details see previous publication [15]. The visualization of erythrocytes in the nailfold capillaries was performed with a stereomicroscope (Zeiss AG, Germany), which was connected to a video system. Due to the absorption of green light by hemoglobin, epi-illuminating light with a wavelength of 480 nm allowed erythrocyte detection. So-called plasma gaps are formed at sites without erythrocytes, and can be observed clearly. The capillary erythrocyte velocity v ery was quantified by frame-to-frame analysis of the video pictures following the motion of the plasma gaps using an image analysis system ‘Cap-Image’ (Zeintl Engineering Office, Heidelberg, Germany [16]). Details of the assessment and error analysis are described elsewhere [17].
Statistics
For all samples arithmetic mean values and standard deviations are given (in case of categorical data percent values). Gaussian distributions were tested using Kolmogorov-Smirnov or D’Agostino & Pearson omnibus normality tests. Comparisons of the different materials and assays were carried out as one-way analysis of variance (when Gaussian distributed) or Kruskal-Wallis analysis as nonparametric test. Bonferroni’s multiple comparison tests (when Gaussian distributed) or Dunns tests (nonparametric) were applied as post hoc analysis. p-values less than 0.05 were considered significant.
Results
Reference range
For the determination of the reference ranges of the four frequency windows of the DOP2-system, 62 apparently healthy probands aged between 20 and 46 years (32 woman and 30 men), were examined. Only those data were exploited for this evaluation which were assessed under standard measurement conditions [15, 17]. The sample size was n = 4,125 and all measured parameters were Gaussian distributed.
Therefore, the reference value was determined as MV±2·s. The mean value of the capillary erythrocyte velocity, examined in all apparently healthy probands, amounted to v ery = 0.64 mm/s and coincided well with results from other studies [15]. The reference range started from 0.22 up to 1.06 mm/s. The variation coefficient amounted to 33%.
Mean values, standard deviations and variation coefficients of the LD-amplitudes in the frequency windows FF1 to FF4 are shown in Fig. 1.
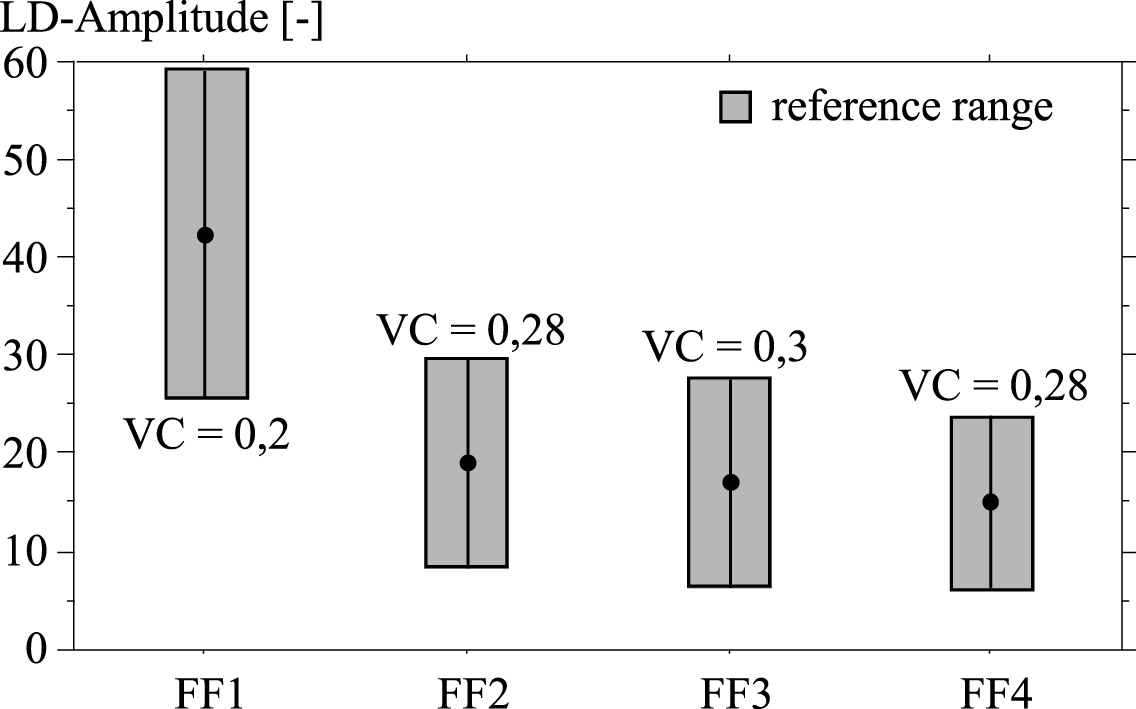
Reference ranges (m±2·s) and coefficients of variation (VC) of the four LD-amplitudes.
The LD-values in the four frequency windows did not differ between women and men (p > 0.05) and did not depend on the age of the probands.
The variability of LD-values was also determined in apparently healthy persons.
The circadian LD-values were assessed in 8 probands. The measurements were performed at 8:00 a.m., 11:00 a.m., 2:00 p.m. and 5:00 p.m. The LD-values in the course of one week were assessed in 7 probands. During this week the measurements were performed daily between 8:00 and 9:00 a.m. The LD-values in the course of one year were assessed in 6 probands once per month. The measurements were performed on one day during the first week of a month. At the time of measurement, the blood circulation at rest was measured at the back of the left hand (acupuncture point P3) with the DOP-system over a period of 5 minutes. At the same time the capillary erythrocyte velocity very was measured in the nailfold of the left ring finger with a microscope. In all examinations the skin temperature was between 27.3 and 30.8 °C.
In Figs. 2 to 6 the mean values of the LD-amplitudes in the frequency windows FF1 up to FF4 or, respectively, the erythrocyte velocities in the nailfold capillaries very with their standard deviations either in the course of a day, or a week, or a year are displayed.
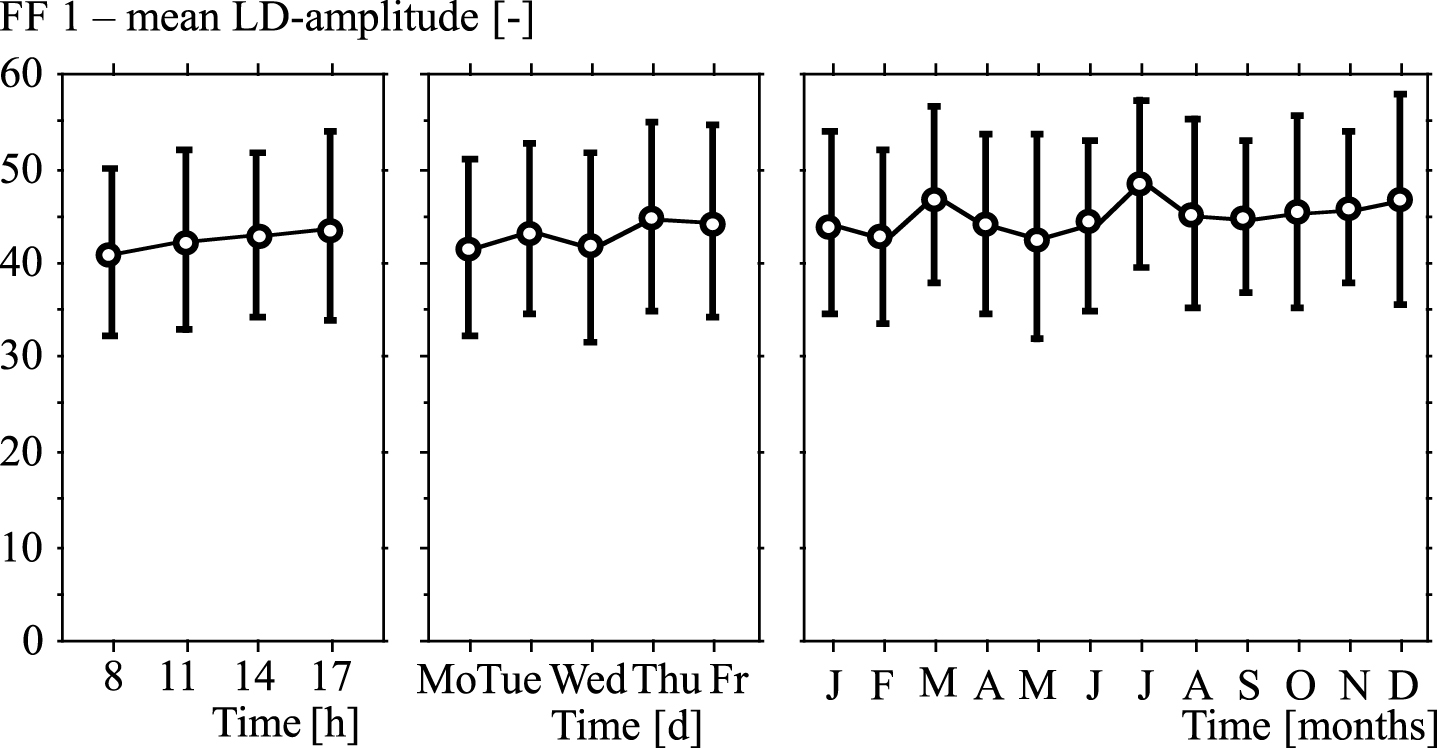
Variabilities of LD-amplitudes in frequency window FF1 in the course of a day, or a week, or a year (mean values and standard deviations).
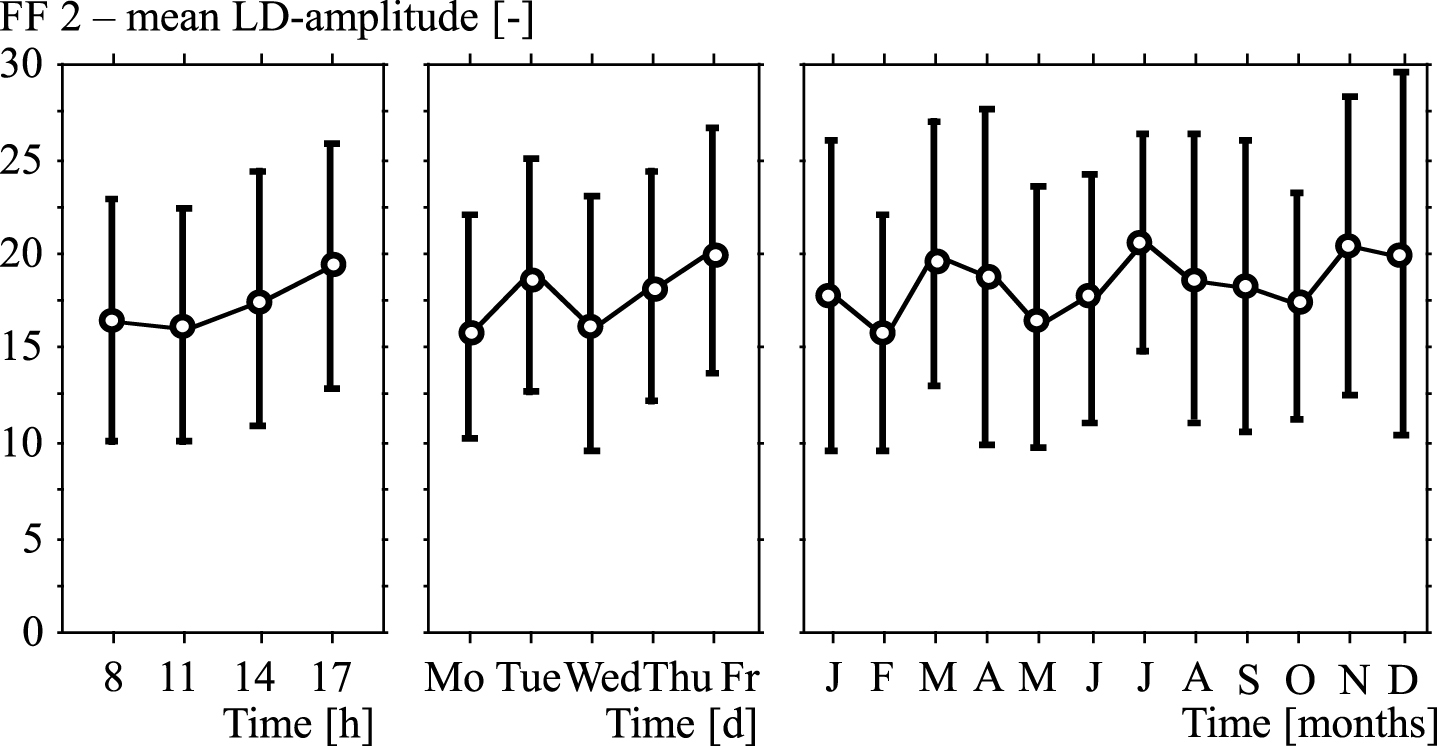
Variabilities of LD-amplitudes in frequency window FF2 in the course of a day, or a week, or a year (mean values and standard deviations).
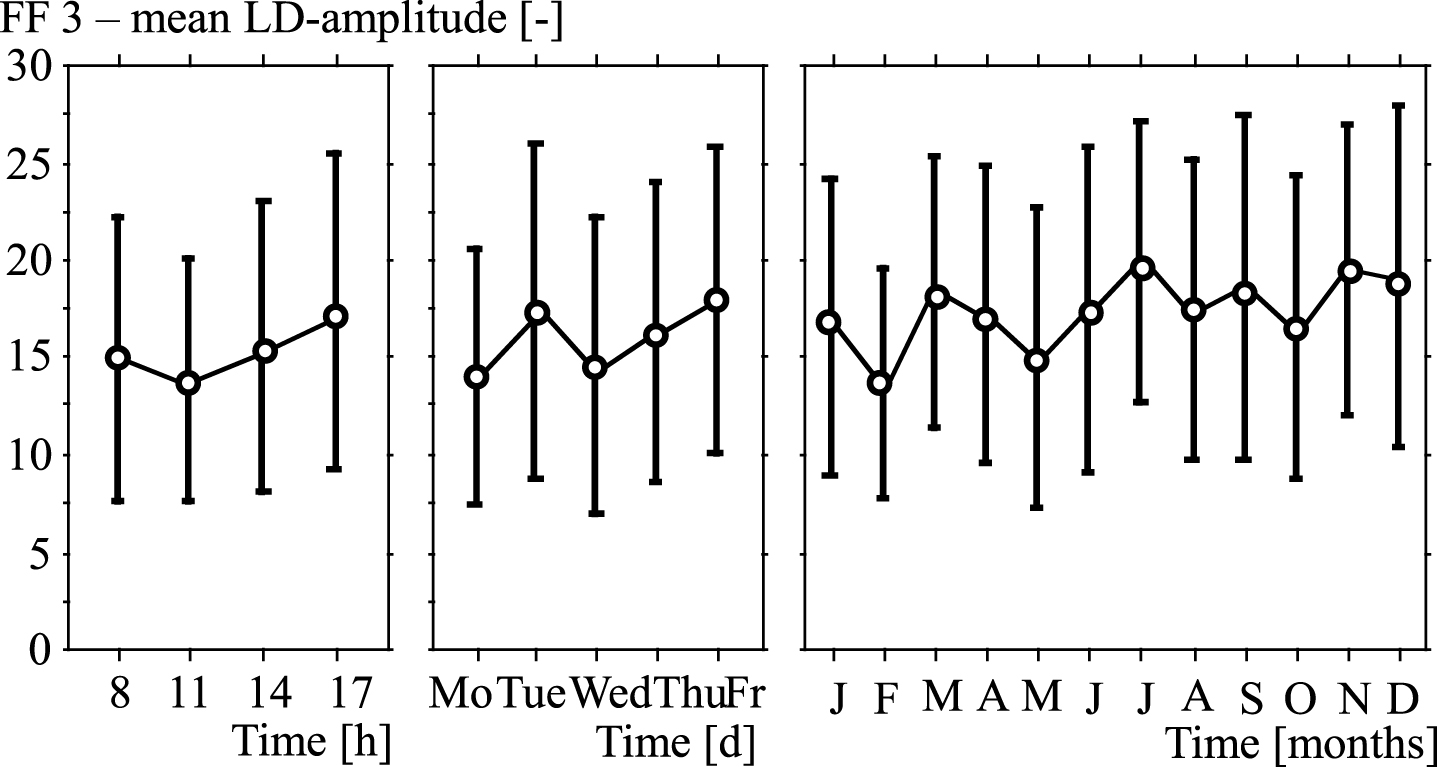
Variabilities of LD-amplitudes in frequency window FF3 in the course of a day, or a week, or a year (mean values and standard deviations).
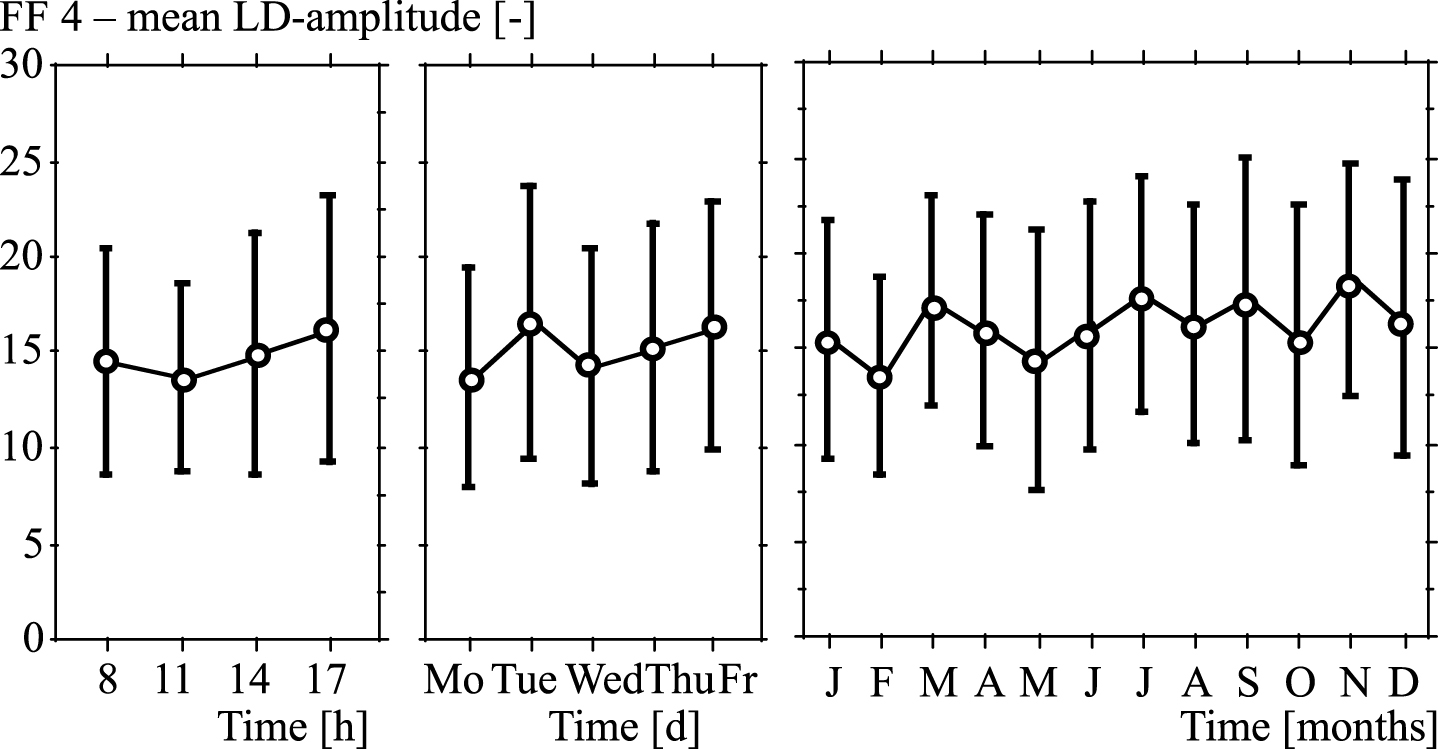
Variabilities of LD-amplitudes in frequency window FF4 in the course of a day, or a week, or a year (mean values and standard deviations).
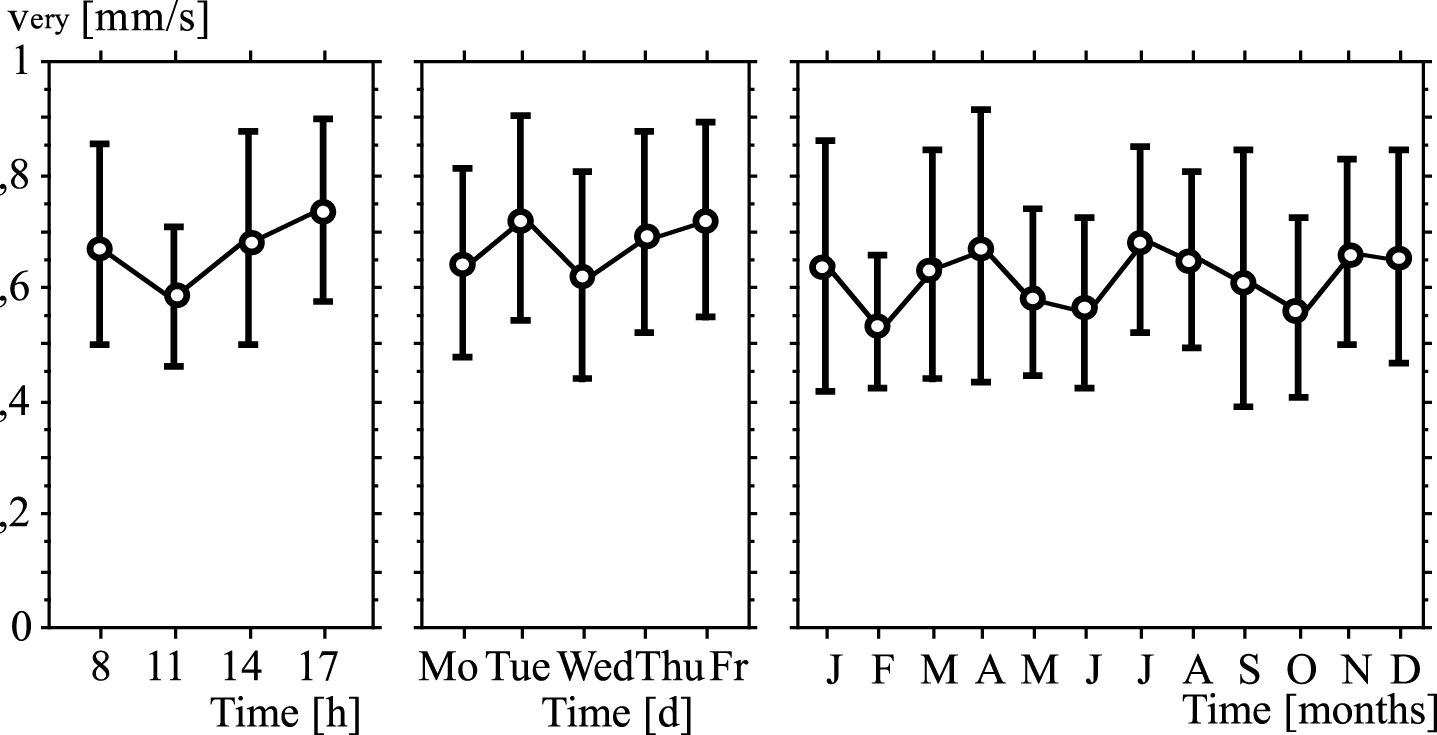
Variabilities of erythrocyte velocities in capillaries in the course of a day, or a week, or a year (v ery : mean values and standard deviations).
In none of the four frequency windows, FF1 up to FF4, significant differences between the measurements appeared, neither in the course of a day, nor in the course of a week or of a year. There were also no significant differences between the capillary erythrocyte velocities measured at different time courses. Single values of some probands showed considerable variations between different time points, which can be explained by highly individual circadian rhythms. These had, however, only marginal influence on the mean values.
Measurement of the blood perfusion of nailfold capillaries with capillary microscopy showed that the skin perfusion in many diseases is considerably reduced compared to healthy subjects [1–23]. Laser-Doppler-Fluxmetry is easier to apply than capillary microscopy. The question arose whether LD-fluxes could show equal or similar differences in skin perfusion as capillary microscopy in diseases with microcirculatory disorders. That is why in the study presented here the reference range of LD-fluxes was assessed in order to be potentially able to reveal deteriorations of the microcirculation or therapeutic effects (Fig. 1).
And then, of course, it is necessary for any method used to assess tissue perfusion for the elucidation of clinical questions, to evaluate the variation of this method. The circadian variation, especially, of a method is of great importance [24], since it is crucial for the interpretation of results, if there were variations in skin perfusion in the course of a day. The examination of the LD-amplitudes showed, however, that there were under standard measurement conditions [15] no significant parameter variations in the courses of the day, of the week and of the year. Also the results of the simultaneous measurements of erythrocyte velocities in nailfold capillaries did not reveal significant variations and confirmed the LDF findings. The observed variations of LD-fluxes were very individual, but did not result in significant variations of the mean values, when the standard conditions of measurement were applied. These results allow to conclude that ambulant as well as stationary patients can be examined with this method at any time, interpretation of results does not depend on the time of the day. The variation coefficients for the LD-flux were in a similar magnitude as those reported for the Laser-Doppler method (VC = 38.4% [25]), for the measurement of erythrocyte velocities in capillaries (VC = 23.4% [15]) or for the velocity measurement of color boli in retinal capillaries (VC = 26% [26]). In addition, it would be very convenient if LD-fluxes were independent of the time of the year. Therefore, a long term examination over 12 months, applying standardized measurement conditions, was conducted whether LD-fluxes might depend on the outside temperature. This is extremely important since skin perfusion not only determines the amount of heat transfer between the body and the environment but is also an important regulating variable for the thermo-regulation. A decrease in body temperature effects the constriction of skin blood vessels through a generalized increase of adrenergic vaso-constrictive activity. Then, through an increase of sympathetic tone with successive release of noradrenaline and stimulation of alpha-adrenergic nerve fibers, the constriction of arteriolar resistance vessels is triggered [27, 28]. An increase of skin temperature through heating of the region of interest or of the whole body is followed by an increase of skin perfusion [29]. To avoid regional changes in temperature and the influence of environmental temperature, standardized measurement conditions have to be applied and probands/ patients need to be adapted to a defined room temperature. The long term examination over 12 months showed that the experimental measurement conditions had been well chosen so that the perfusion variables did not depend on the outside temperature or the time of the year.
Conclusion
With the use of the evaluated reference ranges a deterioration of the microcirculation can now be diagnosed differentiating the measured frequencies assigned to four frequency bands associated with the velocities of blood cells being different in arterioles, venules, and capillaries. Applying standardized measurement conditions, the measurements do neither depend on the time of the day nor the time of the year.