






Abstract
BACKGROUND:
The plantar fasciitis is a common disease with a high prevalence in public and a frequent cause of heel pain.
OBJECTIVE:
In our pilot study, we wanted to characterise the feasibility of shear-wave elastography and contrast-enhanced ultrasound (CEUS) in the assessment of the plantar fasciitis.
METHODS:
23 cases of painful heels were examined by B-Mode ultrasound, Power Doppler (PD), shear wave elastography and contrast-enhanced ultrasound before anti-inflammatory radiation. Time-intensity-curves were analysed by the integrated software. The results for area-under-the-curve (AUC), peak, time-to-peak (TTP) and mean-transit-time (MTT) were compared between the plantar fascia and the surrounding tissue.
RESULTS:
All cases showed thickening of the plantar fascia, in most cases with interstitial oedema (87.0%). Shear wave elastography showed inhomogeneous stiffness of the plantar fascia. 83.3% of cases showed a visible hyperperfusion in CEUS at the proximal plantar fascia in comparison to the surrounding tissue. This hyperperfusion could also be found in 75.0% of cases with no signs of vascularisation in PD. AUC (p = 0.0005) and peak (p = 0.037) were significantely higher in the plantar fascia than in the surrounding tissue.
CONCLUSION:
CEUS and shear wave elastography are new diagnostic tools in the assessment of plantar fasciitis and can provide quantitative parameters for monitoring therapy.
Introduction
The plantar fasciitis is a frequent cause of heel pain, often associated with a plantar heel spur. The lifetime prevalence of plantar fasciitis is approximately 10% in the general population [1–4]. There are many different reasons for the development of a plantar fasciitis. Risk factors are inappropriate shoes, obesity or prolonged standing [5, 6]. Therapeutical gold standard is the anti-inflammatory radiation which is also recommended in the S2 guideline of the German society of radiooncology [2, 7].
The combination of anamnesis, clinical findings, specific scores and radiologic methods approves the diagnosis of plantar fasciitis. In daily practice, sonography is limited to conventional B-Mode and Doppler sonography [8]. Gradually, however, more elaborate ultrasound techniques are introduced in the diagnosis of plantar fasciitis.
Contrast-enhanced ultrasound (CEUS) is able to visualize microcirculation in many tissues by using sulphur-hexafluoride microbubbles as a contrast enhancer [9]. First, CEUS was recommended to clarify unidentified liver masses [10, 11]. Although CEUS is an off-label use in non-hepatic applications, it is recommended by the current EFSUMB guidelines [9] for other applications. CEUS is successfully used in liver [12] and kidney imaging [13–16] and other complex cases (e.g. free flaps, tumours of the thyroid gland) [17–20]. One first study shows alternation of microcirculation in plantar fasciitis using CEUS [21].
There are mainly two elastography techniques used in the evaluation of tissue stiffness, the strain elastography and the shear wave elastography. Strain elastography provides relative, qualitative visualization of tissue stiffness. It has already been used in the assessment of plantar fasciitis, showing a hardening of the plantar fascia in patients with plantar fasciitis [22]. Standardisation of strain elastography is hardly possible. Shear wave elastography could provide both, qualitative and quantitative assessment of the mechanical stiffness (elasticity) differences in tissue. To our knowledge, the use of shear wave elastography in plantar fascia has not been described so far.
The aim of this pilot study is to describe the possibilities of the modern ultrasound techniques CEUS and elastography in the assessment of the plantar fasciitis. The potential of these techniques for diagnosis of plantar fasciitis in patients with atypical clinical findings should be evaluated. Furthermore, it should be determined whether modern ultrasound techniques can provide quantitative parameters for therapeutic monitoring.
Material and methods
In this study 21 consecutive patients between January 2016 and March 2017 with the clinical diagnosis of plantar fasciitis were admitted to our Interdisciplinary Ultrasound Centre by the local Department of Radiotherapy, University Hospital Regensburg before starting anti-inflammatory radiotherapy. They were diagnosed by an experienced physician and confirmed by specific scores, conventional x-ray or MRI (as gold standard). All patients had a functional impairment or pain, which caused the indication for radiation. Two patients had heel pain on both sides and were evaluated left and right separately after a wash-out-phase of 30 minutes. So, in complete 23 cases were examined with a defined examination protocol. Examination and data collection was permitted by the ethics committee of the University Hospital Regensburg.
Two experienced sonographers performed ultrasound evaluation following a standardized examination protocol. Sonographers were blinded for the results of the questionnaires, the clinical evaluation of patients and the applied therapy. Examinations were conducted with a high-end ultrasound device (ACUSON S3000, Siemens, Erlangen, Germany) and were executed independently, in cases of disagreements in terms of a common final judgement, additional analyses were performed together. Each investigation was performed using high-resolution multifrequency linear probes (4–9 MHz and 6–18 MHz) on the lying patient. The heel was placed in a neutral position without tension on muscles and tendons. The sonography was undertaken by applying gentle compression with the hand-held probe on the heel. B-Mode images, colour-coded Doppler sonography (CCDS) and Power Doppler (PD) were performed according to the specific presets of the ultrasound device and stored in an analysable format digitally as pictures or loops in PACS (DICOM format).
First, the structure of plantar fascia and the presence of complications were documented. Echogenity was described in hyperechogenic, hypoechogenic and inhomogenous structure. Interstitial oedema or calcifications were recorded separately. The maximal thickening of the plantar fascia was measured in mm.
The flow profile and flow rates of the arteries (A. plantaris, A. tibialis posterior, A. dorsalis pedis) were measured by Doppler sonography to exclude a relevant arterial obstructive disease. The measured values were obtained by averaging three pulse waves through the device’s own software. Thrombosis was excluded according to the current guidelines [23, 24].
PD was used to describe the macrovascularisation of the plantar fascia. Gain and Pulse Repetition Frequency (PRF) was adjusted to a high sensitivity. A scale from 1 (no vascularisation) to 5 (extreme vascularisation) was used to describe the differences.
For the elastographic evaluation the probe was placed on the heel with gentle pressure. The region of interest was placed individually including the plantar fascia and the surrounding tissue. Colour scale was chosen according to Wu et al. [22, 25]. Softer parts of tissue were coded blue, harder parts showed red colour. Scale reported a continuous spectrum of shear wave velocity from 0.5 m/s (blue) to 10 m/s (red). Colour images were stored in the analysable DICOM format in PACS. The measurement of shear wave elastography was done in 5 spots of the maximum pain.
After having given written consent, patients received a weight-dependent peripheral venous bolus injection of 1.0–2.4 ml of ultrasound contrast agent (sulphur hexafluoride microbubbles, SonoVue®, Bracco, Italy) followed by a 10 ml saline flush. The mechanical index was adjusted to values <0.2, which enabled the “low MI-technique” Contrast Harmonic Imaging of CEUS [9, 26]. Raw images were stored digitally as loops from early wash-in to the late wash-out time in PACS (DICOM format). Perfusion time intensity curve (TIC) analysis [20] was performed using the onboard Contrast Dynamic Software (ACUSON S3000, Siemens, Erlangen, Germany).
This integrated software analyses stored cine loops of the arterial wash-in between 7 to 29 seconds. Moving corrections were made before analysis. For the TIC-analysis one region of interest (ROI) was placed in the plantar fascia, another ROI was placed in representative not hypervascularized tissue of the same region. The results for area-under-the-curve (AUC), peak, time-to-peak (TTP) and mean-transit-time (MTT) were analysed in both ROIs. The characteristics for all parameters are described by Greis et al. [27]. Additionally, false colour pictures showing AUC, peak, TTP, MTT were stored digitally. The ratio between both ROIs was given in x-fold values.
Clinical and biochemical data were retrieved from a clinical database. Data collection was permitted by the ethics committee of the University Hospital Regensburg. The manuscript was written in accordance with the guidelines of Clinical Hemorheology and Microcirculation [28]. Statistical analyses were performed by using Microsoft Excel.
Results
There were more women than men included in the study (16 female heels vs. 7 male heels). The mean age was 51±10 years at the time of ultrasound evaluation for plantar fascia. 10 painful heels were on the right side, 13 on the left side.
In all cases the proximal plantar fascia was thickened (mean 6.3±2.2 mm), giving one feature of plantar fasciitis according to McMillan et al. [29]. Lowest values were 4 mm, highest values were 14 mm. Most of the cases had an hypoechogen plantar fascia (n = 14/23). In 3 cases hyperechogenic material in terms of calcifications could be described within the fascia. In 20 of 23 cases we observed interstitial oedema in the surrounding area.
PD revealed changes in the tissue macrovascularisation of only 7 heels (30.4%). Most of them were slightly hypervascularised (grade 2 and 3, n = 5, 21.7%), strong hypervascularisation (grade 4 and 5) was obvious in 1 case (4.3%) (Table 1).
Patient characteristics and sonographic findings
Patient characteristics and sonographic findings
In 18 of 23 heels CEUS could be used for the evaluation of the plantar fasciitis. No adverse events occurred by using ultrasound-contrast-agent.
15 of 18 patients showed a visible hyperperfusion in CEUS at the proximal plantar fascia in comparison to the surrounding tissue. This hyperperfusion could also be found in 9 cases with no signs of vascularisation in PD (n = 12).
For comparable results perfusion analysis with the integrated software were performed in all patients with CEUS. The area-under-the-curve (AUC) differs significantly between the plantar fascia and the surrounding tissue (p < 0.001). In average, the plantar fascia showed a 2.5±1.2-fold higher AUC (122.2±86.9% s vs. 56.4±49.4% s, p = 0.0005) than the surrounding tissue. The peak-value of the contrast bolus was also significantly higher in the plantar fascia (2.5±0.9-fold, 23.7±37.1% vs. 8.9±10.9, p = 0.037). Time-to-peak (TTP) (p = 0.320) and mean-transit-time (MTT) (p = 0.152) did not differ between both ROIs.
The integrated software demonstrated the values of AUC and peak in false-colour-pictures. A representative example is given in Fig. 3C+D. The red colour indicates high values of AUC in the proximal part of the plantar fascia representing hyperperfusion.
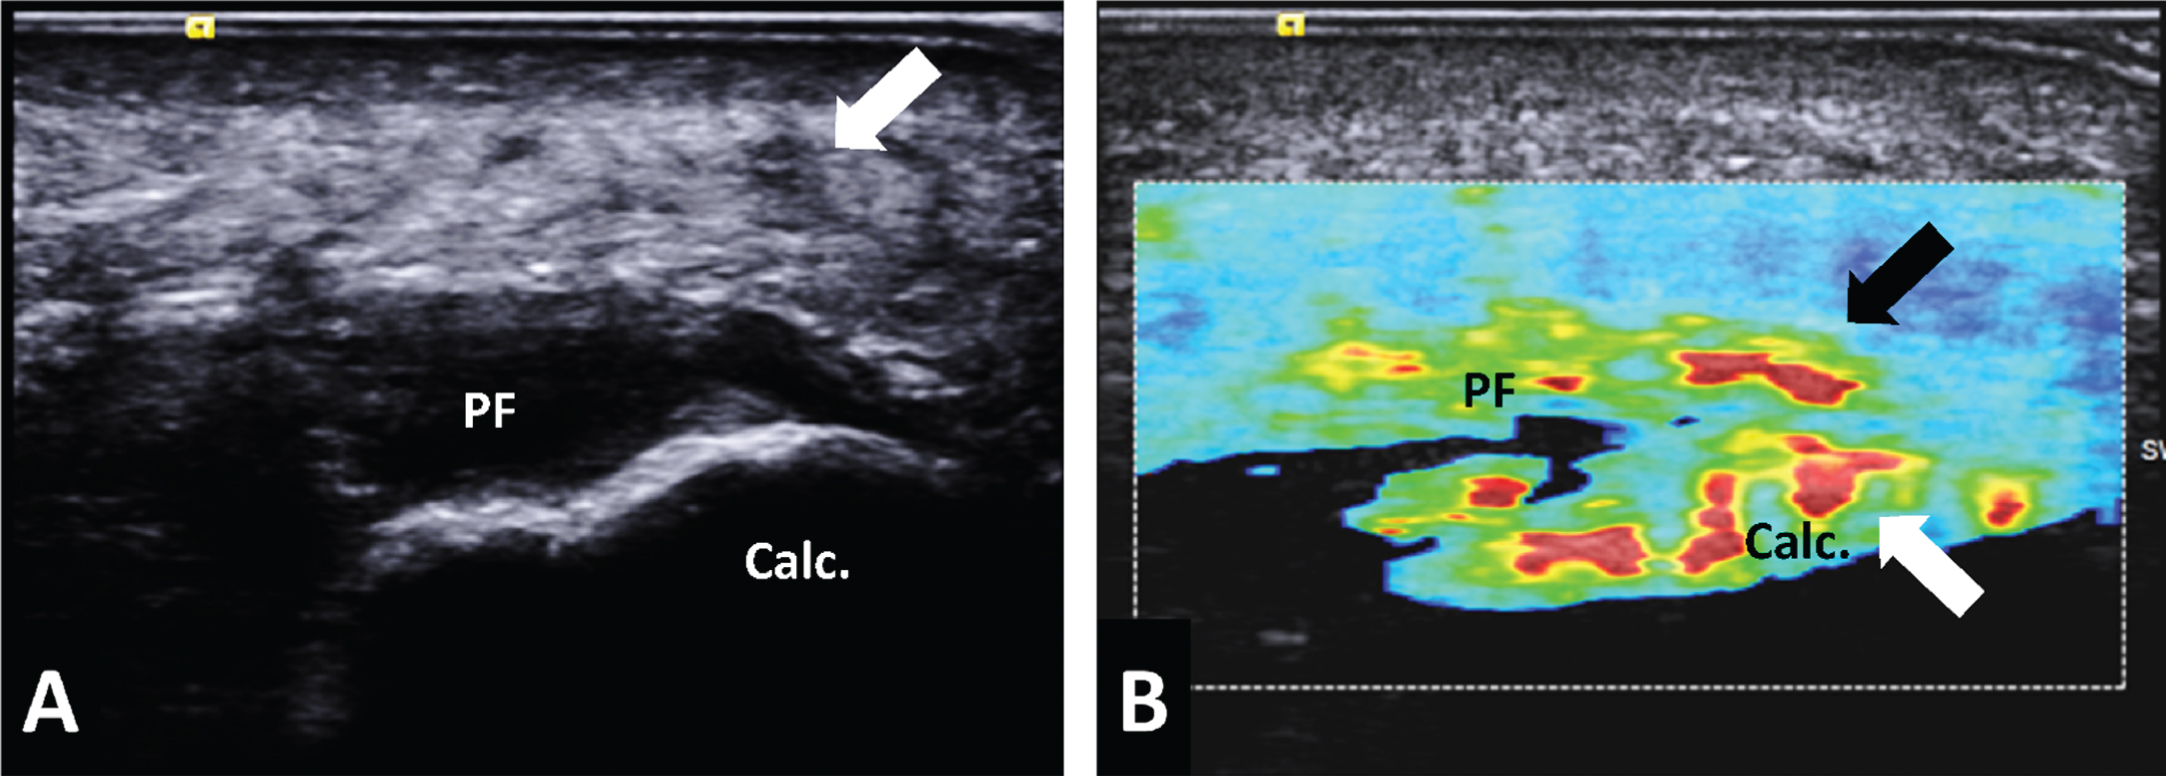
B-Mode findings of plantar fasciitis and shear wave elastography. (A) B-Mode: Thickening of the proximal plantar fascia (PF) is shown in B-Mode. The white arrow indicates interstitial oedema. (B) Shear wave elastography: False colour image of shear wave velocity. Red colour indicates high shear wave velocity (hard tissue), blue colour indicates low shear wave velocity (soft tissue). Black arrow indicates an artificial colour-coding of the calcaneus.
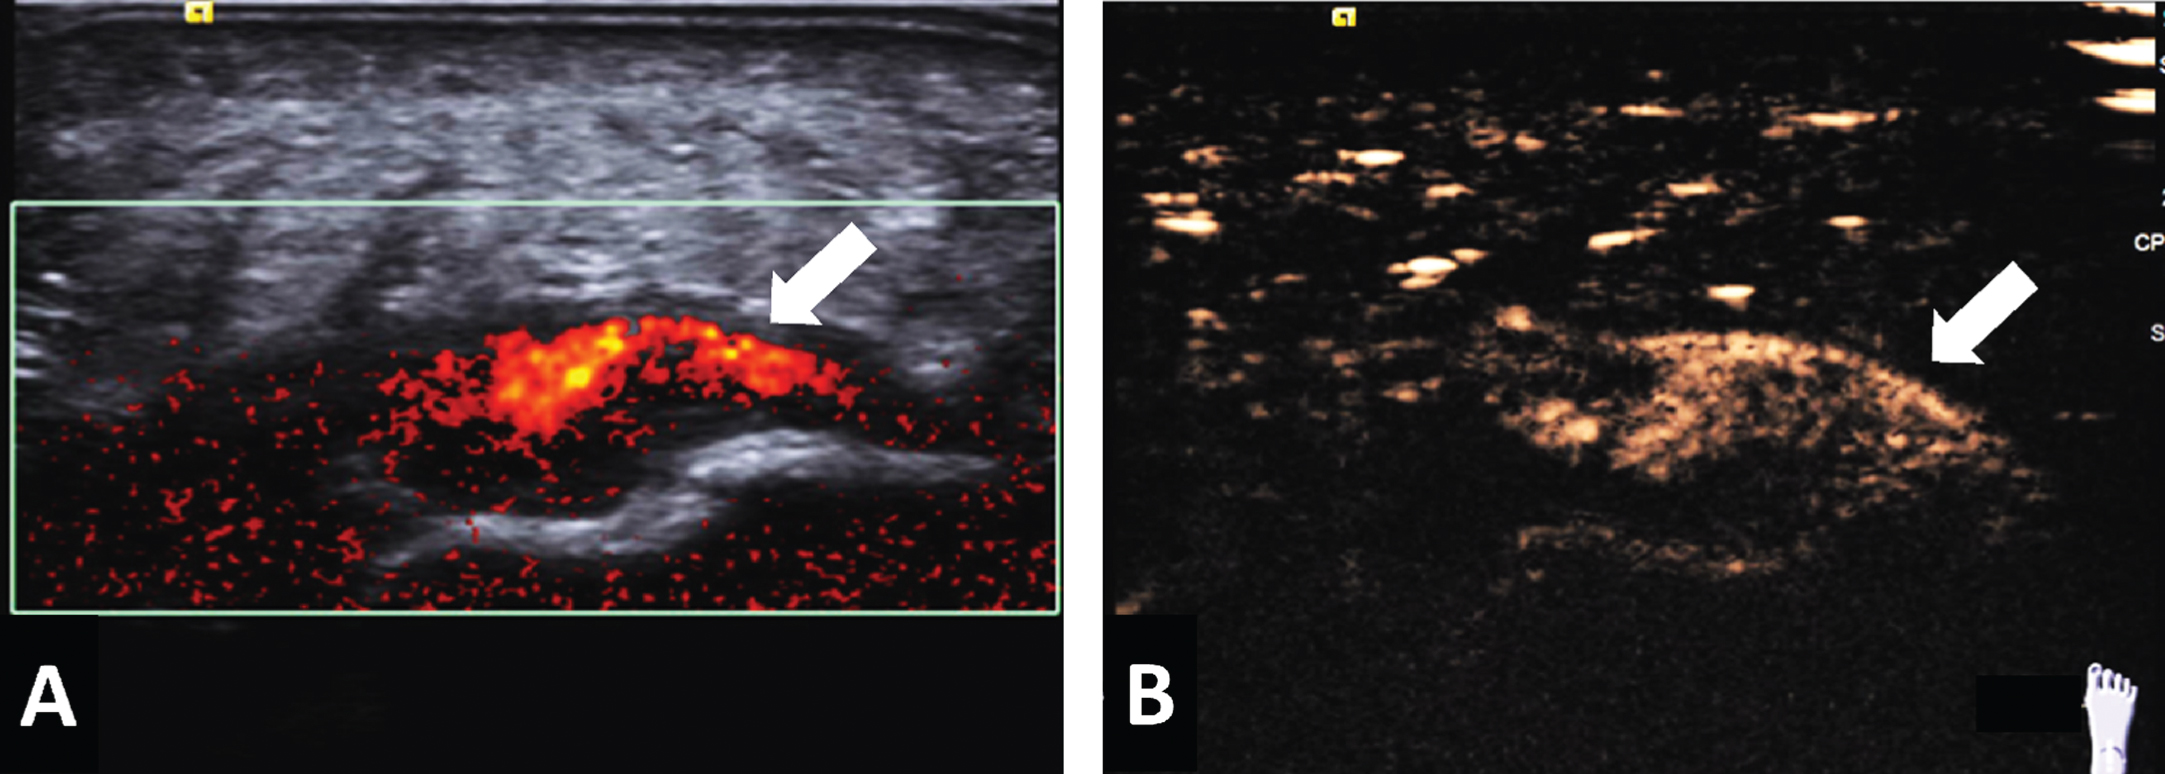
Macrovascularisation and microcirculation. (A) Power Doppler shows macrovascularisation in a 42-year-old woman with plantar fasciitis of the left heel. (B) Same Patient with strong contrast enhancement in CEUS, visualizing microcirculation.
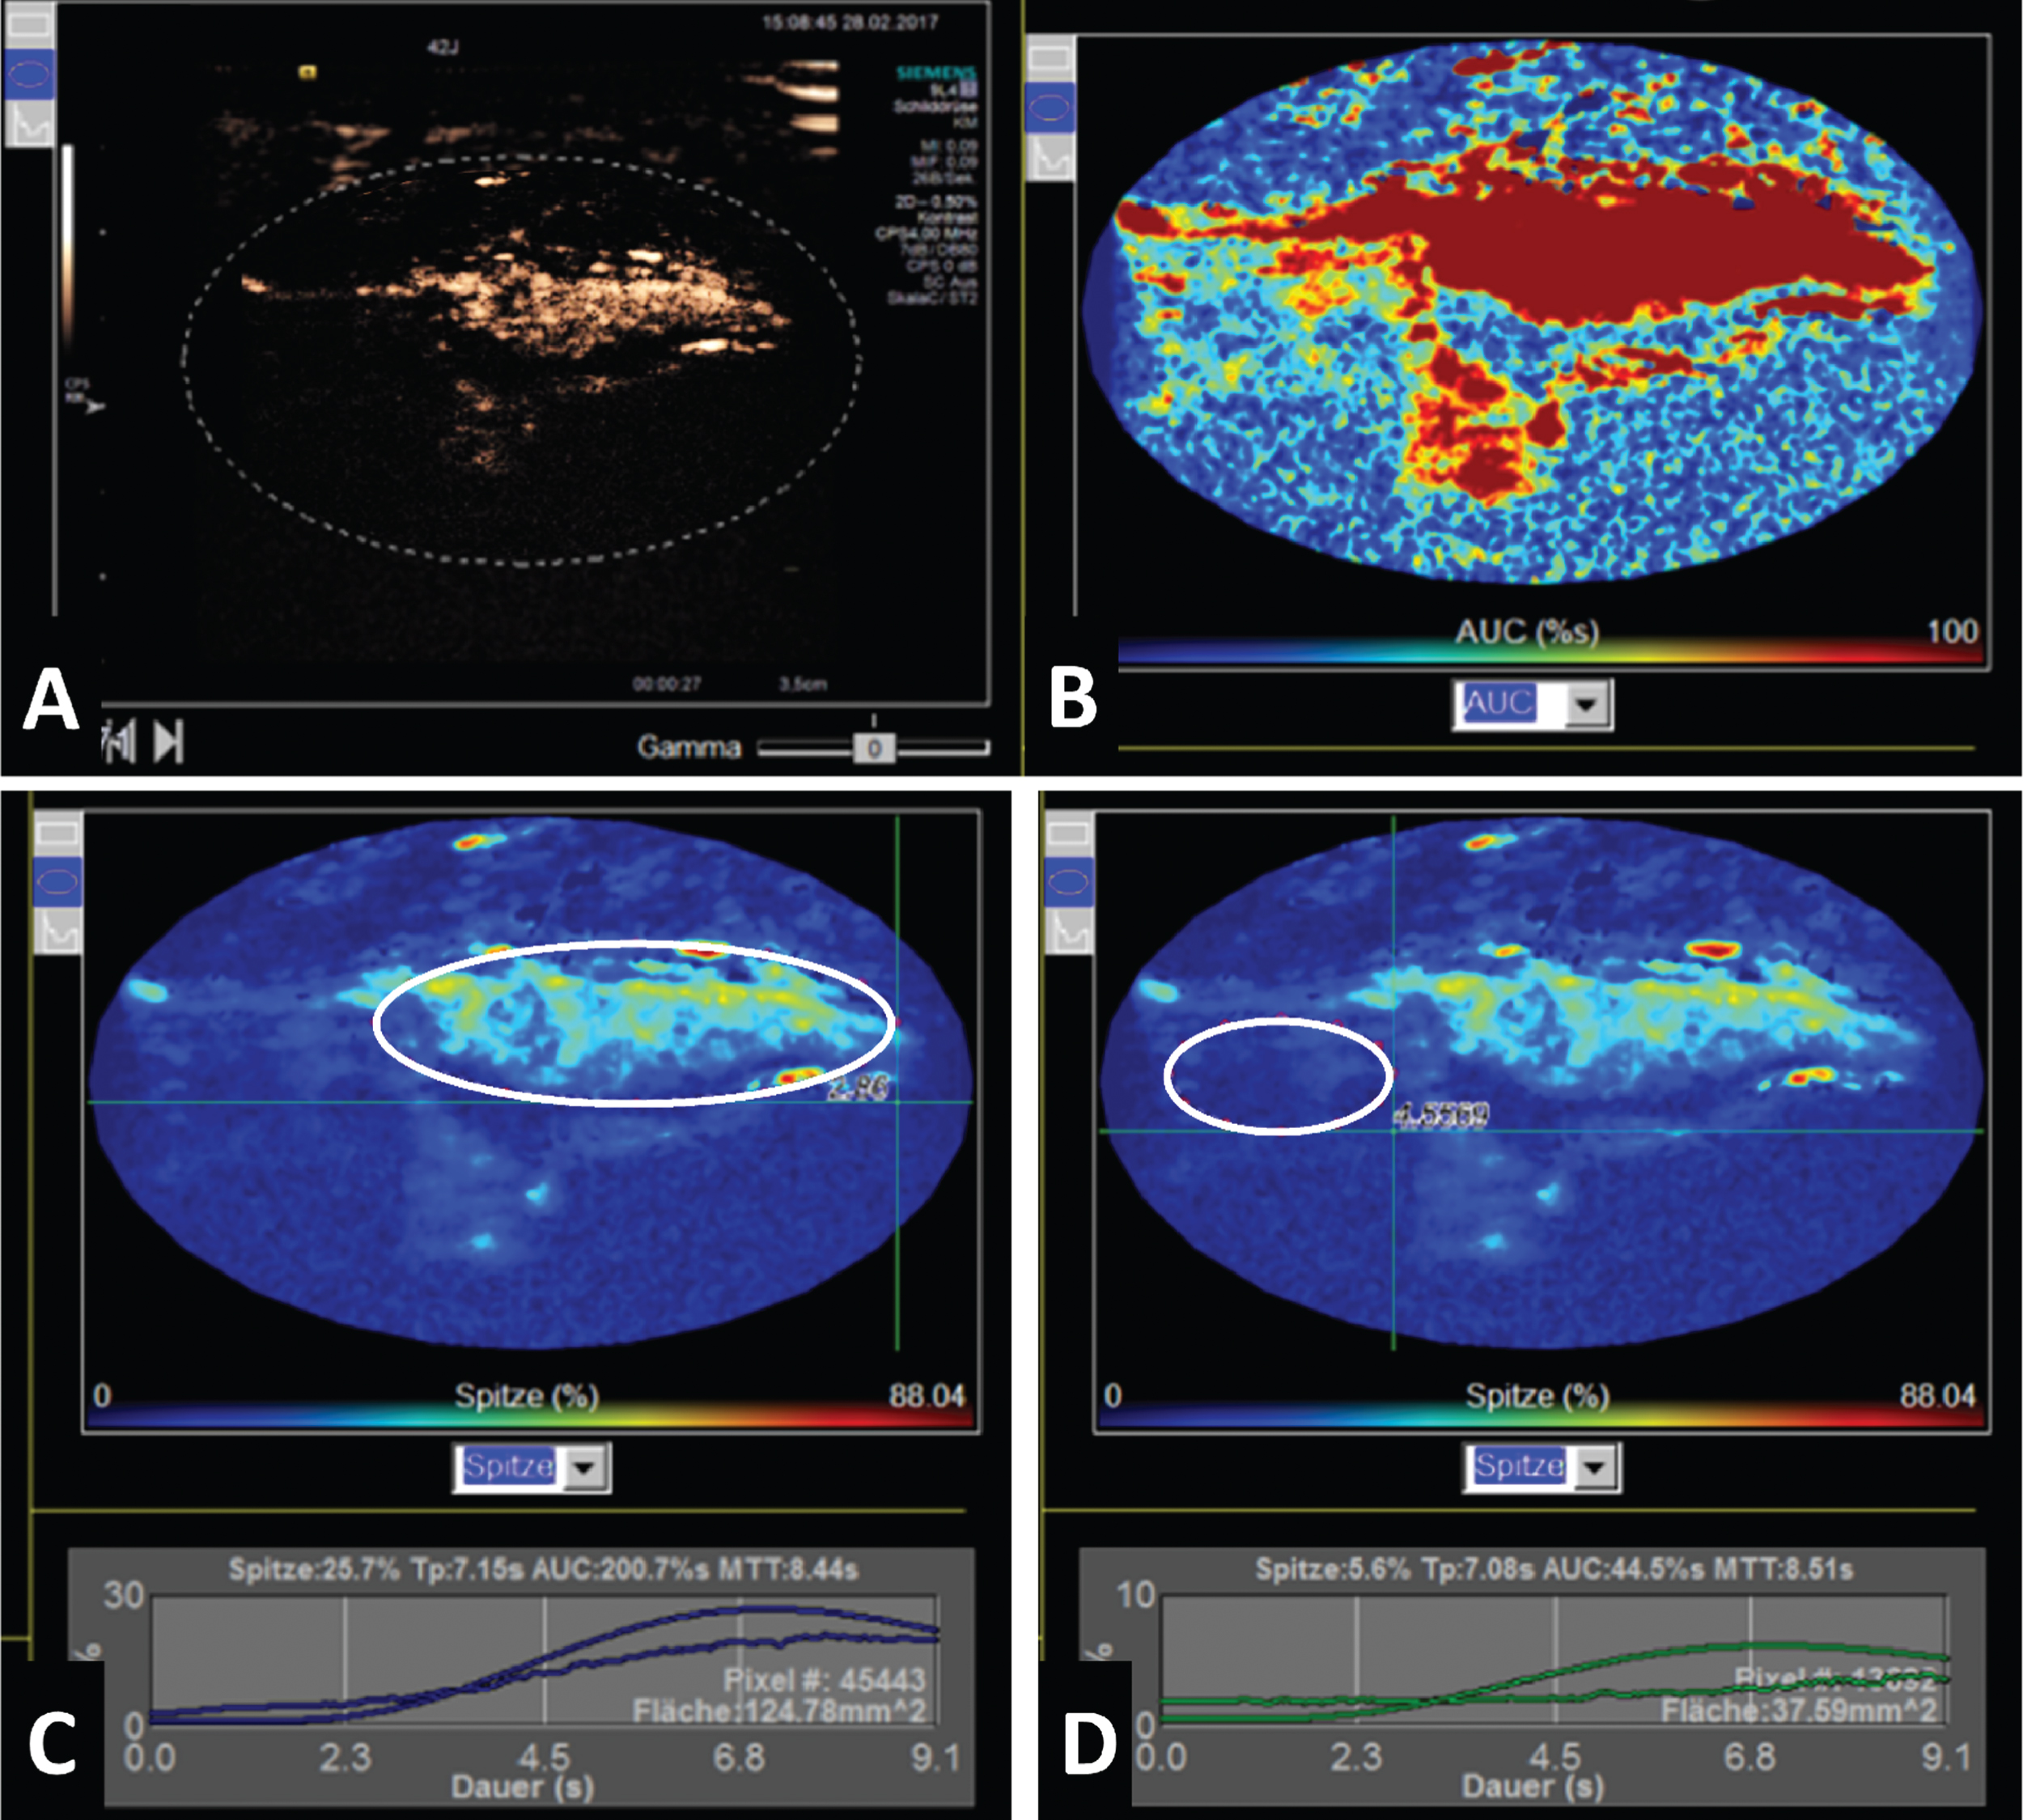
Time-intensity-curve-analysis. Time-intensity-curve-analysis of a 42-year old women with plantar fasciitis of the left heel. (A) CEUS image of the plantar fascia showing raised microcirculation. (B) False-colour-image indicating the area-under-the-curve (Red colour indicates high microcirculation). (C) TIC-Analysis of the plantar facia (white ROI, blue curve) with AUC of 200.7% s. (D) TIC-Analysis of the surrounding tissue (white ROI, green curve) with low AUC of 44.7% s.
In all cases, shear-wave elastography showed inhomogenous sonoelastographic findings within the plantar fascia. The proximal plantar fascia was harder than the distal parts in shear wave elastography. A representative example showing the shear wave elastography in terms of tissue stiffness is given in Fig. 3B.
The shear wave velocity is higher at the area of maximum pain than in other parts of the plantar fascia (5.08±2.24 m/s). This indicates a higher stiffness of the plantar fascia. A representative picture is given in Fig. 1B.
The plantar fasciitis is a common disease with a high prevalence in the general public. The use of ultrasound in the diagnosis of acute plantar fasciitis in daily practice is limited to the description of changes in B-Mode and the characterization of hyperemia of the plantar fascia in PD (Fig. 1) [8, 29]. Meta-analysis revealed that a thickening >4 mm is associated with a 100-fold higher risk for the diagnosis of an acute plantar fasciitis. The presence of a hypoechogenic fascia with oedema provides a 200-fold higher probability for the diagnosis [8]. Changings in macrovascularisation evaluated in PD were described in some cases with plantar fasciitis, but also in some healthy subjects [29]. There are, however, still gaps in current ways of diagnostics.
The use of CEUS is a promising approach in the assessment of the plantar fasciitis. One first study showed changings in the microvascularisation of the plantar fascia in patients [21].
In our study, the use of CEUS shows a clear hyperperfusion in plantar fascia compared to the surrounding tissue (Fig. 2B). Hyperperfusion can be proven in all parts of the proximal plantar fascia and is also detectable in patients who showed no macrovascularization in the PD. Thus, CEUS increases the sensitivity in the diagnosis of plantar fasciitis.
This qualitative impression can be objectivized by the TIC analysis (Fig. 3). AUC has been proven to be a good parameter for evaluation (Table 2).
TIC-Analysis (Time-intensity-curve-analysis)
After bolus injection of 1.0–2.0 ml ultrasound contrast agent cine loops were stored digitally as DICOM data and evaluated with the integrated perfusion software of the ultrasound machine (ACUSON S3000, Siemens, Erlangen, Germany). Results of area-under-the-curve, peak, mean-transit-time and time-to-peak were measured in the plantar fascia and the surrounding tissue.
Since AUC between the individual patients fluctuates in height, we calculated the ratio to the surrounding tissue. Here alterations in global perfusion following radiotherapy were considered. In our subjects, plantar fascia showed a 2.5±1.2-fold higher perfusion than surrounding tissue. Here, measurements which offer the possibility of therapy monitoring can be given to the clinician (for example, orthopaedists, radiation therapists).
Broholm et al. defined no cut off values for the diagnosis of plantar fasciitis because of the lack of an intra-subject calibration [21]. We defined the surrounding not hyperperfused tissue as the calibrator. This reduces differences caused by confounders (e.g. patients, ultrasound devices) and allows the comparison between subjects. It is necessary to check whether AUC-values or the AUC-ratio are suitable for therapy monitoring in following studies with more subjects.
One advantage of the used software is to produce false colour images which represent hyperperfused areas at a glance (Fig. 3B). In contrast to previous works [21] a time-consuming off-line analysis of DICOM data by external software can be avoided. This offers the possibility of an immediate assessment of patients.
Elastography is another way to describe changings of connective tissues and is recommended in the guidelines of EFSUMB [30, 31]. Different techniques of sonographic elastography (strain elastography and shear wave elastography) have been developed and were evaluated in different applications [23, 32–34]. Both methods can be used in the evaluation of musculoskeletal structure, but most evidence exists for the strain elastography [31]. The main disadvantage of strain elastography are difficulties in standardization. The Virtual Touch Tissue Imaging Quantification (VTIQ) shows this information within a quantitative colour-coded image showing the of shear waves velocity [30, 31]. The main advantage, however, is the visualization of a real-time colour-coded quantitative elastogram with anatomic and tissue stiffness information [31, 36].
The assessment of plantar fasciitis using strain elastography was firstly described by Wu et al. He used an off-line image software to receive a colour-histogram of the elastogram of the plantar fascia to improve the objective read-out of tissue stiffness [22]. Scofienza et al. reported a good interobserver reproducibility by using a visual ordinary scale for the estimation of colours [37].
We used the newest shear wave elastography technology, the 2D shear wave elastography (Virtual Touch Imaging Quantification (VTIQ/ARFI), Siemens, Erlangen, Germany) to generate objective parameters of the changings in plantar fasciitis. The main advantage, the visualization of a real-time colour-coded quantitative elastogram provides the opportunity to get reproducible quantitative results of tissue stiffness. To our knowledge, this is the first report of the practical application in plantar fasciitis.
In our study patients with plantar fasciitis showed a noticeable hardening of the proximal part of the plantar fascia in comparison to the more distal plantar fascia (Fig. 1B). This finding could be seen in a qualitative way by other studies using strain elastography [3, 16]. Usually this finding was concordant with the maximal heel pain and the maximal swelling of the fascia. Changings due to therapy effects have to be evaluated in further studies.
Nevertheless, this pilot study has some limitations. One limitation is the small sample size, but the aim of this study was to evaluate the feasibility of CEUS and shear wave elastography in the assessment of the plantar fasciitis. Another limitation is that high-end ultrasound devices are necessary for the use of CEUS and shear wave elastography. TIC-analysis is indeed time-consuming, but provides verifiable parameters. The examination of both heels additionally requires the application of another bolus of contrast-agent after a wash-out-phase of 30 minutes. The implementation in daily practice is difficult.
In conclusion, the use of the modern ultrasound techniques CEUS and shear waves elastography shows a new diagnostic tool in the assessment of the plantar fasciitis. The characterization of typical sonographic features for a positive response to therapy, however, has to be determined in future studies. To our opinion, changes in the area-under-the-curve (AUC), peak and shear wave elastography are potential prognostic markers for therapy evaluation.