
Abstract
OBJECTIVES:
To investigate the value of dynamic contrast enhanced ultrasound (D-CEUS) in monitoring the chemoradiotherapy (CRT) therapeutic response of local advanced pancreatic ductal adenocarcinoma (LAPC).
PATIENTS AND METHODS:
From October 2017 to December 2018, 11 patients diagnosed as LAPC were included (7 men, 4 women; mean age: 61.1±8.6 years). The algorithm of CRT was as following: the radiotherapy dose was 50.4 Gy/28Fx with S-1 40 mg bid orally taken in radiotherapy day. Conventional ultrasound scan and CEUS were performed before and 4 weeks after CRT. All ultrasound examinations were performed by an ACUSON Oxana 2 ultrasound equipment (Siemens Medical Solutions, Germany) with a C 6-1 convex array transducer (1–6 MHz). Time intensity curves (TICs) were generated in the region of interests (ROIs) both in LAPC lesions and in its surrounding pancreas parenchyma by SonoLiver software (TOMTEC Imaging Systems). Quantitative perfusion parameters including maximum intensity (MI), rise time (RT), mean transit time (mTT) and time to peak (TTP) were analyzed and compared before and after CRT.
RESULTS:
No significant difference could be found by conventional B mode ultrasound scan after CRT. TICs of CEUS showed lower ascending and descending slopes rate after CRT. Among all perfusion quantitative parameters, MI decreased significantly after CRT (42.1±18.8% vs 27.8±17.2%, P < 0.05).
CONCLUSIONS:
Depending on its unique advantages as non-radiation, effective and convenient, D-CEUS analysis and quantitative parameters, particularly MI, has potential application value in following up of the CRT treatment response in LAPC patients.
Keywords
Introduction
Pancreatic ductal adenocarcinoma (PDAC) is a highly aggressive pancreatic malignant tumor with an overall 5-year survival rate less than 8% [1, 2]. Currently, surgical resection is regarded as the only radical therapy for PDAC patients [1]. However, about 80% PDAC patients were not amenable to surgery at the time of diagnosis, because of known metastases (40%) or locally advanced disease (40%) [3]. According to updated NCCN (National Comprehensive Cancer Network) Clinical Practice Guidelines in Oncology [4], locally advanced PDAC (LAPC) was defined as cancer spread outside the pancreas to nearby blood vessels or other tissues which could not be treated by surgery. Neoadjuvant therapy including systematic chemotherapy and chemoradiotherapy (CRT) have been applied to the treatment of LAPC. CRT was proved to be an effective treatment in improving patients’ life quality by controlling local tumor progression [4]. Meanwhile early identification of patients who are not effectively responding to CRT would not only spare them from the high mortality and costs associated with treatments, but also enable oncologists to tailor therapeutic strategies to maximize tumor response [5].
Various imaging methods have been used during the following up of CRT therapeutic response, including B mode ultrasound (BMUS) [6], endoscopic ultrasound (EUS) [7], contrast-enhanced computed tomography (CE-CT) [8], contrast-enhanced magnetic resonance imaging (CE-MRI) [9] and positron emission tomography-computed tomography (PET-CT) [10, 11]. BMUS is the first-line imaging method to detect and evaluate pancreatic lesions. However, it is not sensitive to evaluate the microvascular perfusion changes of tumor after treatment. Currently, the worldwide accepted imaging method to evaluate treatment efficacy to CRT is response evaluation criteria in solid tumor (RECIST) criteria [12] based on anatomical lesions size changes measured by CE-CT and CE-MRI. However, CE-CT is of limited value in differentiating residual tumor from fibro inflammatory tissue replacement secondary to treatment and also has potential risk of radiation exposure [13]. CE-MRI could monitor the treatment response with high resolution images, however it also has limitations such as relatively complicated procedure, high cost and long examination time [14]. Meanwhile, RECIST evaluation standard only evaluate the change of tumor size, which could not sensitively reflect the microvascular perfusion changes of tumor after treatment [15]. Given the increasing role played by CRT in the clinical therapeutic management of LAPC, it is essential to have an efficient, reliable and reproducible imaging method to follow up. Up till now, there is no efficient, convenient or real time imaging method during the follow up of CRT treatment.
Contrast enhanced ultrasound (CEUS) was widely used in evaluation of microvascular perfusion of tumors [16–19]. Dynamic CEUS (D-CEUS) with time intensity curves (TICs) and quantitative analysis were capable of providing quantitative and real time assessments of tumor blood perfusion in liver, kidney, breast and thyroid lesions [20–28]. Some of perfusion parameters, such as rise time (RT), peak enhancement (PE) were proved to be effective for evaluating the angiogenesis perfusion of HCC (hepatocellular carcinoma), to predict prognosis of HCC after radiofrequency ablation or transcatheter arterial chemoembolization therapy (TACE) [19, 29–31]. In addition, D-CEUS TICs and parameters generated by using SonoVue (Bracco, Italy) can also be used to follow up the microvascularization changes after the treatment [32–34]. Recently, D-CEUS and quantitative perfusion analysis were also proved to be useful in making preoperative differential diagnosis of solid and cystic pancreatic lesions [17, 35]. However, no results have been published on the use of D-CEUS and quantitative analysis during follow up of CRT treatment of pancreatic tumors.
The aim of our study is to investigate the value of D-CEUS and quantitative analysis in monitoring the CRT therapeutic effect of LAPC.
Patients and methods
Patients
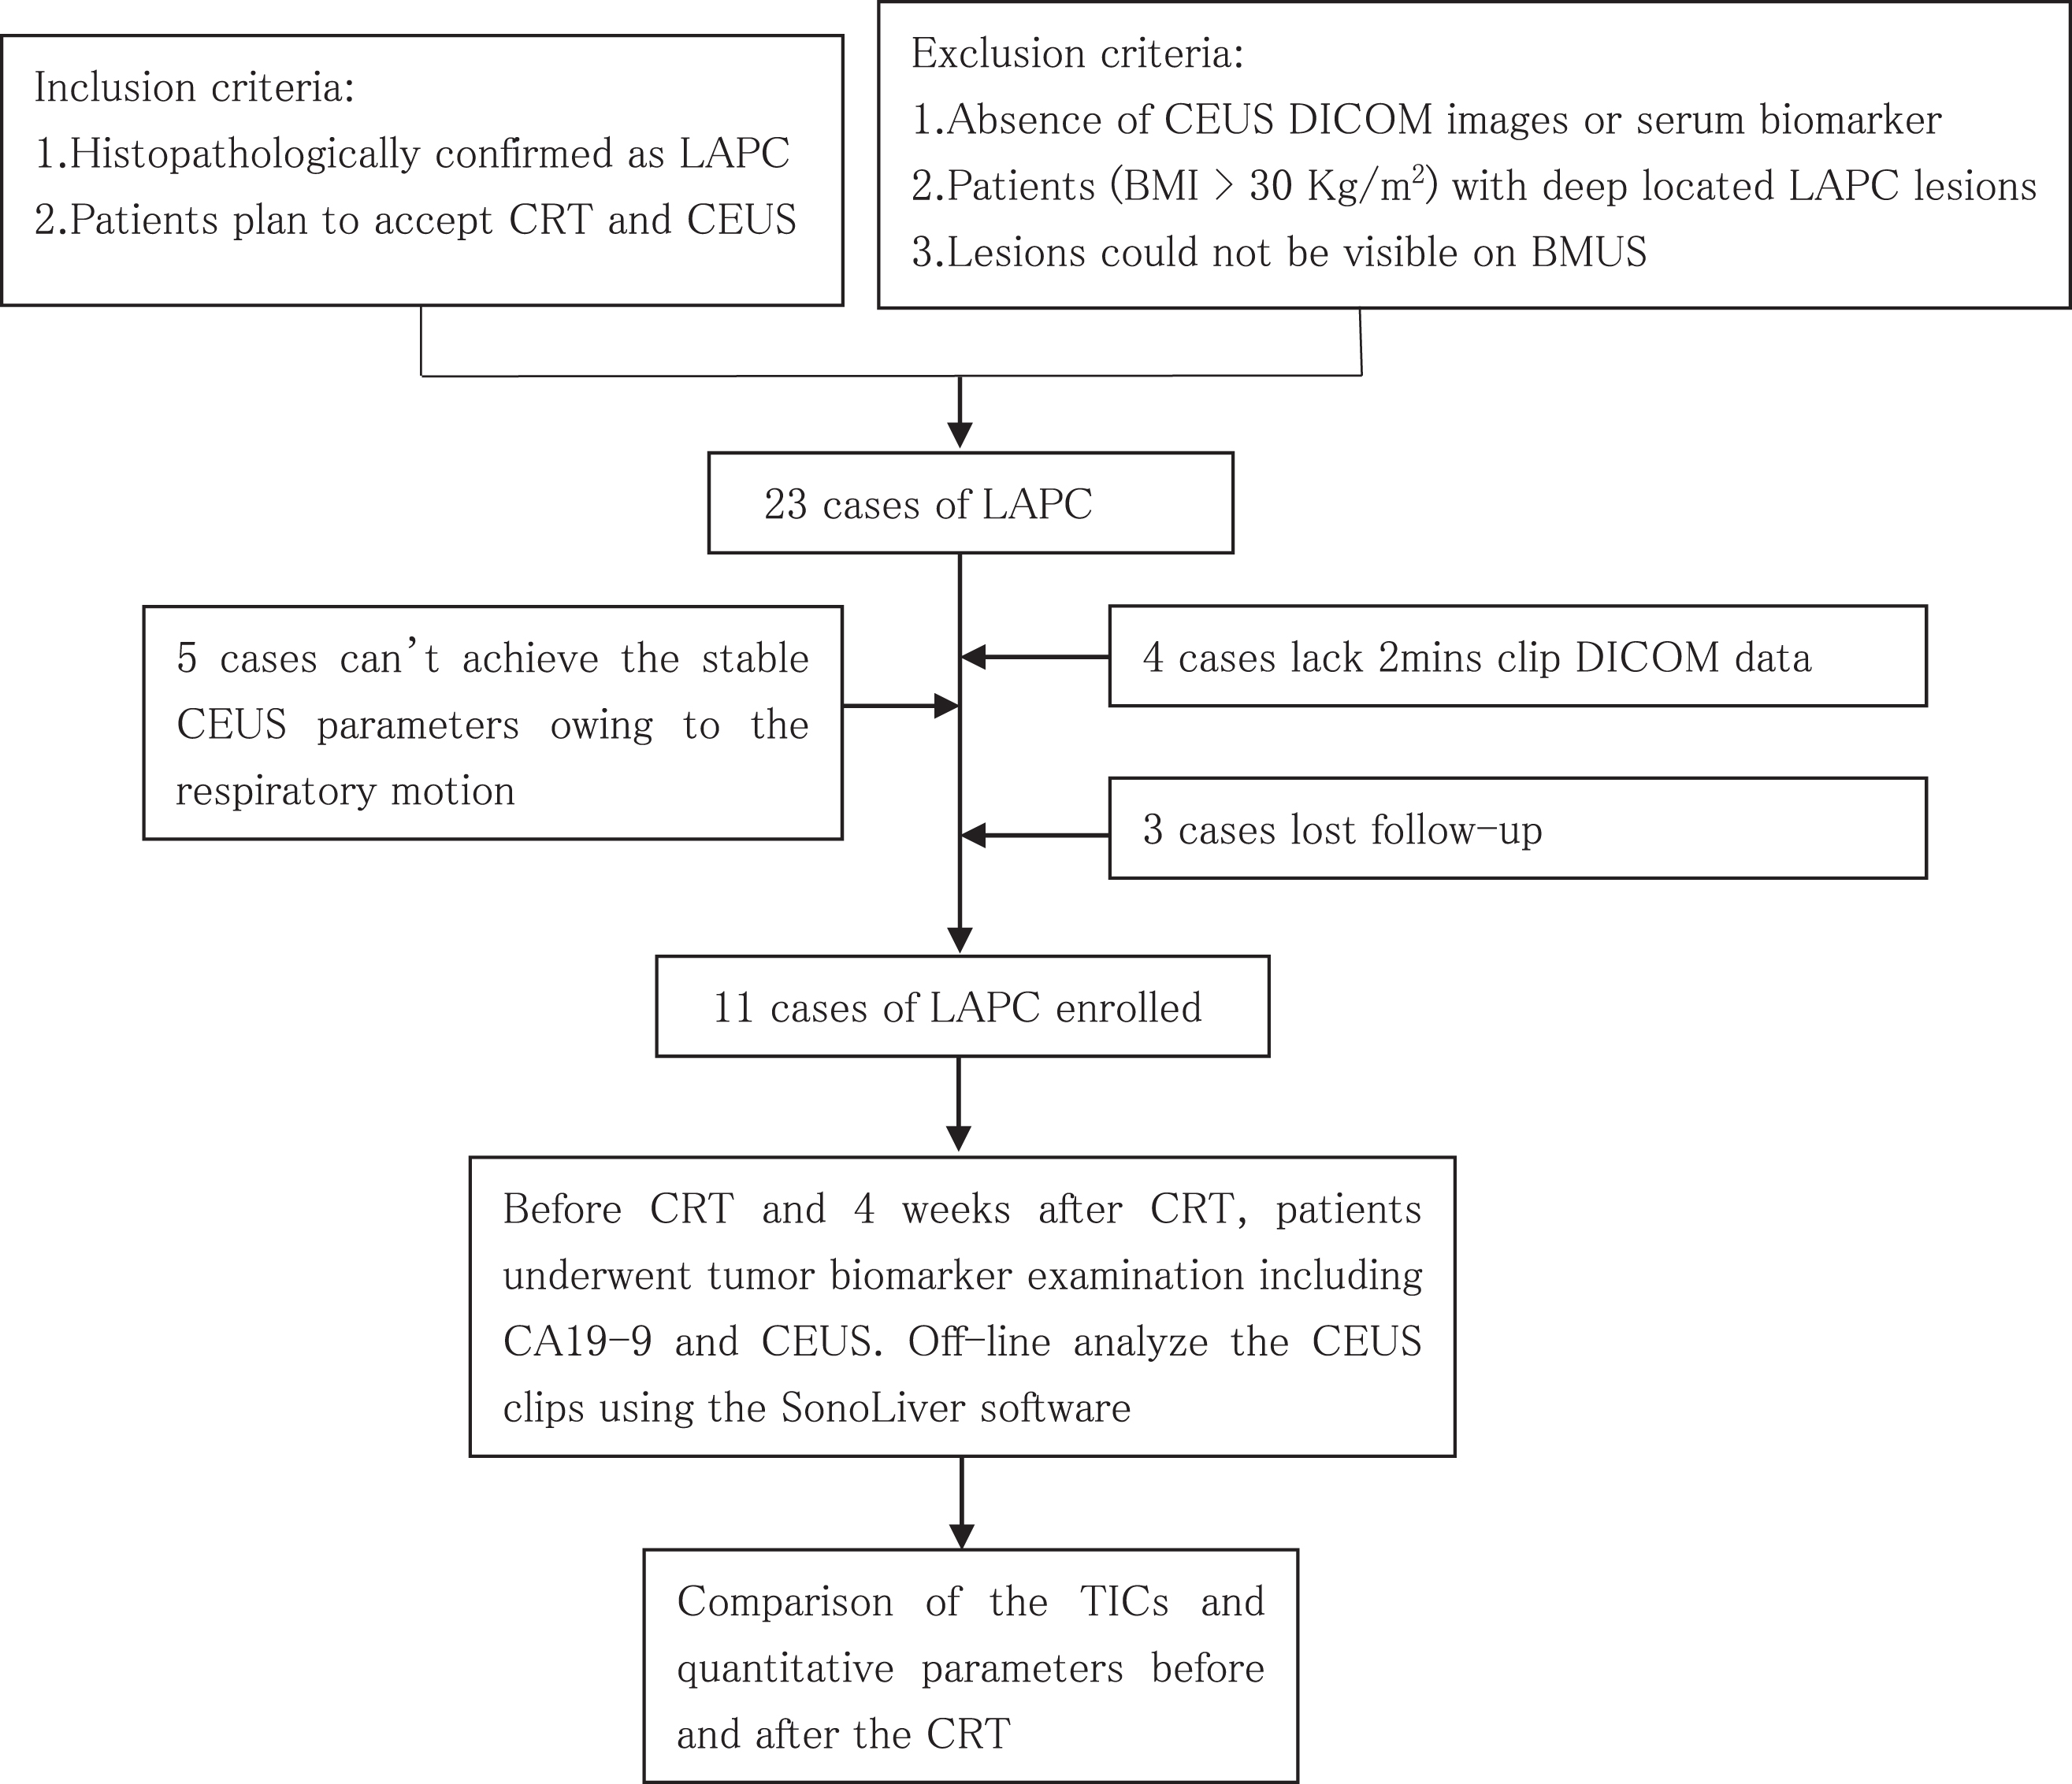
From October 2017 to December 2018, patients diagnosed as LAPC were prospectively included. The inclusion criteria were: (1) Histologically confirmed PDAC; (2) Imaging methods (CT/MRI) classified as LAPC; (3) Patients planned to accept CRT treatment; (4) Patients will accept CEUS examinations before and 4 weeks after CRT. The exclusion criteria were: (1) Patients with progressive disease or other complicated complications or patients refusing CRT; (2) Patients with persistence of metastasis at final CT/MRI; (3) Patients without serum biomarker or CEUS DICOM images; (4) Patients (BMI > 30 Kg/m2) with deep located LAPC lesions; (5) LAPC lesions could not be visible stably on BMUS.
This prospective study was approved by the institutional review board of our institution (The approval number: B2017-105 R). Written Informed consent were signed before CEUS examinations. The procedure was in accordance with the Declaration of Helsinki.
Research protocol
Once patients were enrolled, BMUS, CEUS and blood biomarker CA19-9 examination were performed 1 day before and 4 weeks after CRT. BMUS and CEUS data were recorded in JPEG and DICOM format. Then the contrast enhancement clips were analyzed and compared using the SonoLiver software offline by two physicians with more than 10 years of experience in abdominal CEUS. TICs and perfusion parameters were generated afterwards. The comparison of the CA19-9 level, size of lesions, TICs and parameters between before and after the CRT were performed (Fig. 1).
Research Protocol.
All patients were examined in a supine position. All examinations were performed by an ACUSON Oxana 2 (Siemens, Germany) with a C 6-1 convex array transducer (1–6 MHz). Before CEUS, the size, margin, shape of lesions and the existence of main pancreatic duct dilatation were observed by BMUS. Color Doppler Flow Imaging (CDFI) was used to detect the blood flow signals inner the lesions. After conventional BMUS, a 2.0 ml bolus of ultrasound contrast agent (SonoVue, Bracco, Italy) was injected via left antecubital vein and immediately followed by a 5 ml saline flush. The enhancement pattern, enhancement intensity, existence of necrosis inner the lesions, possible invasion of lesions to adjacent vessels were observed during the CEUS. Duration CEUS examination, patients were asked to breath slowly. A clip at least 2 minutes including the lesion wash in and wash out contrast enhancement process was recorded for each patient.
D-CEUS were further analyzed using SonoLiver 1.0 software (TomTec Imaging Systems). During the post-processing analysis, 2 regions of interest (ROIs) were placed both inner the lesions and in its surrounding pancreatic parenchyma, with the same depth, same size and same shape. Large vessels or necrosis area were avoided (Fig. 2c). The motion compensation function was used to reduce the breath motion artifact. TICs of CEUS were then generated (Fig. 2d, e). Only when the quality of fit (QOF)>75 %, the analysis was considered valid. D-CEUS quantitative parameters were created after that, including: MI (maximum intensity, maximum contrast enhancement within the ROI), RT (rise time, time from injection of contrast agent to beginning of enhancement), TTP (time to peak, time from injection until peak enhancement of the lesions after injection of contrast agent), mTT (mean transit time, time from injection of contrast agent to peak intensity then descend to 50% MI which relates to blood velocity). The TICs of D-CEUS and related quantitative perfusion parameters were compared before and 4 weeks after CRT.
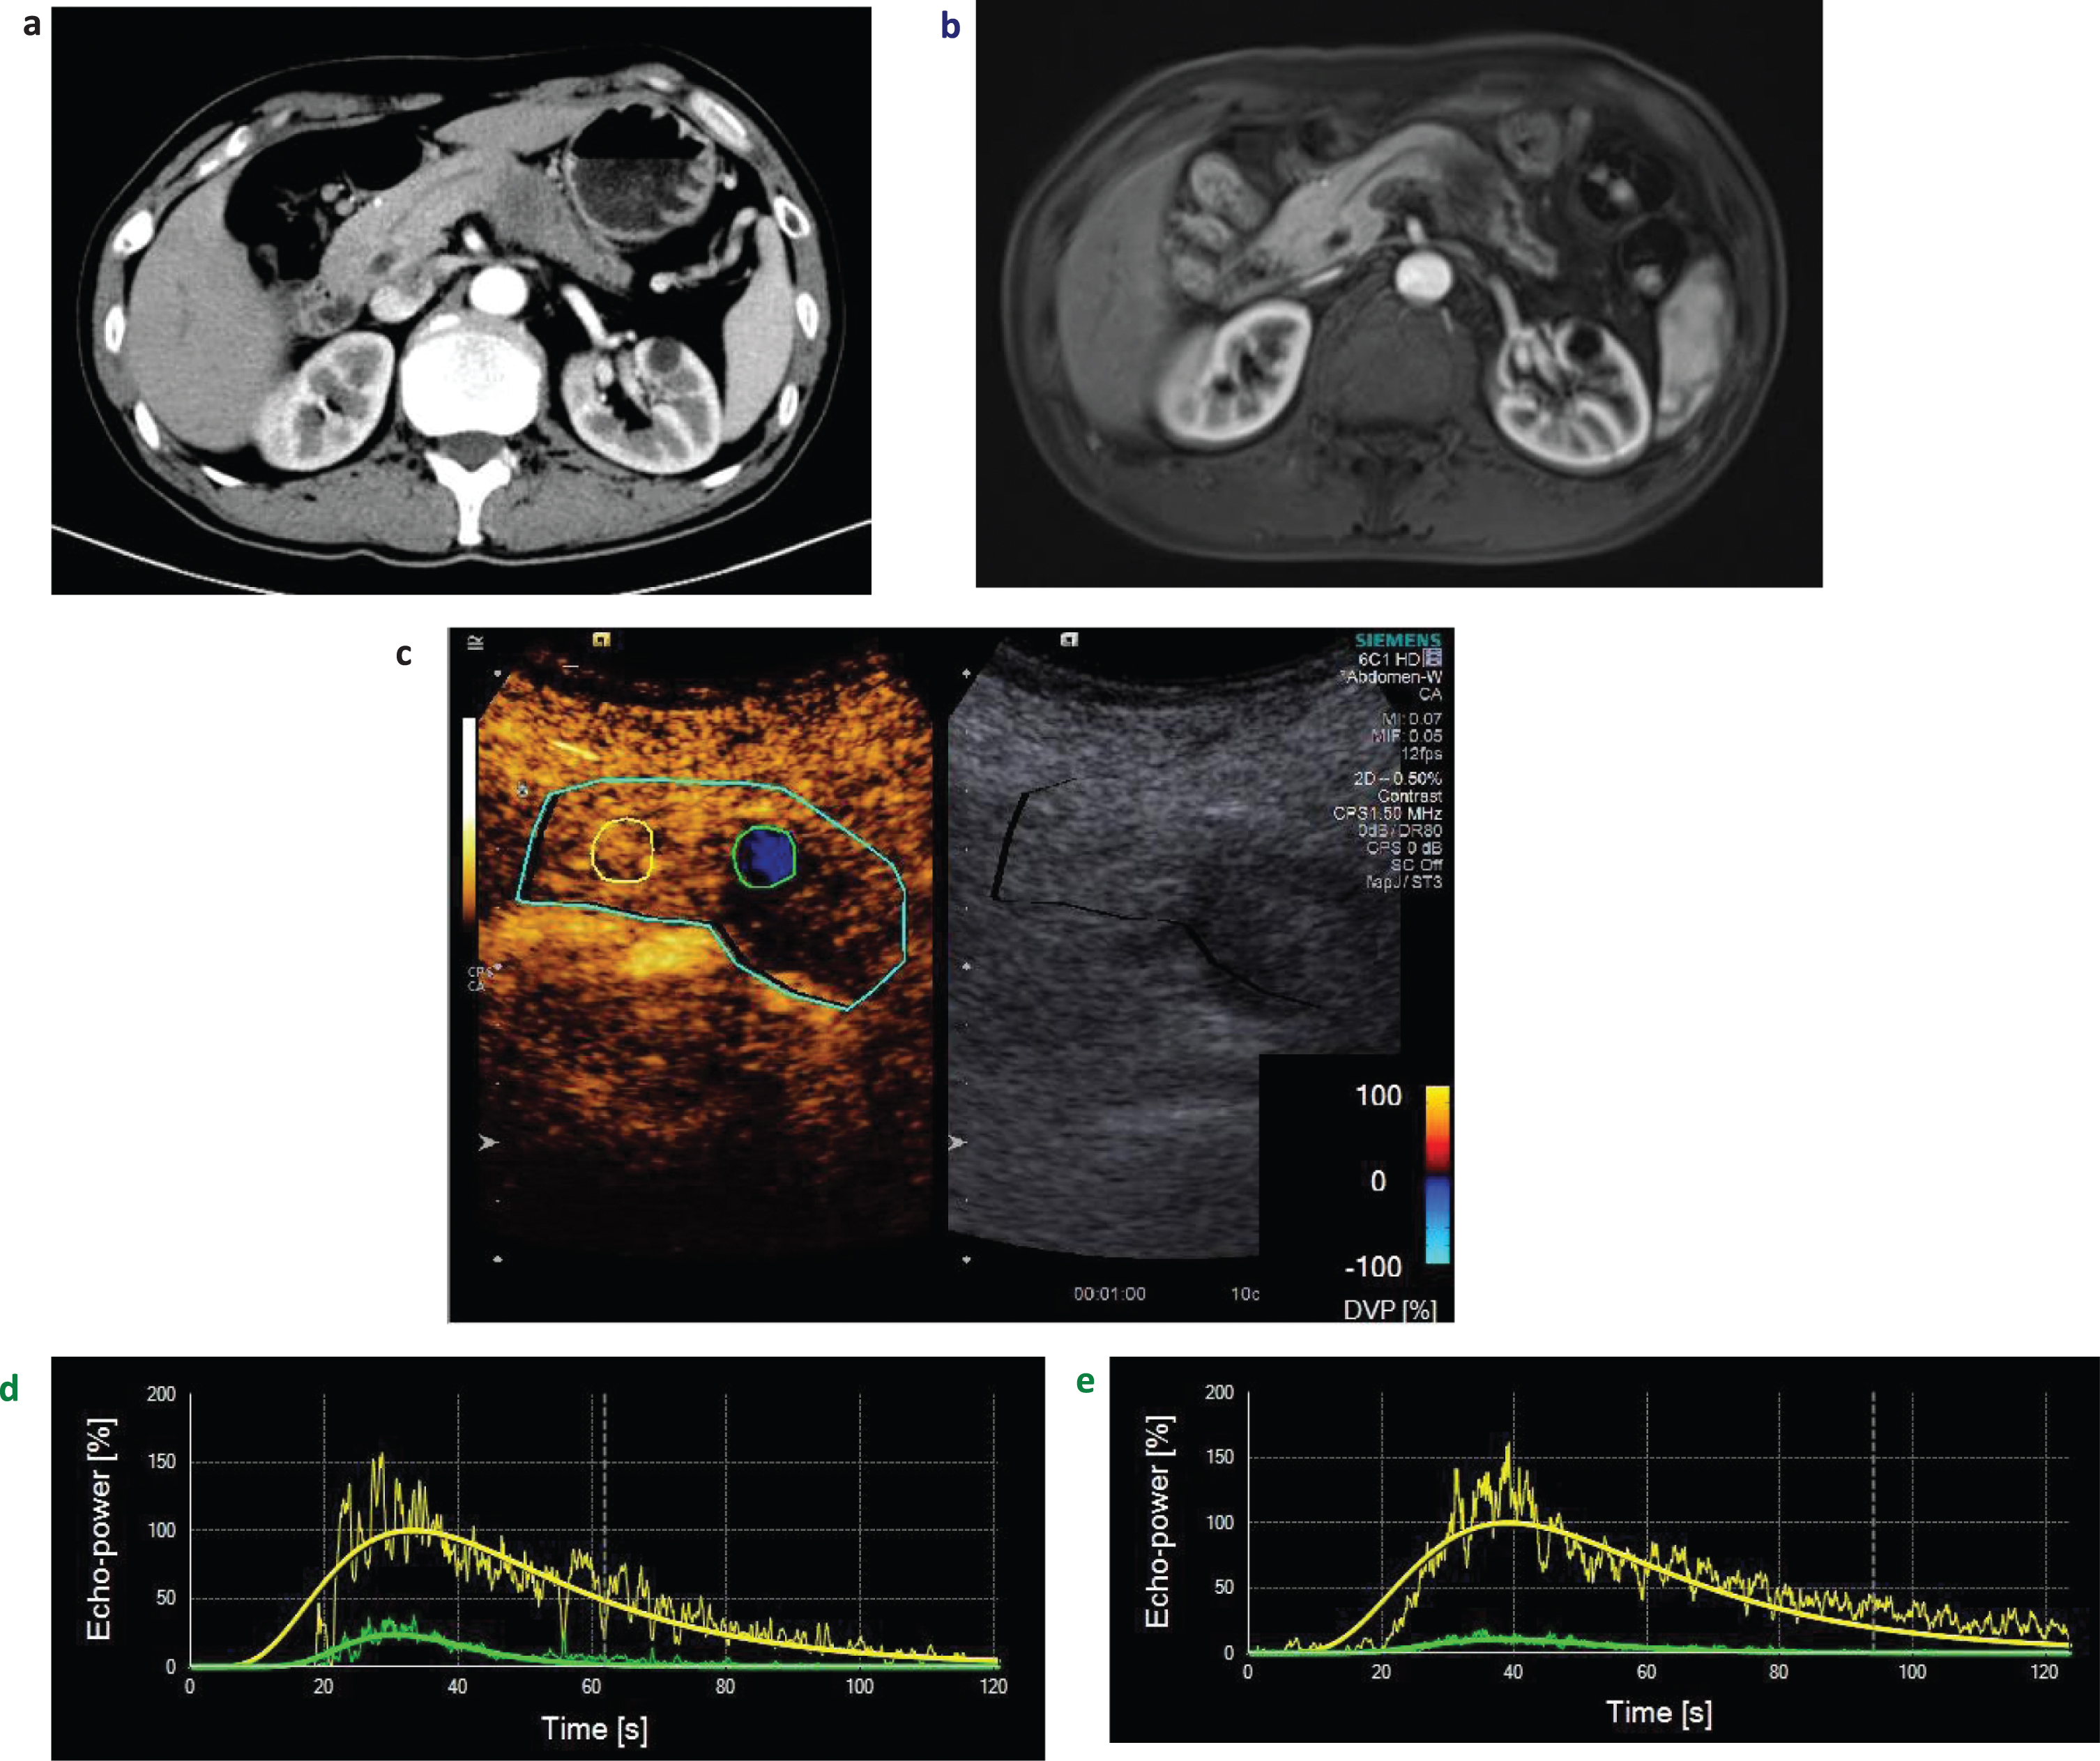
A man aged 56 years diagnosed as local advanced pancreatic ductal adenocarcinoma (LAPC) on the tail of pancreas with computed tomography (CT) (a) and magnetic resonance imaging (MRI) (b). On dynamic contrast enhanced ultrasound (D-CEUS) analysis, green circle region of interest (ROI) represented the lesion, and yellow circle ROI represented the surrounding normal pancreatic parenchyma. These two ROIs were placed at same depth, with the same size and shape (c). Set the normal pancreas parenchyma enhancement intensity as the default 100, LAPC lesion enhancement intensity compared with the normal pancreas parenchyma was lower at all phases. The slope rate of ascending and descending curve of lesion before chemoradiotherapy (CRT) (d) was higher than the TIC of lesions after CRT (e).
Before CRT, precise radiotherapy plans were made by physicians according to the lesions’ sizes and locations. Radiotherapy target areas were composed of the whole lesions and surrounding lymph nodes. Intensity modulated radiation therapy was applied to all patients. During the radiotherapy courses, the dose was 50.4 Gy delivered in 28 fractions with S-1 40 mg bid orally taken in radiotherapy day [36].
Statistical analysis
Descriptive statistics (proportions, means, standard deviation) were calculated for patient characteristics and numeric continuous data. The continuous data were evaluated and compared by paired-sample two-sided t test. Statistical analysis was performed using the software SPSS Statistics 23.0 (SPSS, Chicago, IL). Interobserver reliability was assessed by weighted kappa statistics. The reliability was graded as follows: no agreement (0), poor (0–0.20), fair (0.21–0.40), moderate (0.41–0.60), substantial (0.61–0.80) and perfect reliability (0.81–1). P value < 0.05 were considered as significant.
Results
Clinical and general pathologic features
23 patients diagnosed as LAPC were initially enrolled. 5 cases were excluded owing to the unsatisfying respiratory motion during CEUS examinations, 4 cases were excluded because lack of clips DICOM data and 3 cases were excluded for lost follow-up. Finally, 11 patients were included (7 males and 4 females, mean age 61.1±8.6 years, age range: 46–71 years). Diagnosis of 10 patients were confirmed by endoscopic ultrasound guided fine-needle aspiration (EUS – FNA) and histological analysis. One patient was confirmed by alleviative operation. Four weeks after CRT, CA19-9 was remarkably decreased (177.2±59.9 vs 77.1±22.0) U/ml (P < 0.05) (Table 1).
Baseline characteristic of patients
Baseline characteristic of patients
CT: Celiac trunk; SMA: Superior Mesenteric Artery; SMV: Superior Mesenteric Vein; PV: Portal Vein; SV: Spleen Vein; SA: Spleen Artery; HA: Hepatic Artery; LRA: Left Renal Artery; LN:lymphonode.
Before CRT, all 11 LAPC lesions were solid hypoechoic lesions on conventional BMUS with ill-defined margins. Five lesions were located at the head of pancreas, 1 at unciform, 1 at neck of pancreas, 2 at body of pancreas and 2 at the tail of pancreas. Six of them showed the dilated main pancreatic duct (range 3–8 mm). No remarkable changes were found on BMUS after CRT. The sizes of lesions were 37.3±3.2 mm (range: 19–51 mm) vs 35.1±3.8 mm (range: 16–55 mm) respectively (P > 0.05). CDFI could not detect blood flow signals within all 11 LAPC lesions (Table 1). After administration of ultrasound contrast agents, CEUS showed real time perfusion in the pancreas. On CEUS, while comparing to the surrounding pancreatic parenchyma, all LAPC lesions showed heterogeneously hypoenhancement during arterial phase, venous phase and late phase of CEUS.
D-CEUS TICs and quantitative analysis before and after CRT
CEUS perfusion images were then converted into TICs. Before the CRT, the slope rate of ascending curve was rather moderate, and time to peak intensity was shorter than the parenchyma. Then the curve gradually descended to baseline. Four weeks after CRT, LAPC lesions showed delayed and slightly enhancement in the TICs. The slope rate of ascending curve and descending curve were lower remarkably (Fig. 2e). QOF of quantitative analysis of all LAPC lesions exceeded 75%, which demonstrating the results were reliable. Setting the surrounding normal pancreas parenchyma enhancement intensity as 100%, the MI of PDAC were significantly decreased from 42.1±18.8% (ranging 15.6 –79%) to 27.8±17.2% (ranging 5–67.4%) (P < 0.05). However, RT, TTP and mTT of lesions became longer than before, but no significance was found (Table 2) (Fig. 3).
Comparison of D-CEUS perfusion quantitative parameters before and after CRT
Comparison of D-CEUS perfusion quantitative parameters before and after CRT
MI: Maximum Intensity; TTP: Time To Peak; RT: Rise Time; mTT: mean Transit Time. TTP-P:Time To Peak of Pancreas parenchyma; RT-P: Rise Time of Pancreas parenchyma; mTT-P: mean Transit Time of Pancreas parenchyma; CRT: chemoradiotherapy; D-CEUS: dynamic contrast enhanced ultrasound.
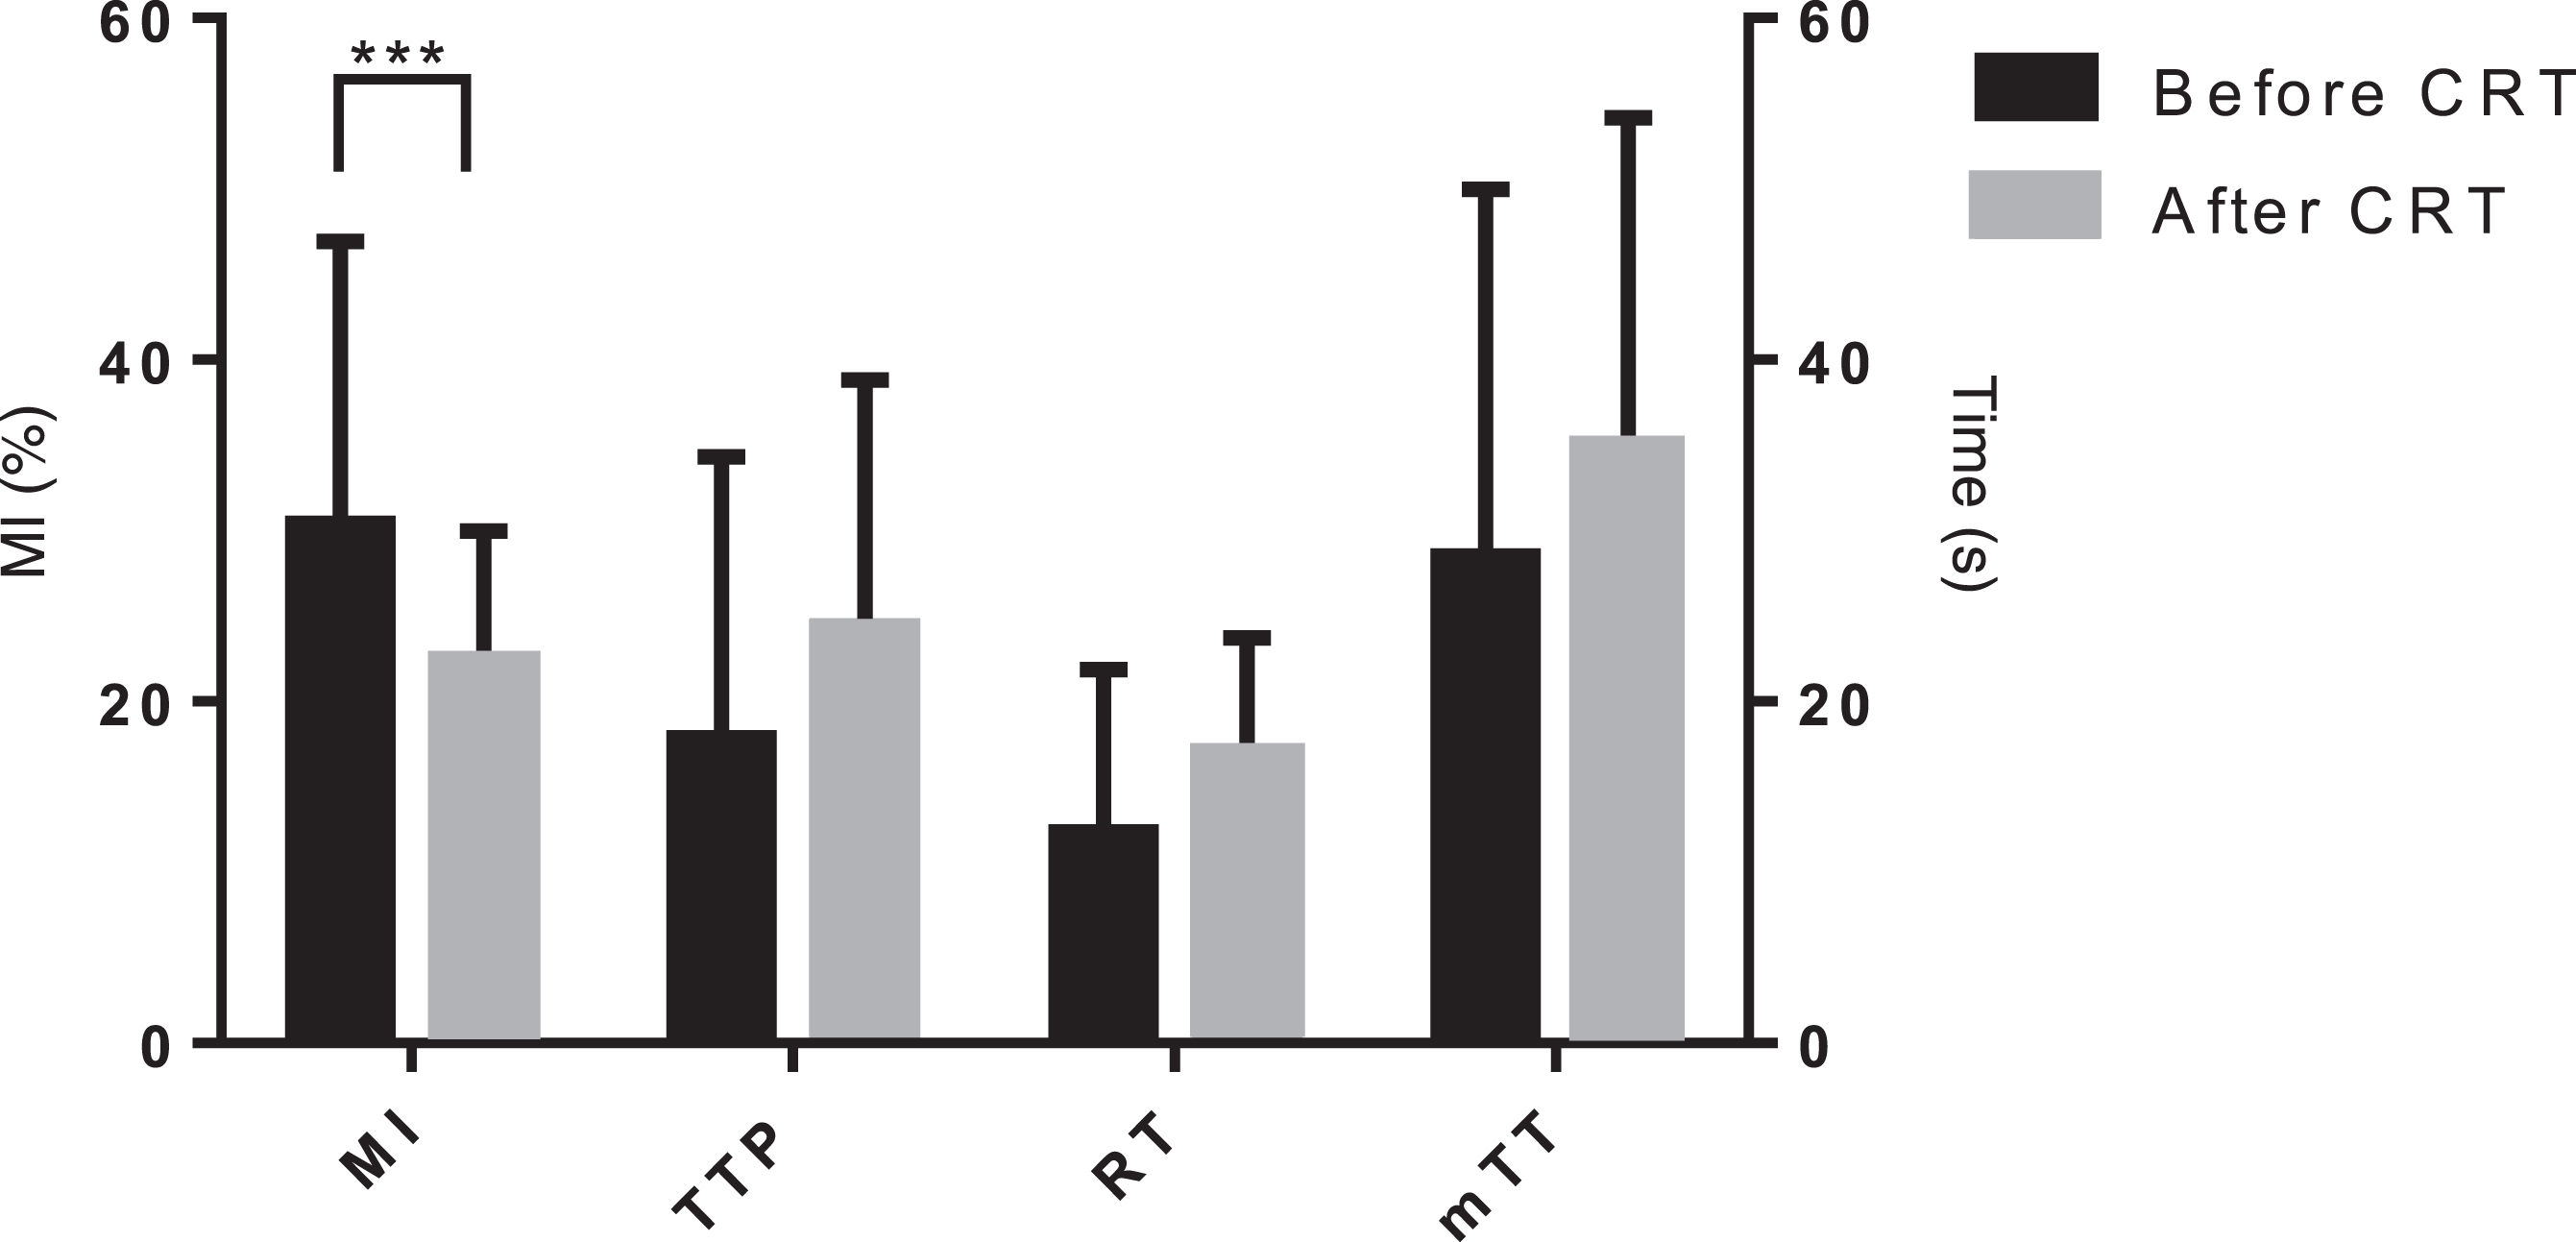
Changes of D-CEUS quantitative parameters before and after CRT. ***: P < 0.05. MI: Maximum Intensity; TTP: Time To Peak; RT: Rise Time; mTT: mean Transit Time, CRT: chemoradiotherapy; D-CEUS: dynamic contrast enhanced ultrasound.
The two observers in our study showed outstanding interobserver reliability for MI (k = 0.837) and RT (k = 0.735) and TTP (k = 0.782), mTT (k = 0.724).
Discussion
Previously D-CEUS has been applied in making differential diagnosis between benign and malignant pancreas tumors [37, 38], with unique advantages such as real time observation, objective evaluation and no radiation. How to effectively evaluate the treatment response of PDAC during neoadjuvant therapy is still a clinical challenge [15, 39]. Tumor prognosis is proved to associate with microvascular perfusion and biological aggressiveness of the tumor rather than residual tumor volume after therapy [11]. In our study, due to the routine chemotherapy before CRT, all lesions showed slow wash in and fast wash out enhancement patterns and nearly echoless at the 2 minute. In results, we captured 2 minutes clips of contrast enhancement. D-CEUS with quantitative analysis was performed to evaluate the microvascular perfusion of LAPC patients to assess CRT treatment response.
TICs and quantitative parameters (including MI, RT, TTP and mTT) were calculated automatically based on the CEUS enhancement clips of PDAC lesions. The interobserver reliability of the parameters measurement in the ROI was excellent. Among all quantitative indexes, MI decreased remarkably. After the CRT, the slope rate of ascending and descending curve became lower. Enhancement pattern related to the micro-vascularization of lesions, which is part of an important pathophysiological process correlating with neoangiogenesis, provided a distinct advantage for the detection of response to CRT. However, no significant change could be found on BMUS or CDFI after CRT. The advantage of D-CEUS and quantitative imaging is that it allows sensitively depicting of early microvascular perfusion changes of the lesions.
CEUS with TIC represent of the lesions’ real time wash in and wash out process after intravenous administration of contrast agent. Among all D-CEUS quantitative parameters, MI decreased significantly and may be proved to be useful to evaluate the treatment response. Previous studies reported that MI based on the accumulation of microbubble agent in the ROI was related to the microvascular density and can be used as an indicator of tumor micro-vascularity [22, 24]. In our study, significant decrease of MI value was detected 4 weeks after CRT. At this time, the micro-vascularization was suppressed and the blood perfusion of lesions was decreased accordingly. CRT may reduce the blood flow of lesions which resulting in necrotic, fibrous, or inflammatory changes in tumors. Other studies demonstrate that PDAC poor response to neoadjuvant chemotherapy is due to that chemotherapeutic agents are poorly delivered to PDAC tissues because blood vessels are compressed by dense stromal matrix due to the desmoplastic reaction [8]. Some studies indicated that an effective therapy may result in reduced interstitial pressure and consequentially increased perfusion [8, 40], which were discordant with our findings. No significant changes could be detected among RT, TTP and mTT after CRT. Many factors influenced the time-based perfusion parameters, such as rich micro-vessels net, arteriovenous shunts and fibrosis in the lesions [22]. Previous studies showed that all the perfusion parameters in the center of the lesions differed significantly from those in the margins, but all parameters had a high variance [41, 42]. In our study, the different location of ROIs not covering the whole lesions before and after CRT may explained our results. It was reported that TTP and mTT were influenced by the contrast agent kinetics, and could also be influenced by the speed of contrast agents injection, since mTT corresponds to the wash out time of contrast agent [43]. Tumors are highly heterogeneous and prone to 2D sampling errors due to plane-to-plane perfusion variation. Consequently, imaging the exact same plane in longitudinal clinical applications is challenging and can yield biased quantitative results [44]. Three dimensional CEUS imaging techniques have been proposed to overcome sampling errors in tumors by imaging the tumor as a whole, providing more spatial information compared with two-dimensional images [45].
Blood CA 19-9 level is currently the most widely used serum biomarker in clinic for the diagnosis and evaluation of response to treatment of pancreatic cancer [46]. In our study, CA19-9 was significantly decreased after CRT.
The small number of patients included is the main limitation of our study. Larger samples should be enrolled to further improve and confirm the results in our future study. Another limitation was the record of short clips, which might not allow observation of the late wash out of lesions. In our future study, clips longer than 3 minutes will be recorded and analyzed.
In conclusion, D-CEUS with quantitative perfusion analysis parameters, particularly MI, might be a potential imaging tool to make real time and precise evaluation of the microvascular perfusion changes after CRT in LAPC, which allows accurate assessment of chemoradiotherapy treatment.
Funding
Supported by National Natural Science Foundation of China (Grant No. 81571676, No.81501471); Shanghai Municipal Science and Technology Medical Guidance Project (Grant No. 18411967200); Shanghai Municipal Science and Technology Innovation Action Plan Clinical Medicine Project (Grant No. 17411954200); Shanghai Municipal Health and Family Planning Commission Research Project (Grant No. 201840215); Chinese National key research and development program (Grant NO.2017YFC0112100).