






Abstract
BACKGROUND:
Circulating red blood cells (RBCs) undergo aging, a fundamental physiological phenomenon that regulates their turnover. Objective: Understanding the role of Aβ in the cross talk between cell signalling pathways and modulation of the cell structural and biomechanical properties occurring in RBCs during aging.
METHODS:
The morphological pattern has been monitored using Atomic Force Microscopy (AFM) imaging and measuring the RBCs’ plasma membrane roughness employed as a morphological parameter capable to provide information on the structure and integrity of the membrane-skeleton.
RESULTS:
We show that treatment with Aβ accelerates the occurrence of morphological and biochemical aging markers in human RBC and influences the cell metabolism. Biochemical data demonstrate that contemporaneously to morphological alterations, Aβ triggers: (i) metabolic alterations and (ii) a complex signaling pathway involving caspase 3, protein kinase C and nitric oxide derived metabolites.
CONCLUSIONS:
our study provides a comprehensive picture in which Aβ treatment of RBC induces changes in specific cell signalling events and/or metabolic pathways, in turns affecting the membrane–cytoskeleton interaction and the membrane integrity.
Keywords
Introduction
Alzheimer’s disease (AD) is the most common form of dementia, characterized by extracellular plaques comprising predominantly beta peptide 1–42 (Aβ) and intracellular neurofibrillary tangles made of hyperphosphorylated tau [1]. Though historically Aβ plaques were thought to cause AD, [2] current evidences indicate that the pathological process leading to AD begins with synaptic injury by neurotoxic Aβ oligomers, whereas formation of plaques and tangles are downstream events [3]. Oxidative stress is involved in the mechanism mediated by Aβ [4]. In addition to Aβ deposition in neurons, Aβ has been detected in blood [5] where it interacts with red blood cells (RBCs) [6], altering their metabolism [7–10]. Other studies [11–18] suggest that Aβ impairs RBCs’ functionality and structural integrity, enhancing abnormalities at the vascular level that could be involved in the development of AD. In particular, structural alterations in the circulating RBC population can influence oxygen delivery to the brain, and these changes might be an early mechanism triggering the glucose metabolism disturbance observed in AD brain. These alterations are expected to play a role in the neurobiological changes and in the impairment of cognitive function characteristic of the disease.
Our group and others have found that Aβ induces oxidative injury to RBCs [12, 16–22].
The present study focuses on the relationship between RBC morphology and alterations of cell signaling pathways in the presence of Aβ. Concerning the control of cell morphology, it is interesting to note that members of the protein kinase C (PKC) family play a key role in the regulation of membrane stability and deformability in RBCs [23–25]. Interestingly, PKC activity changes were reported to occur in brain of AD patients [26] as well as in and other peripheral tissues [27]. Furthermore, it has been evidenced that caspase 3 is expressed in RBCs [28] and that it is activated under different stress conditions [21], including the Aβ exposure [20]. Interestingly, in other cell lines, several potential cross-talks between PKC and caspases have been reported [29, 30] and Caspase 3 was shown to be an upstream event to alteration of eNOS activity [31].
All these considerations indicate that a cross talk between cell signalling pathways and modulation of the cell structural and biomechanical properties should actually exist also in RBCs. The possibility that such relationship could pave the way to the onset of the conditions required for the development of AD prompted us to a simultaneous study of the morphological and biochemical properties of RBCs after treatment with Aβ and glucose depletion.
The morphometric changes occurring in RBCs were monitored by high resolution imaging technique, Atomic Force Microscopy (AFM), and the morphological pattern was coupled to biochemical investigation of specific signaling pathways performed at times characteristic of the most relevant membrane alterations. In previous papers during 1980’s by Parnetti et al. [32, 33], it had been evidenced that RBC parameters were altered in mental disorders patients. Some of this old finding, whose meaning at that time was unclear, have stimulated our actual study, aimed to establish, whether in AD RBC patients during aging, there are clearly recognizable Aβ induced alterations, beyond which can be declared physiological.
Materials and methods
Chemicals
Amyloid β-peptide 1–42 (Aβ) (purity of > 98%), was purchased from Peptide Specialty Laboratories GmbH (Heidelberg, Germany). The lyophilized powder was stored at –20°C. The 1,1,1,3,3,3 hexa-fluoro-isopropanol (TCI America, Portland, OR, USA) was used to exclude aggregates formation [34]. Other reagents were purchased from Sigma Chemical Co. (St. Louis, MO; USA).
Ethics statement
After receipt of written informed consent from healthy volunteers, blood was voluntarily donated for the sole purpose of this study in accordance with the Declaration of Helsinki.
Preparation of red blood cells and incubation conditions
Whole blood (3 ml) was collected in citrate and washed three times with an iso-osmotic NaCl solution. A low speed centrifugation (800×g, 5 min), was performed to separate plasma avoiding any mechanical stress that could determine RBC’s morphological alteration [35]. An aliquot of 45 μl of packed and washed RBCs were re-suspended, in a final volume of 1.5 ml of the incubation buffer (35 mM Na2SO4, 90 mM NaCl, 25 mM HEPES [N-(2-hydroxyethyl)-piperazine-N1-2-ethanesulfonic acid], 1.5 mM MgCl2, glucose 5 mM). RBCs suspensions (packed RBC/incubation buffer:1 to 10, in volume) were incubated in a thermostatic shaker at 37°C with a slow agitation, for 6 h, 18 h, 24 h and 48 h in incubation buffer with or without 1 μM Aβ. As already reported, our fixed concentration, is considered physiologically relevant in relation to the higher levels of amyloid peptide probably associated with the circulating red blood cells [36].
After a centrifugation (500×g, 5 min), to sediment RBCs and removing the lysed cells, samples were used for biochemical and microscopy analysis.
ATP assay
ATP levels were measured as previously reported [37]. A 1251 luminometer BioOrbit was used to detect the light emitted. All values obtained were compared to a standard curve with known concentrations of ATP to determine the ATP concentration.
Caspase 3 assay
Caspase activity was performed as previously reported [22]. Briefly, after different treatments, a 3000×g centrifugation for 5 min was used to collect RBCs as described [38]. Centrifuged cells were re-suspended in a 100 mM HEPES buffer, with 20% glycerol, 5 mM DTT, 0.5 mM ethylene-diamine-tetra-acetic acid (EDTA), pH 7.5 and sonicated. Caspase 3 content was purified, from the supernatant, after a centrifugation (1500×g, 10 min) and through Microcon YM 30 (Nominal Molecular Weight Limit 30000). Each of these fractions was incubated with enzyme-specific colorimetric substrates (Ac-DEVD-pNA 100 μM in HEPES-buffer) after a dilution 1 : 7 for 1 h at 37 °C. Caspase 3 activity was measured spectrophotometrically, after the release of pNA at 405 nm. The activity was expressed as the n-fold value of untreated sample respect to positive control.
Protein kinase C assay
After treatments RBCs were collected as reported by Klarl et al. [39] after a centrifugation (1,100×g, 4°C, 5 min). Cells were washed in PBS (1 ml), then RBCs were lysed with 150 μl of lysis buffer (20 mM Tris HCl (pH 7.4), 1 mM sodium orthovanadate, 5 mM EGTA, 1% Triton X-100 plus a protease inhibitors solution (10 μg/ml pepstatin A, 10 μg/ml leupeptin, 5 μg/ml aprotinin, and 0.1 mM PMSF) (Roche Diagnostics). The lysates were incubated on ice for 30 min and then were pelleted (22,000×g, 4°C, 15 min). The supernatant protein concentration was determined with Bradford reagent (Bio-Rad, Munich, Germany), using BSA (Sigma) as a standard. The StressXpress PKC Kinase Activity Assay Kit from Stressgen (Biomol- Hamburg, Germany) has allowed us to determine protein kinase C (PKC) activity in RBCs’ extracts. The kit detects enzyme activity from every isoform expressed in RBCs. The analysis was performed according the methods previously described. [30].
Measurement of nitrite and nitrate levels
Nitrite and nitrate (NO2–/NO3–) are stable oxidation products of NO [35] and represents effective markers for nitric oxide (NO) production in biological systems. RBC NO2– was measured using the Griess reaction kit (Sigma-Aldrich, St. Louis, MO, USA) following the instruction reported and as described in detail previously [36].
Atomic force microscopy measurements
The Atomic Force Microscopy (AFM) measurements were performed as described in detail previously [40–42]. For the morphological study, an aliquot of few μl (typically 15) of each sample was diluited 1 : 1 with plasma, to enhance the cell-surface attachment and to prevent cell–cell adhesion; then a 4 μl drop of this solution was deposited on a polylysine covered glass slide and, immediately, manually smeared. After smearing, the samples were left drying under a laminar flow hood and then characterized by AFM. All the reported AFM data were collected at room temperature and fixed 30% relative humidity. The images were collected in contact mode with probe force well below 1 nN. High resolution images were collected at a scanning speed of 3-4 sec/row and the reproducibility of the data were carefully tested. The data analysis, especially for what concern the collection and evaluation of the plasma membrane roughness, was performed according to previous studies and considerations [41]. In particular, the surface roughness was measured on flat, square, 1 μm2, fields of view containing, typically, 30000–60000 points.
For each image, we collected the roughness values from several, non-overlapping, areas (typically 10–12 fields per cell) and the mean cellular value was calculated. Then, the mean values obtained from each cell were mediated with the value obtained from the other cell of the very same sample to determine the mean samples’ roughness value and the standard deviation.
The number of analyzed cell per sample, was not fixed “a priori”: indeed, the addition of new cells to the data set stops when the mean samples’ roughness converges to a stable value that results unaffected by the addition of new elements to the data set itself. In practice, depending on the sample, this occurs typically, when 20 to 50 RBCs x samples were analysed. A two-threefold larger number of cells were imaged to describe the shape alterations reported in Figs. 4 and 5.
Statistical analysis
The software Excel (Microsoft, CA, USA) was used for statistical calculation and data are expressed as mean±standard deviation (S.D.). A Wilcoxon test, a non-parametric test used to compare related samples, was used to analyze the differences of measured parameters before and after treatment.
Results and discussion
Aβ-induced caspase 3 activation through protein kinase C
The membrane of RBC is connected through junctional complexes to the cytoskeleton, composed by spectrin filaments linked together and to integral proteins (band-3 proteins and sialo-glycoproteins, embedded in the lipid membrane) mainly by short stiff actin filaments, band-4.1 protein and ankyrin [43]. The regulation of protein-protein interaction is correlated to the phosphorylation status of RBC’s cytoskeleton proteins [44]. A key role in the phosphorylation is played by PKC that acts on cytoskeletal proteins (such as protein-4.1) [39], inducing a transient dissociation of the network of membrane-attached proteins.
At first, we assessed the effect of Aβ on the activity of protein kinase C in RBCs. As shown in (Fig. 1), after 12 h incubation, Aβ treatment results in a dramatic increase in PKC activity with respect to control. Next, we investigated if Aβ dependent activation of PKC could also be related to caspase 3 activity. Such investigations are prompted by the known activation of caspase 3 in RBCs following to Aβ exposure [22] and by a recent report showing a linkage between caspase 3 and PKC [43].
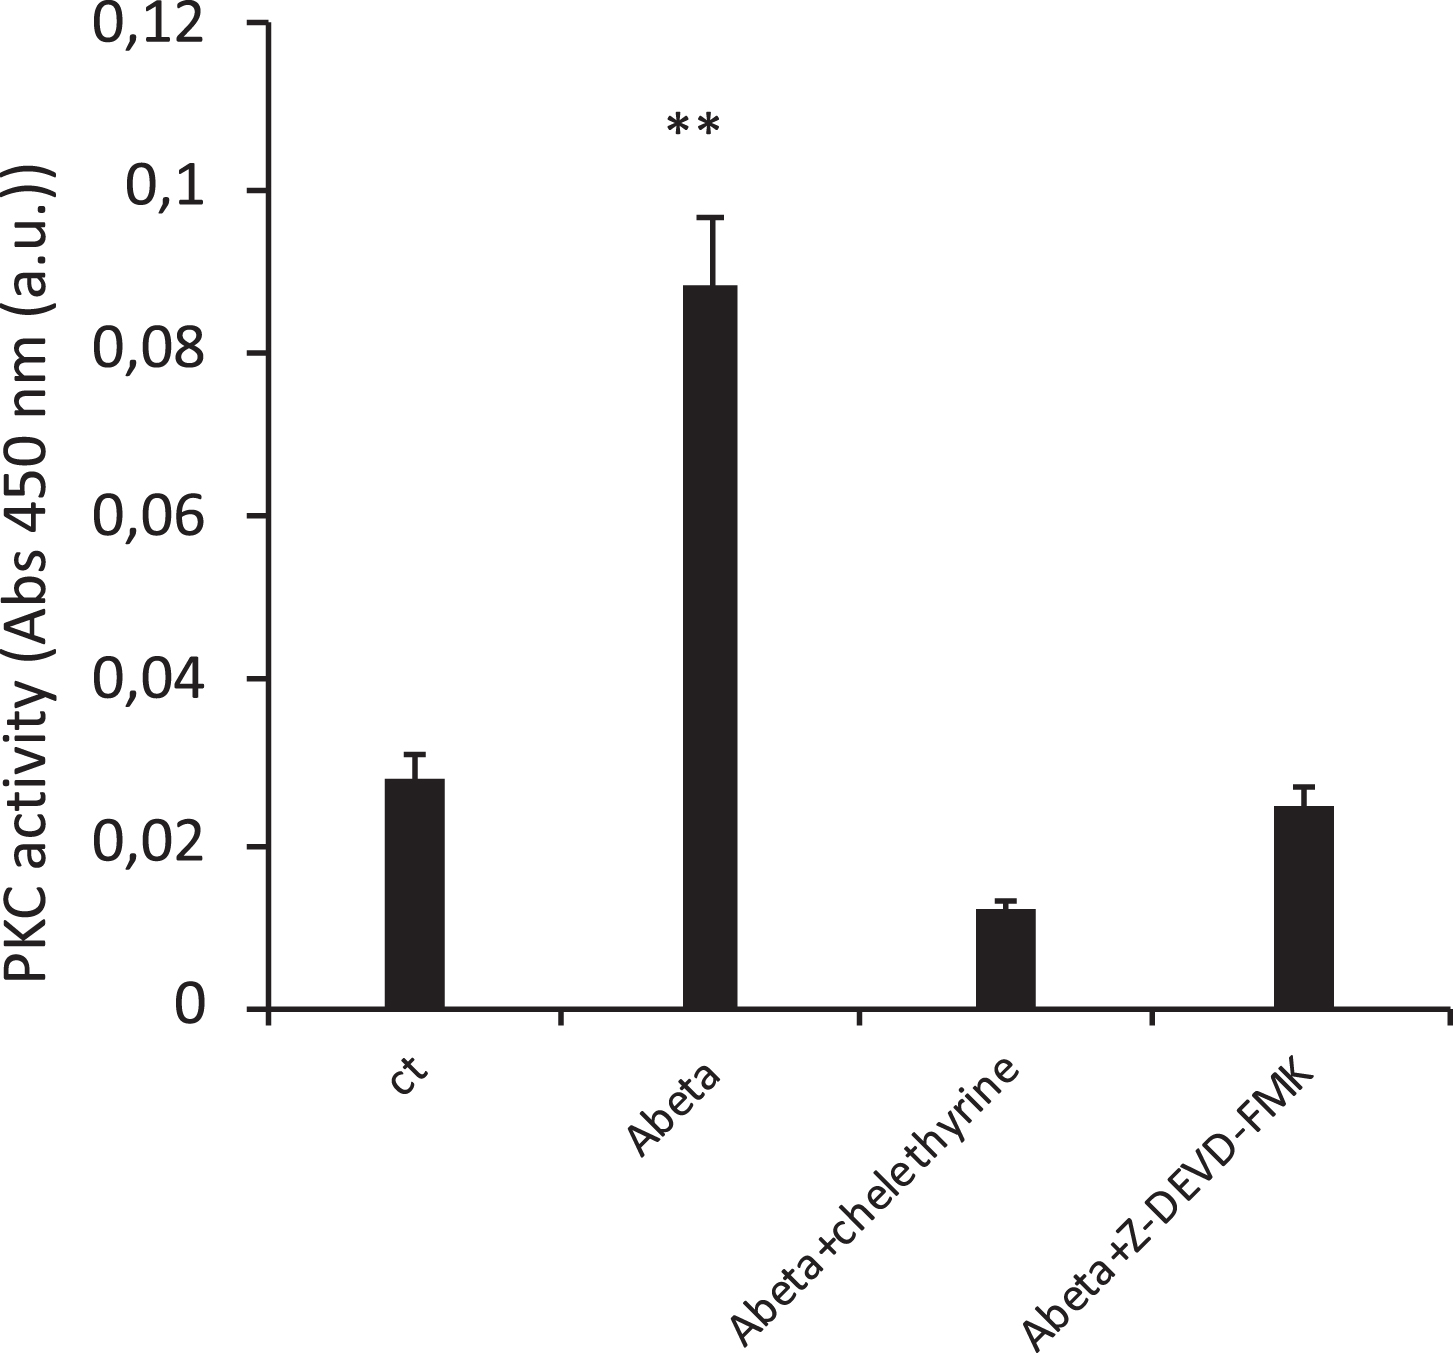
PKC activity in RBCs after 12 h incubation under different experimental conditions. Results are from six independent experiments. ** P < 0.01 Aβ vs ct;.
With this aim, we measured PKC activity after a 12 h Aβ exposure in the presence of a caspase-3-specific inhibitor, i.e. Z-DEVD-FMK (Fig. 1). Pre-treatment (30 min at 37°C) of RBCs with the caspase 3 inhibitor before exposure of cells to Aβ, completely blunted the Aβ mediated-effect on PKC activity. Our results, showing reduction of PKC activity in the presence of a specific caspase 3 inhibitor (i.e. Z-DEVD-FMK), suggests the existence of a cross talk between caspase 3 and PKC activities. In line with this finding, chelethyrine (a blocker of the catalytic site of PKC) is able to counteract the stimulating effect of Aβ on PKC activity.
Next, we investigated the role of caspase 3 in RBCs following to Aβ exposure. As shown in Fig. 2, Aβ-mediated activation of caspase 3 resulted significantly higher with respect to control cells. Pre-treatment (2 h at 37°C) of Aβ exposed RBCs, with Z-DEVD-FMK, was able to inhibit the Aβ-mediated caspase-3 activation, ruling out the presence of unspecified proteolytic activities. Next, we decided to further examine the linkage existing between PKC and caspase 3 in Aβ-treated RBCs. Considering, that it has been shown that PKC can directly activate caspase 3, although the underlying molecular mechanism is not yet fully understood [30], we tested the ability of the PKC specific inhibitor chelethyrine to modulate caspase-3 activity in Aβ treated cells (Fig. 2). Pre-treatment of 30 min with chelethyrine before the addition of Aβ strongly reduce caspase-3 activation.
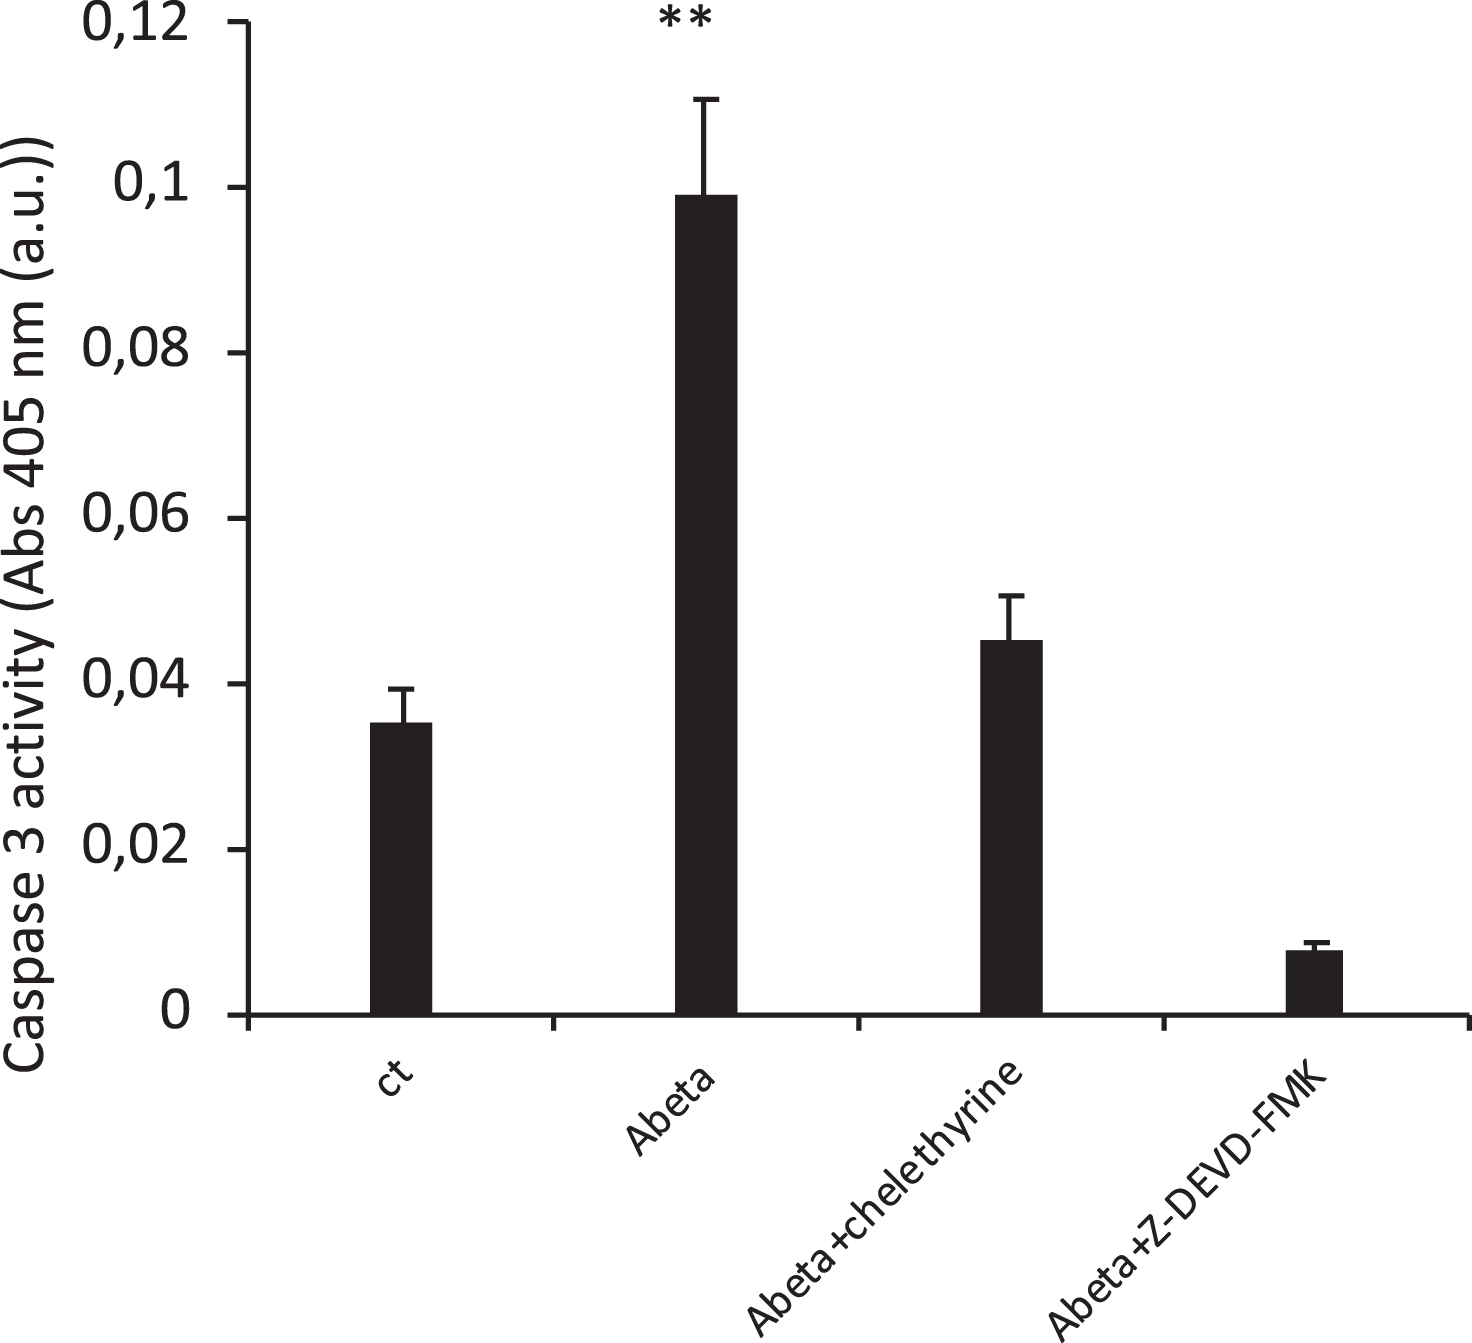
Caspase 3 activity in RBCs after 12 h incubation under different experimental conditions. Results are from six independent experiments. ** P < 0.01 Aβ vs ct;.
It has been demonstrated that the roughness of RBCs’ plasma membrane is a morphological parameter that can be measured from AFM images [40–42]. In normal and in young RBCs the measured roughness values are significantly higher than in senescent cells or in erythrocytes affected by membrane-skeleton pathologies [40–45]. Such information can be related either to permanent damages of the skeletal architecture, as in the case of treatment with depolymerizing agents or some pathologies [41], or to the occurrence of reversible weakening of the contacts between the membrane and the cytoskeleton, as in the case of cell aging [42]. In both cases, indeed, due to the membrane compliance and to the viscoelastic behavior of the cells, what the roughness detects is related to alteration of the mechanical support exerted on the membrane by the skeleton.
With these premises, in Fig. 3 we report the roughness trend observed in the presence and in the absence of the Aβ. The samples have been monitored up to 48 hours and show, in all the analyzed cases, a continuous and fast decreasing trend that seems to reach a minimum value around 0.9 nm. Within this common behavior, the sample treated with Aβ differs from control cells, as it always shows a lesser roughness value, symptomatic of larger membrane-skeleton alteration. In particular, it is interesting to note that the addition of Aβ has a particularly relevant effect during the first hours of incubation. As a whole, maintenance in a solution with Aβ clearly acts as an accelerator of the normal degenerative path observed in the controls.
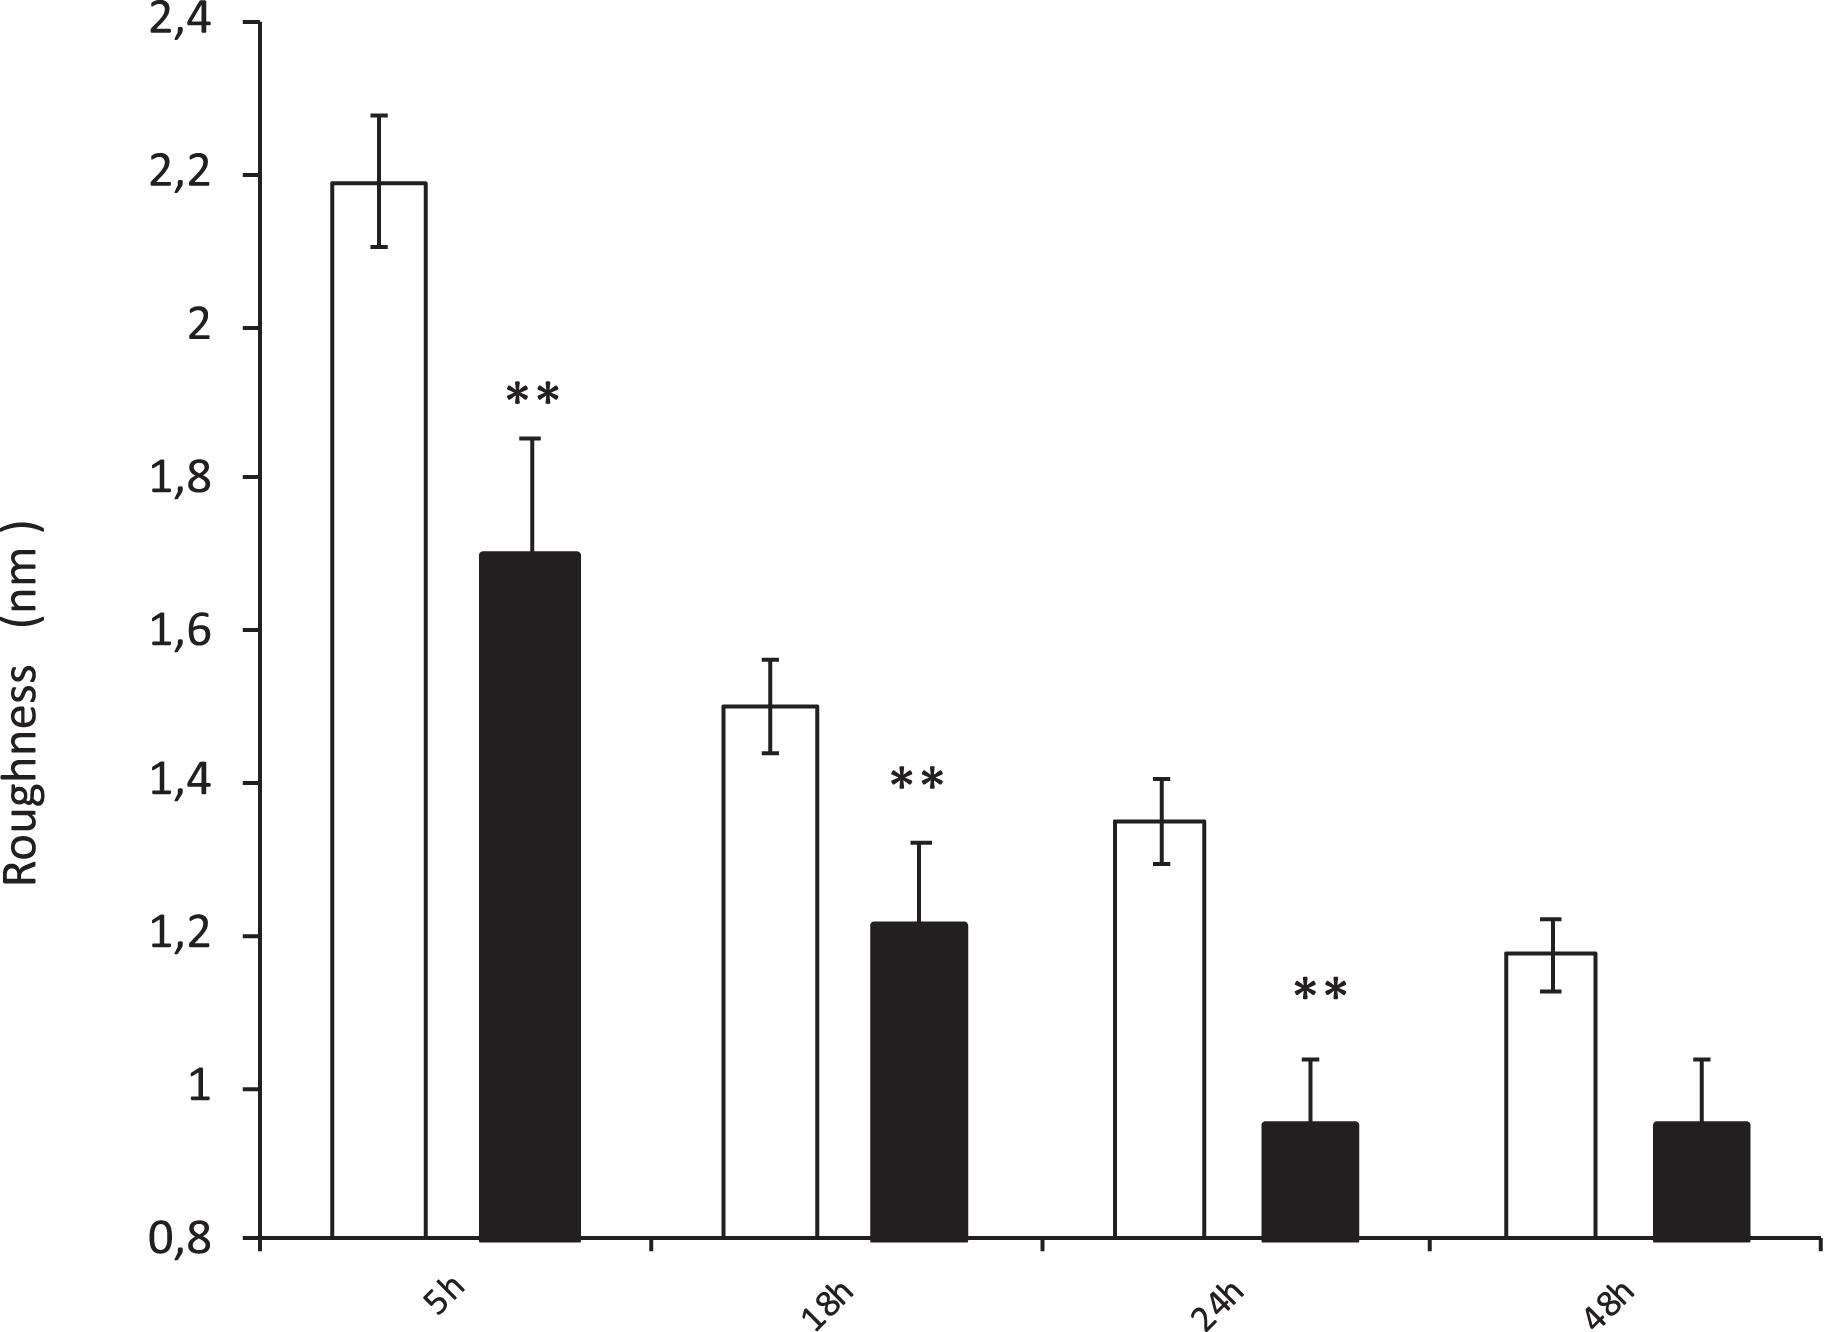
Time course of the measured plasma membrane roughness of RBCs after incubation with Aβ 1 μM or without. **P < 0.05 Aβ vs ct. The roughness trends have been measured in two distinct series of experiments with quantitative values consistent within the experimental error.
A deeper assessment of the morphological consequences of the Aβ treatment can be performed through AFM imaging. In particular, in Fig. 4 we describe the typical evolution, at increasing incubation time, of the morphologies for controls (panels a-d) and for RBCs incubated in the presence of Aβ (panels e-i). Both samples have been maintained in buffers with no glucose.
Evolution over time of the erythrocytes morphologies for control (a–d) and Aβ (e-i) treated samples. The column corresponds, from left to right, to: 5 h; 18 h; 24 h and 48 h incubation time, in such a way that the cells’ evolution can be inspected along a line. Panel ‘e’ and ‘f’ report a topography and the corresponding lateral force image of Aβ treated erythrocytes. Experiments have been repeated twice showing consistent qualitative and quantitative data.
Interestingly, compared to previous experimental investigations [40], the incubation performed in the present experimental conditions (i.e. at 37°C) determines a much faster occurrence of morphological defects such as cell swelling and development of proto-spicules or spicules, both in the presence and in the absence of Aβ. Indeed, even in the control cells (Fig. 4a–d) these defects occur between 18 (swelling) and 48 hours (spicules) of Aβ incubation, i.e. much sooner than expected in a standard aging progression. Beside this general observation, it must be stated that the evolution of the cell morphology is undoubtedly faster in the presence of Aβ (see Fig. 4e–i) than in the controls, revealing that the peptide boosts the development of defects characteristics of the aging such as crenatures (Fig. 4e), proto-spicules and spicules (4i–h).
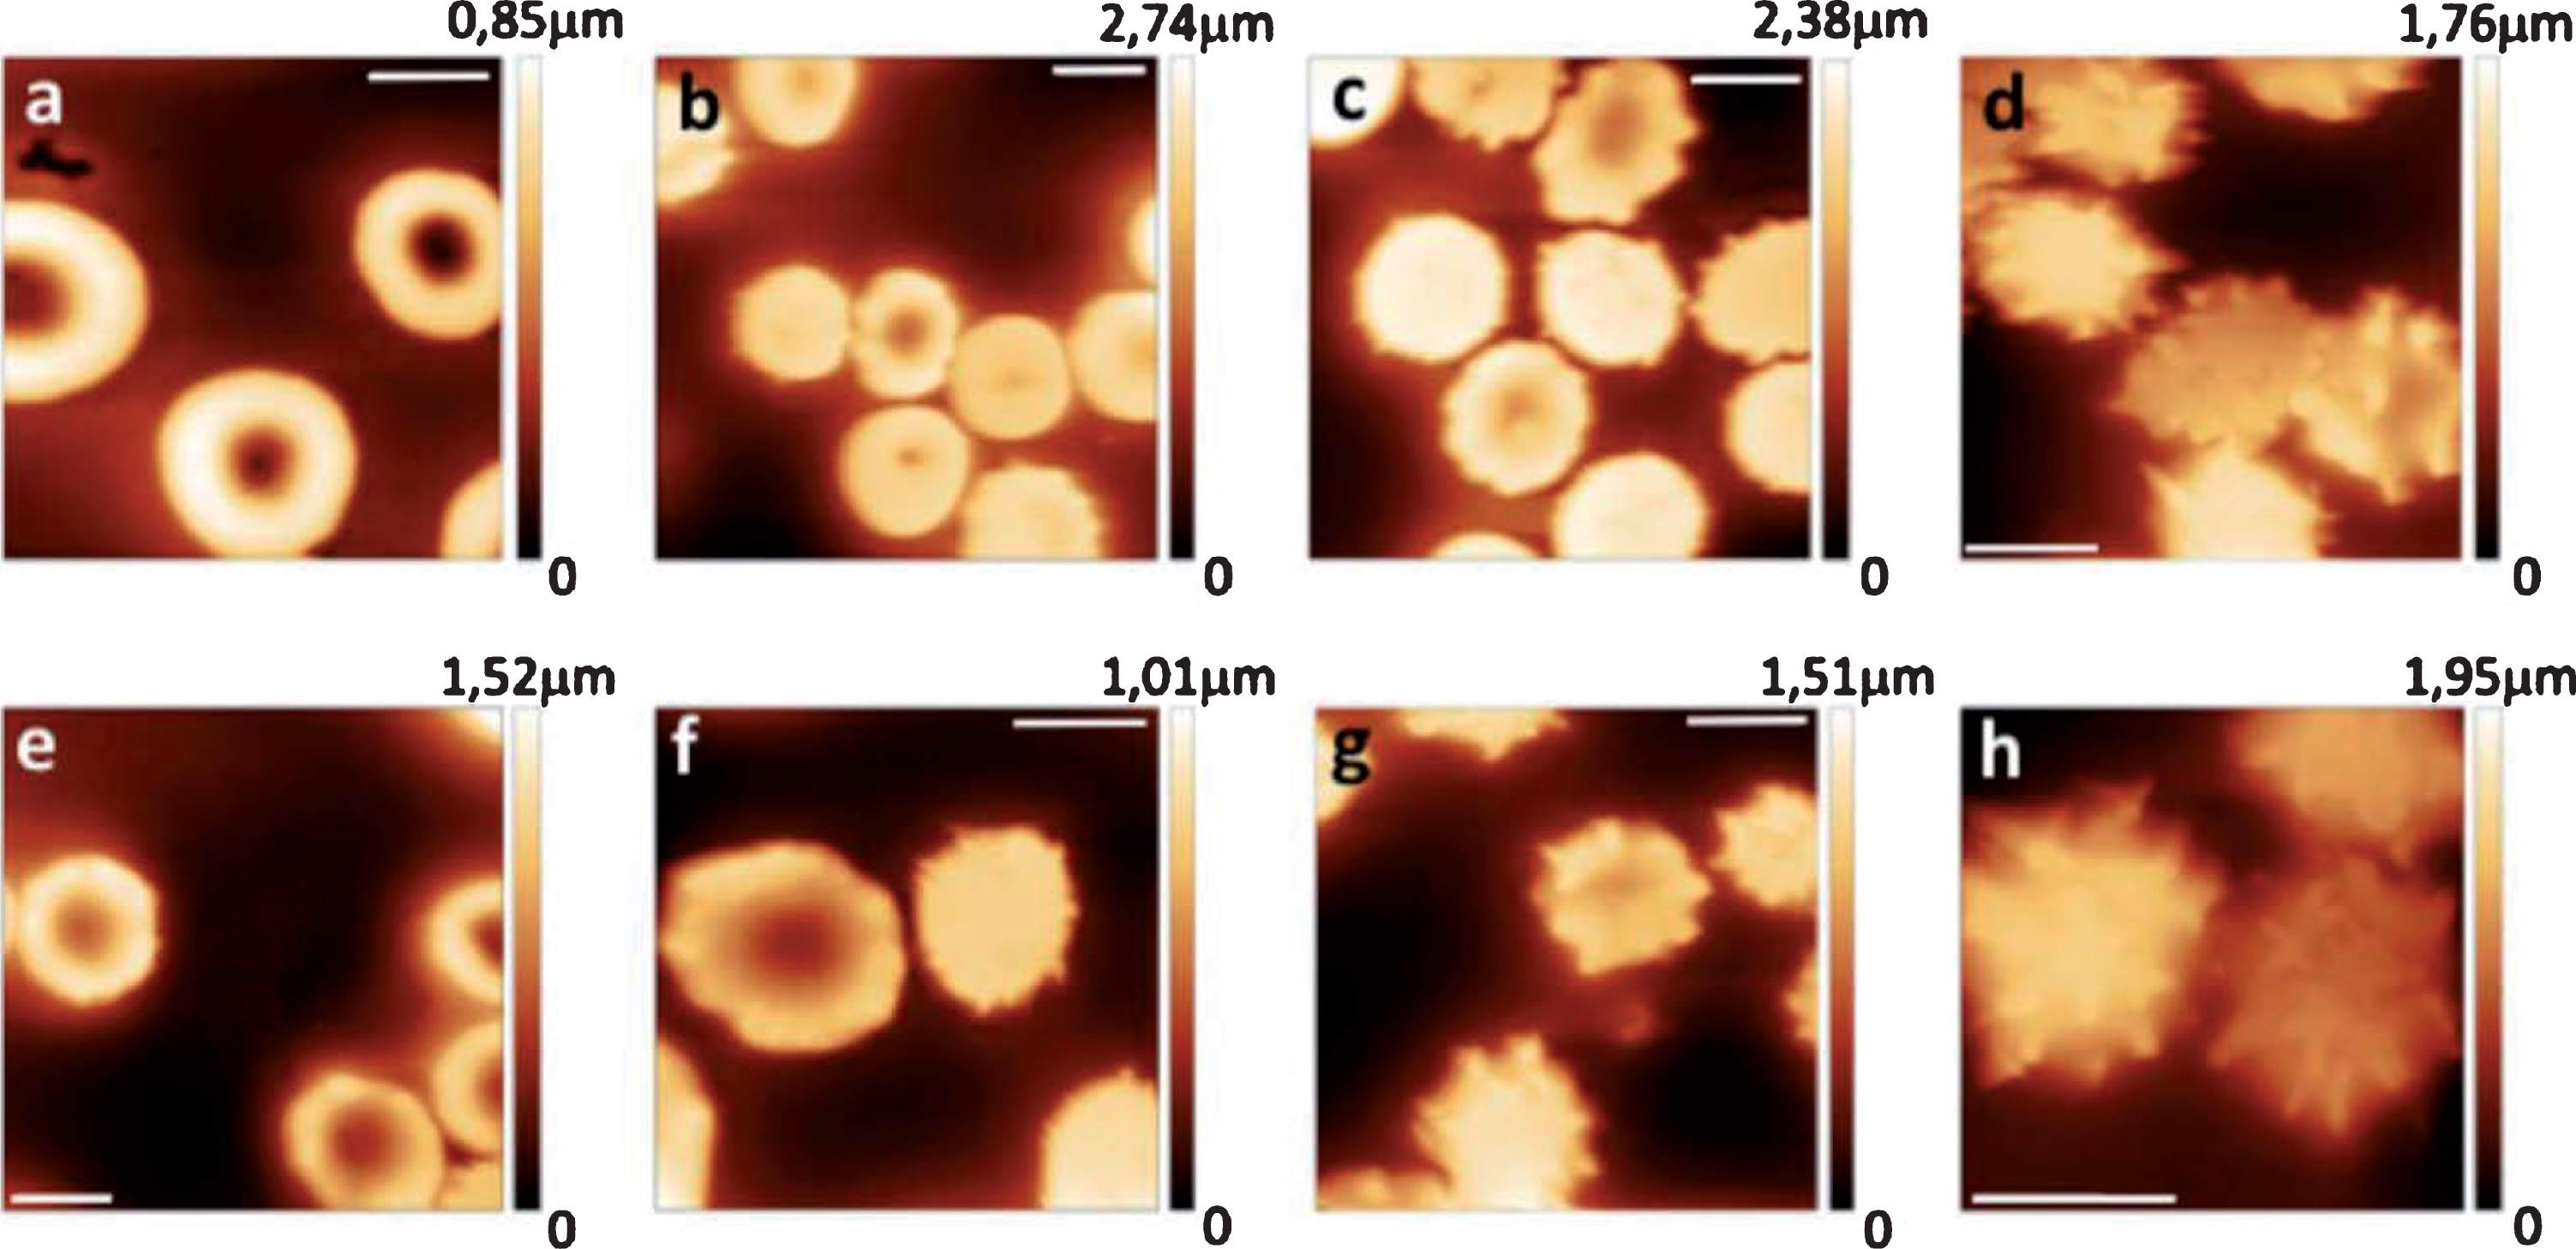
The high-resolution imaging of the AFM can be used to describe the time evolution of the RBCs’ membrane at the nanoscale, as well. The most interesting data are summarized in Fig. 5, with regard to the control (topographies in a-d) and Aβ exposed RBCs (topographies e-h).
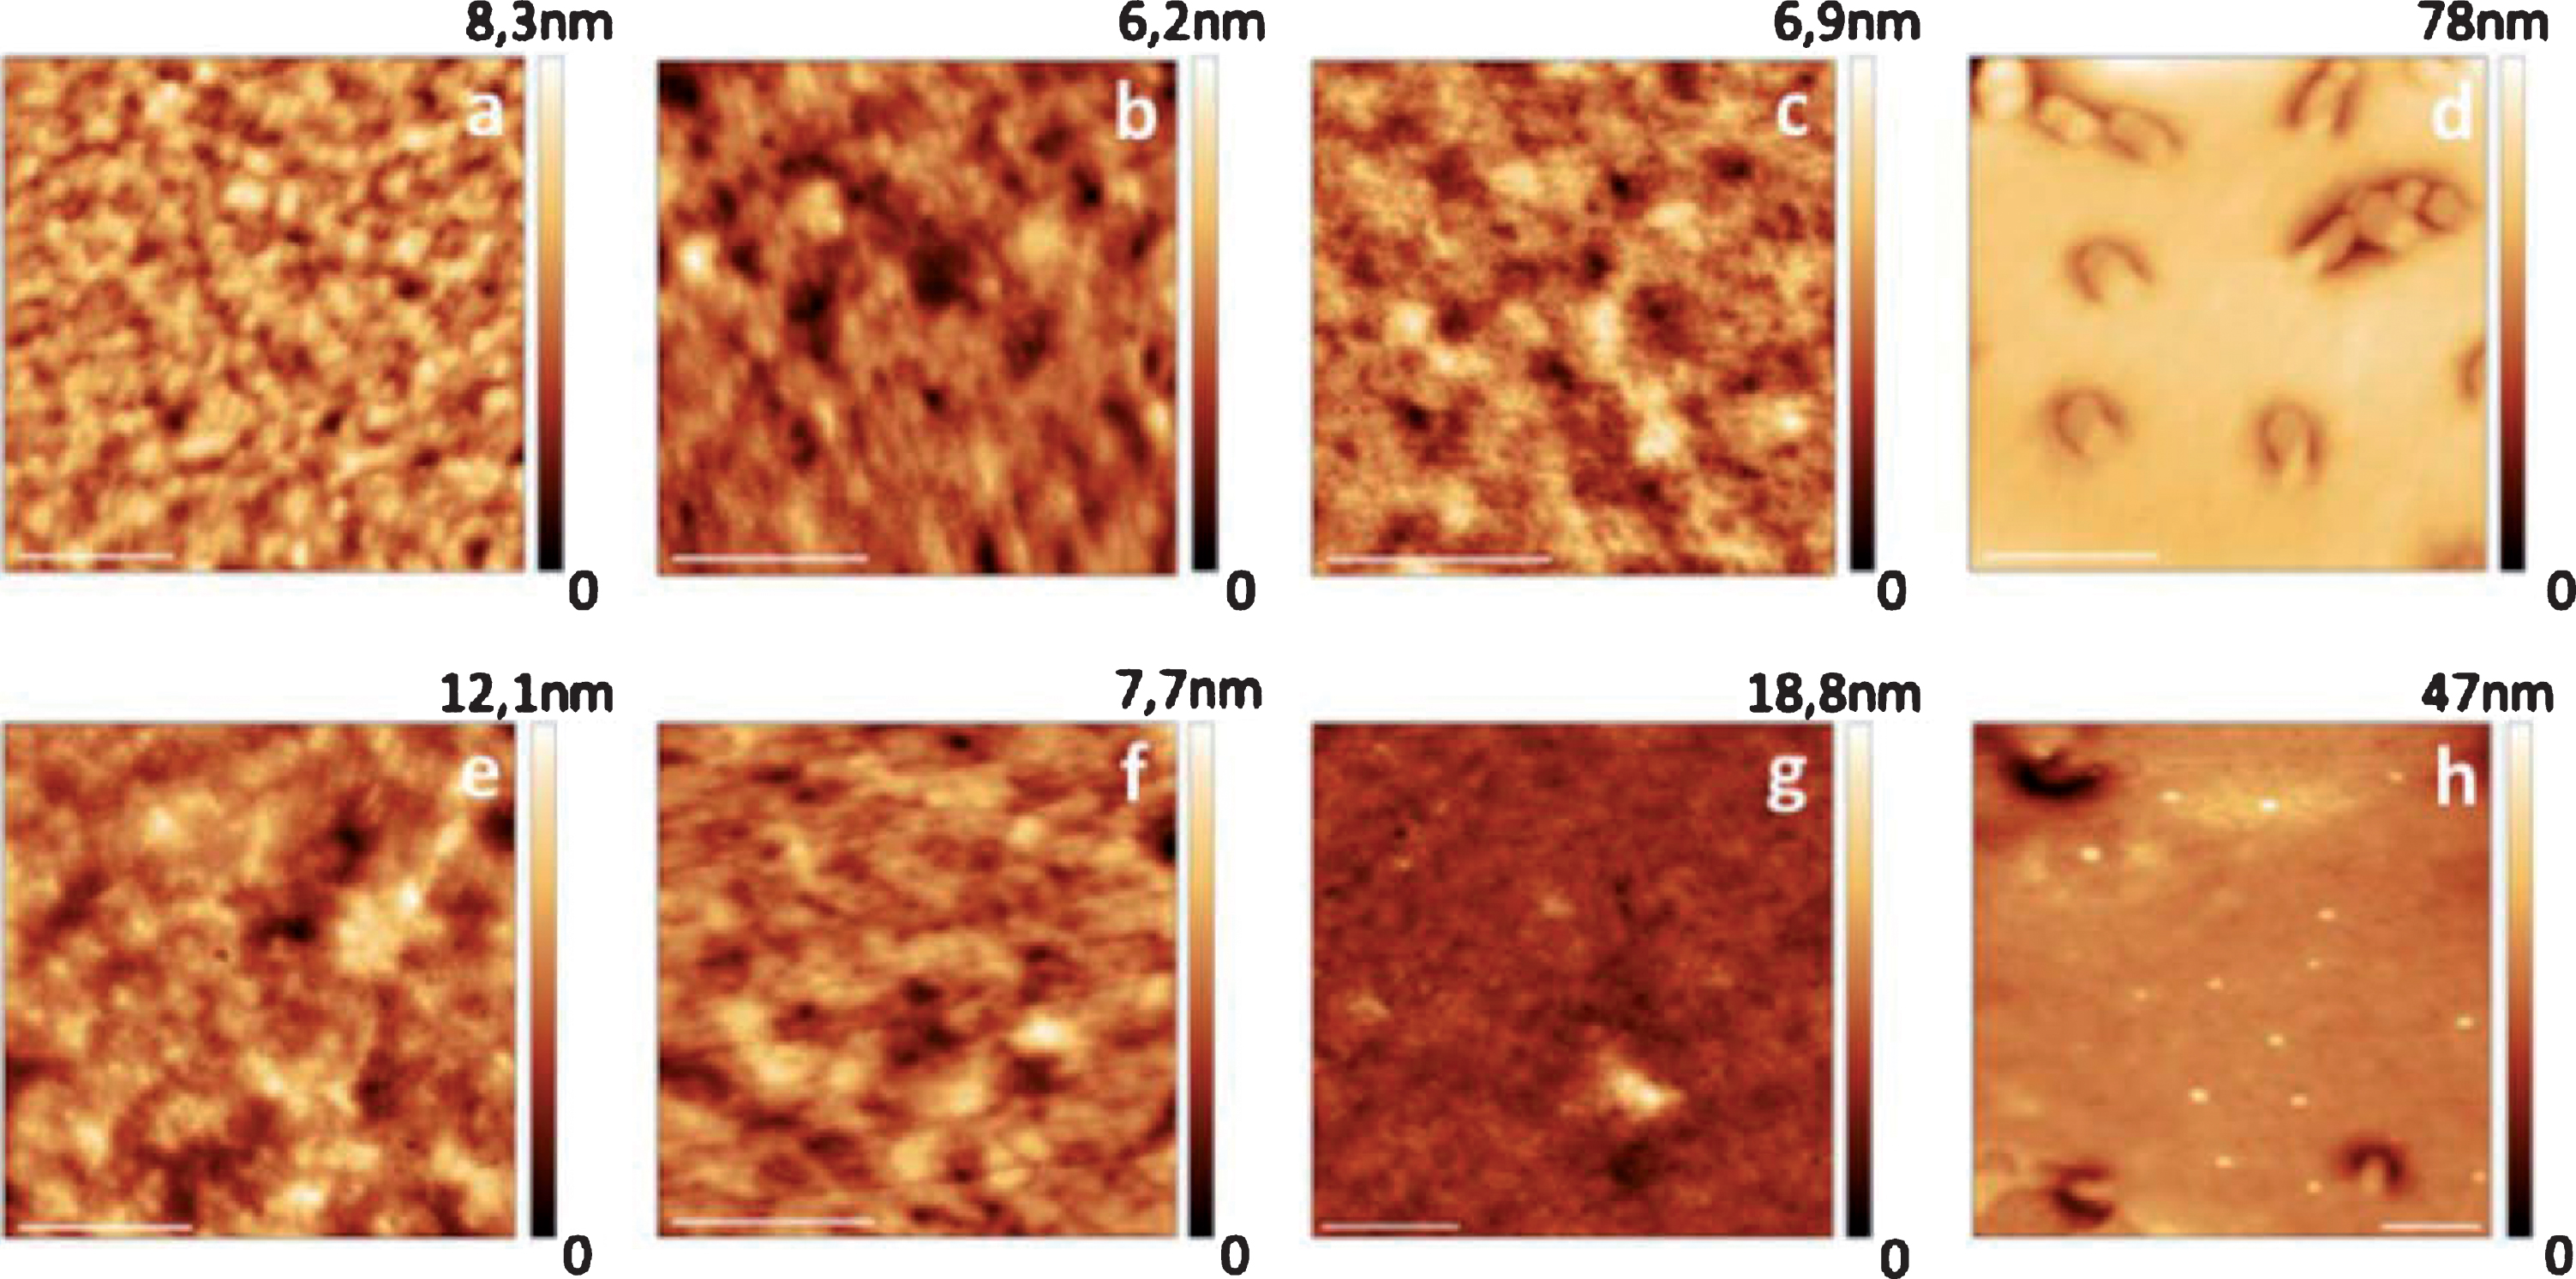
Evolution of the membrane structure over time in control (a–d) and Aβ treated (e–h) erythrocytes. The columns report typical morphologies of cells after 5 h (a, e); 18 h (b, f); 24 h (c, g) and 48 h (d, h). The development of structural alterations in Aβ treated cells is clearly faster than in control samples The consistency of the results has been verified in two distinct sets of experiments.
Similarly to what occurs for the overall cell shape, it results that as the time increases also the RBCs’ membrane structure evolves. Indeed, even in the control samples, the pattern of homogeneous ruffling characteristic of the fresh samples (Fig. 5a) changes into a locally dis-homogeneous arrangement with some small invaginations (5b and c) that, over time, develops into microvesicles and proto-spicules (5d). With respect to this reference pattern of evolution, the treatment with Aβ influence the membrane morphologies in different ways. For instance, in the presence of Aβ the development of dis-homogeneous areas (5e and 5f) occur faster and produces effects already after 5 h (e.g. compare 5e vs 5b or 5f vs 5c). In general terms, indeed, it can be ruled out that a given morphological defect occur faster in the samples treated with Aβ peptide. Furthermore, in the samples treated with Aβ, a few peculiar structures, which appear in the images as bright aggregates or clusters (see Fig. 5g), can be detected on the cell membrane at intermediate incubation times (e.g. 18 or 24 h). Remarkably, the final condition of all the analyzed samples after 48 hours of incubation is practically equivalent with little or no regards on the different treatment. This is true in terms of overall morphology (Fig. 4d, i, l) and in terms of the presence of morphological markers, such as micro-vesicles on the membrane (5d vs 5h).
As a whole, hence, the Aβ treatment induces the presence of membrane features that can be associated, directly or indirectly, to the interactions of the peptide with the RBCs.
In addition, as the treatment of RBCs with Aβ induces membrane alteration (e.g 5h) well before the presence of clusters on the same membrane can be observed, these latter features should not be considered the direct visualization of the Aβ binding to the cell membrane. Rather, these clusters on the membrane likely result from slower aggregative phenomena mediated by protein or lipid migrations or by rearrangement of the double layer. In this contest, the early interaction of Aβ peptide with the cell plays the critical role of initiating the entire phenomenon leading to the occurrence of these unusual aggregates on the membrane.
Our previous results show that Aβ impairs eNOS content and NO production in RBCs and these events could be linked to morphology [9]. Indeed, NO was proposed to be a regulatory factor of RBCs’mechanical properties [46] and metabolism [47]. It is currently unknown whether this role is exerted directly by NO (affecting cytoskeleton elements) or requires some intermediate effector (e.g. peroxy-nitrite) [48]. RBCs express a functional endothelial nitric oxide synthase (eNOS) [49], that is activated by extracellular ATP [50] and GS-NO represents an important sink for NO within RBC [51]. On this base in order to clarify the linkage between Aβ-mediated effect on NO metabolism, nitrite and nitrate levels were measured as markers of NO production [52]. The exposure of erythrocytes to Aβ alters nitrite and nitrate levels in the cell. As shown in Fig. 6, following Aβ exposure for 12 h, cells show the larger reduction in nitrate and nitrites production with respect to control cells. Such inhibitory effect shown by Aβ was fully recovered by Z-DEVD-FMK and chelethyrine treatment, suggesting that caspase 3 and PKC are upstream events to alteration of eNOS activity, as previously suggested [31] in other cell lines.
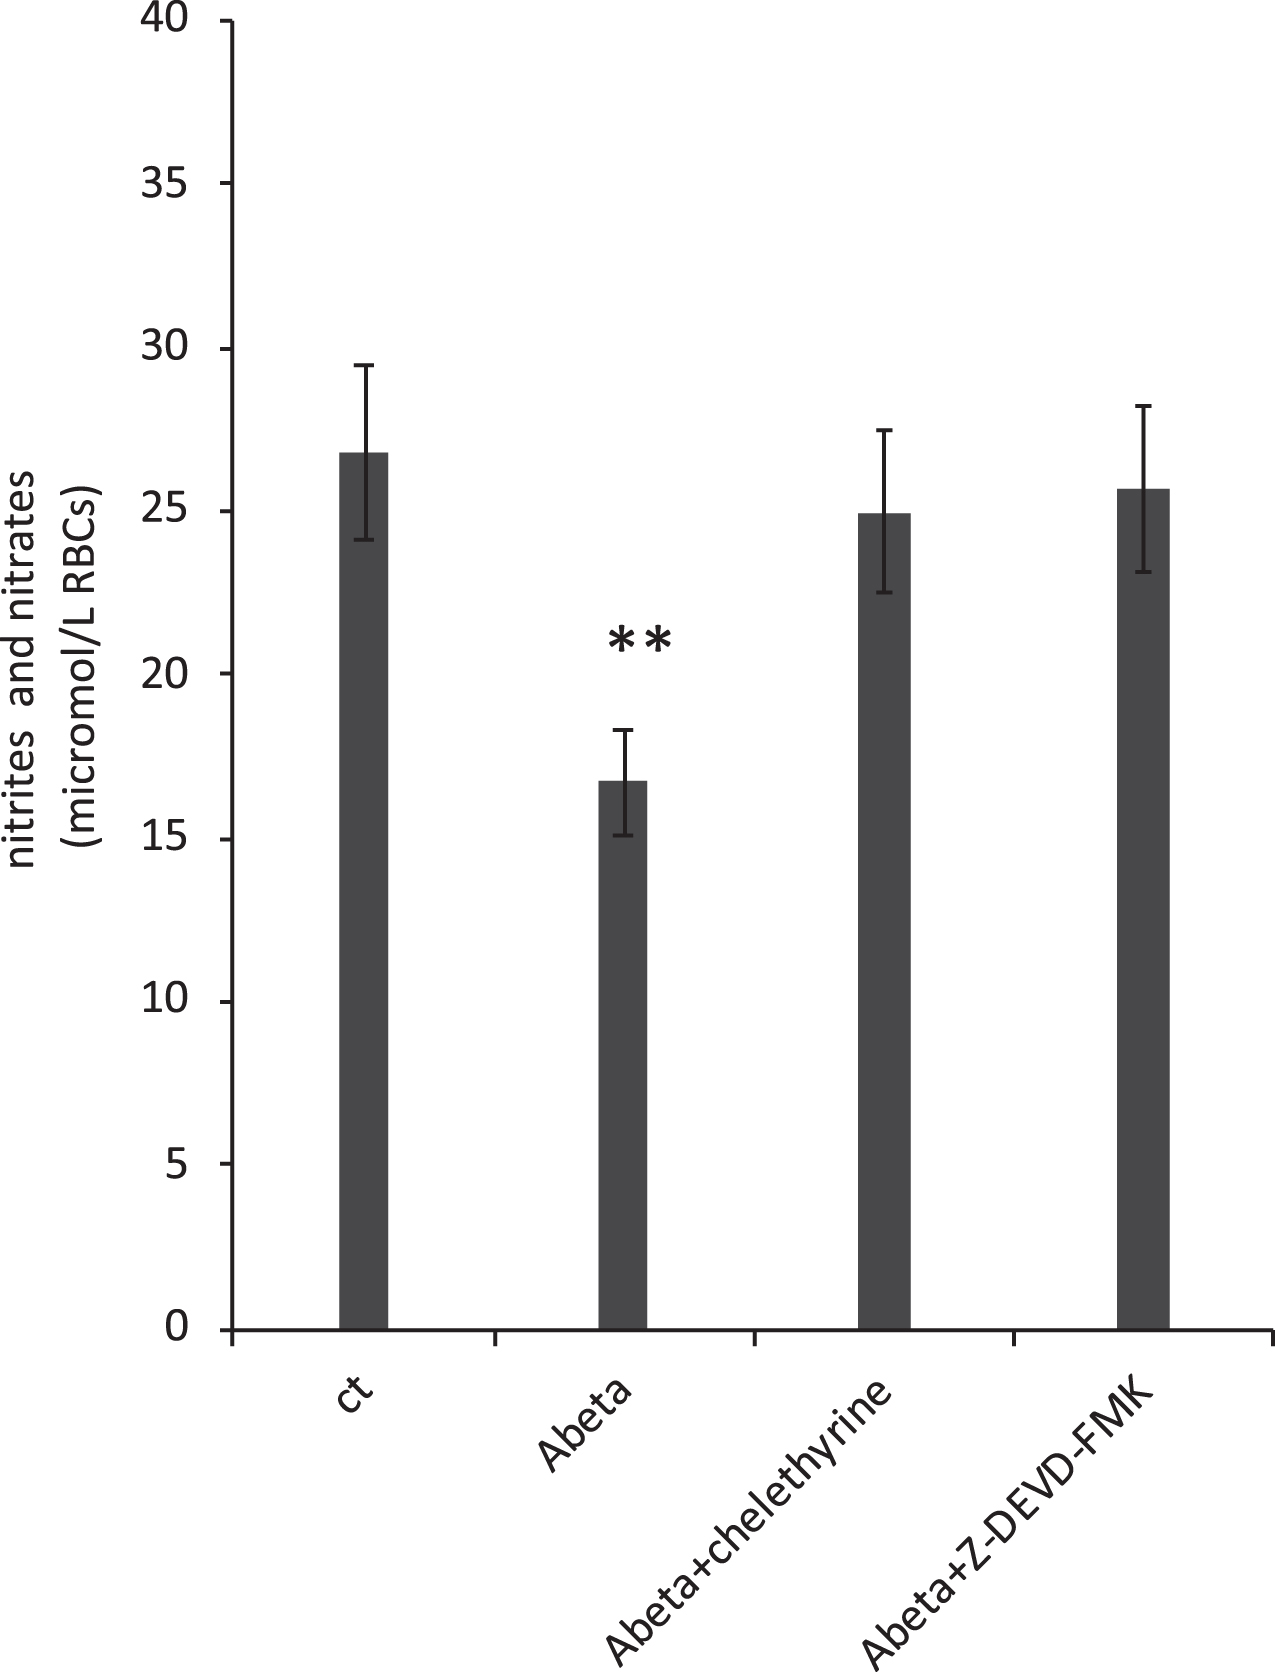
Nitrites and nitrates levels in RBCs after 12 h incubation with or without Aβ 1 μM. Results are from six independent experiments. ** P < 0.05 vs. ct.
RBCs’ ATP levels were determined at time 0 and after 12 and 24 h of Aβ incubation. As shown in (Fig. 7), after 12 h of incubation, control cell and cells treated with Aβ have an ATP content decreased respectively by 35% and by 52% with respect to the starting point (0 h).
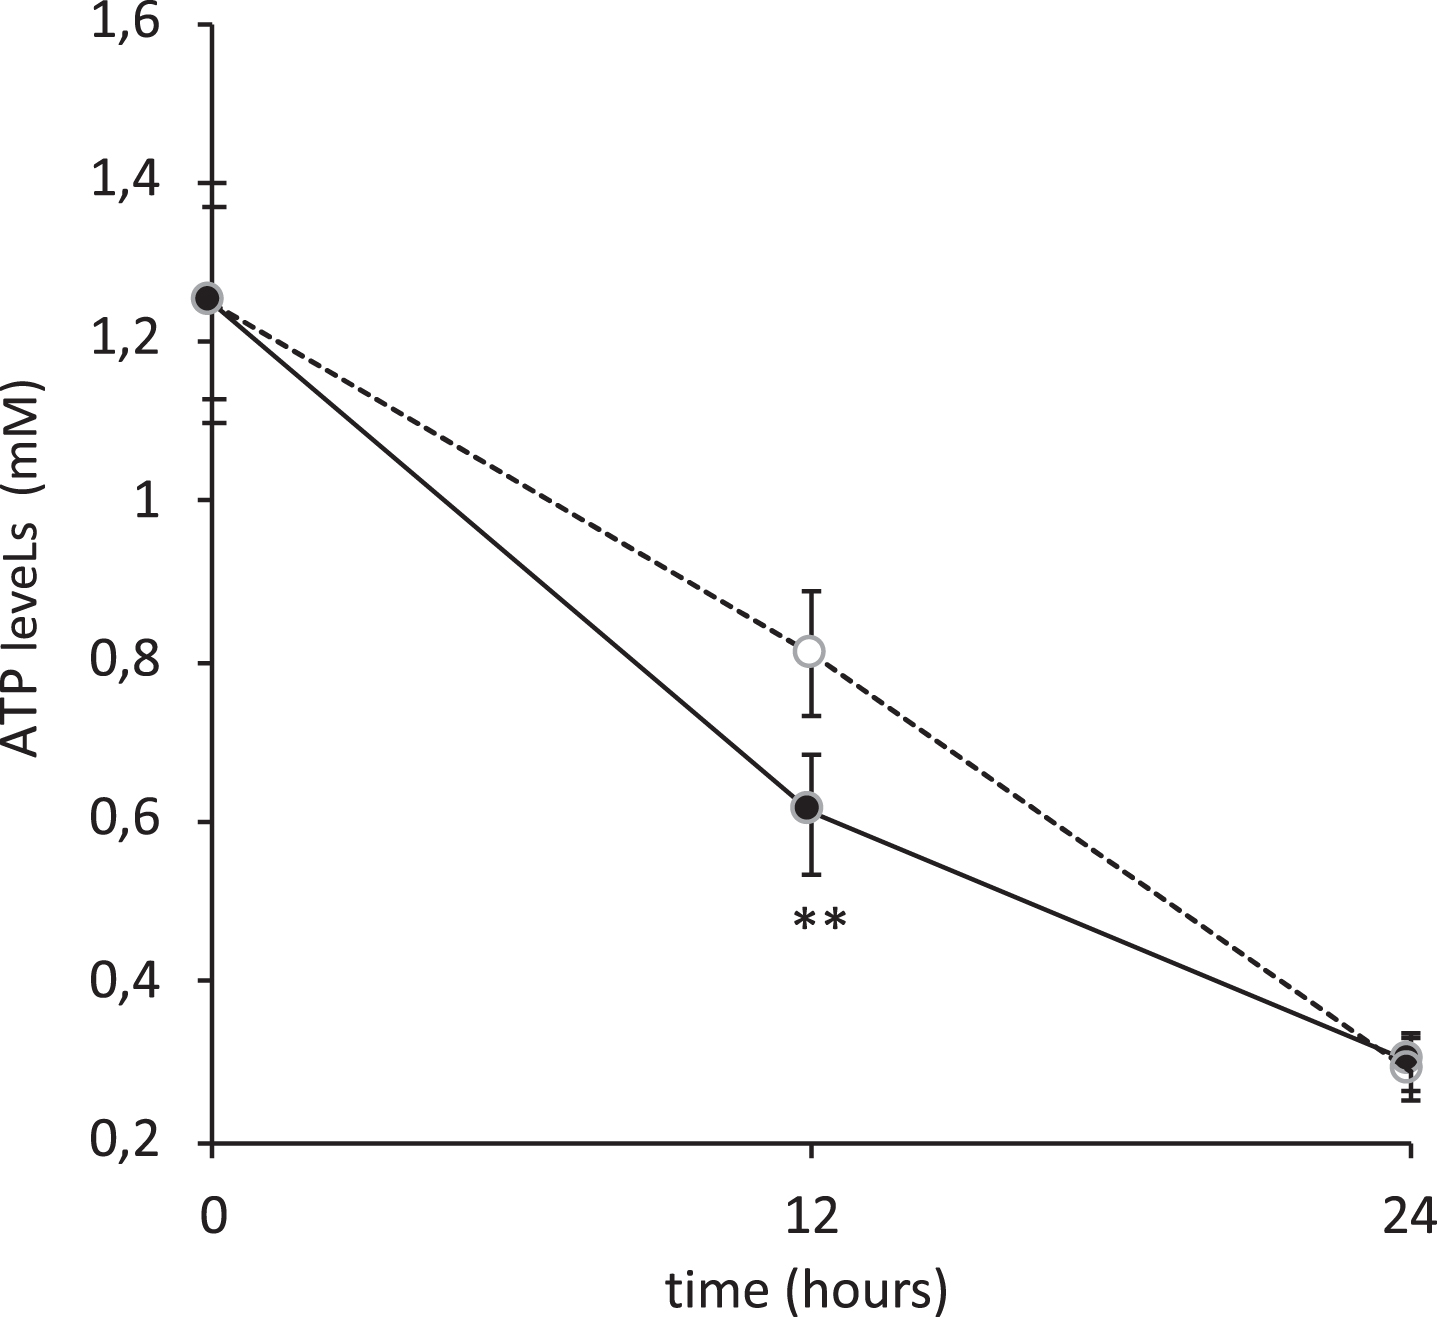
Time course of the effects of Aβ on ATP levels (mM) in RBCs after incubation with or without Aβ 1 μM; Results are from six independent experiments. * P < 0.05 vs. ct;
In the present study, we observed the onset of a variety of morphological anomalies at relatively short Aβ incubation times. These include cell swelling, development of micro-vesicles, proto-spicule or spicule that are, together with the roughness decrease over time, normally associated to the progression of RBCs aging. A faster roughness decrease has been observed when erythrocytes were incubated with Aβ. Moreover, in Aβ and control cells, the final cell status, as monitored by imaging and roughness after a 48 hours Aβ exposure, is basically the same. This suggests the existence of a common final state for the cells and that the presence of Aβ act, mostly, as an accelerator of the morphological evolution. Moreover, the interaction of Aβ peptide with RBCs produces also characteristics features on the plasma membrane that do not depend on the overall cell shape (i.e. they are not marker of aging). These latter features have sizes and detection times compatible with their origin from aggregative phenomena involving either protein or lipid and occurring on the membrane as consequence of the early Aβ interaction with the cell.
Under the chosen experimental conditions, a major role in inducing the observed structural alterations can be attributed to PKC, which phosphorylate cytoskeletal proteins and determine transient dissociation of the network filaments from membrane attached proteins and phosphatidylserine exposure [25]. In addition, Aβ dependent-structural alteration could be related to the observed NO decline, that is known to regulate RBCs’ deformability [46] through S-nitrosylation of α and β spectrins [53]. Such information is in line with the observation that NO producing neurons are relatively less affected by AD [54]. As previously reported, spared neurons to AD neurodegeneration contain higher amounts of eNOS enzyme [55] with respect to neurons displaying degenerative changes. This finding suggests that therapeutic intervention of enhancing eNOS expression, may provide selective resistance to RBCs degeneration in AD, analogously to what happens in spared neurons. Also, caspase-3 contributes to the observed morphology alterations by degrading crucial proteins, such as band 3 [20], involved in the maintenance of RBCs’ shape and function in normal and pathological RBC [56, 57]. Band 3 cutting by caspase3 induces band 3 dimers formation that is responsible, at first, for an altered RBCs’ flexibility [20] and ultimately for an accelerated cell removal from circulation, as demonstrated in AD RBCs. Summarizing our results, we therefore propose a model (Fig. 8), integrated with our past studies [9, 10], in which Aβ dependent-morphological alterations observed during aging process by AFM, are triggered by 3 effectors, namely PKC, caspase 3 and NO metabolites; according to this scheme, Aβ/acetylcholinesterase binding [9] to RBC, leads to a rapid ATP depletion responsible for caspase 3 and PKC activation, both responsible for NO metabolism alteration and reduction in the antioxidant defences i.e. pentose pathway [10]. Our findings support a previous paper suggesting a close relationship between plasma factors [58] and morphological alteration in RBCs. This study should stimulate further investigations aimed at establishing whether plasma Aβ influence haemorheological parameters in the elderly.
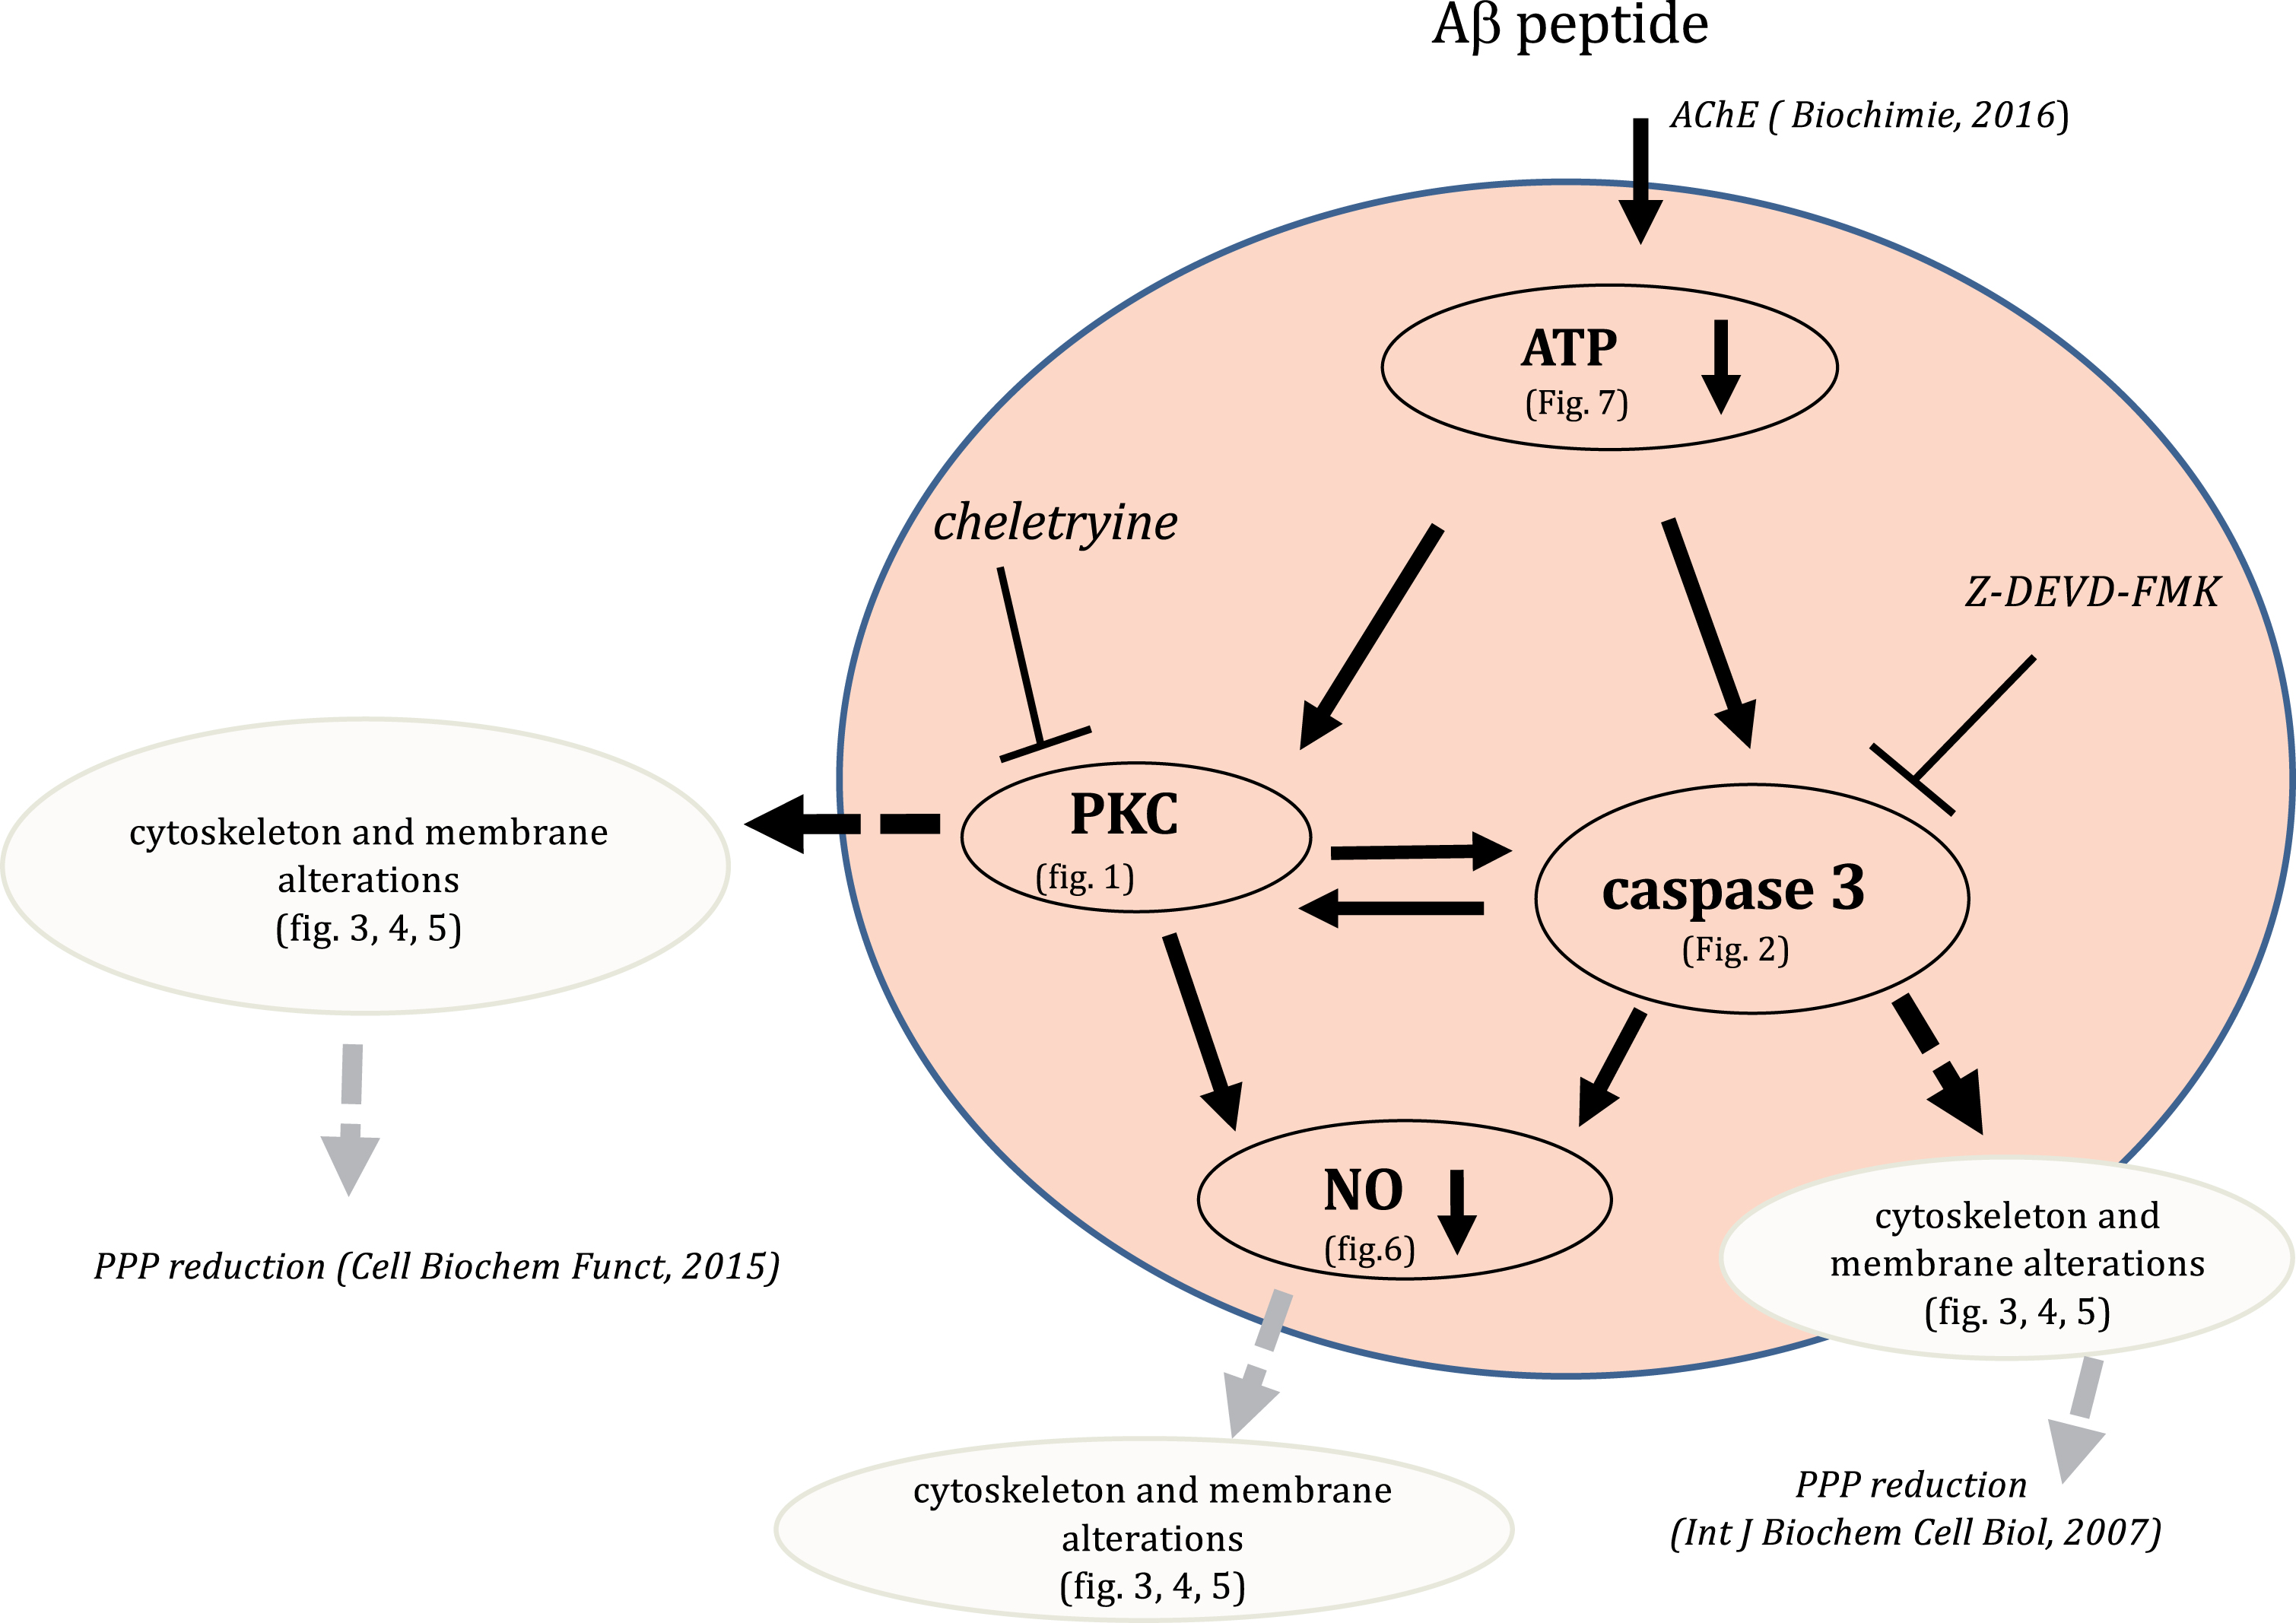
Hypothetical sequence of RBC signaling events induced by Aβ. The figure shows the putative pathways triggered by Aβ. and the possible inter-connections between them. In this scheme PKC stands for all the PKC isoforms, some of which are affected by cheletryine. Abbreviations: Amyloid beta peptide 1-42 (Aβ); Protein Kinase C (PKC); nitric oxide derived metabolites (NO); pentose phosphate pathway (PPP); acetylcholinesterase (AChE).
Conflict of interest statement
The authors confirm that they have no conflicts of interest.
Footnotes
Acknowledgment
This communication was presented at the Joint Meeting of the European Society for Clinical Hemorheology and Microcirculation, the International Society for Clinical Hemorheology, and the International Society of Biorheology, 2–6 July 2018, Krakow, Poland.