






Abstract
BACKGROUND:
Tissue engineering enables the production of three-dimensional microtissues which mimic naturally occurring conditions in special tissues. These 3D culture systems are particularly suitable for application in regenerative medicine or experimental pharmacology and toxicology. Therefore, it is important to analyse the cells in their 3D microenvironment with regard to viability and differentiation. Tetrazolium assays (WST-8 and MTS) are still the methods of choice for estimating the number of living, metabolically active cells, with WST-8 being cell-impermeable compared to MTS. In contrast to these methods, the ATP assay is an endpoint method based on the luciferase-induced reaction of ATP with luciferin after cell lysis.
OBJECTIVE:
We compared three methodologically different proliferation/toxicity assays (MTS, WST-8, ATP) in monolayer (2D) and 3D culture systems to improve the technically challenging determination of the number of viable cells.
METHODS:
Chondrocytes were isolated from human articular cartilage. Three different test systems (MTS, WST-8, ATP) were applied to monolayer cells (2D, varying cell numbers) and spheroids (3D, different sizes) in 96-well plates. The intracellular ATP concentration was determined by luciferase-induced reaction of ATP with luciferin using a luminometer. Formazan formation was measured spectrophotometrically after different incubation periods. Evaluation was performed by phase contrast microscopy (toxicity), correlation of cell count and ATP concentration or absorption signal (Gompertz function) and propidium iodide (PI) staining to proof the cell lysis of all cells in spheroids.
RESULTS:
In 2D culture, all three assays showed a good correlation between the number of seeded cells and the ATP concentration or absorption data, whereas the MTS-assay showed the lowest specificity. In 3D culture, the spheroid sizes were directly related to the number of cells seeded. The absorption data of the WST-8 and MTS assay correlated only for certain spheroid size ranges, whereas the MTS-assay showed again the lowest specificity. Only the measured intracellular ATP content showed a linear correlation with all spheroid sizes ranging from 100–1000 μm. The WST-8 assay revealed the second-best sensitivity which allows the measurement of spheroids larger than 240 μm. Phase contrast observation of monolayer cells showed toxic effects of MTS after 6 h incubation and no signs of toxicity of WST-8. Staining with propidium iodide showed complete lysis of all cells in a spheroid in the ATP assay.
CONCLUSION:
Among tetrazolium-based assays, WST-8 is preferable to MTS because of its non-toxicity and better sensitivity. When determining the number of viable cells in the 2D system, caution is advised when using the ATP assay because of its two-phase slope of the correlation graph concerning cell number and intracellular ATP. In 3D systems of human chondrocytes, the ATP-assay is superior to the other two test systems, as the correlation graph between cell number and intracellular ATP is biphasic. Since differentiation processes or other metabolic events can influence the results of proliferation and toxicity assays (determination of viable cells), this should be taken into account when using these test systems.
Introduction
Joint cartilage is a whitish to transparent viscoelastic tissue that covers the opposite bone surfaces of the joints. The smooth surface of healthy hyaline cartilage ensures the deformability, the mechanical resilience and the low-friction gliding function of the joint [1]. The articular cartilage is free of blood and lymph vessels, and nerves and consists mainly of metabolically active chondrocytes that synthesize and remodel extracellular matrix components such as collagens, glycoproteins, proteoglycans and hyaluronan [2]. These cells are isolated in a voluminous extracellular matrix (ECM) and are only supplied by diffusion via a nutrient/waste exchange through the synovial fluid. Both the relatively high matrix to cell volume ratio and the lack of blood vessels and nerves can be reasons for the low regenerative potential, which predisposes the tissue to degenerative conditions such as osteoarthritis [3]. For this reason, the maintenance of healthy articular cartilage is of utmost importance for pain-free mobility, especially in old age. The unique complex structure of cartilage represents a major challenge for the treatment, repair or restoration of cartilage defects. Traditional surgical procedures with a low success rate compete with cell-based therapies to regenerate cartilage defects [4–6]. The usual basis for cell-based implants is the isolation of human chondrocytes from cartilage biopsies [7]. The challenges of these regeneration approaches lie in the development of tissue-like implants with biophysical, biochemical and structural properties similar to native articular cartilage. The main research requirement of cartilage regeneration is the culture of viable and differentiated human chondrocytes preferably in a 3D culture environment [3]. For the development and application of cell-based implants, it is therefore of great importance to monitor the proliferation potential, viability and toxicity within the research and application process. A variety of different easy-to-use, fast, quantitative, and sensitive standard assays are on the market to address this problem [8, 9]. An exact, but time-consuming and operator-dependent method for quantifying cell number and cell proliferation is direct cell counting with a haemocytometer. Other simple and fast methods are the incorporation of DNA synthesis markers such as radioactively labelled thymidine (3 H thymidine) into DNA [10] and the integration of 5-bromo-2’-deoxyuridine (BrdU) instead of thymidine for monitoring DNA synthesis and cell proliferation [11]. In addition to these extrinsic markers, intrinsic markers could also be identified via specific antibodies, e.g. the proliferative cell nucleus antigen (PCNA) or the Ki67 protein. Techniques based on flow cytometry or the use of cell counters can enable exact and highly reproducible quantification of cells, but are associated with high costs for consumables. The second-generation water-soluble tetrazolium-salt (e.g. XTT, WST-1, WST-8) based methods can be used to estimate the number of viable cells in a real-time multiwell plate format. The assumption that the dye reduction is proportional to the number of viable cells in the exponential growth phase usually offers a good approximate value under defined growth conditions, which is averaged over the cell cycle depending on cell type. In contrast to the common view that the reduction of tetrazolium salts is generally intracellular (e.g. NBT, MTT), most newly developed tetrazolium compounds (e.g. XTT, WST-1, WST-8) are reduced extracellularly by electron transport across the plasma membrane [12]. The principle of tetrazolium salt assays is based on the slight reduction of the positively charged quaternary tetrazole ring core with the four nitrogen atoms (Fig. 1), which is surrounded by three aromatic groups. The colourless tetrazolium structures are transformed into colourful formazan products by breaking the tetrazole ring. MTS [13], as a weakly acidic inner salt, can cross the plasma membrane due to its lipophilic properties and can therefore be reduced intra- and extracellularly with PES as a photochemically and pH stable electron mediator [14]. WST-8 [15], with two negatively charged sulfonate groups, cannot overcome the membrane potential of the cells and is only reduced extracellularly via the photochemically stable intermediate electron mediator 1-metoxy-PMS (Fig. 2) [12, 16]. Another way to determine the number of viable cells in culture is the quantification of the amount of ATP present in metabolically active cells. This endpoint measurement is based on the fact that all cells require adenosine triphosphate to remain alive and function. ATP is the universal energy source in living organisms and cell injury or cell death will result in a rapid decrease in cytoplasmic ATP [17]. ATP released from lysed cells converts in combination with the cofactor Mg2 + the luciferin into a form that can be catalytically oxidised by the enzyme luciferase in a chemiluminescent reaction (Fig. 3). The resulting luminescent signal is directly proportional to the amount of ATP present.
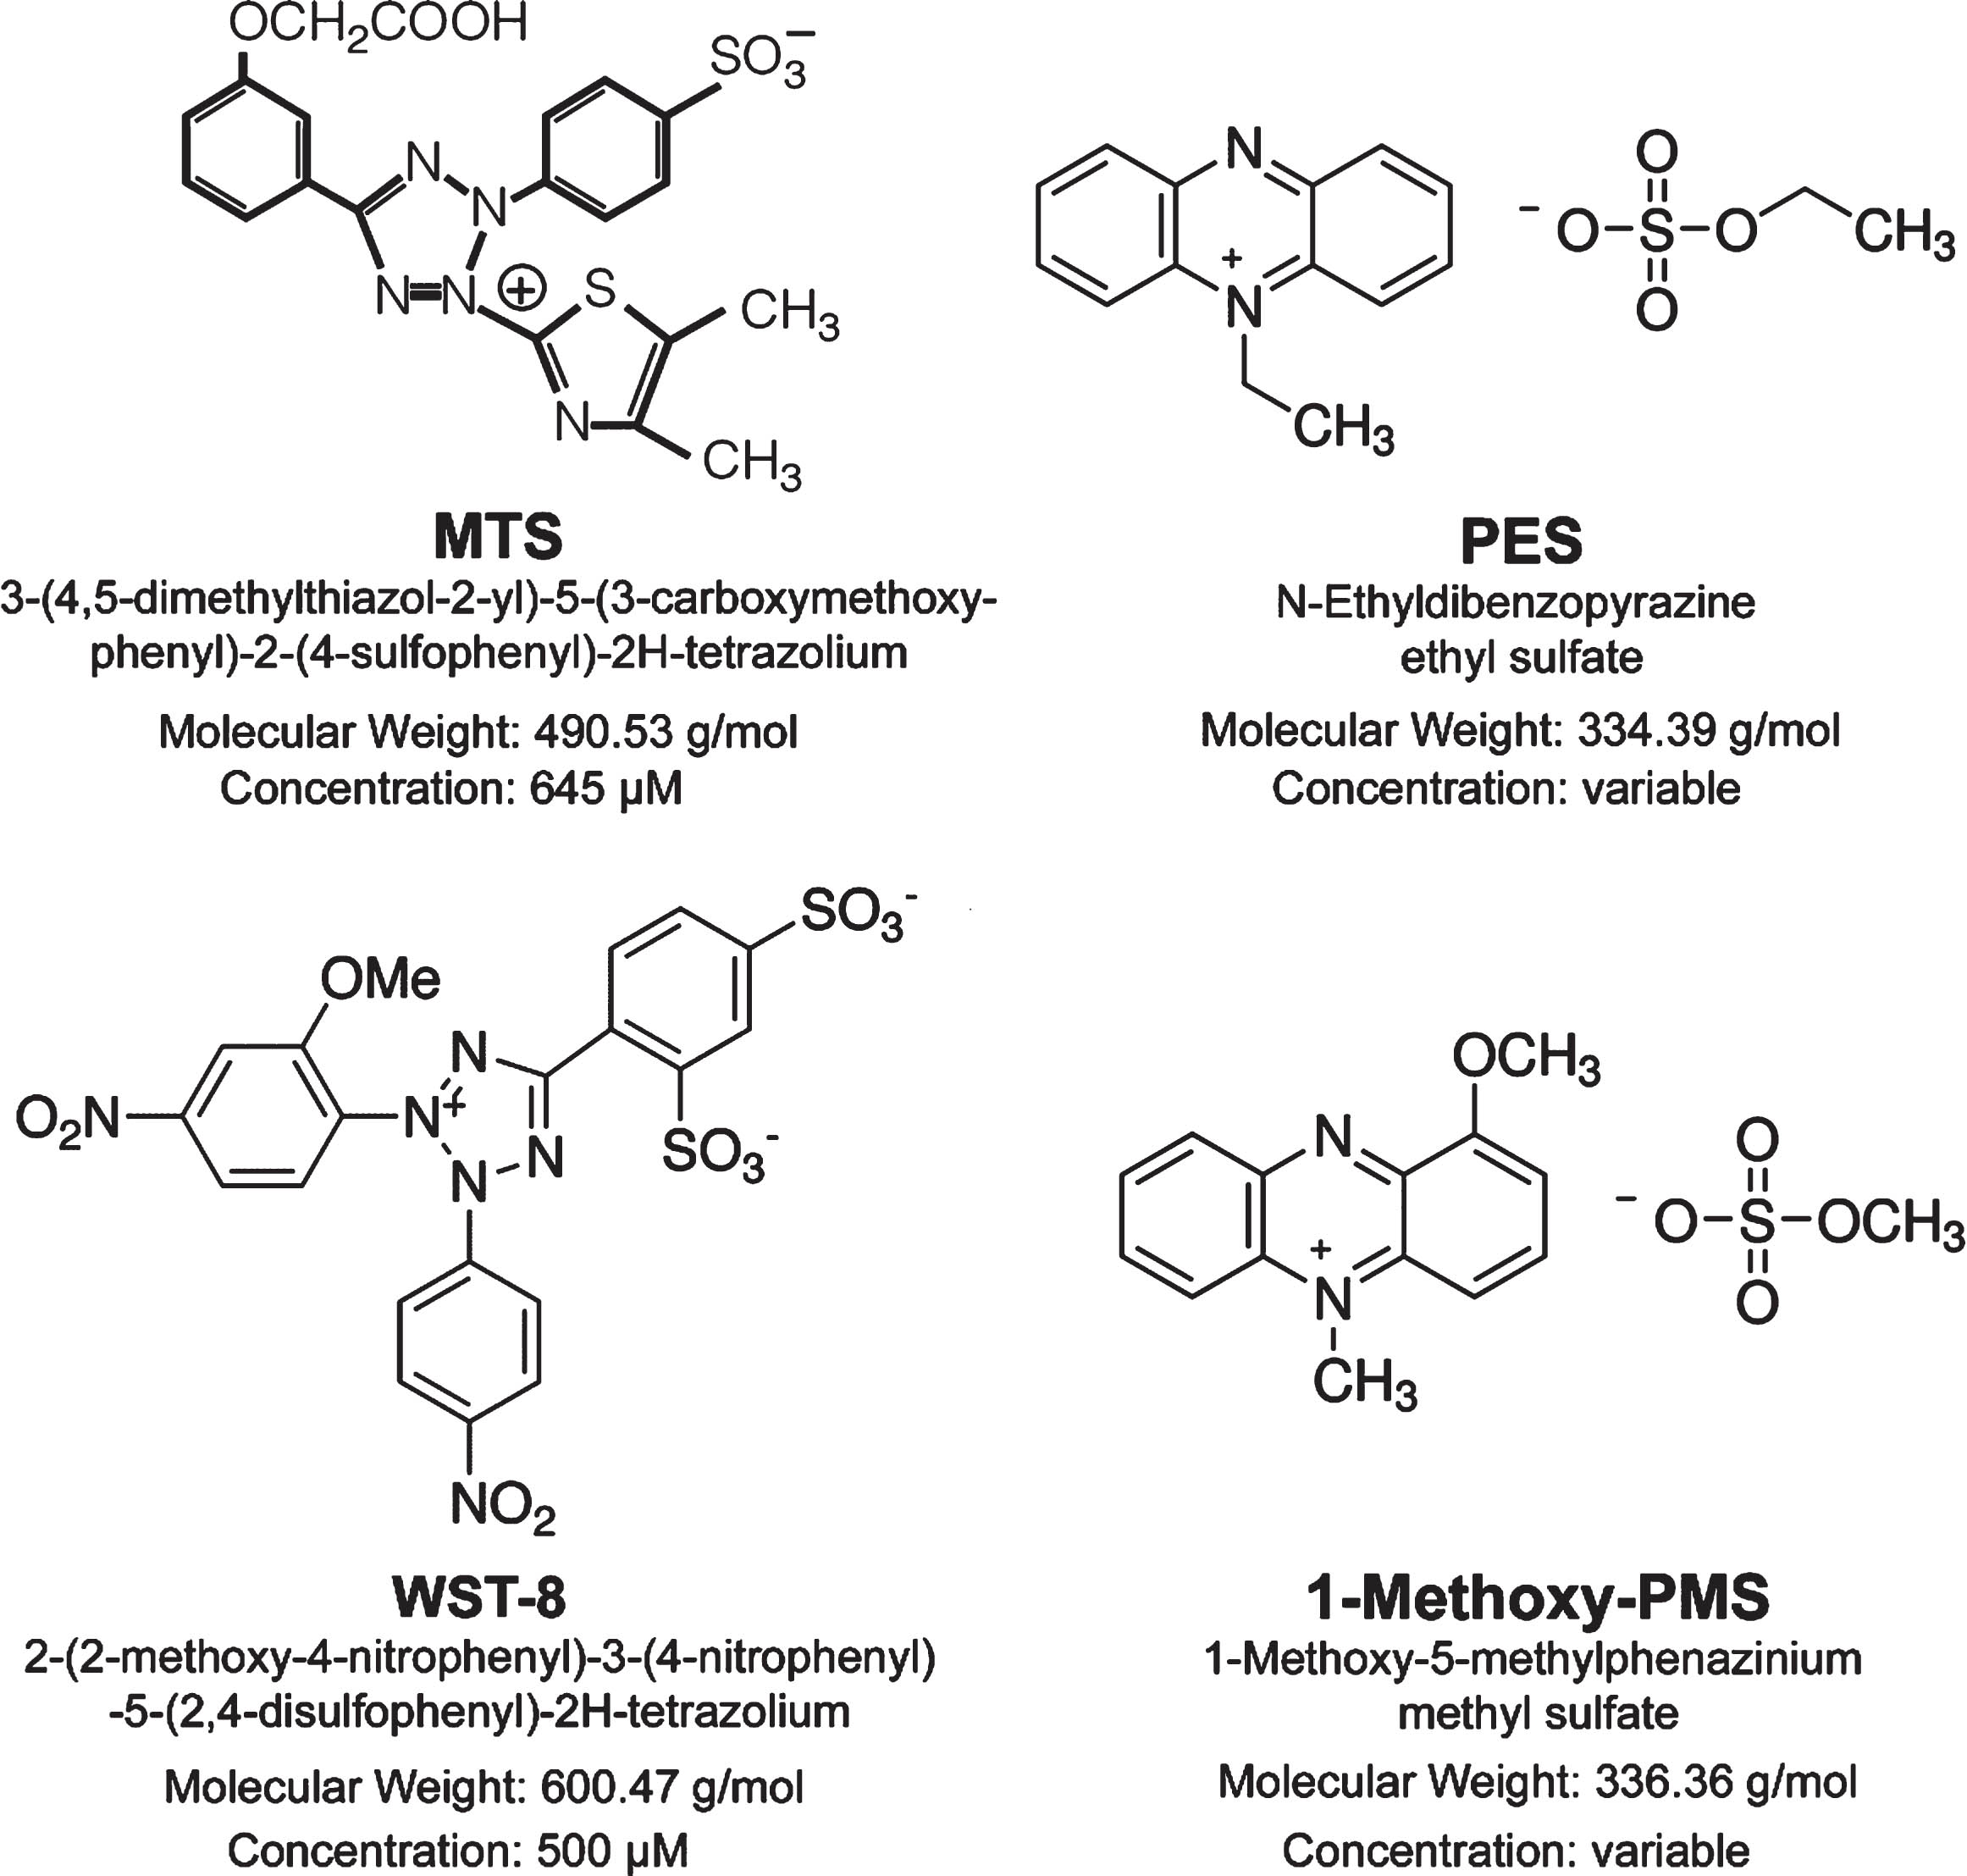
Chemical structures of the tetrazolium salts MTS and WST-8, and of the intermediate electron acceptors 1-Metoxy-PES and 1-Methoxy-PMS.
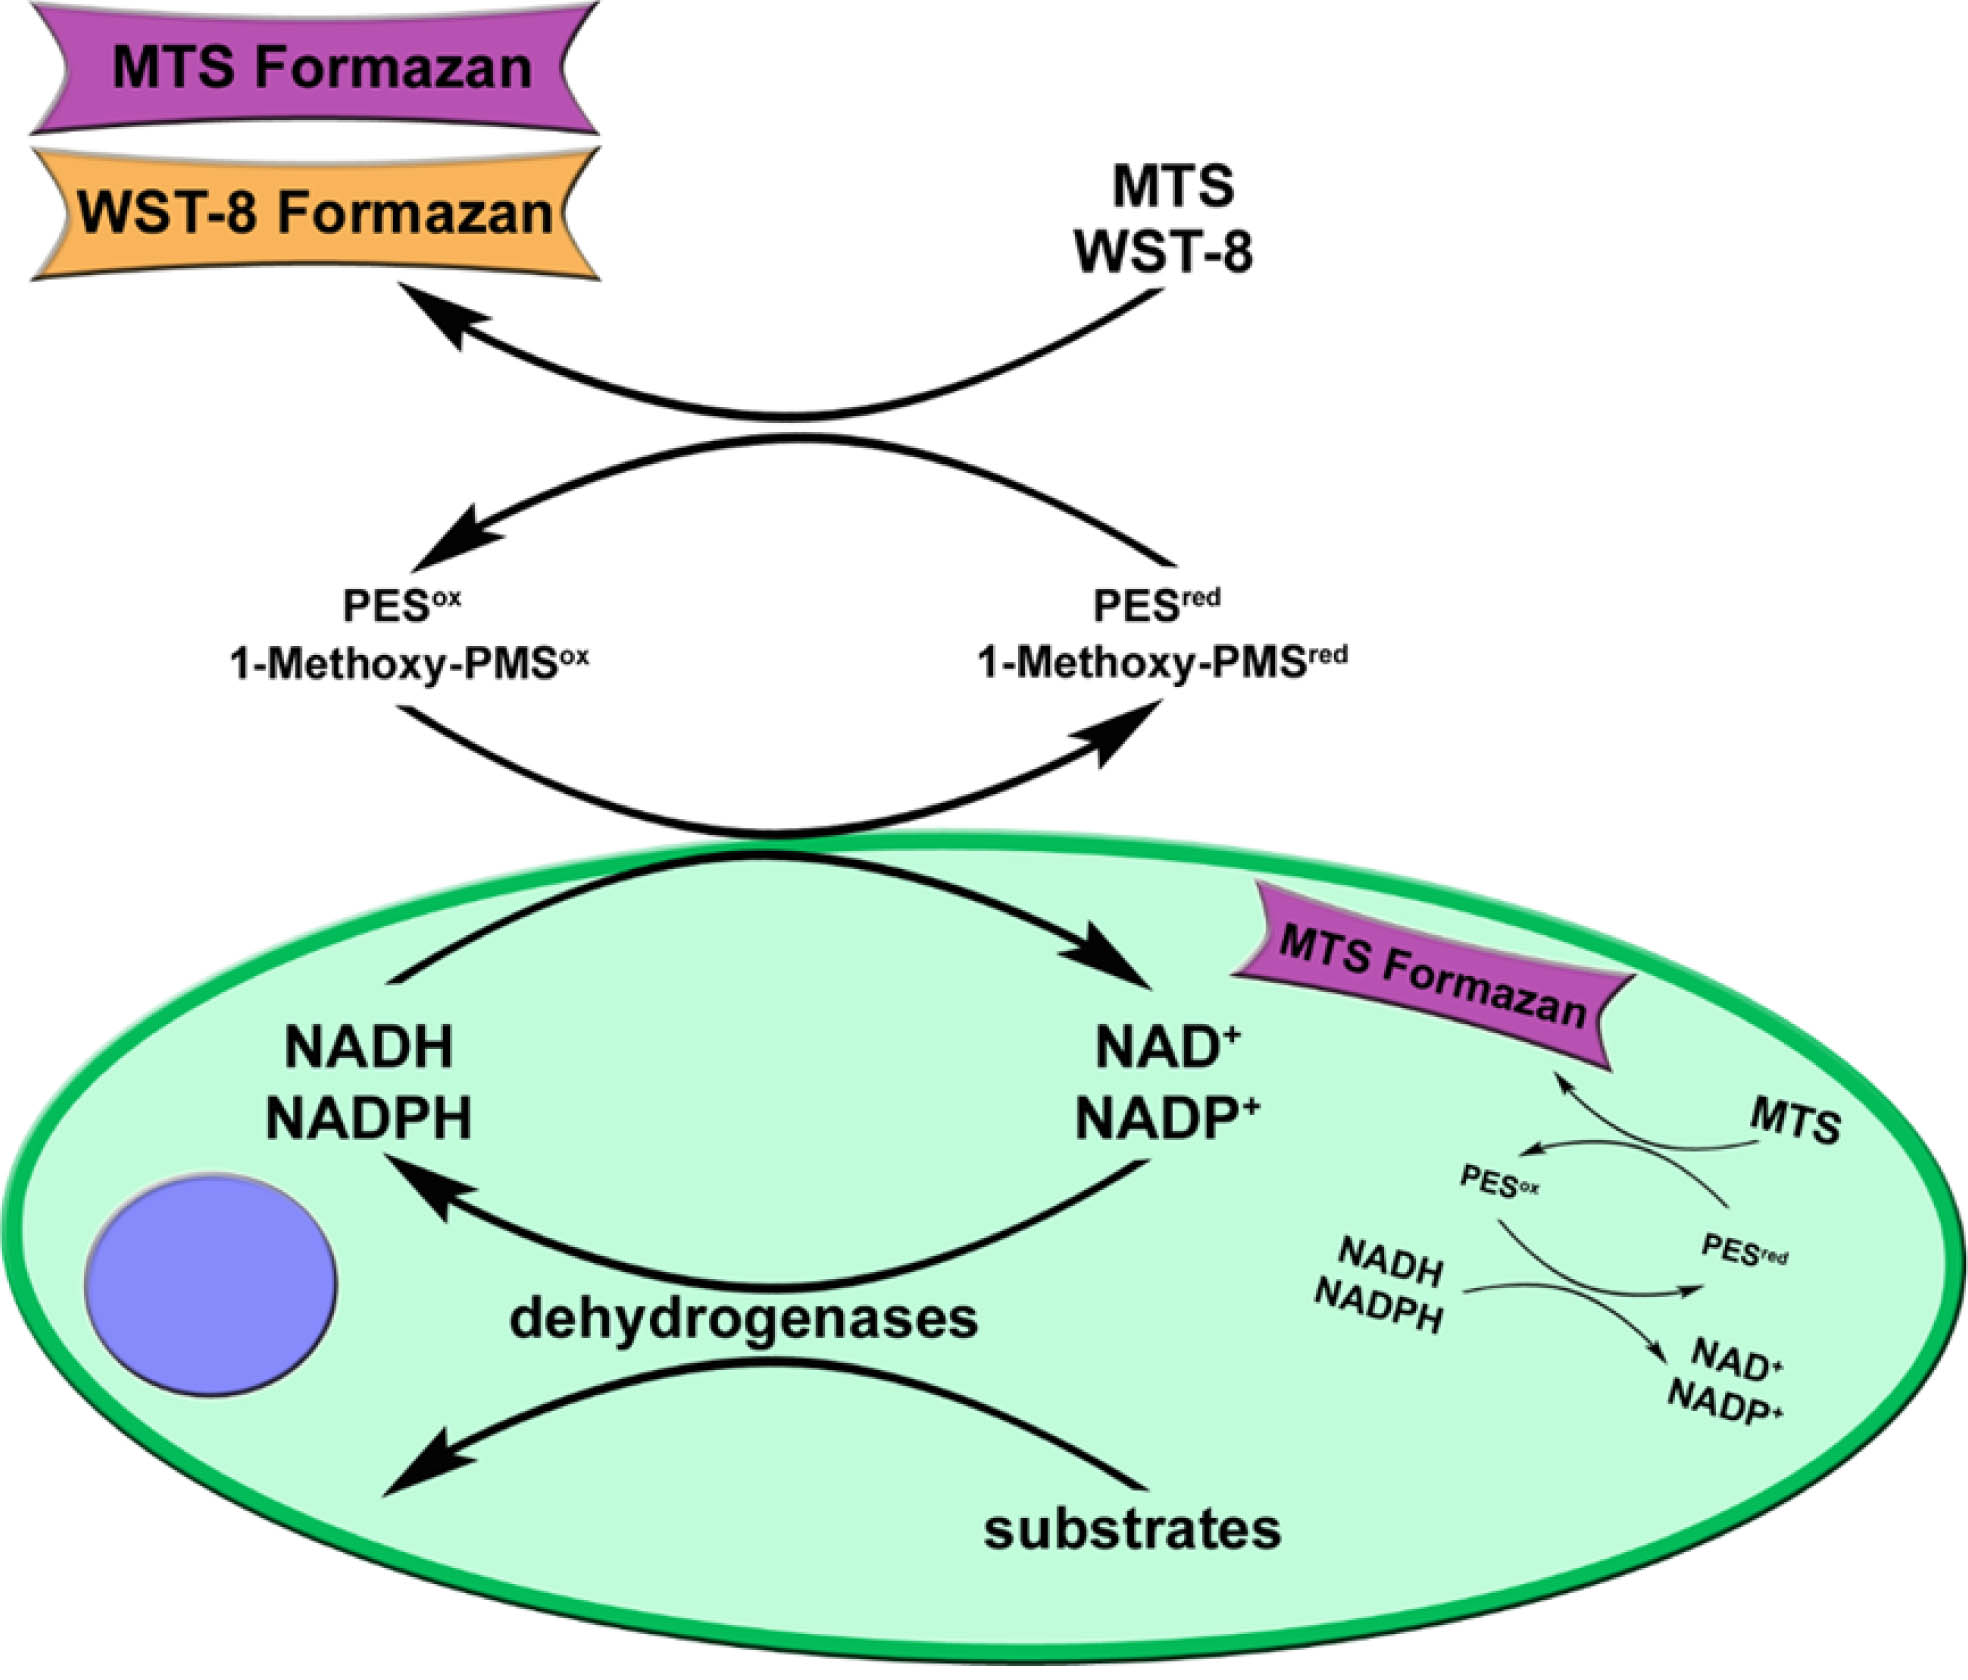
Schematic model of the mechanism of cellular reduction of MTS and WST-8 substrates to a colored formazan. MTS, a weakly acidic inner salt, is reduced both intracellularly via NADH/NADPH produced by dehydrogenase enzymes and extracellularly via trans-plasma membrane electron transport. The intermediate electron acceptor is PES. WST-8, a negatively charged inner salt, is due to its negative net charge only reduced extracellularly via the intermediate electron carrier 1-Methoxy-PMS. The main cellular reductive agent is NADH/NADPH.
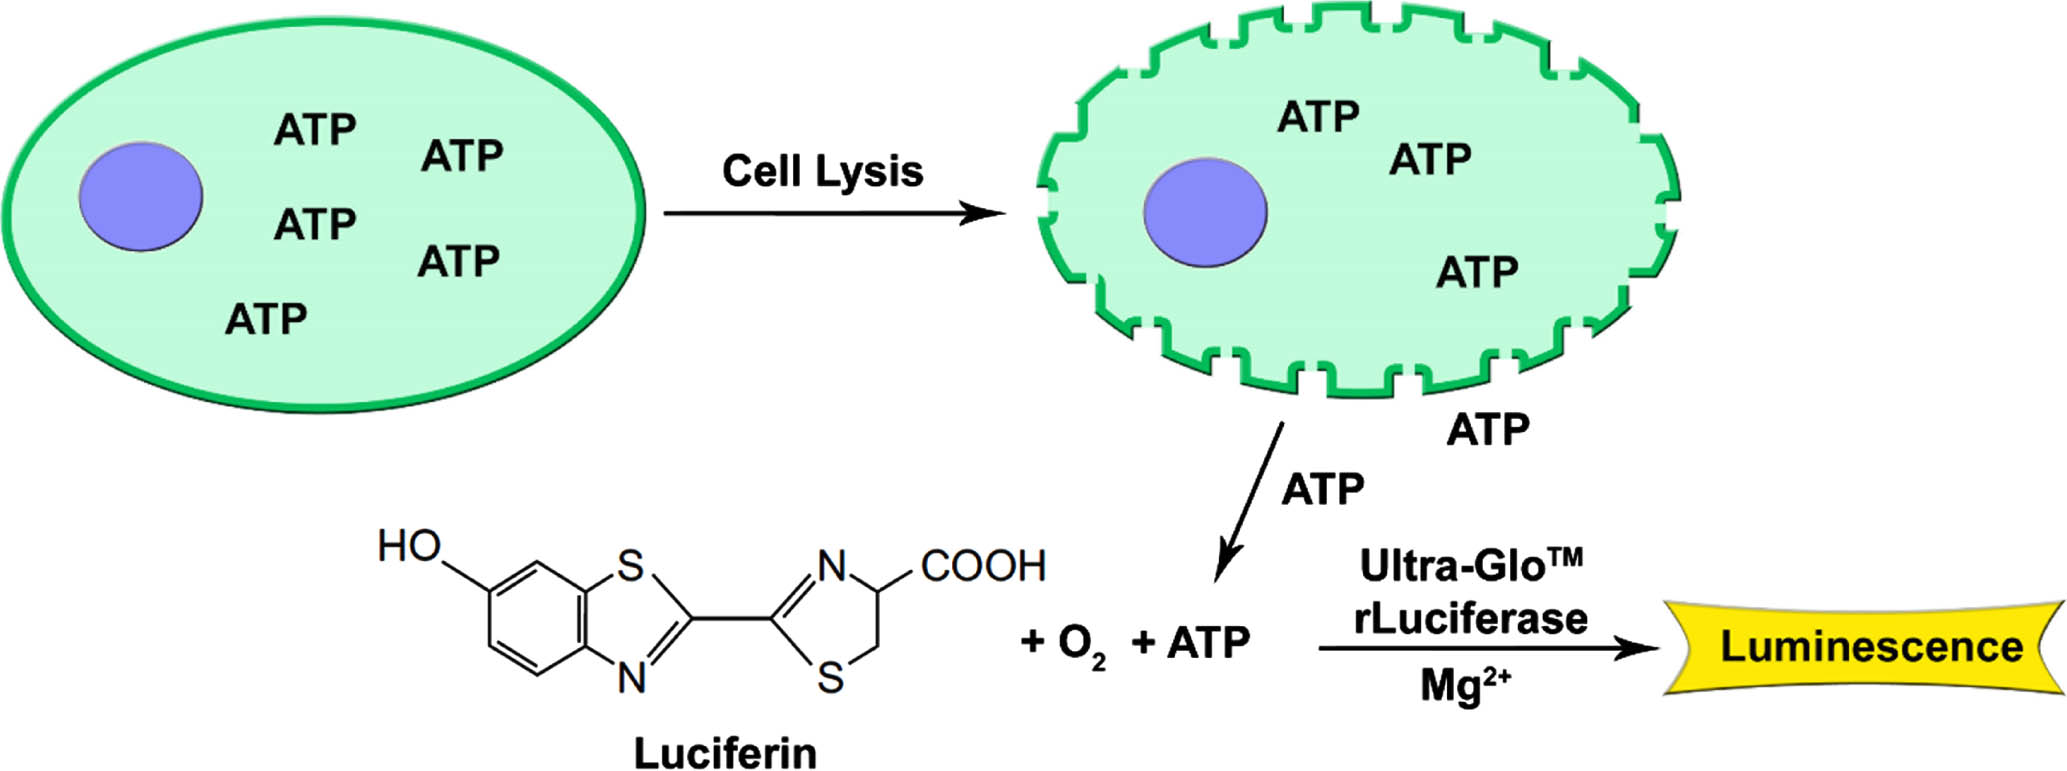
Schematic model of the luciferin-luciferase ATP bioluminescence mechanism. ATP as the energy source of viable cells is released after cell lysis. The monooxygenation of luciferin resulting in a luminescent signal is catalyzed by luciferase in the presence of ATP, molecular oxygen and Mg2 +.
To conquer the requirement of a scalable production of uniformly sized multicellular aggregates and the challenge of cell number determination in 3D culture systems, a reliable method to measure the number of viable cells in a 3D environment needs to be validated. Therefore, we compared real-time tetrazolium-based assays (MTS, WST-8) and the endpoint ATP-assays for suitability with 2D and 3D cultured chondrocytes.
Isolation and cultivation of chondrocytes as monolayer (2D culture)
Human chondrocytes were isolated from the femoral condyles of four patients undergoing total knee surgery. An informed, written consent was obtained from all patients. The study was performed in accordance with the ethical guidelines of Clinical Hemorheology and Microcirculation [18]. Isolation of chondrocytes was performed as previously described [19]. Briefly, chondrocytes were isolated by mechanical mincing of the tissue with a scalpel followed by enzymatic treatment (collagenase II, 350 U/ml in DMEM:Ham’s F12 (1 : 1), Biowest, Nuaillé, France). The closed tube was placed on a shaker (Thermomixer comfort, Eppendorf, Hamburg, Germany) at 300 rpm interval mixing and incubated at 37°C for 20 h. The isolated chondrocytes were centrifuged at 300 xg for 5 min. The supernatant was removed and the cell pellet was resuspended with 10 ml of DMEM:Ham’s F12 (1 : 1) with 4 mM L-glutamine (Biowest) and 10% human serum (German Red Cross, Cottbus, Germany). The chondrocytes were cultivated as monolayers at 37°C and 5% CO2. Cells were detached for subcultures using 0.05% trypsin/0.02% EDTA (Biowest), and plated at a defined ratio (1 : 3). Cells from passage two (P2) up to passage four (P4) were used for the experiments. A phase contrast microscope (CKX 41 with a DP 71 camera, Olympus, Hamburg, Germany) was used for observing the morphology of the cells.
Generation of spheroids (3D culture)
Spheroids were generated using a scaffold-free culture system developed by Ursula Anderer [7, 19]. To allow the formation of spheroids with different sizes, human chondrocytes were seeded in agarose-coated 96-well plates in decreasing cell numbers performing serial dilutions (1 : 2) ranging from 300,000 to 590 cells/well. Spheroids were cultured in DMEM:Ham’s F12 (1 : 1) with 4 mM L-glutamine and 5% human serum. After 8 days in culture, the morphology was documented using phase contrast microscopy (CKX 41 with a DP 71 camera) and the size of the spheroids measured (CellD-Imaging software for Life Science Microscopy, Soft Imaging Systems, Muenster, Germany).
Performing the MTS and WST-8 in 2D culture
Chondrocytes were seeded in 96-well plates in serial dilutions ranging from 40,000 cells/well to 940 cells/well in a total volume of 100 μl. Each cell concentration was plated in triplicate. After 24 h incubation, the individual substrates were added according to the manufacturers’ instructions. For the MTS assay (Promega, Madison, WI, USA), 20 μl of the ready-to-use reaction mixture was added per well. For the WST-8 assay (Cell Guidance Systems, Cambridge, UK) 10 μl of the ready-to-use reaction mixture was added to each well. The absorbance was measured spectrophotometrically after multiple time periods of incubation (2, 4, 6, 8, 10, and 12 h) using the microplate reader FLUOstar Omega (BMG Labtech, Ortenberg, Germany). Absorbance measurements were performed using the following wavelengths: 490 nm for MTS and 450 nm for WST-8, with a reference wavelength of 655 nm. As control (blank) only medium was incubated with the appropriate reaction mixture (triplicate). These readouts were used as background control, which were subtracted from the absorbance values measured in the wells with cells.
Performing the ATP-assay in 2D culture
Chondrocytes were seeded in 96-well plates in serial dilutions ranging from 40,000 cells/well to 940 cells/well in a total volume of 100 μl. Each cell concentration was plated in triplicate. After 24 h, the assay was performed according to the manufacturers’ instructions: The well plates were equilibrated to RT for 30 min before adding 100 μl of the CellTiter-Glo 2.0 reagent (Promega) to each well. The contents were mixed on a shaker for 2 min to induce cell lysis and the plate was incubated for 10 min at room temperature (RT) to stabilize the luminescence signal. The luminescence signal was measured with the microplate reader FLUOstar Omega (BMG Labtech). As control (blank) only medium was incubated with the reagent (triplicate). The corresponding ATP concentration was calculated using the 2D standard curve (Fig. 5B).
Performing the MTS and WST-8 assays in 3D culture
Spheroids with different sizes formed on agarose-coated 96-well plates were transferred to uncoated 96-well plates prior to the addition of the reaction mixture to avoid any interference of the tetrazolium salts or the formazan products with the agarose. The performance of the assays and the spectrophoto-metrical measurement was in accordance to the procedure of monolayer cells (see 2.3.). The incubation periods for 3D cultures were 1, 2, 3, 4, 5, and 6 h, respectively.
Performing the ATP assay in 3D culture
Spheroids with different sizes formed on agarose-coated 96-well plates were transferred to uncoated 96-well plates prior to the addition of the reaction mixture to avoid interference of the luminescence signal with the agarose. According to the manufacturers’ instructions, the well plates were equilibrated to RT for 30 min before adding 100 μl of the CellTiter-Glo 3D reagent (Promega) to each well. The contents were mixed vigorously for 5 min to induce cell lysis and the plate was incubated for 25 min at RT to stabilize the luminescence signal. The luminescence signal was measured with the microplate reader FLUOstar Omega (BMG Labtech). As control (blank) only medium was incubated with the reagent (triplicate). The corresponding ATP concentration was calculated using the 3D standard curve (Fig. 7A).
ATP standard curve
For the 2D standard curve a serial dilution of ATP (ThermoFisher, Waltham, USA) in medium with a starting concentration of 4 μM was mixed with CellTiter-Glo 2.0 reagent for 2 min and further incubated for 10 min according to manufacturers’ instructions. For the 3D standard curve a serial dilution of ATP (ThermoFisher) in medium with a starting concentration of 2.5 μM was mixed with CellTiter-Glo 3D reagent for 5 min and further incubated for 25 min according to manufacturers’ instructions. The luminescence signal was measured with the microplate reader FLUOstar Omega. As control (blank) only medium was incubated with the reagent (triplicate).
Propidium iodide staining
After ATP measurement, spheroids were washed with PBS to remove CellTiter-Glo® 3D reagent and medium. Propidium iodide (PI) solution (Sigma-Aldrich Chemie GmbH, Munich, Germany) in PBS (60 μM) was added and the plates were incubated for 5 min at RT and 1000 rpm in the dark. Afterwards, the spheroids were fixed with 4% formaldehyde solution (Roth, Karlsruhe) for 1 h, harvested, embedded in Neg-50 frozen section medium (Richard Alan scientific, Kalmazoo, USA) and sectioned using a cryomicrotome (Microm GmbH, Walldorf,Germany). To visualize cell nuclei, sections were incubated with DAPI (0.1 μg/ml; Fluka, Seelze, Germany) solution for 30 min. The preparations were mounted in fluorescence mounting medium (DakoCytomation, Glostrup, Denmark) and analysed with a fluorescence microscope (OLYMPUS IX81) equipped with a Retiga 6000 (QImaging, Surrey, BC, Canada) camera and CellSens 1.14 imaging software (Olympus, Hamburg, Germany).
Statistical analysis
The results are presented as mean±SEM (standard error of the mean) of cells from four independent donors each in triplicate measurements.
Results
Viability analyses of chondrocytes in 2D culture
We analysed the number of viable and metabolically active cells in a 2D culture system using two different tetrazolium-based methods (MTS, WST-8). Chondrocytes were seeded on 96-well plates in a wide range of cell concentrations (940–40,000 cells/well). Formazan formation was measured spectrophotometrically after several incubation periods with MTS or WST-8 reaction mixture. Figure 4A-B represents the cell number per well as a function of absorption at several incubation times. The sigmoidal curve shows at first glance that a 2 h incubation with MTS or the WST-8 reagent is not suitable for the determination of cell quantities (signal saturation at low absorbance values). The choice of a 4 h incubation time as standard for both assays (recommended in the assay manuals) resulted in a maximum measurable absorption value of 2.0 for MTS, and 2.8 for WST-8. Figure 4C shows the slope of the curves calculated with the Gompertz function (A-B) in correlation to the incubation time. The slope of WST-8 with a linearity of 0.9976 refers to a higher sensitivity of this tetrazolium salt assay compared to MTS (linearity 0.9932). The results of the linear correlation analysis (Fig. 4D) revealed an applicable range of cell numbers suitable to perform the two tetrazolium-based assays. Using the MTS assay 940–10,000 and for the WST-8 assay 2,500–15,000 cells/well are ideal celldensities.
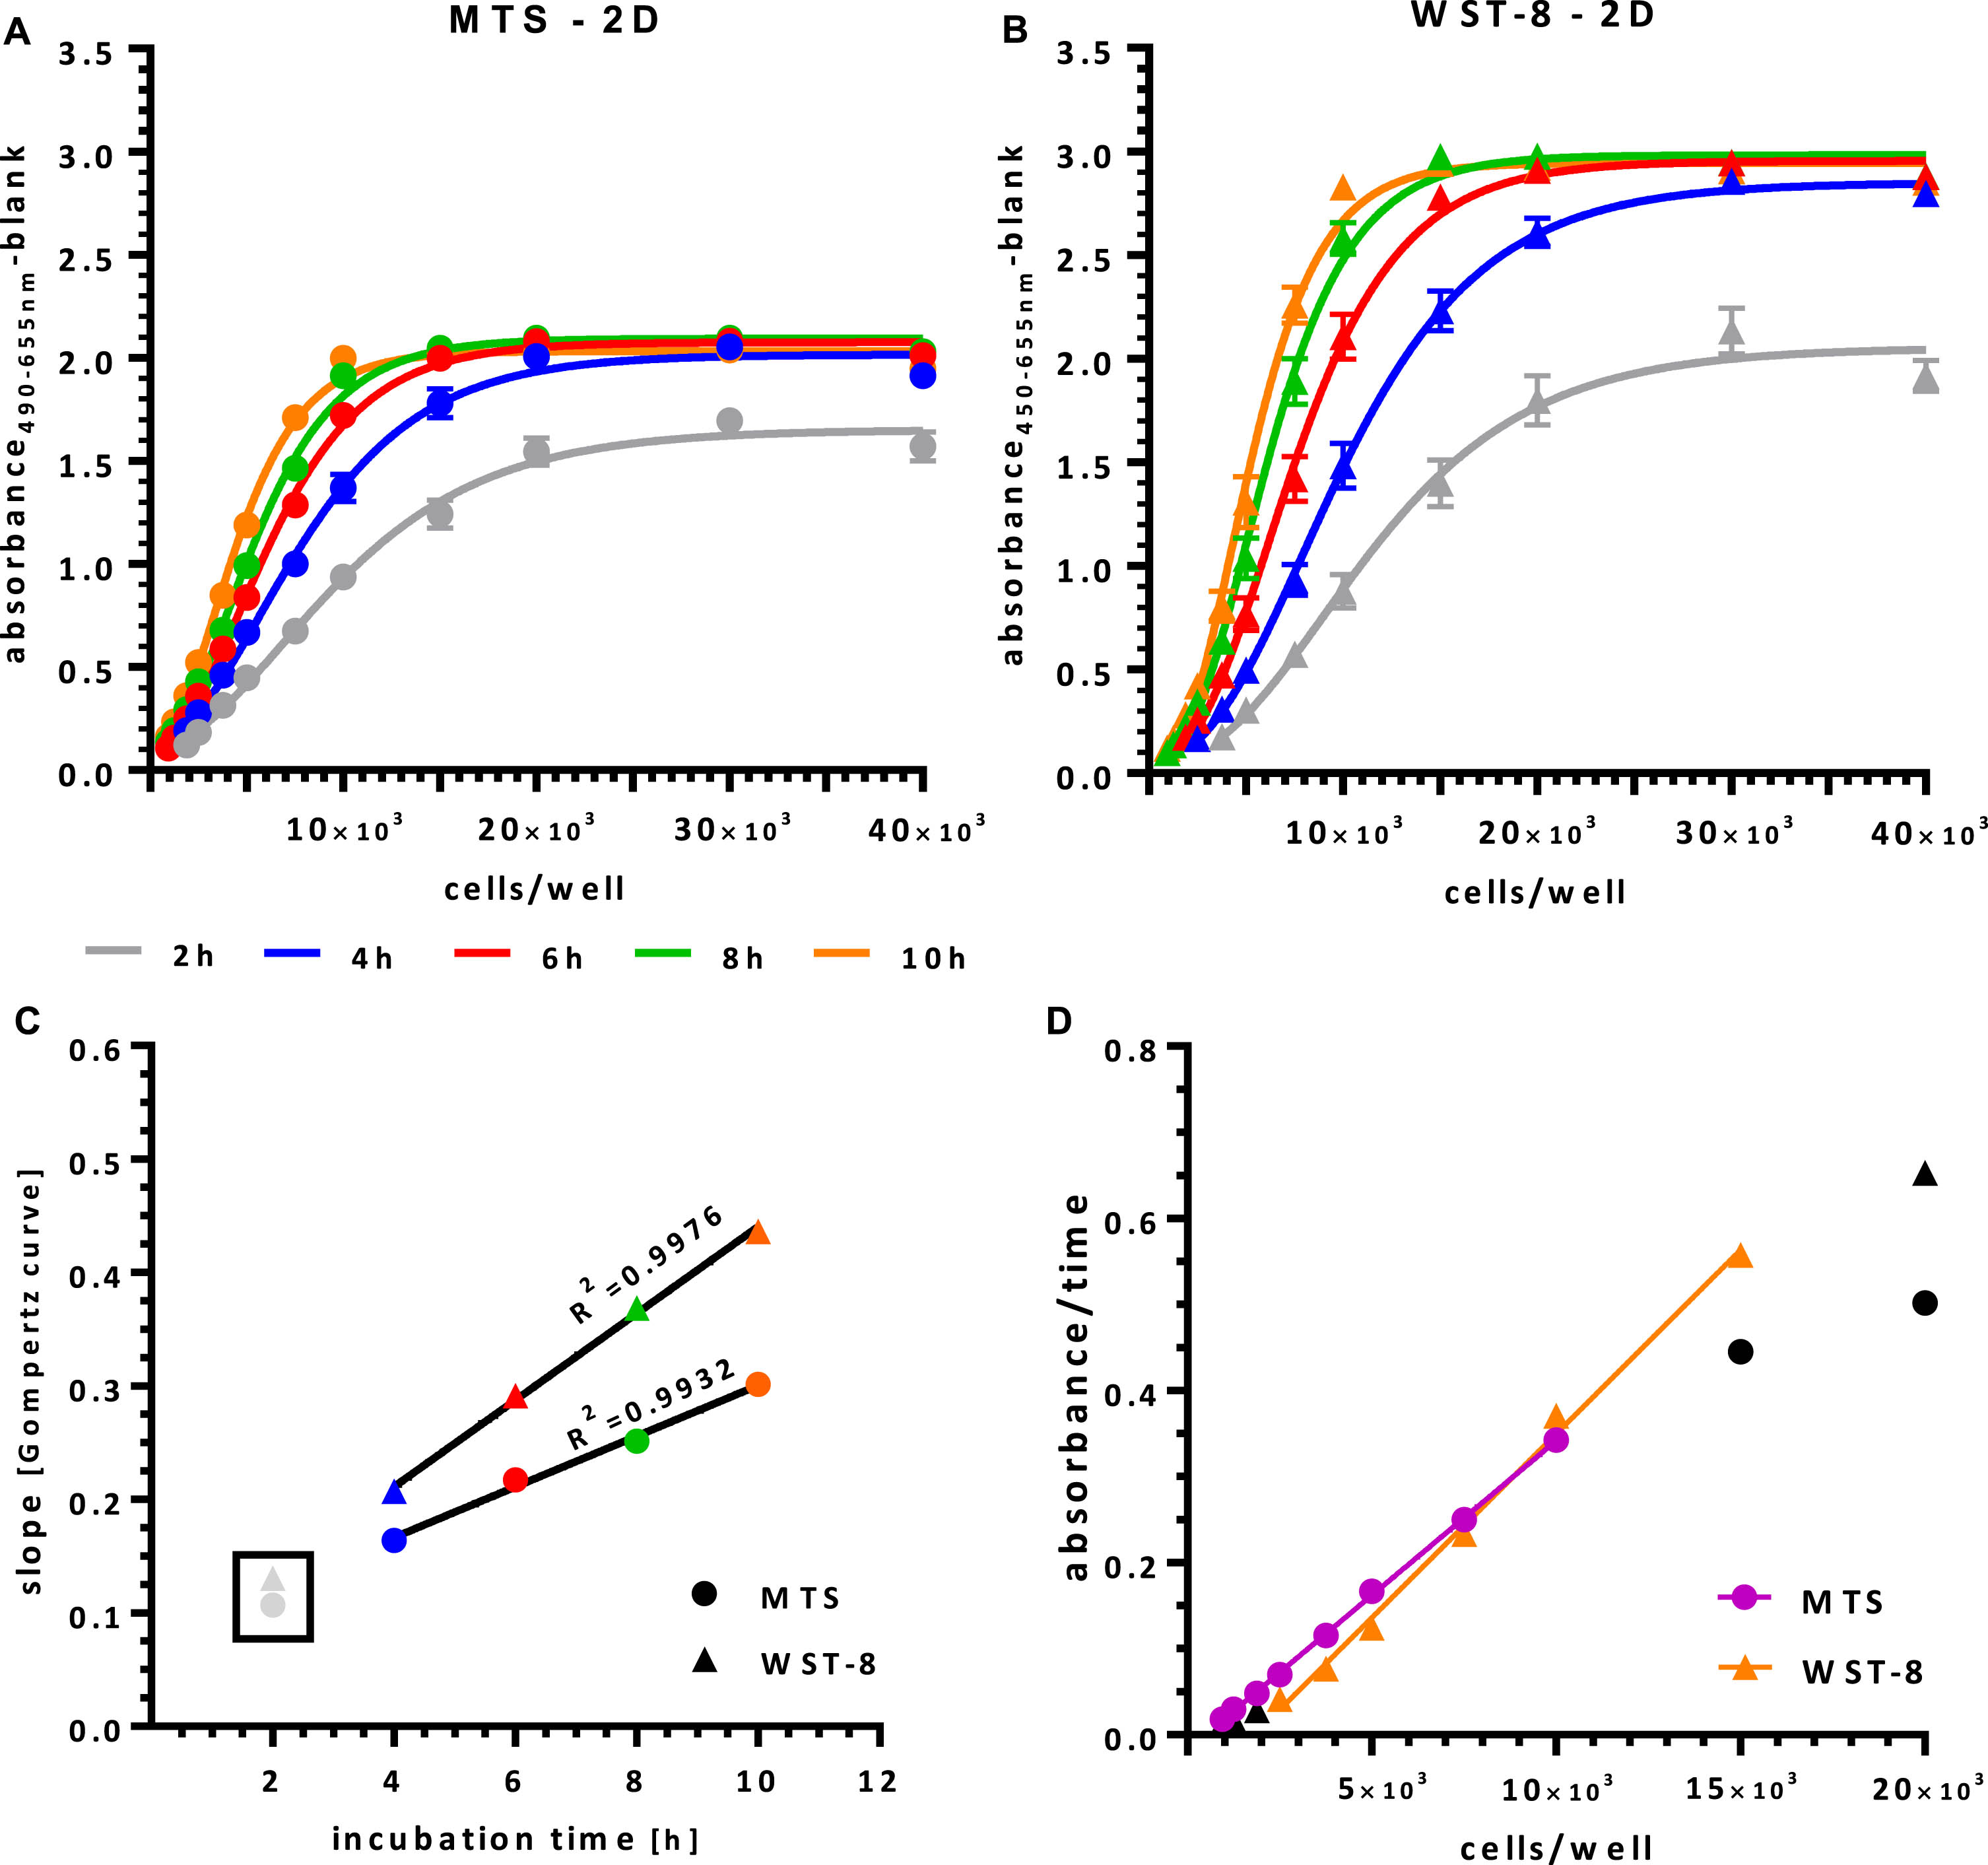
Kinetics of the metabolism of the two different tetrazolium salts MTS (A) and WST-8 (B) of adherent 2D cell culture. Human chondrocytes at cell concentrations indicated in the figure were preincubated for 24 h before the addition of the tetrazolium salts. After 2, 4, 6, 8, and 10 h incubation periods, the amount of formazan dye (A, B) was measured with a spectrophotometer. The slopes of the curves were calculated with the Gompertz function. Linear regression analysis was performed (C), showing a higher sensitivity for the WST-8 assay in comparison to MTS represented by the steeper slope of the curve. The 2 h incubation time was excluded (black square). (D) Plotting the cells/well against the absorbance/time reveals the measurable cell densities for MTS (940–10,000 cells/well) and WST-8 (2,500–15,000 cells/well) at 4 h incubation time.
The luciferase reaction was used to determine the ATP content of viable cells in monolayer culture. Chondrocytes were seeded on 96-well plates in a wide range of cell concentrations (940–40,000 cells/well). The luminescence was determined with a luminometer and converted into an ATP concentration using a standard curve (Fig. 5A). The ATP concentration showed a linear correlation with the cell number in a range of 900–10,000 seeded cells (Fig. 5B). Higher cell densities also showed a linear correlation of ATP concentration and cell number (10,000–40,000 cells/well) but with a smaller slope. Between these two cell density regions, the chondrocytes changed their morphology, becoming less elongated and more compact. Phase contrast images showed a reduced cell size, a changed cell structure with more round cells, and increased cell-to-cell contact (Fig. 5B).
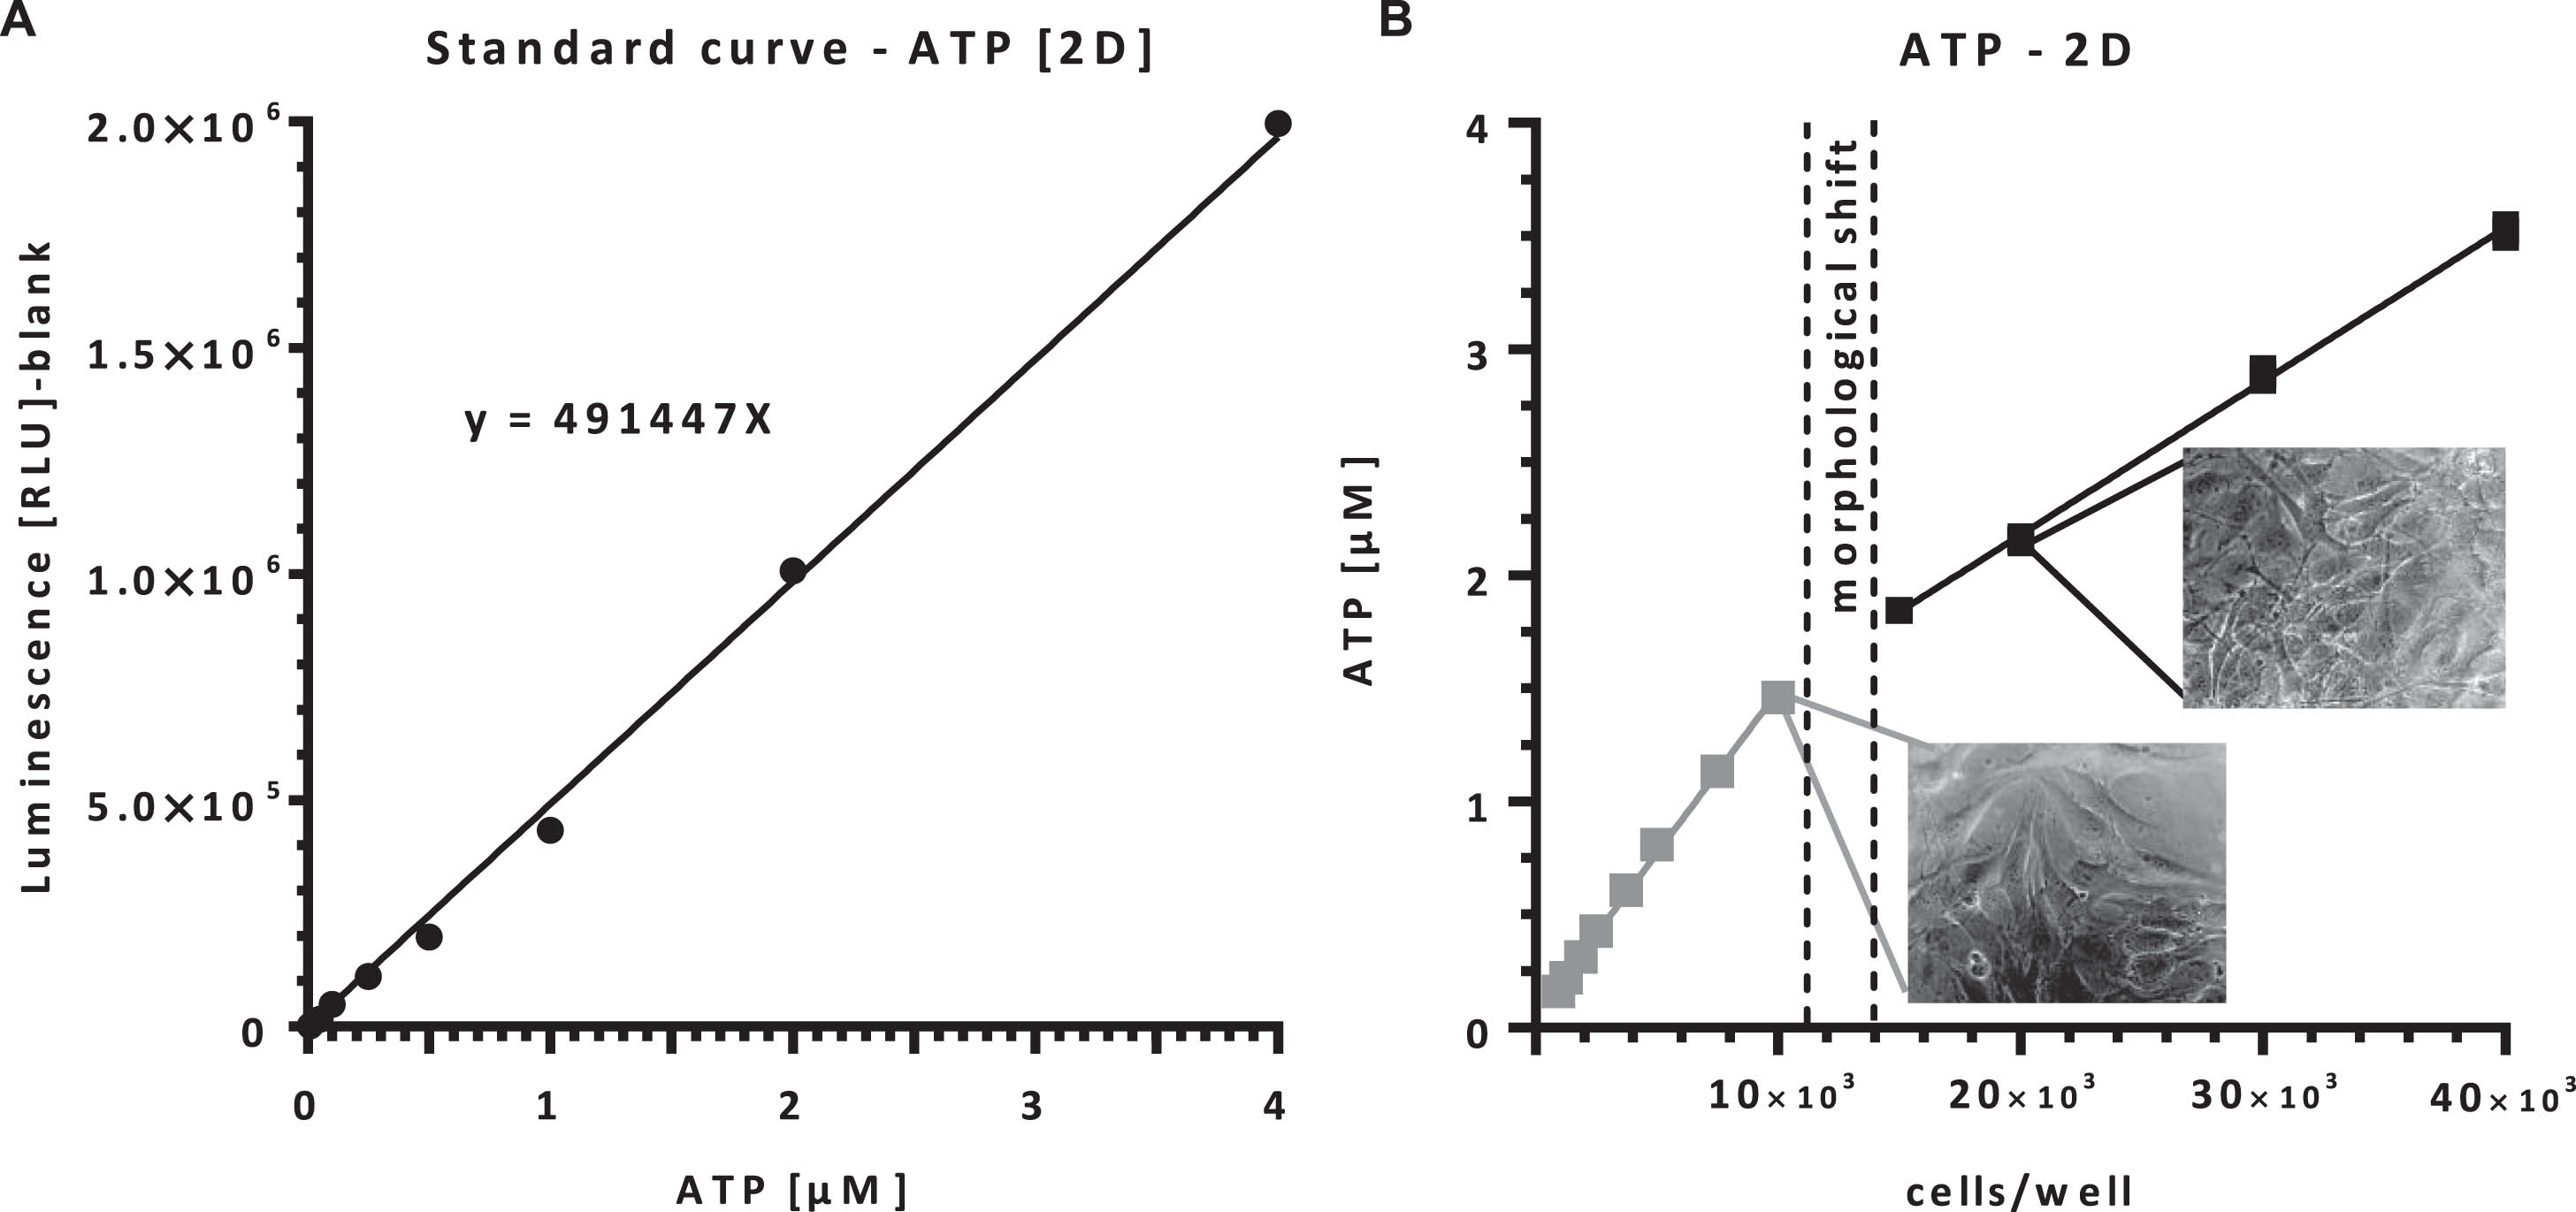
ATP content of 2D cultured cells. (A) The relative device-specific luminescence signal was converted into the absolute ATP concentration using the standard curve to enable comparability of the data. (B) Human chondrocytes at cell concentrations indicated were preincubated for 24 h before the addition of the CellTiter-Glo 2.0 reagent. The measured ATP concentration is directly proportional to the number of seeded cells. The slope of the straight-line changes at a special cell density (approx. 11,000 seeded cells/well), which is marked by a morphological shift of the chondrocytes (see phase contrast pictures). The linear correlation of the higher cell densities with the ATP content results in a smaller slope (black squares).
Human chondrocytes were cultivated for 8 days with different initial cell number (590–300,000 cells) on 96-well plates covered with agarose to enable the formation of spheroids. Formazan formation was measured spectroscopically after several incubation times (1 h– 6 h). In the 3D culture system, the maximum absorption values of spheroids with initial cell counts below 5,000 cells were 0.1. Due to these low absorption values, which are in the range of the background signals, the signal of spheroids with an initial cell count of less than 5,000 cells was neglected (cut-off). This aspect was observed in both assay systems (Fig. 6A-B). The absorption values measured in the 3D system in correlation to the initial cell number were very low. Spheroids of 15×104 cells with an incubation time of 4 h provided signals of 0.29 (MTS) and 0.41 (WST-8) (Fig. 6A-B). For the ATP endpoint assay, the luciferase reaction was used to determine the ATP content of viable cells in spheroid culture. The luminescence was determined with a luminometer and converted into an ATP concentration using a standard curve (Fig. 7A). The ATP concentration showed a linear correlation with the cell count in a range of 590–300,000 seeded cells (Fig. 7B). The spheroid size correlated linearly with the number of seeded cells (Fig. 8A). Spheroids measured by the ATP endpoint method were then stained with a combination of propidium iodide (whole spheroid) and DAPI (spheroid sections). Since lysed cells are positive for propidium iodide and all cells in large spheroids were stained with propidium iodide (Fig. 8B), cell lysis was successful even in large spheroids. Therefore, we can quantitatively determine the ATP concentration of spheroids up to 1000 μm with this assay system.
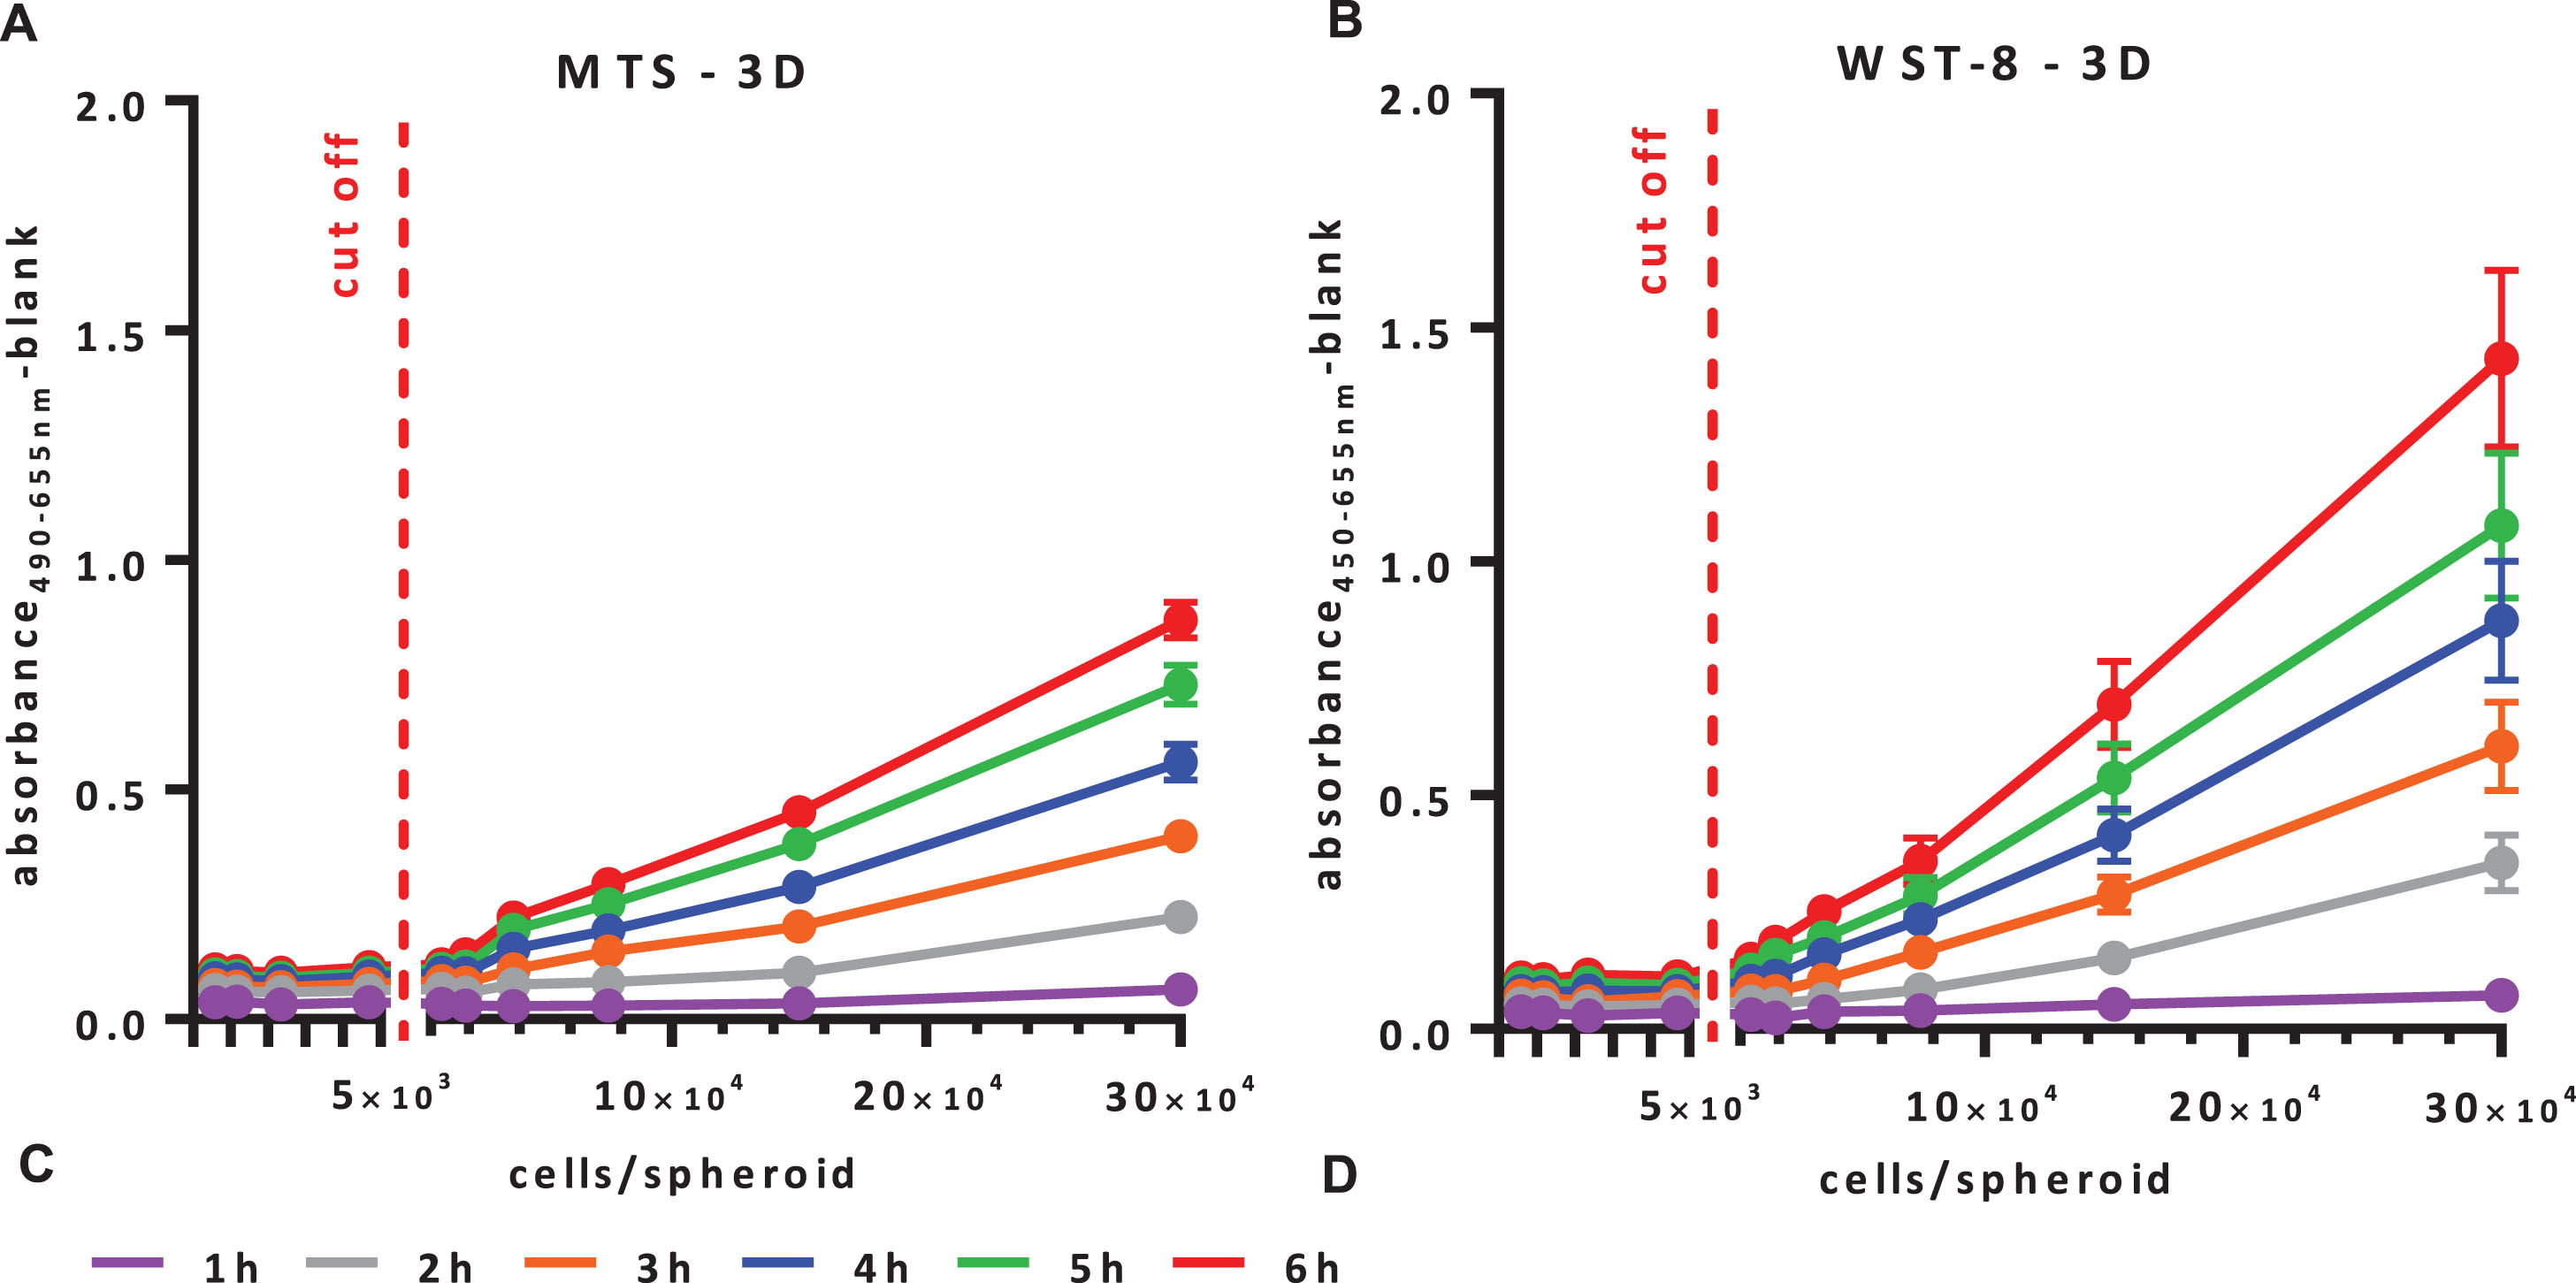
Kinetics of the metabolism of two different tetrazolium salts MTS (A) and WST-8 (B) in 3D culture. Chondrocyte spheroids of different sizes, which are represented by cells/spheroids, were preincubated 8 days before the addition of the tetrazolium salt solution. After different incubation times, the absorption was measured with a spectrophotometer. The cutoff is set to 5000 cells/well. Spheroids with fewer cells cannot be measured with the assay systems used.
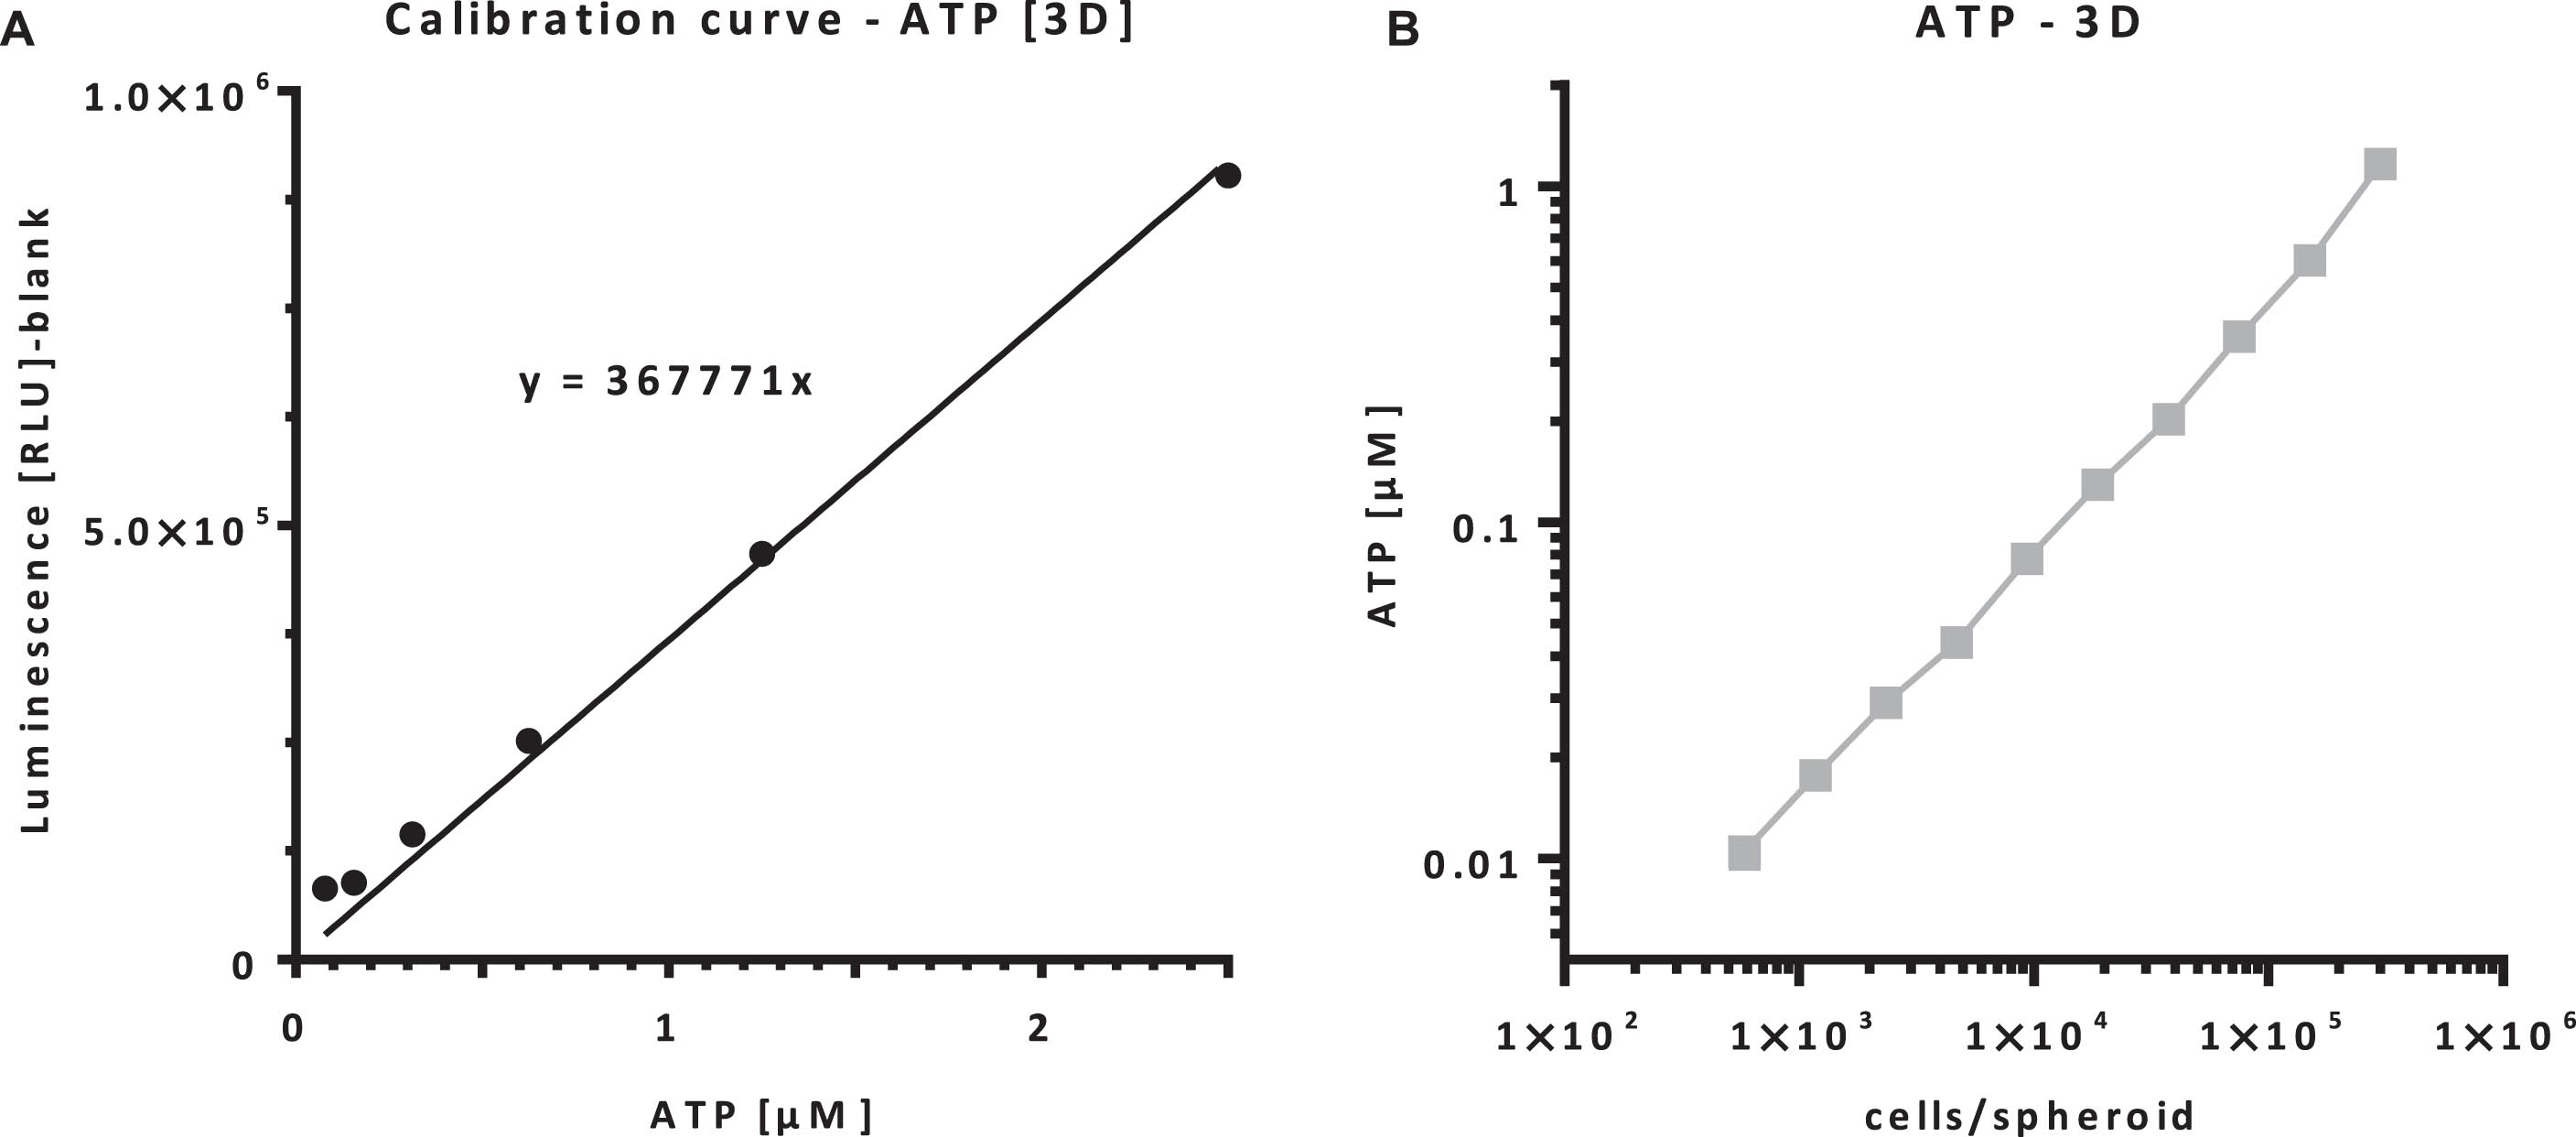
ATP release of 3D cultured cells. (A) The relative device-specific luminescence signal was converted into the absolute ATP concentration using the standard curve to enable comparability of the data. (B) Human chondrocytes at cell concentrations indicated were preincubated for 8 d before the addition of the CellTiter-Glo 3.0 reagent. The measured ATP concentration is proportional to the seeded cell number.
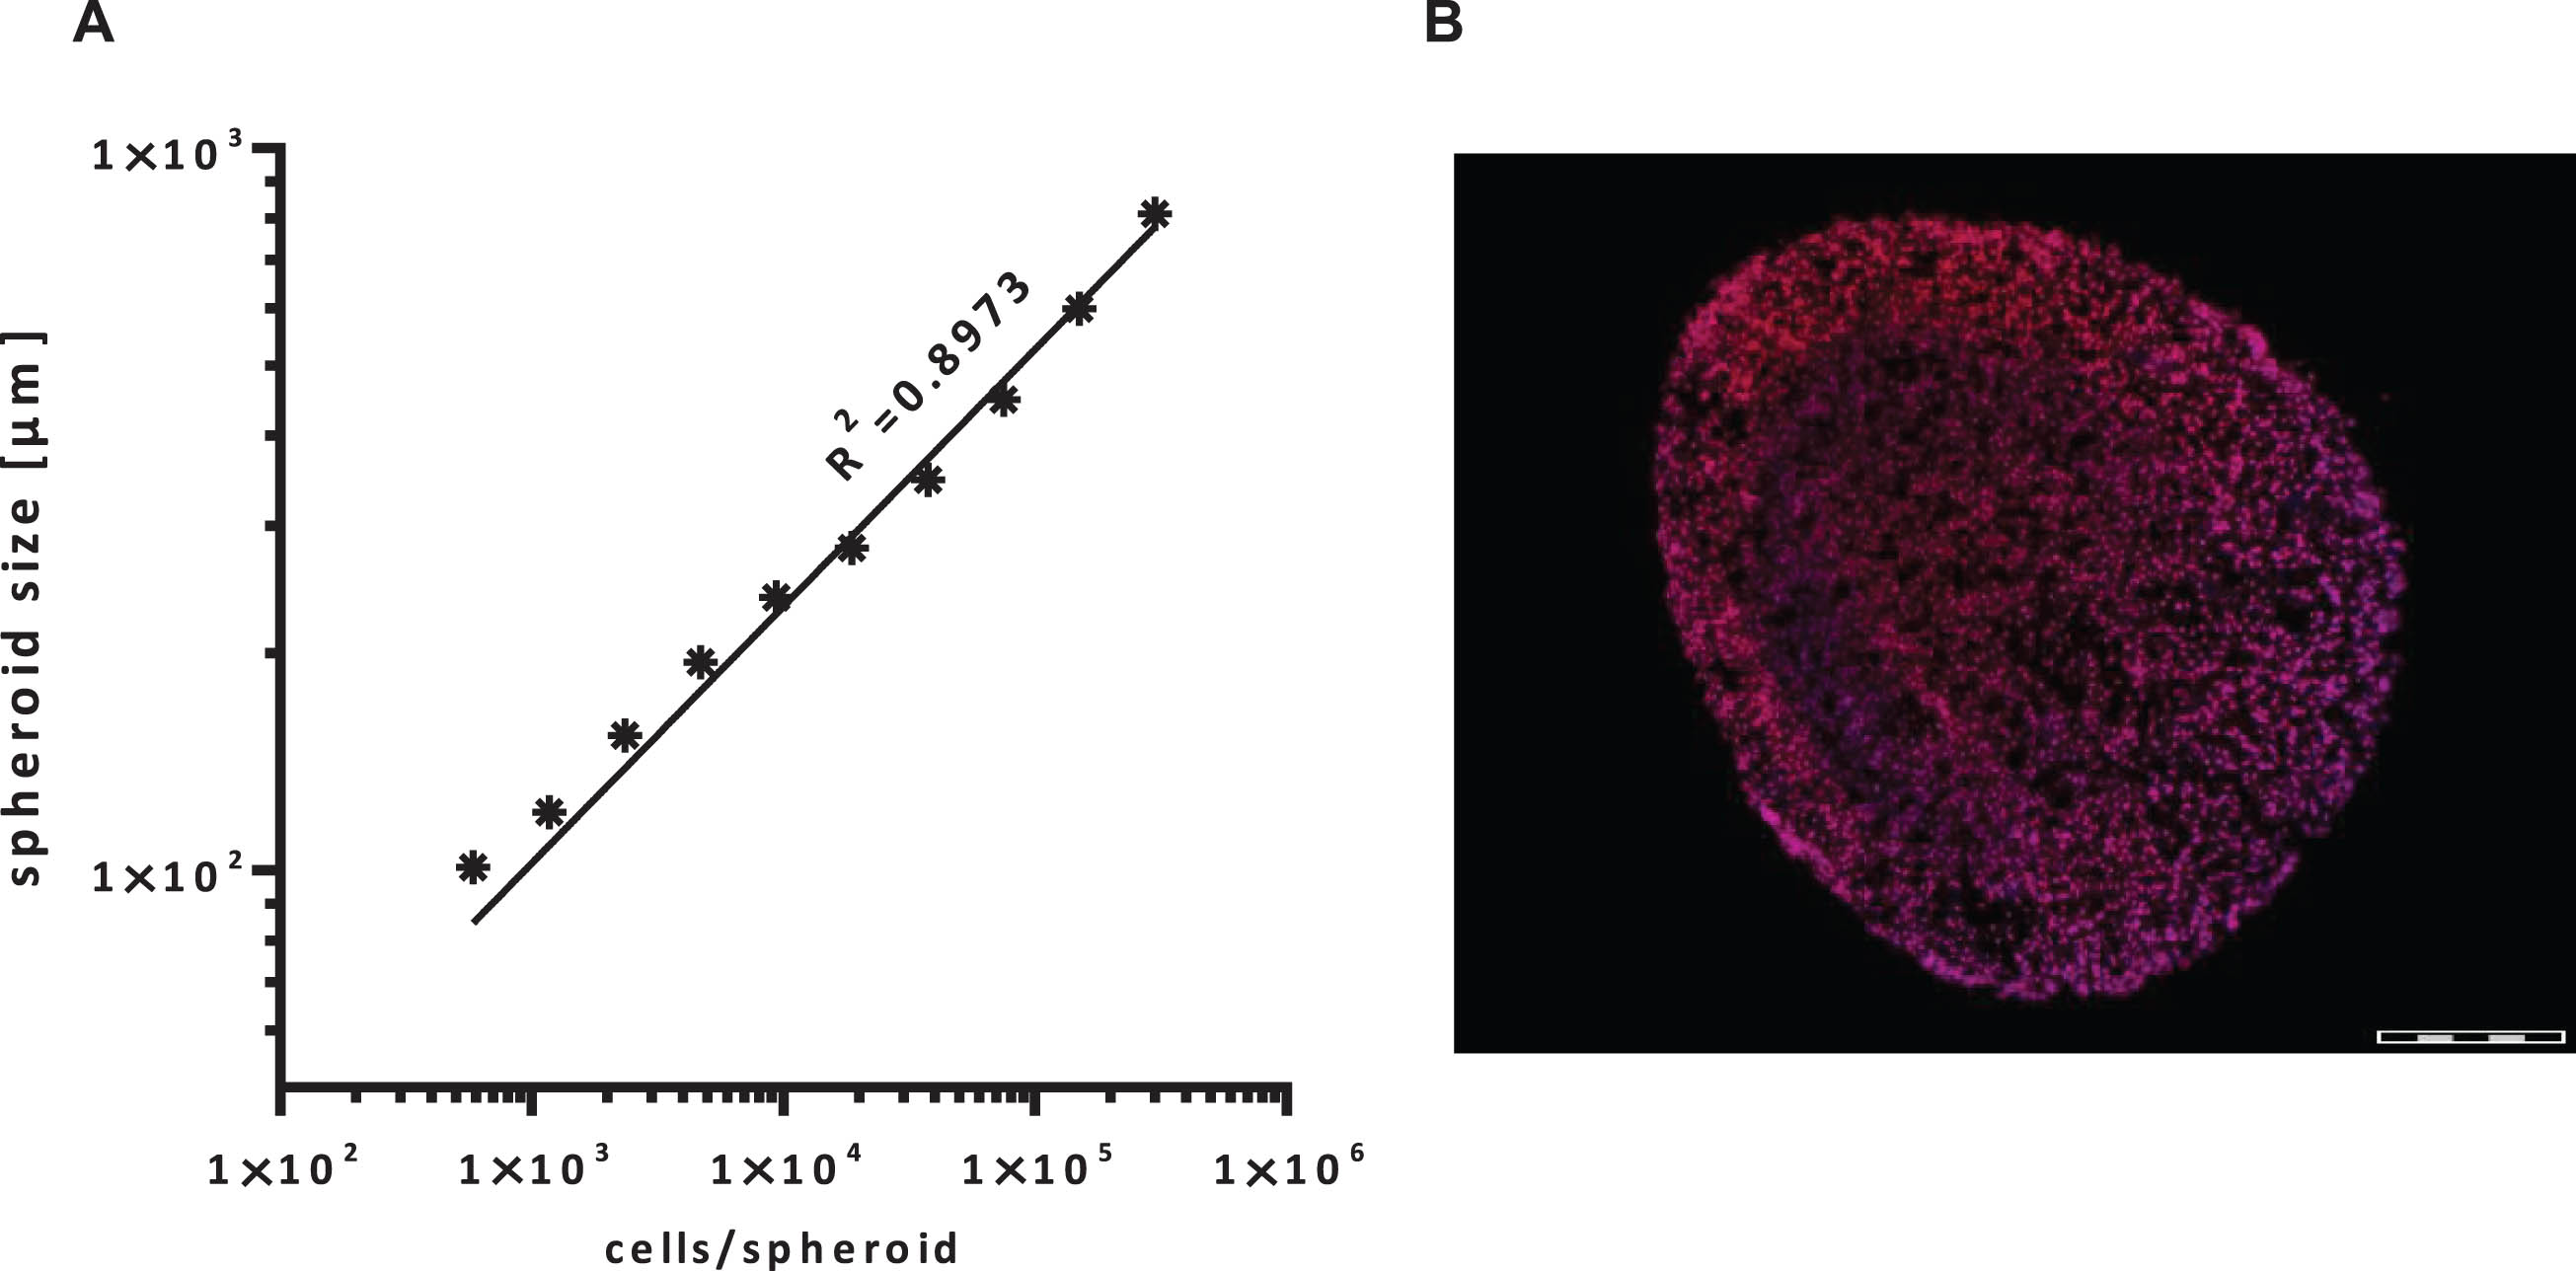
The spheroid size (A) shows a linear correlation to the seeded cell number. (B) Propidium iodide staining of a spheroid with a diameter of 850 μm after ATP measurement. All cells within the spheroid are lysed with this assay. [Scale bar: 200 μm].
Figure 9 shows the relationship between the intracellular ATP content (Fig. 9A) and the absorption values (B, C) of cells in 2D and 3D culture. On the one hand, there is a linear function of the ATP concentration as well as the absorption values of 2D cultured chondrocytes (circles) with respect to the cell densities of the analysed data (Fig. 9A–C). On the other hand, there is also a correlation of the absorption values of 3D-cultured chondrocytes (squares) with respect to the initial cell count per spheroid. The transfer of the values measured in the 3D system to the values measured in the 2D system results in a virtually adjusted cell count for the 3D spheroids (calculated using the equations shown in Fig. 9A–C). This conversion of the measured values enables an independent comparison of the three methodically different test systems in relation to the cell count of the spheroid. These “correlating” cell numbers are shown in Fig. 9D as coloured columns. It becomes clear that the results of ATP assay and WST-8 assay correlate well starting at an initial 3D cell count of 5000, while the MTS values are significantly lower. The ATP-assay also shows a linear dependence for smaller cell numbers, which increases the application range for 3D measurements.
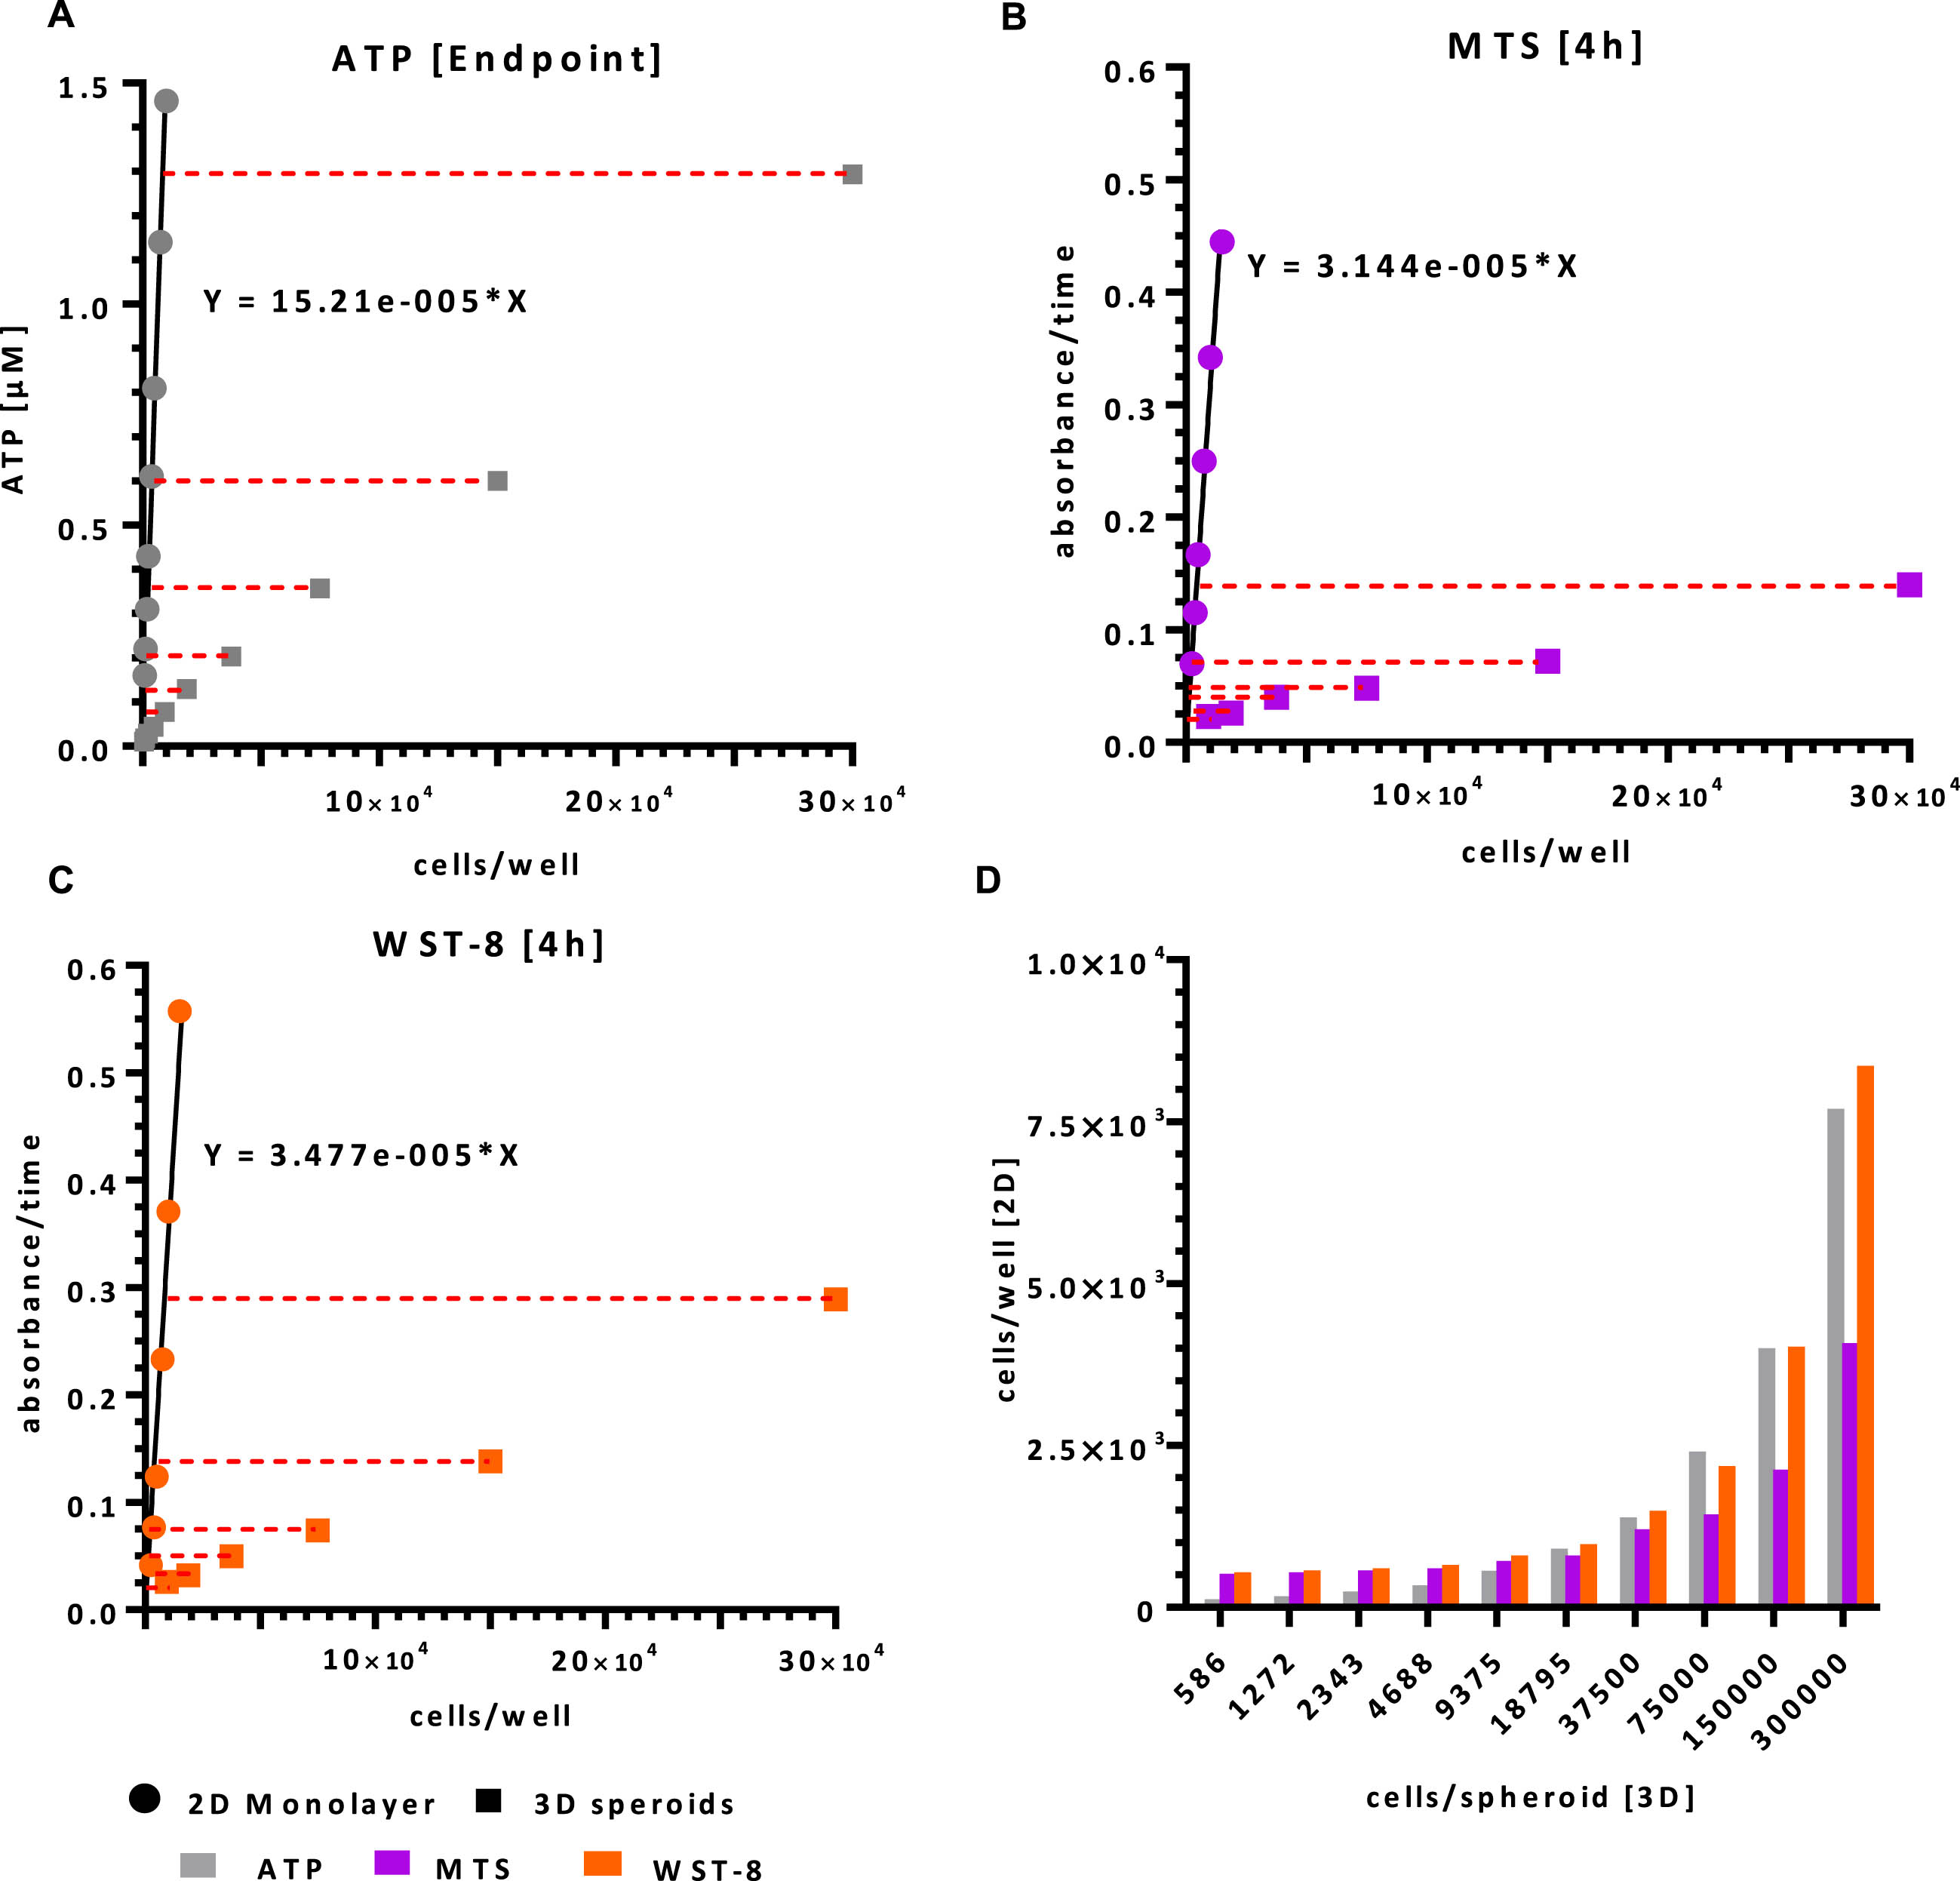
Graph A shows the cell number [2D=circles, 3D=squares] in correlation to the ATP concentration. The graphs B and C show the cell number [2D=circles, 3D=squares] in correlation to the absorption of the tetrazolium salts MTS (B), WST-8 (C) at an incubation time of 4 h. The equations represent the linear function of the cell count in correlation to the ATP concentration (A) or absorption (B,C) of 2D cultured cells and can be used as a function to calculate the approximate cell count of the values measured in 3D. (D) Comparison of the calculated cell numbers and with the linear function for ATP [grey], MTS [purple] and WST-8 [orange].
The use of tetrazolium salts (MTS, WST-8) to determine the number of living cells in monolayer experiments led to morphological changes in the cells. The cells contracted and detached from the surface. MTS showed toxic effects on the cells visible after 6 h incubation, while WST-8 showed no signs of toxicity (Fig. 10).
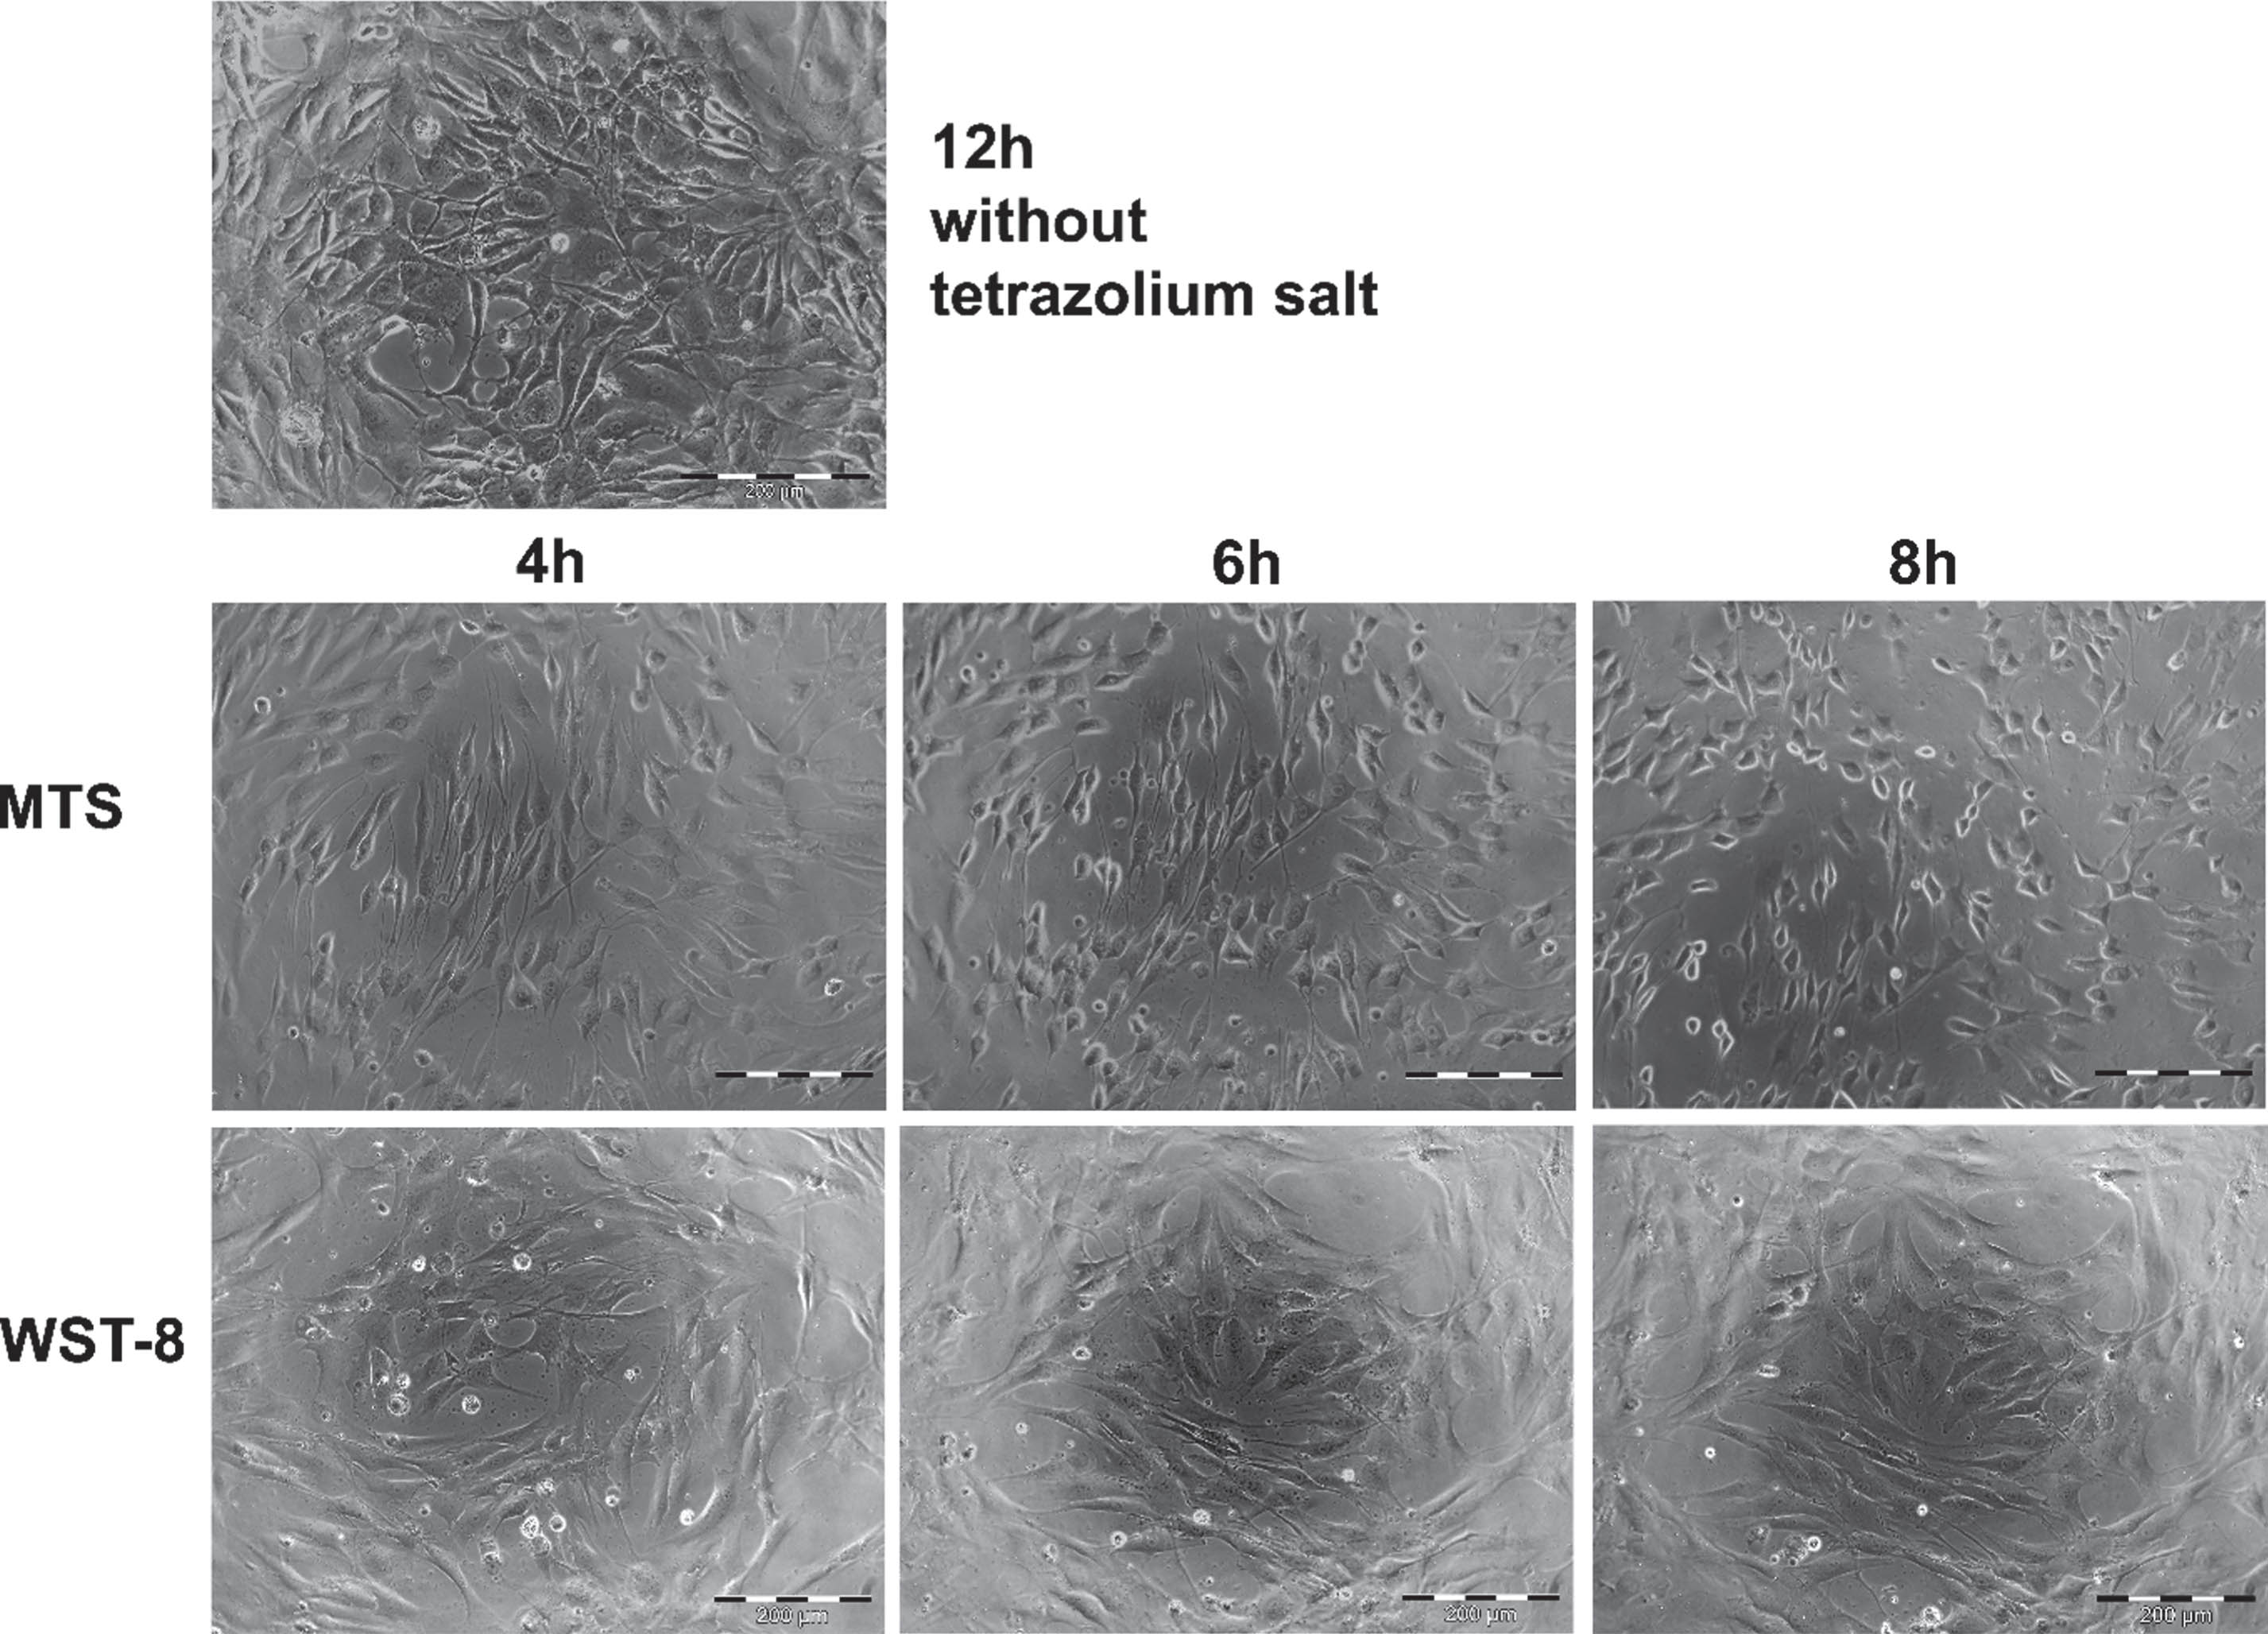
Cytotoxic effects of MTS and WST-8 on 2D cultured chondrocytes after different incubation time points. Scale bars: 200 μm.
Working in the field of Tissue Engineering and Regenerative Medicine, our research focus is on the engineering and characterisation of 3D microtissues to address questions like joint function, physiology and regeneration of cartilage defects. In addition to production, it is important to analyse the cells in their 3D microenvironment with regard to viability and differentiation in all parts of these 3D cell arrangements.
Previous studies [8] with focus on cell viability showed, that it is worth comparing different viability/proliferation/toxicity assays for their suitability to determine cell viability in 2D and 3D cultures. A comparison of the membrane-impermeable tetrazolium salts XTT, WST-1, and WST-8 to test the viability of cells revealed a difference in 2D and 3D culture. In monolayer culture, the assays showed a correlation between seeded cell numbers and absorption data. In spheroids, however, a correlation between size and absorbance was only detectable starting from 10,000 cells/aggregate. Furthermore, strong toxic effects were observed applying WST-1 or XTT to cells in 2D. Best results were obtained using the WST-8 assay: no signs of toxicity were observed and the assay revealed the highest sensitivity [8].
In the present study, we focused on the challenge of determining the number of viable cells in 3D culture systems (in addition to analysing 2D cultures). We selected three assay systems with different principles and detection methods to monitor cell viability of human chondrocytes: The MTS, WST-8, and ATP assay. The tetrazolium-based assay systems MTS [20] and WST-8 [15] work by reducing colourless tetrazolium salts to coloured formazan products via active cellular dehydrogenases followed by spectrophotometric determination of absorption. The MTS is converted both extracellularly and due to its lipophilic properties also intracellularly, while the WST-8 cannot overcome the cell membrane potential due to a double negative charge [12]. It can be assumed that the absorption signal of theses assays is proportional to the number of viable cells present, since dead cells can no longer convert the substrate [21]. In contrast, the ATP assay principle is based on an immediate destruction of the membrane integrity of the cells by lysis and quantitating the amount of ATP present via luminescence signals as readout. This method owes its breakthrough to the development of a luciferase that is stable against luciferase inhibitors by Promega. This makes the ATP assay one of the fastest, most sensitive proliferation assays and one that is least influenced by artefacts. This endpoint method is disadvantageous for the further use of the cells, since real-time progressions of drug effects cannot be tracked [17].
To address this question, we first analysed the correlation between cell number and ATP concentration or formazan dye generated. In addition, we tested for possible cytotoxic effects of assay components in the 2D monolayer culture by phase contrast microscopy, as well as lysis success of the ATP assay in the 3D culture by propidium iodide staining.
In a direct comparison of the two tetrazolium-based test systems, the WST-8 assay showed a higher sensitivity and a proportional ratio of cell number to absorption over a relatively large cell density range (7,500–45,000 cells/cm2). In contrast, the sensitivity of the MTS assay with chondrocytes in 2D was in the range of 3,000–30,000 cells/cm2 (Fig. 4). The WST-8 salt [22] is a further development and combines the high stability of WST-1 [23] with the high sensitivity of WST-3 [24]. This combination together with no cytotoxic effects over an incubation period of 24 h (see also Fig. 10) makes the WST-8 assay an ideal candidate for the determination of cell proliferation/cytotoxicity/viability in 2D cell culture approaches. These results are in accordance to our previous studies using chondrocytes [8], but also with investigations of other authors ranging from human bone marrow-derived mesenchymal stromal cells [25], via NFS-60 cells (murine myeloblastic cell line) [27], and Leishmania guyanensis [27], demonstrating the application potential of the WST-8 assay in 2D culture systems. Because the metabolic activity of different cell types varies widely with respect to species [28], normal cells, tumour cells, etc., it is advisable to adapt the test protocol to the selected cell system (optimal cell density and incubation time with the tetrazolium salt; own work).
In contrast to the absorbance data of the WST-8 and MTS assay, the ATP content for cells in 2D culture showed a direct proportionality to the seeded cell numbers across all cell densities. A specific feature of the resulting “straight line” is a break at a special cell density (Fig. 5B), which coincides with an increased appearance of cell-cell contacts in dense cultures. A morphological shift due to direct cell-to-cell contacts may influence (reduce) the intracellular ATP amount. Bannai and Sheppard (1974) also reported a reduction of the amount of ATP per 106 cells in 2D from a precontact stage up to a confluent monolayer in Swiss 3T3 cells [29]. The authors suggest that a critical membrane-mediated event seems to occur at the cell-cell contact stage before confluency, resulting in decreased ATP. Such changes may prime the normal cell for eventual density-dependent growth inhibition. Transformed cells, which do not exhibit regulated inhibition of growth, showed little change in ATP when compared at different cellular densities [29]. Appropriate cell density-dependent regulation of ATP levels during the growth cycle was also observed by Fiorani et al. (1994) in Chinese hamster ovary cells (CHO) [30] and Bereiter-Hahn et al. (1998) in 3T3 cells [31].
Switching from 2D to 3D cultures in proofing the cell viability clearly showed that the measurable range for the two tetrazolium-based test principles depends on the spheroid size. Spheroids smaller than approx. 239 μm in diameter (9.4×10³ cells/spheroid) cannot be measured with the MTS and WST-8 assay (Fig. 6A, B; Table 1). The activity of the dehydrogenases, the basis of these test systems, seemed to be too low in cells in 3D aggregates to be detected in small spheroids. According to this limitation in sensitivity, a minimum spheroid size is necessary to apply the MTS and WST-8 assay to chondrocyte spheroids. In contrast, there is no limitation to measure the cell viability in 3D aggregates using the ATP endpoint assay. Moreover, the ATP concentration showed a linear correlation within the range of 590–300,000 cells/spheroid, which corresponds to a spheroid diameter of 100 to approx. 1000 μm (Figs. 7B, 8; Table 1).
Summary of the application possibilities of the three viability assays MTS, WST-8, and ATP on spheroids (3D microtissues) with respect to spheroid diameter
Summary of the application possibilities of the three viability assays MTS, WST-8, and ATP on spheroids (3D microtissues) with respect to spheroid diameter
The nucleotide adenosine triphosphate (ATP) plays a central role in energy exchange in biological systems. It is commonly referred to as the “energy currency” of the cell. It serves as the most important immediate donor of free energy and is present in all metabolically active cells. ATP has been used as a tool for the functional integrity of living cells, as all cells require ATP to stay alive and fulfil their specific functions. ATP links catabolic and anabolic processes. ATP hydrolysis provides the energy for many essential processes in organisms and cells, including cellular differentiation, DNA/RNA/protein synthesis, movement (muscle contraction), regulation of signalling (intracellular, neuronal), and active transport. Cell injury or oxygen/substrate depletion leads to a rapid decrease in cytoplasmic ATP. The measurement of ATP is therefore of fundamental importance for the study of living processes [31, 32]. Many processes are capable of producing ATP in the body, depending on the current metabolic conditions. ATP production can occur in the presence of oxygen from cellular respiration, beta-oxidation, lipid, and protein catabolism, as well as under anaerobic conditions (aerobic glycolysis, also known as ‘Warburg effect’) [1].
Comparing the intracellular ATP content measured in the 2D and 3D system demonstrates a substantial reduction in the ATP content depending on the cell density (Figs. 5B; 7B). Chondrocytes in monolayer culture at low cell density showed a quite high ATP content (1.4 μM/104 cells, equals to 5.6 μM/4×104 cells) which decreases with increasing cell density to 60% (3.5 μM/4×104 cells; Fig. 5B). The highest cell density/unit could be achieved when cells are tightly packed in a spherical shape. In this 3D culture system, the cells have reduced their ATP content to 6% compared to dense monolayer cells (0.2 μM/4×104 cells as spheroid, Fig. 7B). These differences in intracellular ATP content could be due to the characteristics of the particular microenvironments. Cells in monolayer culture (2D) are spread individually on a flat polystyrene bottom of the cultivation bottle and the surface of each cell is exposed to the culture medium. This artificial condition result in a morphological and physiological switch (de-differentiation) of chondrocytes isolated from cartilage tissue [28, 33]. Depending on the cell density, there are more or less cell-cell contacts on the flat surface (Fig. 5B) and in general, cells divide in a 2D culture. In spheroids, however, the cells arrange themselves in a specific geometry resulting in densely packed cells in a spherical shape. In chondrocytes and chondrocyte precursors, this aggregation/condensation process is mediated via the cell adhesion molecules N-Cadherin (neural cadherin) and N-CAM (neural cell adhesion molecules) as well as gap junctions, facilitating intercellular communication [34–36]. Following the aggregation of cells, the amount of cell-cell adhesion molecules drop and the (re-)differentiation process of chondrocytes proceeds, resulting in ball-shaped cells which immediately stop dividing and start to synthesize and secrete cartilage-specific ECM (extracellular matrix) molecules [19, 38]. This process of establishing cell-cell contacts is essential for (pre)chondrocytes to differentiate and develop a cartilage-specific phenotype, resulting in the expression and secretion of ECM molecules such as collagen type II and aggrecan. Interestingly, longer incubation times of spheroids (2 or 4 weeks) resulted in differentiated microtissues with a higher ATP content (50–100%) [38, 39]. Even more impressive are the most recent results which showed a dependence of the intracellular ATP content on the degree of differentiation of the spheroid microtissues generated by different engineering techniques. According to the new synthesized ECM, the spheroids increased their diameter with progressing cultivation time [40, in submission] This successive reduction of intracellular ATP with respect to cell density may be based on an alteration of the chondrocytes metabolism from high to low proliferating cells in 2D to differentiating cells in 3D. In this process with increasing cell density and increased opportunity for contacts with neighbouring cells, a high ATP level may no longer be necessary, as proliferation (high ATP requirement) is reduced in parallel. Proliferation comes to a complete stop when cells arrange as spheroids, which could explain the further reduction in ATP levels. The re-differentiation with high anabolic activity then requires a high amount of energy, which would explain the increased intracellular ATP content in differentiated microtissues. Other authors used the ATP assay e.g. to test the consistent differentiation degree of 3Ds using human liver microtissues (hLiMTs) which exhibited stable sizes (250–300 μm) and small fluctuations in the ATP content over a period of 35 days [41], which is in accordance to our results. Analyses of iPSC-derived human 3D cardiac microtissues (4000 cells in coculture with 1000 cardiac fibroblasts, InSphero model) revealed a constant size of 250–300 μm, but in parallel a reducing ATP content with increasing cultivation time up to 28 days [42]. Verheijen et al. also used the InSphero cardiac microtissue system, but they showed a constant ATP content with increasing cultivation time up to 14 days revealing a constant tissue quality [43].
Among tetrazolium-based assays, WST-8 is preferable over MTS because of its non-toxicity and better sensitivity. When determining the cell number in the 2D system, caution is advised when using the ATP assay because of its two-phase slope of the correlation graph concerning cell number and intracellular ATP. In 3D systems of human chondrocytes, the ATP-assay is superior to the other two test systems because there is no spheroid size limitation for cell viability measurement. Since differentiation processes or other metabolic events can influence the results of proliferation and toxicity assays (determination of viable cells), this should be taken into account when using these test systems. It should be pointed out that monitoring of ATP is not exclusively a measure of cell proliferation or viability, although there is a direct correlation between cell number and measured luminescence.
Footnotes
Acknowledgments
The work was supported by grants of the “Gesundheitscampus Brandenburg” (Land Brandenburg). We are grateful to Matthias Suckow, Institute of Applied Chemistry, University of Technology Cottbus-Senftenberg, for assistance in mathematical calculations.