
Abstract
This article recounts the business-enterprise transformation that ensued from an action or praxis research, through the synthesis of statistical process control (SPC) and system dynamics (SD) simulation modeling. Intended to minimize the waste that a polymer-coating production process churned out, the SPC-SD union generated insight about the negative feedback structure of product thickness and its temperature through time, thereby enabling the client firm to leverage the dynamic equilibrium of its polymer-coating production process. Newly generated knowledge led to significantly improving end-product quality and, thereby, productivity, which tampering previously cumbered. Accrued from transforming the firm’s polymer-coating production process and operations governance, these benefits facilitated the self-development of its capability of relying on both SPC and SD for its production-strategy design and implementation tactics. Despite the praxis-research limitations, the article also offers future-research directions and policymaking recommendations. These can help capable professionals continually improve business enterprises and other societal human organizations, through the high technology of collegially self-organizing and self-governing societal human systems.
Keywords

—Information is not knowledge
Milan Zeleny [31, p. 1]
Introduction
In the dual, worldwide context of autopoietic [19, 34] company value- and industry supply-chains, the champions are pioneering business enterprises and other societal human organizations, in culturally diverse industries [9][16, Section 8.2]. As they advance to equal business partners their full-time employees, and previously subordinated company divisions and suppliers, these organizations transform themselves into truly societal human systems, via the high technology of collegially humane, self-organizing and self-governing decision-making structures.
«Technology» is itself a statically complicated and dynamically complex societal human system, comprised of its mutually-interactive hardware, software, brainware and support-network or -net components [33]. Intended for the collegial, common or general good of its components, members and users, technology is often misused in business research, especially when what is actually assessed is «appropriate technology» [33]. Georgantzas and Zarifopoulou link Zeleny’s appropriate technology notion to «sequestered technique» and its resultant «technocracy», as technocracy is founded not on technology per se, but on sequestered technique [16, Section 7.3].
High technology entails the self-emergence of societal human systems from collegially-humane societal structures, wherein collegial control and responsibility flow at Liberty. As opposed to the aye-unnatural, inhumane and faulty, top-down imposed bureaucratically-hierarchized authority and power artifice, steeped and probably rooted in shamanistic ritualism.
E. R. Dodds looks, for example, at both Plato’s irrational aspects of the human comportment and Plato’s willful surrender to shamanistic ritualism, for the sake of promulgating «his inherited conglomerate» [5, p. 207], i.e., pseudaristocratic or swanky régime. Inevitably, Dodds concurs with most classics researchers, who see right through Plato’s transcendentalism, after his direct contact with the Pythagoreans, around 390 BCE. Thereafter, in subjecting its form to visceral interpretation and rapture, Plato seems to have deftly cross-fertilized hellenic rationalism with «magico-religious ideas» from shamanistic ritualism [5, p. 209].
Despite the omnipresence of its tall, ladder- and pyramid-shaped charts, bureaucratic hierarchy is a
The business enterprise and the company value- and industry supply-chain transformations hinge on the fact that, since 1945, it has become apparent to business and other organizational researchers that the only possible form of human and organizational development «is self-development» [1, p. 46]. Evidently, all business enterprises and other societal human organizations can do is facilitate their employee, customer, division and partner self-development, just as educational institutions facilitate the self-development of students and faculty members.
Also evident has concurrently become the verity that improving the components and members of a business enterprise does not necessarily improve its arrangement or setup as a whole [1, pp. 18–21][16, Section 7.1]. For example, facilitating the self-development of a few individual employees, departments or distinct economic sectors and industries, does not necessarily improve an entire enterprise or other societal human organization, e.g., a nation or a state.
Within the harsh reality of bureaucratically-hierarchized business enterprises and other outfits, subjugated under said delusion of organization, the tampering phenomenon causes many a disaster. To demonstrate how pervasive tampering is, Deming [3, 4] used a funnel experiment, which quality researchers and practitioners avidly employ, to show the dysfunctional effects of not using statistical process control (SPC) charts, in diagnosing quality problems.
Capable business professionals, who attend the American Society for Quality (ASQ) six-sigma or 6σ courses, already know that, in the production and delivery of goods and services, SPC charts are indispensable to diagnosing quality-related problematic decision-situations. And guided by many business-tampering examples, Georgantzas et al. [13–15] built a system dynamics (SD) simulation model of the Deming funnel experiment, capable of reproducing the SPC charts and statistical tests that Sparks and Field present [25]. The computed results of that SD model also show tri-dimensional vistas of the Deming funnel experiment location probabilities and its Theil [29] inequality statistics or TIS, plus a statistical-entropy approach to diagnosing tampering.
According to W. E. Deming, the profound knowledge needed to stop tampering (a) has no substitute and (b) is not automatic [3, 4]. Indeed, it takes wisdom to handle the uncertainty that drives tampering with a business process; and controlling uncertainty must be learnt [12].
Dwelling on the problematic decision-making situations frequently facing a person, family, business enterprise or nation, Jørgen Randers defines «societal structure» as the biotic, naturally organic, tidy formation of a problematic situation’s mutually interdependent components and members that interact through their deterministic, reciprocally-causal relations [22, p. 120]. Within reality, collegially crafting this societal structure of deterministic causal relations yields a diagram of reciprocal causality, the map of a real-world chunk that a team of people selects to study [30].
A concrete example of a problematic situation’s societal structure is the set of rules and practices that a business enterprise enacts, while confronting swift changes in market demand for its goods and services. The tidy arrangement of that situation’s reciprocally dependent, and interacting component and member relations, i.e., its societal structure, also includes the communication channels that transmit information and the firm’s collegial decisions.
Furthermore, Randers calls «societal process» a problematic situation’s performance pattern dynamics, its time-series of societal events, as these evolve through time. The simulation results of fully-fledged, SD-simulation models show such successions of events, similar to those that occur within the reality of our cosmos [2, 30].
The core corollary of system-dynamics praxis research is that the structure of relations among the parameters and variables in a system gives rise to its behavior through time, i.e., its dynamics. If this corollary of the SD praxis research is correct, then, within the business reality, its societal structure determines the societal process of every societal human system.
While concurrently relying on process-capability and other SPC charts, the process of building a SD-simulation model of its polymer-coating process helped the client firm turn its problematic production situation into a beneficial upshot. In supplying artificial leather to industrial customers worldwide, a sustainable competitive advantage emerged, via significant improvements in productivity and end-product quality, which previously tampering cumbered.
Georgantzas’ flow diagram of a dynamic decision-making framework or clockwork already shows how the SD-modeling process supports continual improvement in business enterprises and other arrangements [9, Fig. 1]. Ergo, the present article moves directly into formulating the specific problematic decision-making situation or problématique of the client firm’s polymer-coating production process, along which its polymer-coating operations are sequentially coaligned.
Next comes a brief description of both the SD-modeling or -modelling process and the stock-and-flow diagrams of the actual SD-simulation model, of the client firm’s polymer-coating production process. The heart of this model emerged as a translation, into SD-modeling software, of the parabolic partial deferential equations that frequent the pertinent research work of Nakamura [21], and of Tadmor and Gogos [28].
Given the capability of SD models to compute strategic scenarios, not as straight forecasts of what will happen in the future, but as potentialities of what might tentatively happen [12], the SD-simulation results follow. These show the client firm’s actual polymer-coating performance as well as its performance potential. Lastly, despite the study’s limitations peculiar to this praxis research, the article offers future-research directions and policymaking recommendations.
These pertain to the way the SD-modeling process fosters clear thinking, and thereby offers the requisite insight into both the effective and the efficient design – and redesign–of business operations and tactics, and processes and strategies. These four business notions are explicitly defined in Section 4.4 of [16]. Included here are suggestions hinged on the pragmatically-practical idea of combining SPC and 6σ programs with the SD-modeling process, toward collegially crafting humane, high-technology decision-making structures.
Such collegially-humane organizational structures help propel business enterprises and other societal human organizations, in diverse industries, into the high technology of self-organizing and self-governing societal human systems [9][16, Section 8.2]. The article concludes with Deming’s prominent fourteen points [3, pp. 23-24]. These are adapted from [16, Section 5.3] and slightly reworded, so they are consistently akin to the also fourteen societal human systems’ anthropocentric and society-centric, civic, ethical and moral ideals [16, Ch. 5 and Ch. 6].
Formulating the problématique
The client firm’s manufacturing facility employs an intricate polymer foam- and paste-coating production process that keeps about ninety people pretty busy. Its polymer-based, artificial-leather industrial goods entail business-to-business or ‘B2B’ marketing, reaching many consumer-goods producers, who manufacture and deliver apparel and accessories.
Despite its potentially enormous, worldwide artificial-leather market, the firm had remained fledgingly small within its industry, its small business volume owed to its less-than-glamorous production performance, in terms of productivity and end-product quality. Namely its end-product thickness variation had been causing much output waste, ranging from 25 to 30 percent per day.
Detrimental to its cost structure, literally ‘dumping’ 25 to 30 percent of daily output is unsuitable for many a business enterprise. So, the manufacturing people – who worked on polymer coating–agreed to participate in a SPC program, enriched with the SD-modeling process.
Popularized via six-sigma (6σ), SPC and total quality management (TQM) programs, the continual-improvement archetype of company-wide quality control (CWQC) contains two total cost of quality (CoQ) categories: its consequential and discretionary cost (Fig. 1). Through a specific time period t, the sum of these two cost categories yields a firm’s total CoQ over that time period t.
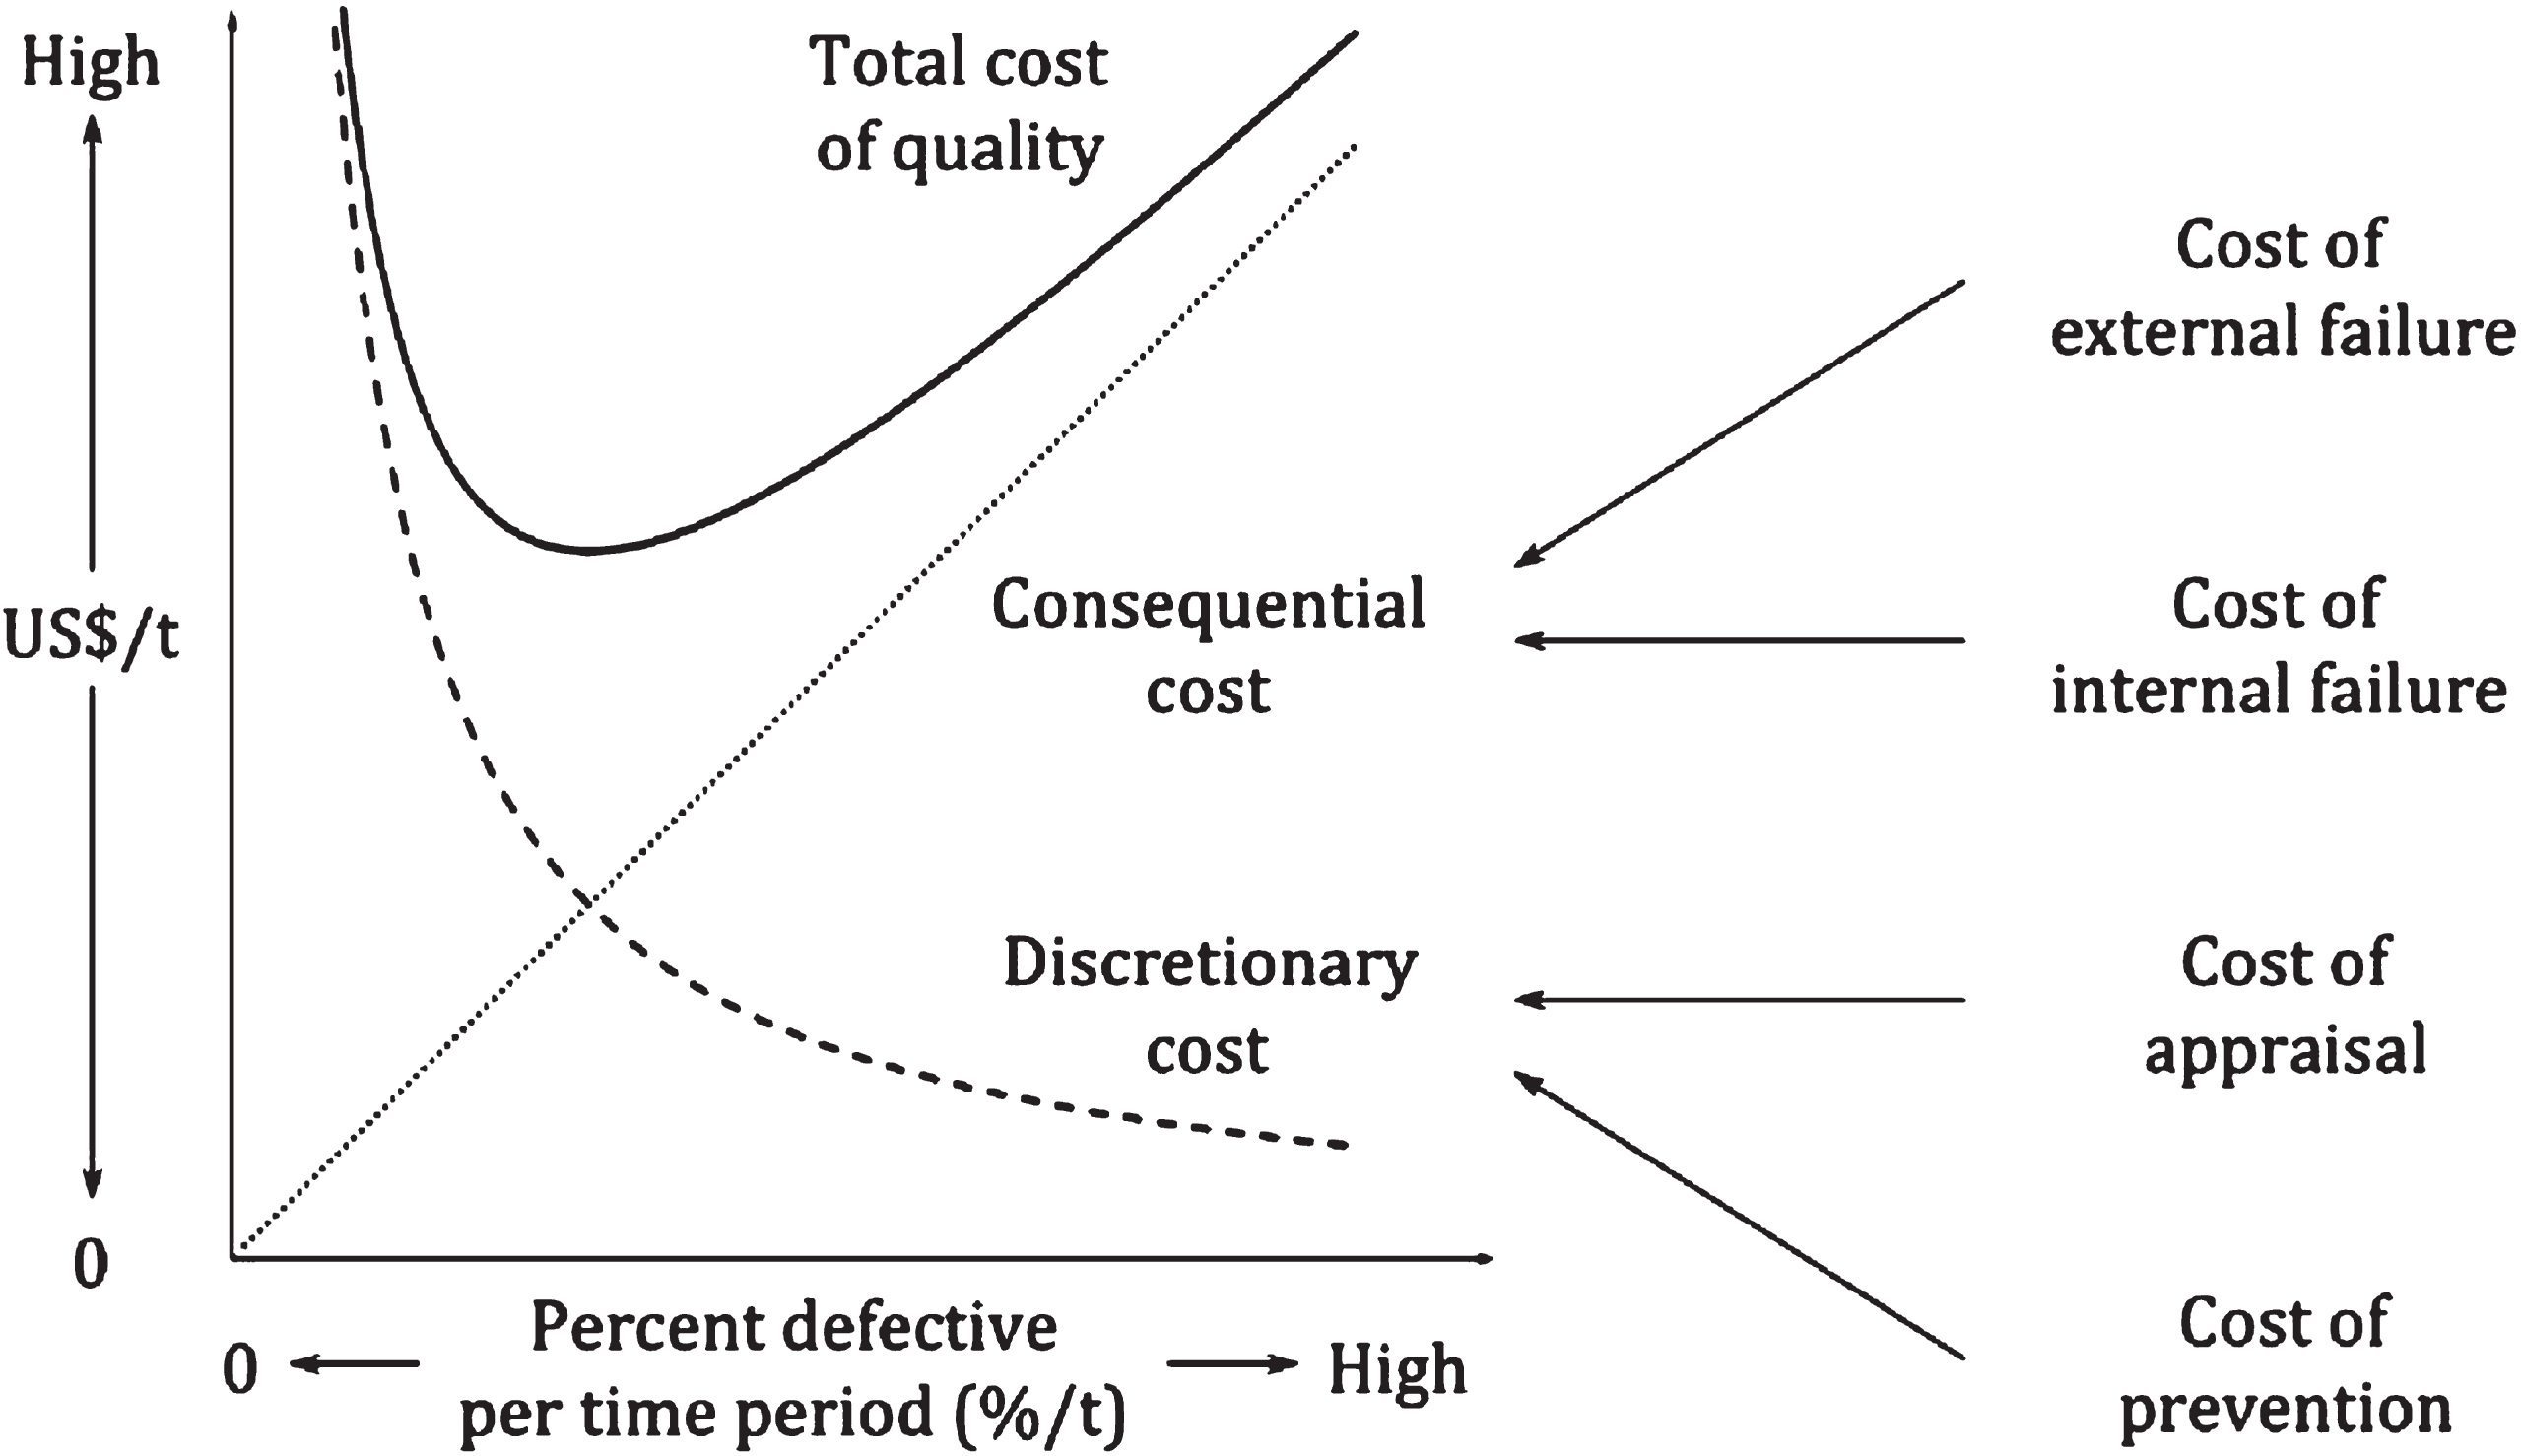
A phase plot of the total cost of quality (CoQ) components; adapted from [16, Fig. 6.3.6].
On the left panel of Fig. 1, the horizontal axis depicts the percent defective parts, goods or services, per time period or % /t, which a company or other societal organization faces. For each time period t, the vertical axis shows the cost of quality, in US$/t, i.e., the total, the consequential and the discretionary cost of quality per time period that said company or organization incurs.
It is immaterial whether a firm is a manufacturer or a service provider. Its consequential cost (dotted line, Fig. 1) is the sum of its cost of external failure, plus its cost of internal failure.
Similarly, its discretionary cost (broken curve, Fig. 1) is the sum of its cost of appraisal, plus its cost of prevention (lower right, Fig. 1). Lastly, the sum of its consequential cost plus its discretionary cost yields its total CoQ or cost of quality (solid curve, left panel, Fig. 1).
Occasionally, among organizations that adopt CWQC, 6σ, SPC and TQM programs, some of them publicize empirical evidence about their four cost-of-quality categories (right panel, Fig. 1). These empirical data inductively show that: within a discretionary-cost budget, even a relatively small budgetary reallocation, from the cost of appraisal to the cost of prevention, soon causes a drastic decrease in an organization’s total cost of quality [16, Section 6.3].
In the client firm’s problematic situation or problématique, the literal dumping of 25 to 30 percent of its daily end product clearly constituted a consequential cost of internal failure. And the advancement from SPC-chart diagnostics to the SD-modeling process might be construed as a budgetary reallocation from the cost of appraisal to the cost of prevention (right panel, Fig. 1).
Continually improving quality – and thereby productivity [3, 16]– is a humane intent, prudent enough for each business enterprise in every industry. Yet the pivotal benefit gained from adopting the SD-modeling process lies in facilitating the self-development of its participants.
In a suitably collegial SD-modeling process [30], the true model its capable participants work on is a model of themselves. And such was the case in this praxis research, wherein the SD-modeling process enabled its participants’ critical systems thinking (CST), about the client firm’s polymer-coating production process, a miniaturized blueprint of which is shown on Fig. 2.
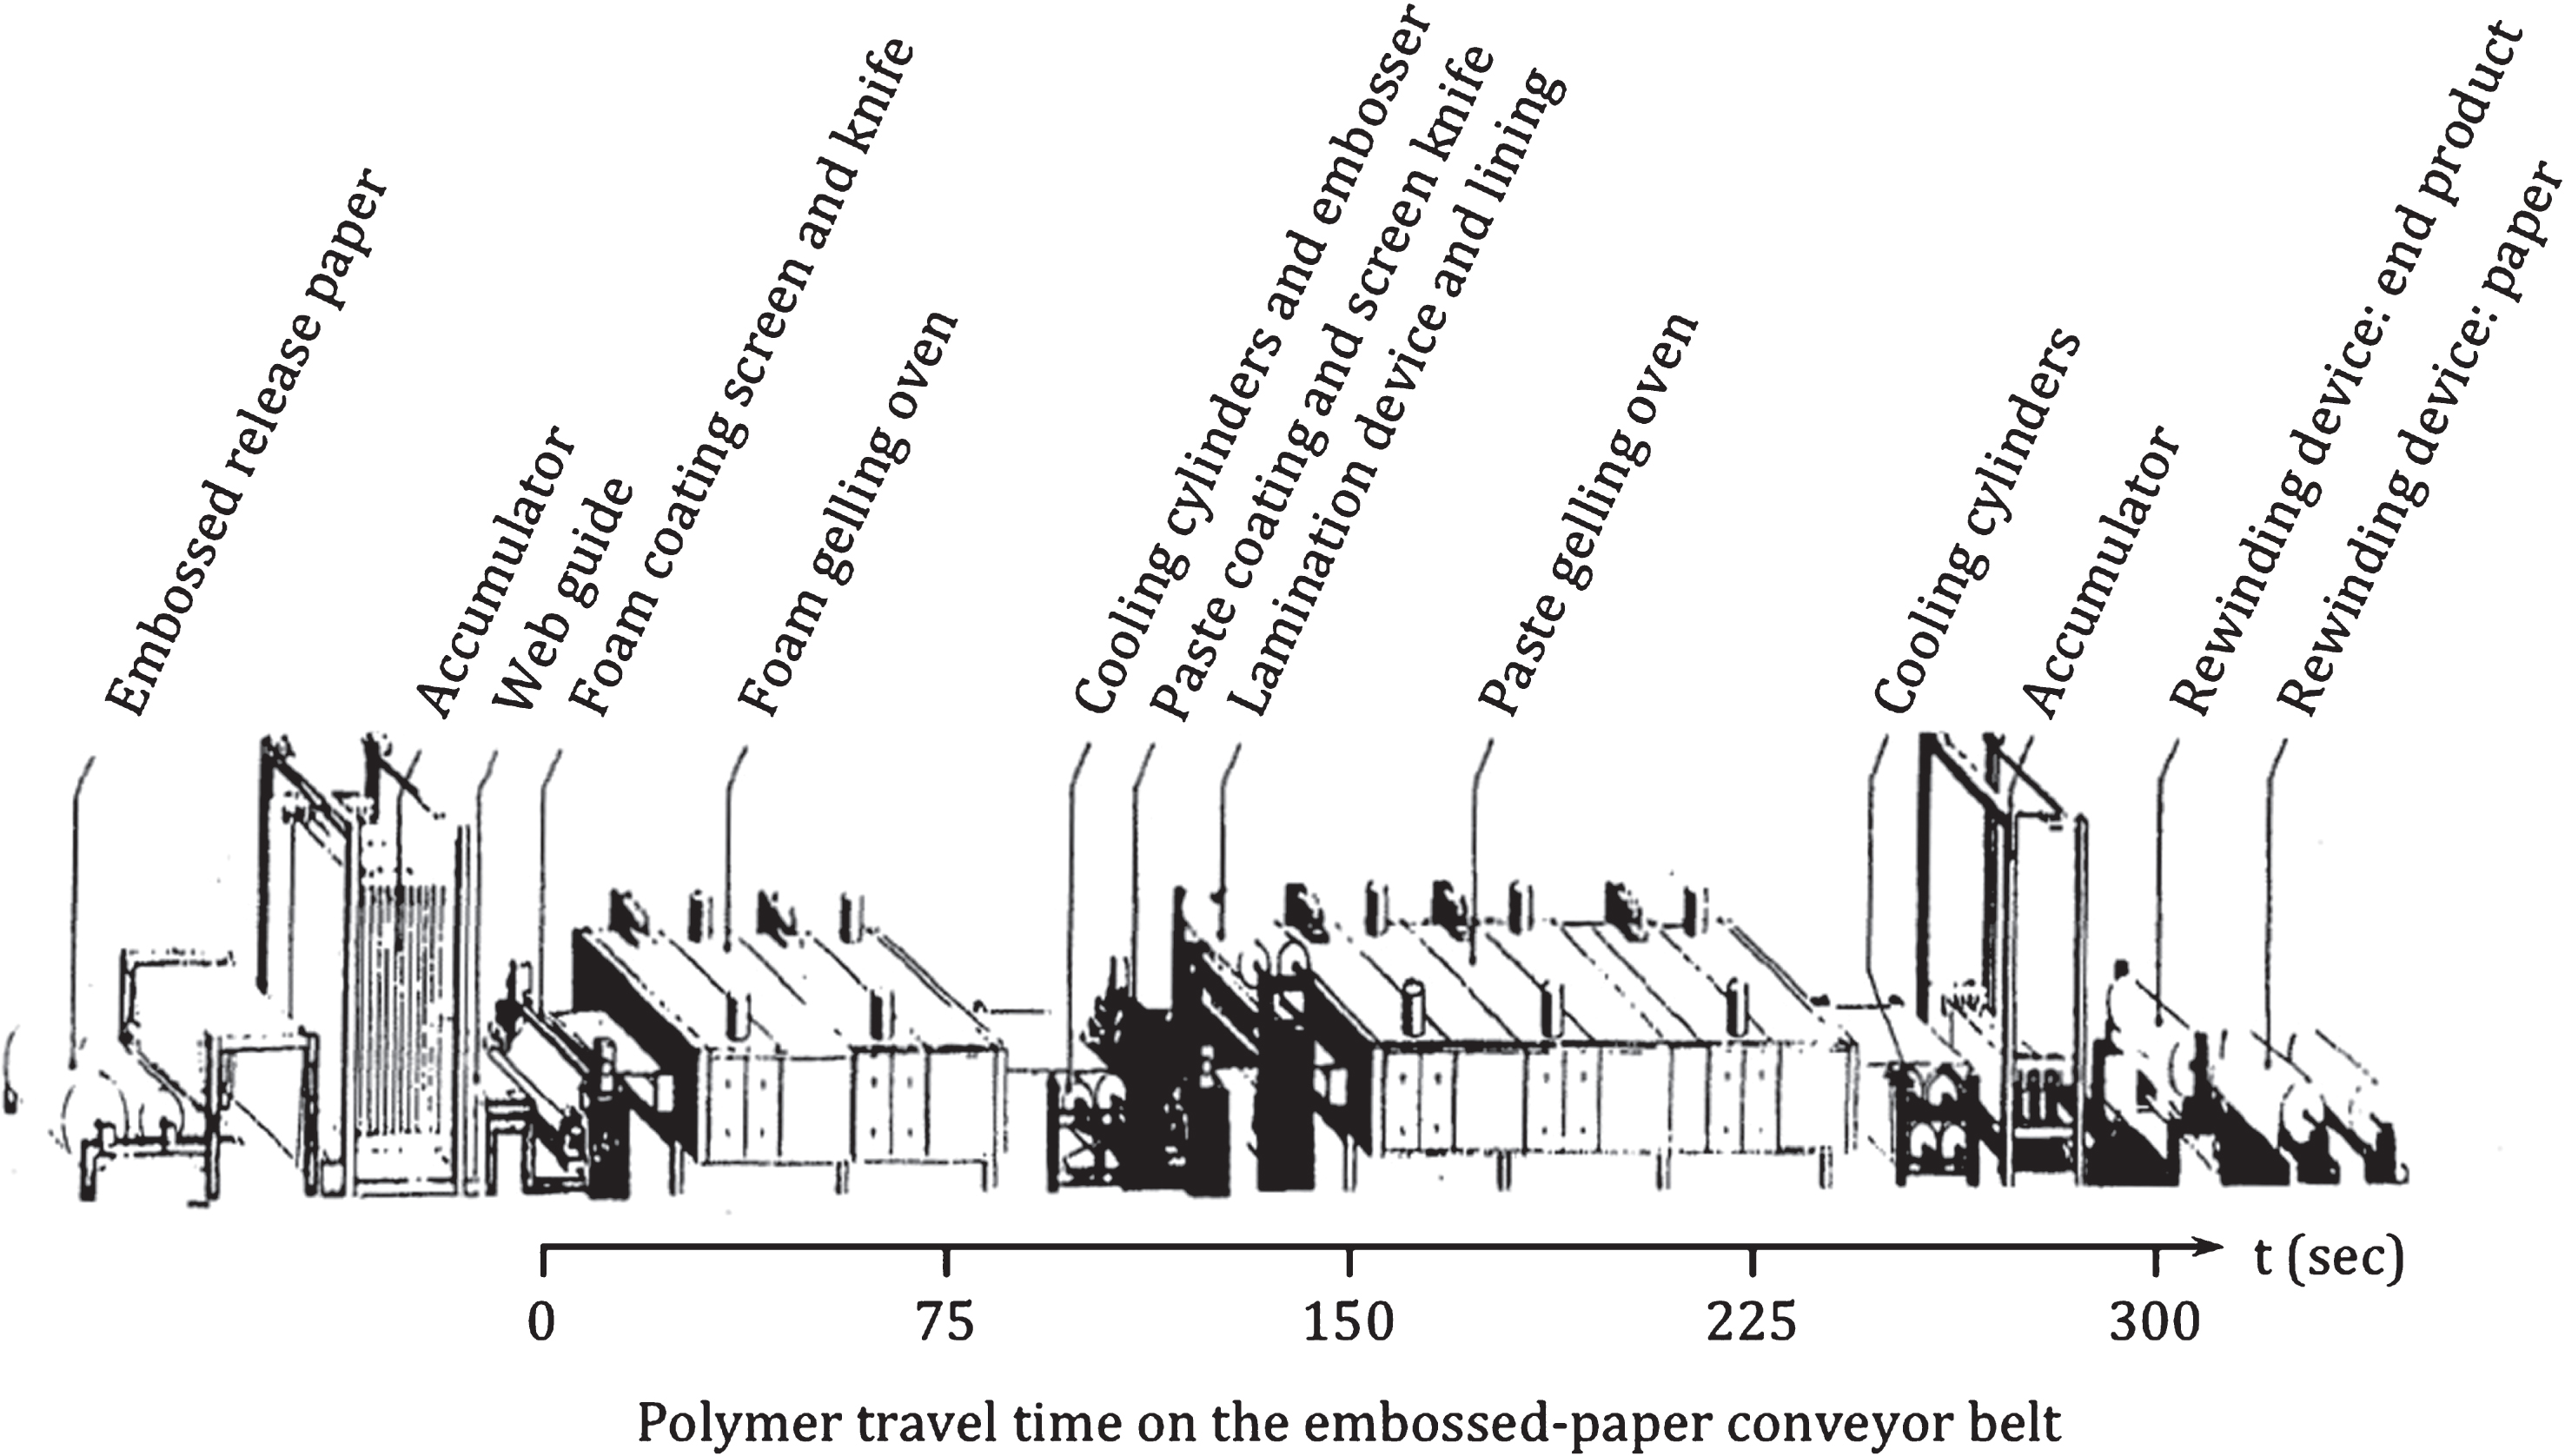
A miniaturized blueprint of the client firm’s polymer-coating production process, with individual production operations coaligned along its embossed-paper conveyor belt.
On Fig. 2, the polymer-coating production process shows the coalignment of individual production operations, along its embossed-paper conveyor belt. In addition to the two oven operations, within which the polymer foam and paste gel, worth noting on Fig. 2 are the polymer-foam coating screen and knife operation as well as the polymer-paste coating screen and knife operation, four production operations that play specific rôles to determining end-product quality.
First, at the polymer-foam coating screen and knife operation (Fig. 2), a worker adds polymer foam on the embossed-paper conveyor belt. Second, after the scraper knife there flattens the polymer foam surface, the smoothed polymer foam enters the foam-gelling oven on Fig. 2.
Third, at the polymer-paste coating screen and knife operation, another worker adds polymer paste, on top of the already gelled and cooled polymer foam. Fourth, after the second scraper knife there flattens the polymer paste surface, the lamination device and lining operation, under pressure, automatically adds the lining on top of the already smoothed polymer paste.
Fifth, sandwiched in-between the polymer foam underneath it, and the added lining on top of it, the polymer paste enters the second oven on Fig. 2, in order to gel too. A detailed analysis of the production operations on Fig. 2 unconcealed an official document at the client firm, with a set of typed and signed commands on it.
On that typed and signed command sheet, the «stated objective» was to prevent end-product damages, owed to excessive heat inside the gelling ovens on Fig. 2. Consequently, the polymer-coating workers had to obey by raising the foam and paste scraper knives up high, whenever the polymer gelling ovens «became too hot».
Building a SD model of this production process, first of all required clearly comprehending each one of its operations, an aspect both educational and most useful in the SD-modeling process. In addition to sharing their ken of the polymer-coating production process, the SD participants collegially generated knowledge as praxis from extant information [16, Fig. 6.3.4][31, 32]. Ergo, they also collegially shared a unique insight into their engineering intuition, about the statically complicated and dynamically complex polymer-coating production process at hand.
Collegially built, the SD model allowed computing multiple quality and productivity scenarios [12], by isolating the particular effects of individual parameters and variables; computed scenarios that explored multiple process sensitivity and stability issues. Such experiments are often costly, hard and virtually impossible to perform in real-life production processes and operations.
The praxis-research intentionality or purposefulness was to collegially fathom how the governance configuration of the polymer foam- and paste-coating process caused the undesired variability in end-product thickness. The facilitated conversations and dialogues that ensued among the participants culminated in: the tangible output of multiple SPC charts, crafted throughout the praxis research and, eventually, a SD-simulation model of the polymer-coating production process.
Figure 3 shows, for example, a sample of the SPC charts, crafted with the data gleaned from the SD-simulation model. Indeed, statistical process control charts are indispensable to diagnosing quality-related problems.
It was the American engineer, physicist and statistician, Walter Andrew Shewhart (1891–1967), who first applied statistics to diagnosing quality-control problems at Bell Telephone Laboratories. Namely Shewhart’s 16 May 1924 memorandum featured the very first sketch of a modern SPC chart [23, p. 5].
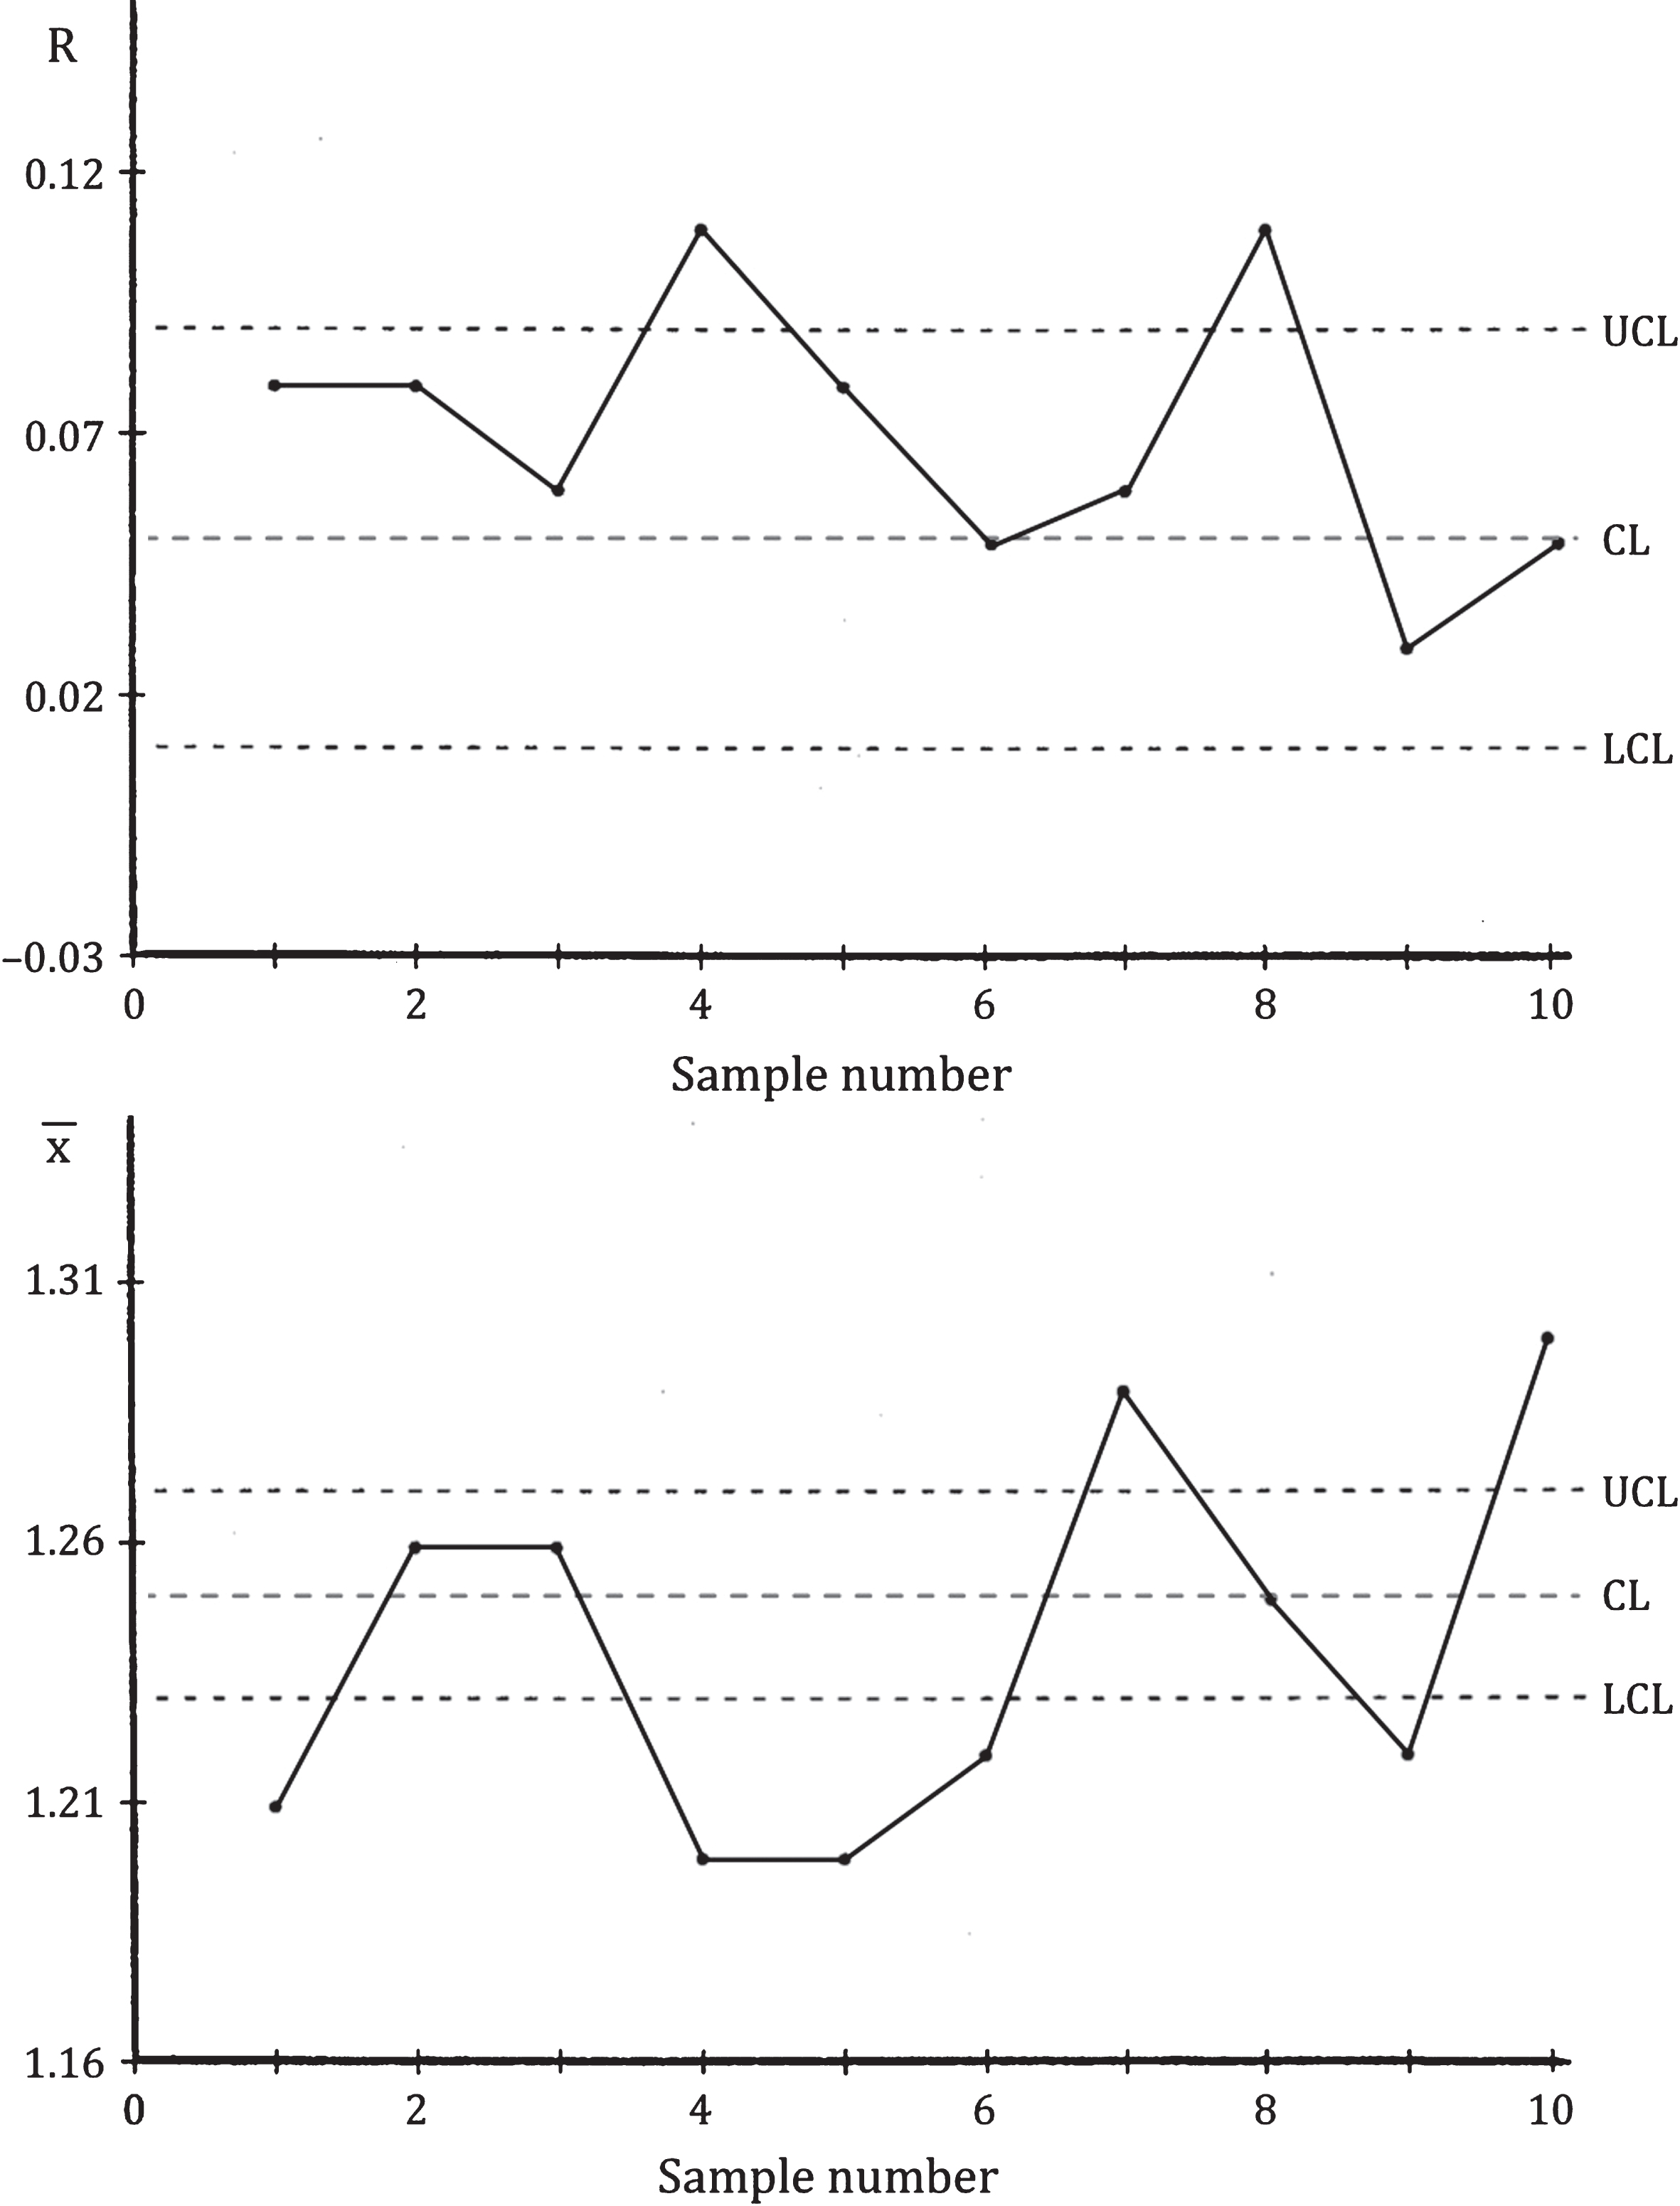
Both the range or R and the average or x-bar statistical process control (SPC) charts clearly show that the polymer-coating production process is out of control. These SPC charts were caringly crafted from 10 random samples of equal sample size n = 10, the cardinally measured variable being end-product thickness, in millimeters or mm.
Shewhart worked on and improved his approach until, in 1931, he finally set the tone for quality diagnostics through SPC charts. Within the business reality of goods and services production and delivery, to tell the difference between assignable-cause variability or variation and chance, Shewhart built a method that distinguishes one type of variation from the other [24].
Following Shewhart’s pioneering work was another American electrical engineer, mathematical physicist and pioneering professor of statistics, William Edwards Deming (1900–1993), who helped develop sampling techniques, still used today at USA’s Bureau of Labor Statistics and Department of the Census. An advisor to Japanese industrialists, in August 1950, Deming delivered his inaugural lecture, titled ‘Statistical product quality administration’, at the Hakone Convention Center, Tokyo, Japan [23]. While sharing his other quality-assessment insights, at that seminal lecture Deming also showed how feedback loops or spirals form the societal structure of each business enterprise that endogenously causes its societal behavior [16, Section 2.3].
Deming too refers to ‘common-cause’ and ‘special-cause’ variability or variation [3, 4]. Intrinsic to production and delivery processes is common-cause variability, whereas special-cause variation is owed to peculiar acts, causes or praxes that require immediate remedial praxis.
For example, when a machine starts consistently producing defects, then it must be taken off line for repair. Yet eighty to ninety percent of product and service variation is owed to common- cause variability, endemic to every production and delivery process. And the only way to reduce common-cause variation is to redesign the process itself.
Based on data gleaned from the SD-simulation model, caringly crafted were the SPC charts on Fig. 3, showing the range or R on top, followed by the average or x-bar results of end-product thickness. Both horizontal axes of the SPC charts on Fig. 3 depict the sample number of ten random samples, of equal sample size n = 10. The vertical axes respectively show their R and x-bar quantities, the cardinally-measured variable being end-product thickness, in millimeters or mm.
Both charts clearly show that the polymer-coating production process is out of control. This SPC diagnosis corroborates the quality problématique, as stated by the client firm’s manufacturing people, who worked on its polymer-coating production process. Namely, on the R chart of Fig. 3, two of the computed R or range values are well above the SPC chart’s upper control limit (UCL).
Equivalently, on the average or x-bar chart of Fig. 3, two of the computed x-bar values are above the chart’s UCL, and five of the computed sample-mean values fall well below the SPC chart’s lower control limit (LCL). These results confirmed the diagnosis that the client firm’s polymer-coating production process was out of control, and immediate corrective praxis was thereby needed, in order to curb the special-cause variability that yields the SPC charts on Fig. 3.
Given that all SPC charts can do is help diagnose whether a production or delivery process is either in or out of control, the SD-modeling process helped its participants undisclose the requisite systemic leverage (SL), i.e., the integral concord of direct, dynamic and structural leverage [16, Table 1.2.1]. Tightly coupled to every firm’s competitiveness, knowledge of its business and partnering capability, its resource SL is itself a vital core competency that emerges by or of itself from the SD-modeling process, enabling business enterprises and other societal human organizations to meet their vital intents, within their spheres of corporate-, business- and functional-strategy design.
Namely resource SL helps firms become customer-driven, by continually improving the quality of their goods and services, delivered to both current and future clients and customers. Ergo, the SD-modeling process enabled the client firm’s participants undisclose their requisite systemic leverage, by tracking changes in their polymer-coating configuration, in terms of the: gelling temperature, distributed amongst the polymer foam and paste, and end-product thickness, i.e., polymer foam, paste and lining thickness.
The American, pioneering computer engineer and professor at the Sloan School of Management, MIT, Jay Wright Forrester (1918–2016), contributed to the first coincident-current-pulse digital information storage device, the precursor of today’s digital random access memory: DRAM, RAM, SDRAM and SRAM. While at MIT, Forrester realized that the pathways of flows or rate variables and level variables or stocks alternate sequentially, in all natural and societal human systems.
Consequently, Forrester also founded system dynamics [6–8]. Initially called ‘industrial dynamics’, SD is a coherent mathematical method that allows modeling and simulating the collegial component interactions of the entities or unities that, in the context of american pragmatism, all natural and societal human systems are [6, p. 1-1].
Whether dealing with discrete or virtually continuous behavior through time [2], the fundamental difference between simulation modeling and other problem-solving methods lies in the source of the data. In simulation modeling, societal-process data are gathered from computer-simulation models, as opposed to the data gleaned from the real world.
The system-dynamics modeling process described here emphasized parameter estimation and calibration, rooted in simple, bite-size and even open-spiral SD models. As these bite-size models were gradually intertwined, both the static complicatedness and the dynamic complexity of the resultant SD-simulation model increased.
And so did the model’s robustness and, thereby, its usefulness, as new feedback spirals were progressively incorporated, capturing the constraints that each individual production operation added to the polymer-coating production process on Fig. 2. Regarding operations and tactics, and processes and strategies, as defined in [16, Section 4.4], on the one hand, each and every business enterprise entails some operational work.
On the other hand, production operations are arranged along production procedures and processes, driven by well-defined inputs to and desired outcomes of the production and delivery of distinct products. These entail the tangible goods and intangible services that satisfy the particular desires and needs of peculiar clients and customers, in specific market segments or niches.
It is therefore essential to let a business enterprise collegially self-organize, wherein each human being’s work is vital to a production or delivery operation, which in turn contributes to a production or delivery procedure or process. Self-organize, that is, with human intentionality or purposefulness and, also in the context of american pragmatism, with collegial control and responsibility at Liberty, as opposed to becoming subjugated under the top-down imposed, bureaucratically-hierarchized authority and power artifice.
Engaging a team of participants in SD modeling entails suspending, temporarily at least, said bureaucratically-hierarchized authority and power deceit, along with the latter’s dysfunctional and even disastrous effects [20]. While ongoing, the SD-modeling process temporarily suspends the modus operandi or MO of the aye-unnatural authority and power fraud, creating an energetic work environment, focused on fostering tight-knit teams that feed off creativity and innovation [9].
Figures 4 and 5 show the stock-and-flow diagrams of the SD-simulation model that the team of participants helped to creatively craft. Both figures contain multiple parameters and variables, pertinent to the problematic situation at hand, which co-determine the firm’s actual production performance and performance potential (Fig. 6).
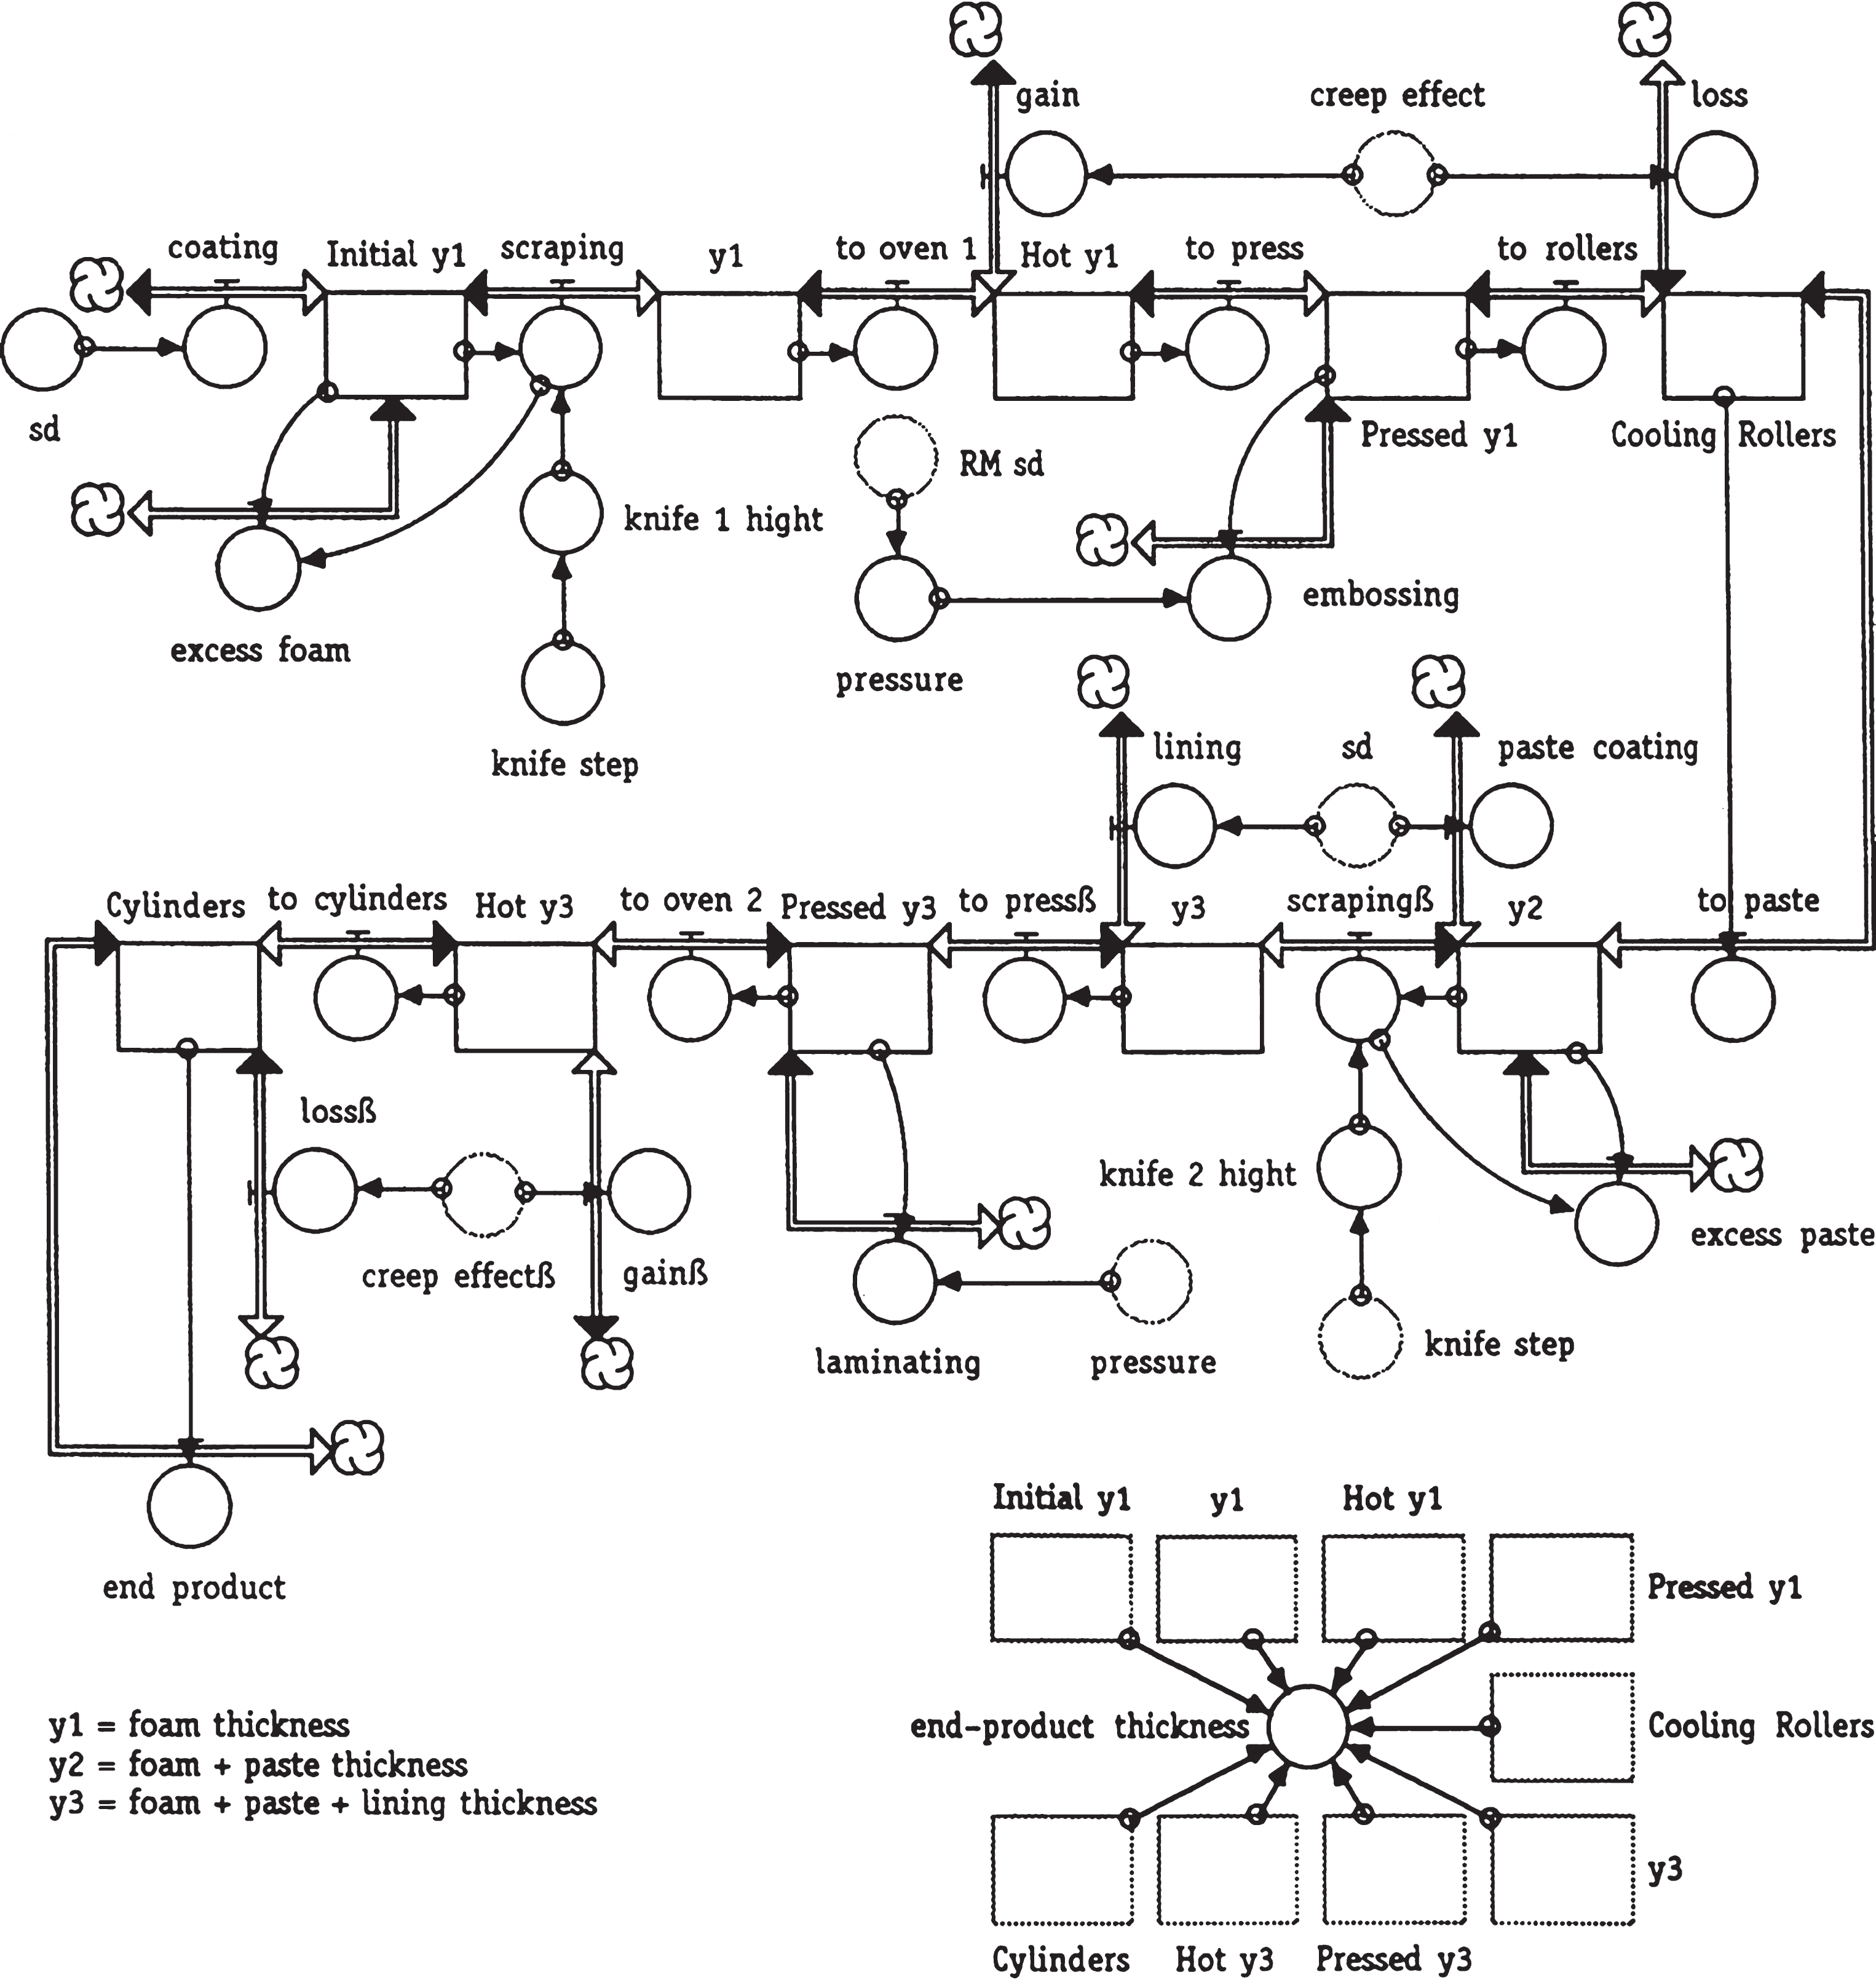
The stock-and-flow pathway of the SD model that tracks end-product thickness, throughout the individual production operations of the polymer-coating production process.
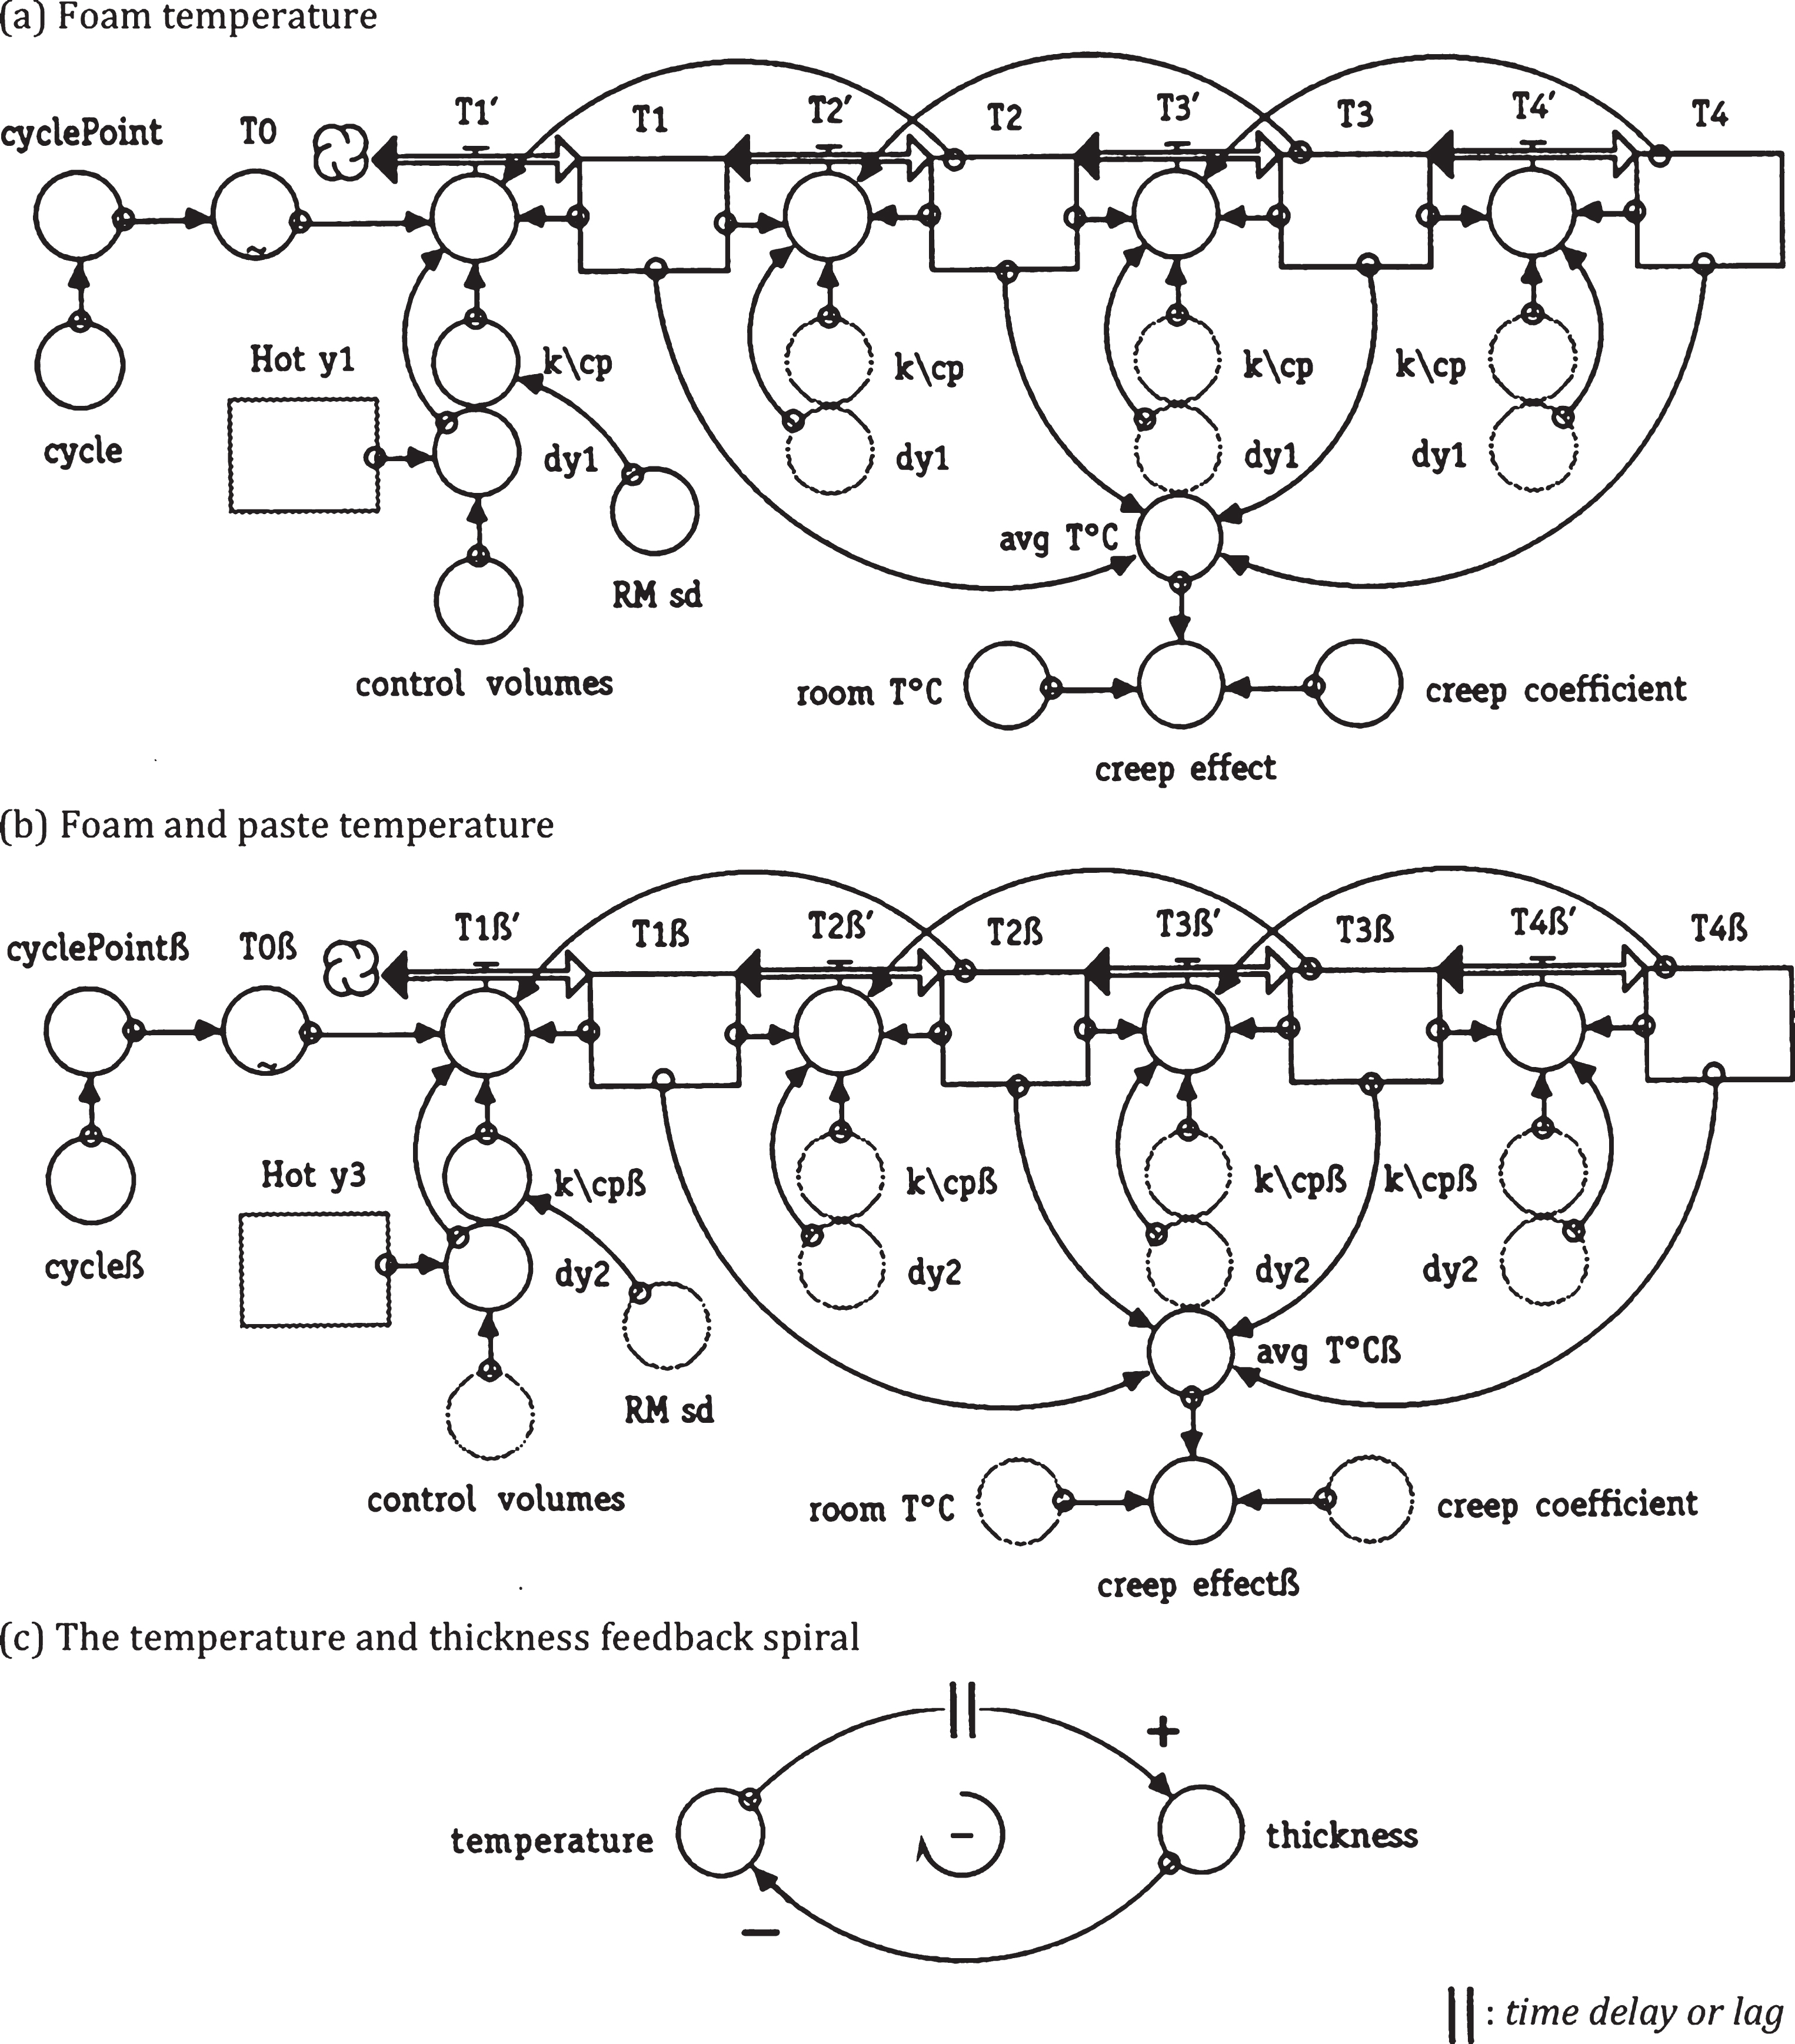
The SD-model (a) foam temperature, and (b) foam and paste temperature stock-and-flow pathways that trail the semi-difference approximations to the space-time-dependent thermal-conductivity rates of the polymer foam and paste, respectively, along (c) the negative feedback-spiral structure of product thickness and temperature.
Variability effects, expressed as the standard deviation or sd, on the uninformative-axes (a) radar chart, on the gelling temperature T, in degrees Celsius or °C, distributed amongst the polymer foam and paste through time, with: (b) special-cause variability, i.e., with tampering with the scraper knives, and (c) common-cause variability, i.e., without tampering with the scraper knives.
Transforming a business enterprise or other societal human organization, via the high technology of self-organizing and self-governing decision-making structures, with collegial control and responsibility, entails enabling the self-emergence of a truly societal human system [9, Fig. 6]. While the SD-modeling process goes on, the emergent enterprise or organization becomes an entity or unity of components and members that act collegially, within a societally humane structure of mutual interactions and reciprocal interdependencies. Collegially too, they also share the human intent or purpose to promote a client firm’s collegial, common or general good.
Whether practitioners or researchers, capable business professionals do not ever pretend to ostensibly design a societal human system — or any other system for that matter. Be it agile or dull, the only thing we actually design is the societal structure required for a system to emerge by or of itself, each and every time human beings, with our human intentionality or purposefulness, interact with said requisite societal structure [9, Fig. 6][10, Fig. 12][16, Section 2.2].
The self-determination capability, which only a true societal human system self-develops, hinges on our human intentionality or purposefulness, though which the reciprocally interacting components and members of a true system collegially create either different results in the same environment or similar results in different environments. As opposed to those deviant, top-down imposed aims, goals and objectives, human intentionality or purposefulness is a requisite condition at work today, along with: autonomy, fair pay for work, so that money is not an issue, and providing the means to developing mastery in what capable business professionals do [16, Table 1].
Every reliable business enterprise already affords these four conditions to its employees and partners. That is how it attracts and retains capable business professionals [9, 16].
Aims, goals and objectives are somehow still acceptable for programming automata and robots, yet business enterprises and other societal human organizations function effectively only with human intentionality or purposefulness. It is precisely this human-organization intentionality, along with the analysis of pertinent stakeholder groups, that collegially drives SD modeling, so that it provides decision support for the continual improvement of a firm’s processes and operations as well as for its strategies and tactics [9, Fig. 1][16, Section 4.4].
Even though the system-dynamics modeling process specifically intends to build insight about the way a societal process performs through time, SD models do depend on stock-and-flow diagrams that depict societal-structure relations, among the parameters and variables pertinent to a system. The working hypothesis behind every SD model is that the societal structure of relations among parameters and variables pertinent to a simulated problématique gives rise to its dynamics, i.e., through-time behavior or societal process.
On Fig. 4, the rectangles represent level variables or stocks that accumulate, such as, for example, Initial y1 and y1, whereas y1 is the polymer foam thickness (legend, southwest corner, Fig. 4). Emanating from cloud-shaped sources and ebbing into cloud-shaped sinks, the double-line, pipe-and-valve-shaped icons represent flows or rate variables that cause the stocks to change, as inflows fill the stocks and outflows drain them.
For example, on the northwest corner of Fig. 4, the coating inflow fills the Initial y1 stock, while the scraping flow at once drains the Initial y1 stock, also drained by the excess foam outflow, and fills the y1 stock. In effect, on the northwest corner of Fig. 4, the first two stocks, along with their surrounding flows and ‘auxiliary converters’, simulate the behavior of the polymer-foam thickness, determined by the coating screen and knife operation on Fig. 2.
Back to Fig. 4. The circular icons are auxiliary converters, wherein behavioral relations and constant parameters convert the information that changes the flows. Last but not least, on the stock-and-flow diagrams of Figs. 4 and 5, single-line arrows represent the information connectors that alter the auxiliary converters and the flows that eventually change the stocks.
Custom-built by the people engaged in the client firm’s polymer-coating process, the pathway of sequentially alternating flows and stocks on Fig. 4 tracks polymer foam and paste thickness, throughout the polymer-coating production process on Fig. 2. I.e., said pathway trails the changes that occur from the initial polymer-foam coating and scraping to polymer-paste coating and lining to the cooling cylinders and to the end product, the thickness of which gets inspected.
On the southeast corner of Fig. 4, the ray-shaped metrics diagram tracks end-product thickness, a cardinally-measured metric, in millimeters or mm. As initially anticipated, the entire SD-praxis research took approximately seven months, requiring two major model revisions, before the client firm received a comprehensive report, with definite suggestions for end-product quality and productivity improvements.
As mentioned heretofore, at the heart of this SD model is a direct translation, into SD-modeling software, of the parabolic partial deferential equations in the most pertinent research work of [20] and [27]. Specifically, the stock-and-flow diagrams on Fig. 5a and b detail the semi-difference approximations to the space-time-dependent thermal-conductivity rates of the polymer foam and paste, respectively.
Both stock-and-flow diagrams on Fig. 5a and Fig. 5b exploit the negative feedback-spiral structure of product thickness and temperature. Notably the higher the polymer temperature is, the thicker the polymer foam and paste gradually become yet, as their thickness increases, the temperature within them is progressively annihilated or sequestered. Shown on Fig. 5c, this negative feedback spiral actively determines the dynamics of the stock-and-flow diagrams on Fig. 4, Fig. 5a and Fig. 5b, with many other feedback spirals nested in its multiple occurrences.
Georgantzas and Zarifopoulou provide the requisite canons of correctly crafting and reading societal-structure diagrams [16, Section 1.3], homologous with the one that Fig. 5c shows. Briefly, however, note that next to its head (∂), each negative arrow or link explicitly bears a negative ‘–’ sign that shows its negative polarity, whereas the polarity of positive ‘+’ links is often implied.
Ordinarily, each and every arrow’s polarity is either negative or positive, showing how the parameter or variable after or on the head of the arrow changes, when the parameter or variable before or at the tail of the arrow increases. Generally speaking, ‘how’ means either moving down (–) or up (+) through time, yet you must exercise caution here.
Whether explicitly shown or not, all feedback spirals, inside them contain a small, identifier loop or spiral, similar to the one explicitly shown in the middle of Fig. 5c. This identifier spiral indicates whether that particular feedback spiral is balancing or negative, drifting, piling, positive or reinforcing and, occasionally, bipolar (–/+).
Usually, a bipolar feedback spiral is the result of a piling or positive feedback spiral that amplifies a bipolar input. And inside every feedback spiral, its small, identifier spiral always matches the spin of the feedback spiral that encloses it.
Without exception, within the reality of each and every single business industry or segment,
Lastly, there is a one-to-one correspondence between each stock-and-flow diagram and its underlying set of difference equations. Building the actual SD model entailed first drawing its stock-and-flow diagrams on the glass of a computer screen and then specifying the algebraic equations and parameter values for its particular elements. SD-simulation software enforces consistency between diagrams and equations, while built-in functions help quantify parameters and variables, pertinent to a particular firm’s problematic decision-making situation or problématique.
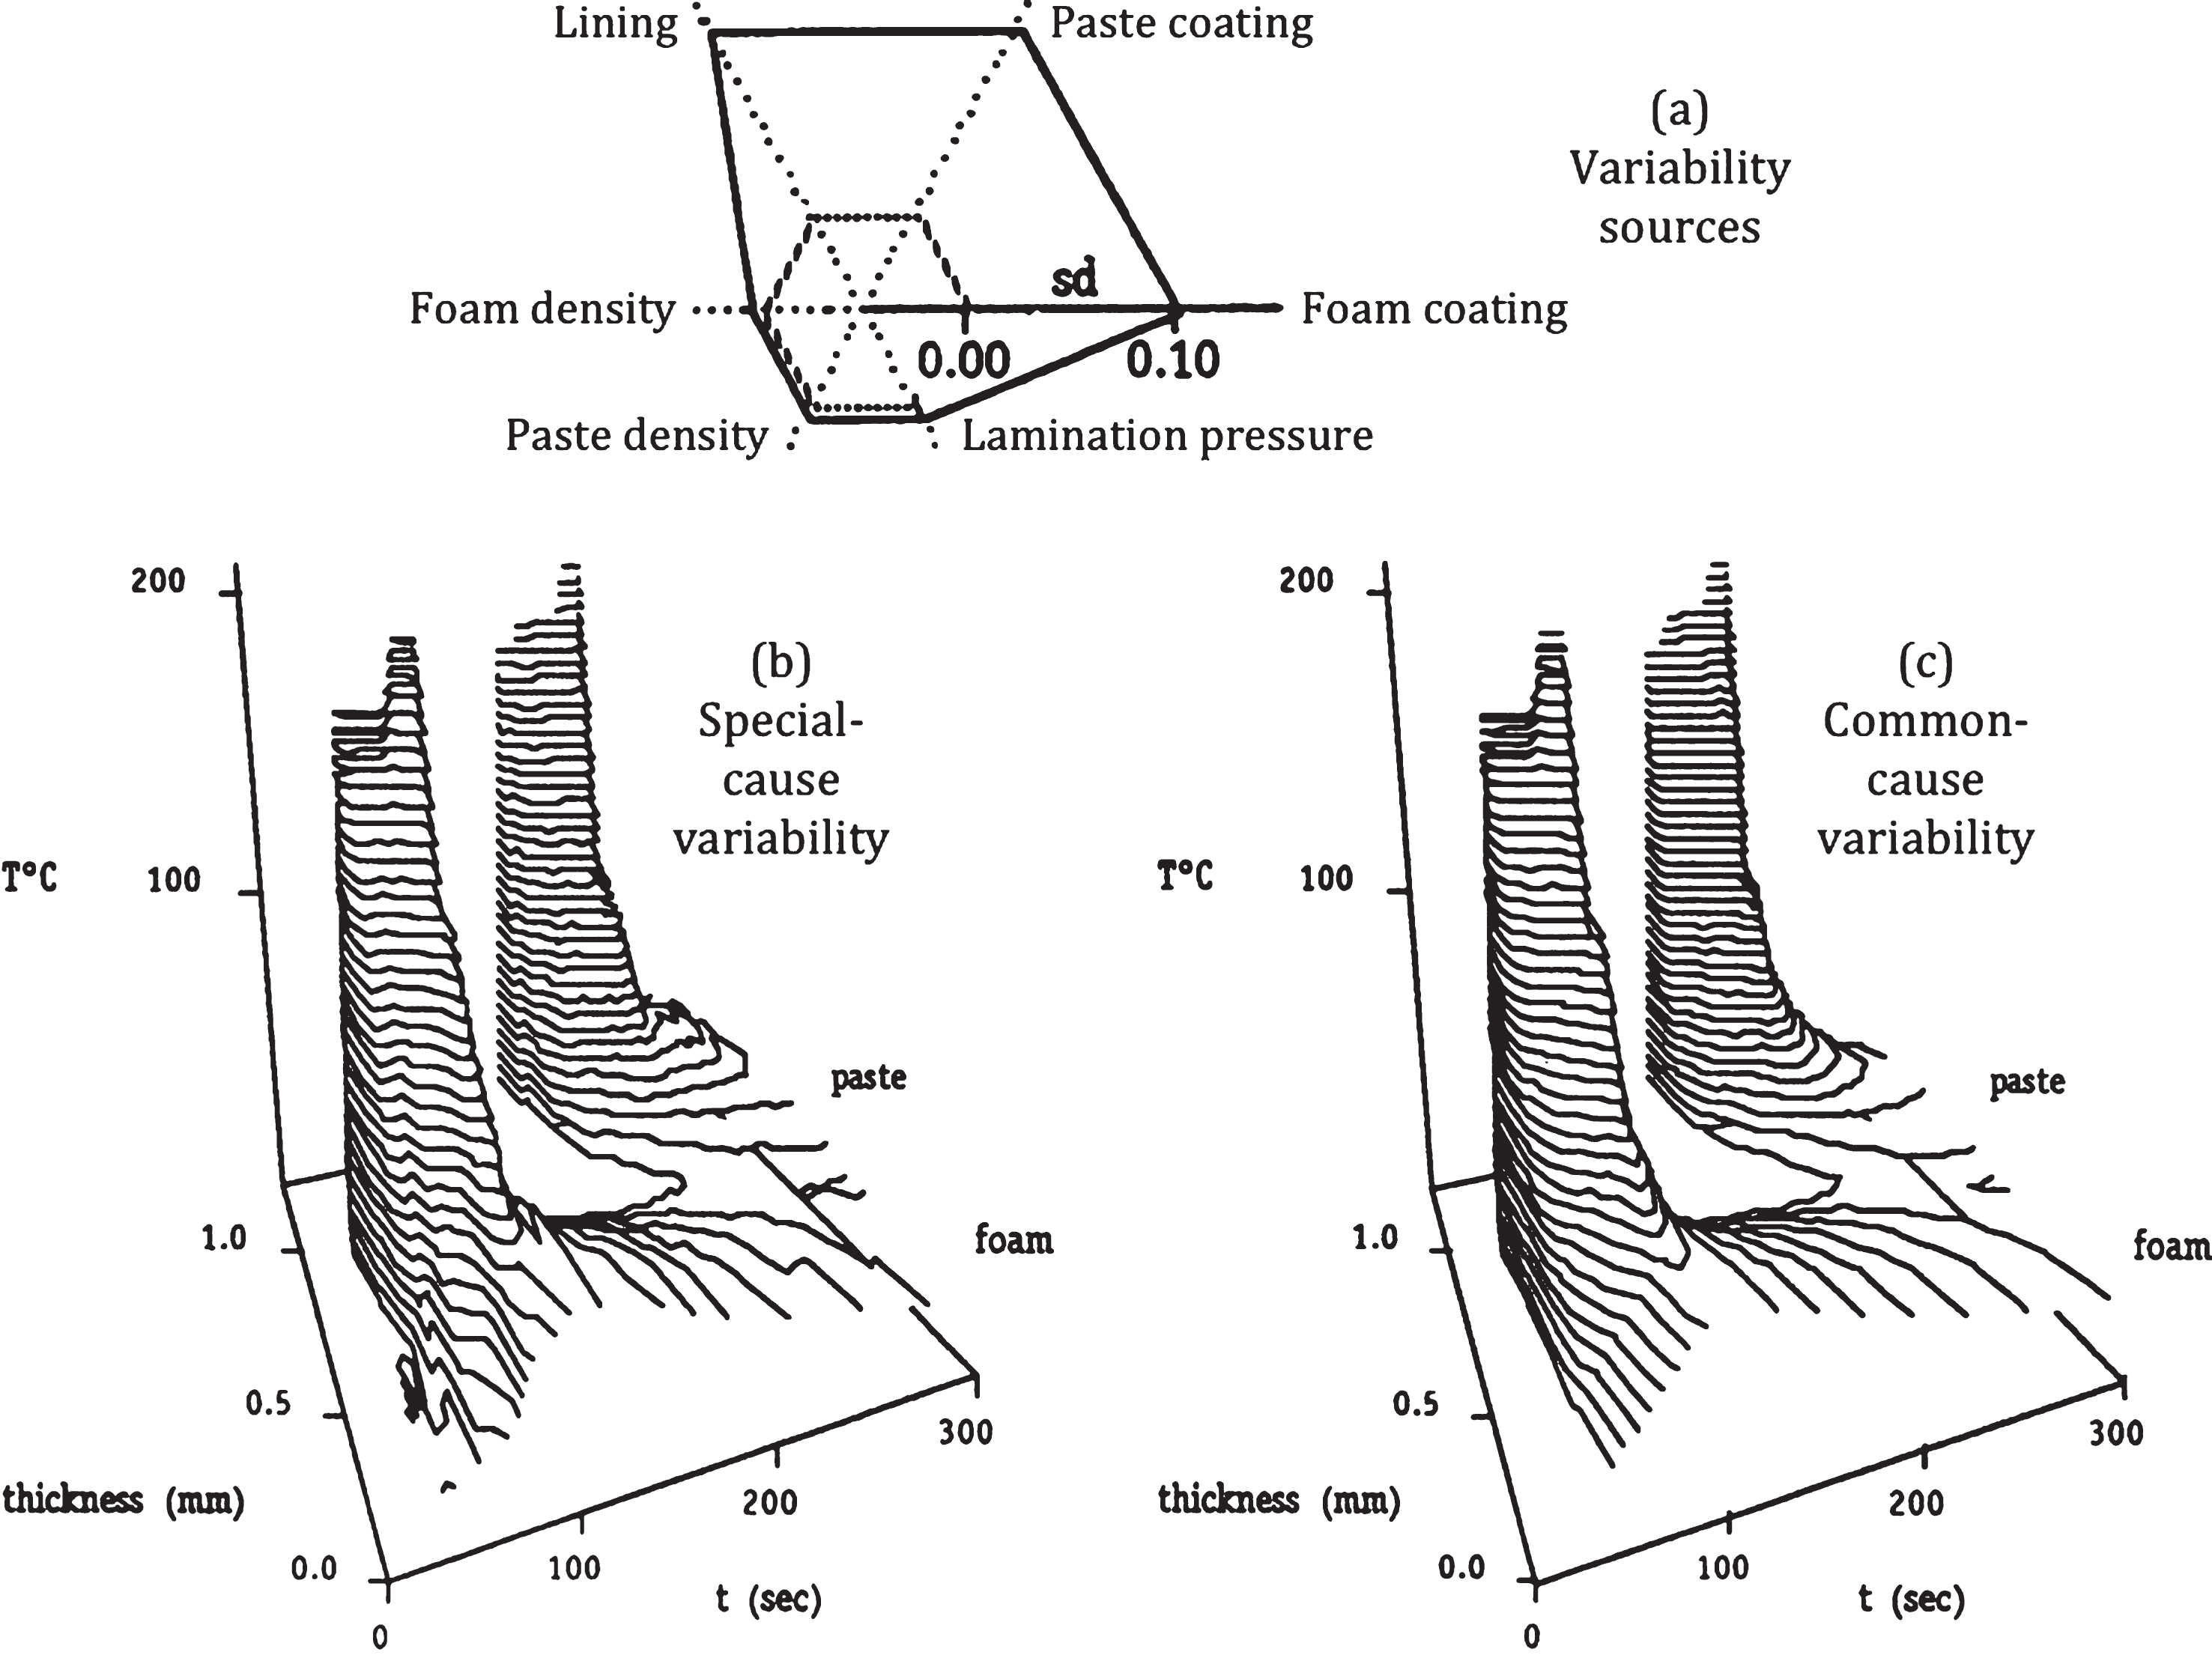
Once multiple prebuilt system-dynamics models had been revised, according to the modeling-process participants’ input, a set of computed simulation experiments followed, similar to those shown on the tri-dimensional graphs of Fig. 6. Combined with process-capability SPC charts, the intent of each computed experiment was to challenge intuition about the continual improvement of quality – and thereby productivity–of the client firm’s polymer-coating production process (Fig. 2).
The uninformative axes of the radar chart on Fig. 6a show the sources of variability, quantified as the standard deviation or sd, of the gelling temperature T, in degrees Celsius or °C, distributed amongst the polymer foam and paste through time. These variability sources were used in the context of a design-of-experiments investigation, comparable with the one [11] describes, containing a straightforward method for computing the combined effects of experimental variables.
Figure 6b and c allow comparing the simulation results computed with: (b) special-cause variability and (c) common-cause variability. On the tri-dimensional space-time of Fig. 6b and Fig. 6c, the x axis or coordinate depicts the polymer travel time t, in seconds or sec, on the embossed-paper conveyor belt of the polymer-coating process.
The y axis displays the foam and paste thickness processed through time, in millimeters, abbreviated as mm. And the z axis or coordinate shows the gelling temperature T, in degrees Celsius or °C, distributed amongst the polymer foam and paste through time.
Apparently, raising up high those scraper knives on Fig. 2, to a position higher than the one specified, did not just increase product thickness, but also increased the surface variability of the polymer foam and paste. That written and signed command, not with one, not with two, but with a total of five signatures, obligated the polymer-coating workers to obey it by tampering with the polymer-coating production process, i.e., by raising the foam and paste scraper knives on Fig. 2.
Figure 6b is precisely the result of raising of the foam and paste scraper knives, which increased the surface variability of the polymer foam and paste, thereby enabling this special-cause variability to enter the polymer-coating production process. Not that difficult to spot, on the contour-surface plot through time of Fig. 6b are the detrimental results of polymer-shear instability [28]. Helped by the polymer gelling ovens’ thermal effects, the raised high polymer foam and paste scraper knives on Fig. 2 alter polymers’ molecular geometry and shear instability.
Conversely, as the contour-surface plot of Fig. 6c shows, the polymer-shear instability notably subsides, once the polymer foam and paste scraper knives are set at their specified level or position. The much smoother surface than the one shown on Fig. 6b is the result of running the polymer-coating process, without anyone tampering with the polymer foam and paste scraper knives.
In essence, the results on Fig. 6b and c can be construed or seen as the before and after computed outcomes: the actual polymer-coating process performance before the SD-modeling process and the polymer-coating process performance potential after SD modeling. Alternatively put, the special-cause surface variability on Fig. 6b entails tampering with the scraper knives, and the common-cause surface variability on Fig. 6c entails no tampering with the scraper knives, of the polymer-coating production process.
Throughout the SD-modeling process, the more the participants felt they own the SD model and its simulation results, the more eager they became to implement the changes recommended by the computed results. After comparing the results on Fig. 6b and c, for example, one of the SD-modeling participants fetched a black permanent marker, with which she struck down the top-down imposed authoritative order, commanding the polymer-coating workers to raise the polymer foam and paste scraper knives, whenever the polymer gelling ovens became too hot.
This is exactly how the client firm’s end-product waste was drastically minimized, and its production quality and thereby productivity both improved. SD modeling enabled the praxis-research participants to collegially share a jointly-common mental model of their quality and productivity improvement options, entirely compatible with the computed simulation results.
Discussion
In the last 70 or so years, the computer evolution has turn simulation modeling into a prerequisite for organizational learning. The synthesis of statistical process control and system-dynamics simulation modeling for learning now enables the client firm to compete both effectively and efficiently, in the worldwide artificial-leather market.
Creating new knowledge [16, Fig. 6.3.4][31, 32] about the client firm’s polymer-coating production process on Fig. 2 required capturing aspects of its societal structure that were neither easy to observe nor unchallenging to quantify. The value added by employing SD modeling alongside SPC emanates from the broad, yet coherent method that the SD-modeling process so eloquently and generously provides [2, 30].
An obvious limitation of this praxis research concerns the generalizability of its results, as the entire intervention relied on the knowledge and skills of capable business professionals within only one business enterprise, in the vast artificial-leather industry. Neither is generalizable the peculiarity of tampering –or not– with polymer foam and paste scraper knives.
Yet as the client firm’s end-product waste was drastically minimized, and its production quality and thereby productivity both improved, of particular interest is the negative feedback-spiral structure of product thickness and temperature, on Fig. 5c. Generally speaking, in a polymer-coating production process, the higher the polymer temperature gets, the thicker the polymer foam and paste gradually become, yet as their thickness increases, the temperature distribution within them is progressively annihilated or sequestered.
Even such a relatively simple problematic decision-making situation can, however, seem especially perplexing. Typically, the cogitational discombobulation felt is owed to a lack of mentally grasping the way feedback spirals work [16, Section 1.3], formalized through cybernetics by the American mathematician and pioneering thinker, Norbert Wiener (1894-1964).
Overall, this SPC-SD synthesis allowed bringing together a unique combination of societal human system knowledge and skills [10], a prerequisite for both continual improvement and effective simulation modeling. As a result of the spontaneously annihilated, bureaucratically-hierarchic, top-down imposed tampering, the client firm’s polymer-coating production process was back in control, stably exhibiting a relatively low, common-cause variability.
The SD-modeling participants volunteered their polymer-coating production ken as well as their collegial collaboration. Without either of these contributions, neither the SD-simulation model on Figs. 4 and 5 nor the simulation results on Fig. 6 could have been generated.
According to Deming, otherwise capable business professionals do tamper with business processes because they are [both told and] taught to do so [3, 4]. They react to each dip in business performance, as if things were beginning to fall apart; and to each rise in performance, as if things were improving.
Typically, nothing has changed at all. What business people react to is common randomness, which pervades all business processes as «a measure of our ignorance» [26, p. 127].
Future research directions and policymaking recommendations often entail parting ways with mere descriptiveness and entering the normative realm. The profound knowledge needed, for example, to stop tampering with business processes, integrates learning theories, organizational arrangements or setups, statistics and psychology, yet it always begins with building appreciation for what a true system is and what is not [3, 4].
Besides, Deming persistently said: «Until you draw a flow diagram, you do not understand you business» [23, p. 21]. System dynamics does use flow diagrams of feedback spirals and stock-and-flow diagrams to depict the relations among the parameters and variables pertinent to a true system, as the societal structures of such systems determine their societal processes trough time.
In the context of living-systems’ autopoietic self-organization [34], Humberto Maturana and Francisco Varela [19] define living systems neither as objects to observe and to describe nor as mere arrangements of interacting components, but as already self-contained entities or unities. In a pragmatic sense then, e.g., in the american-pragmatism context of learning organizations, an enquiry or inquiry process does not necessarily have to produce any unified wholes within reality, as both natural and other societal human systems emerge as unified wholes by or of themselves.
Within reality, in their majestic mutual interdependence and reciprocal causality, all such systems rely on feedback spirals. Yet per Forrester’s own definition of a system [6, p. 1-1], feedback is a necessary but insufficient condition to defining a truly societal human system.
The top-down imposed, bureaucratically-hierarchized authority and power artifice also relies on feedback spirals. But feedback alone does not make this delusion of organization the truly societal human system that every learning organization aspires to become [10, Fig. 10].
In many diverse scientific fields, researchers build computer models that simulate naturally autopoietic, self-organizing and self-governing systems. Flocks of birds, gangs of elk, herds of sheep, shoals of fish and swarms of bees react in similar ways, as their members move together in an elegantly synchronized manner. Sometimes, the flock or shoal behaves as if it were a single animal.
There is no head bird or fish ‘leader’, however, that tells others how to move. Computer simulations reproduce this behavior by letting individuals interact according to a few simple rules, such as keeping a minimum distance from others and following the average direction of neighbors’ moves. A coherent pattern of a whole organization emerges out of local interactions.
Similarly, the twenty-foot termite towers in the Australian savanna are also the result of collegial responsibility and control. Each termite colony is a magnificent example of autopoietic self-organization and self-governance, collegially building intricate towers from the seemingly random movements of many individuals. Relative to the size of their builders, termite towers are the tallest structures on the surface of planet Earth.
Paradoxically, however, when it comes to business enterprises and other societal human outfits, the bureaucratically-hierarchized authority and power delusion of organization seems to be keenly acceptable. Why and how this apparent lack of concern transpires among subjugated human beings is a phenomenon that urgently needs investigation.
Historically, the German economist, jurist, sociologist and thinker, whose ideas profoundly influenced societal research and theory, Karl Emil Maximilian ‘Max’ Weber (1864–1920), in bureaucratic hierarchy saw a positive régimented artifice. He expanded its meaning and connected bureaucratic hierarchy with well-trained, appointed employees and fixed sets of rules, his ambition plausibly being the absolute hegemony of preordained, properly schooled and trained officials.
By 1944, the Austrian economist, Ludwig Heinrich Edler von Mises (1881–1973), observed that bureaucratic hierarchy implies an opprobrious hubris. And by 1957, the American sociologist and University Professor at Columbia University, Robert King Merton (1910–2003), pointed out that the horrid hybrid term ‘bureaucrat’ already is an absolutely negative, if not a hubristic epithet.
Decidedly critical of Max Weber’s work, Merton sees in bureaucratic hierarchy a set of strictly hierarchized offices or posts and statuses, whereas all obligations and privileges are imposed by very limited and specific, stringently régimented rules [20, pp. 195–206]. Each office’s authority and power pettifoggery stems from an artificially acknowledged status, whereby all official acts and praxeis are dictated top-down, strictly by preexisting stringent rules.
The top-down imposed relations among offices involve such a high degree of formality that they indubitably dictate the vertical distance among these positions’ occupants. Reminiscent of the yurt-dwelling shamanism, these wincingly régimented formalities are manifested through jejune rituals that perspicuously symbolize and underpin each office’s pecking order.
Even people who are as aware, as educated and as sophisticated as, for example, Robert K. Merton was, often fall prey to the pseudaristocratic-scoundrel propaganda. Apparently, academic sardonicism notwithstanding, Merton must have sincerely thought that bureaucratic hierarchy, that deceit about which he is so decidedly condemnatory, entailed some kind of societal structure [20].
Given the ubiquity of said propaganda, which deceptively postulates the false idea that bureaucratically-hierarchized arrangements or setups are systems, Forrester fell prey to it too. Consequently, despite his dazzlingly founding SD, he spuriously postulated «hierarchy» on the pathways of flows or rate variables and level variables or stocks, which do alternate sequentially, in the societal structures of all natural and societal human systems, as Forrester himself brilliantly realized [6–8].
With the intent of spurring business enterprises and other societal human organizations, particularly ones with the SD-modeling capability, to the high technology of self-organizing and self-governing societal human systems, Fig. 6 in [9] shows the pragmatically-practical organizational chart or organogram of a collegially-humane, high-technology decision-making structure. Adapted from [16, Fig. 7.5.1], that organogram pertains to the (a) process, (b) business and (c) corporate spheres of a business enterprise or other societal human organization, favoring its collegial, common or general good. Both etymologically and notionally, the collegial, common or general good of its members defines a system, be it a natural or a societal human system [10][16, Table 1].
In response to the bureaucratic hierarchy’s dysfunctional and even disastrous effects [20], each component on Fig. 6 in [9] contains an exact depiction of the whole organogram that the diagram on that figure shows. Most pertinent to entrepreneurs and intrapreneurs, the organogram is inspired by Ackoff’s systems-thinking work [1], which Georgantzas and Zarifopoulou embellish [16, Section 7.1], and by the beyond-empowerment testimonials [17, 18], among other pioneering business-enterprise examples [9][16, Section 8.2].
In opposition to the bureaucratic hierarchy’s dysfunctional and often disastrous effects, many conventional business journals and textbooks promote the foolish idea of empowering employees by distributing authority and power among them. Yet distributing authority and power among employees does not render obsolete and unnecessary the bureaucratically-hierarchized authority and power delusion of organization.
Neither does the much-vaunted treatment of resorting to managing both down and up within a bureaucratic hierarchy, in order to survive its dysfunctional and even disastrous effects. Only the collegial creation of a self-organized and self-governed collegially-humane structure can render obsolete and unnecessary the bureaucratically-hierarchized authority and power delusion of organization. From such a structure [9, Fig. 6], a societal human system emerges by or of itself, wherein both individual and collegial control and responsibility flow at Liberty, in lieu of the authority and power chicanery.
One specific future-research direction entails assessing the way such exemplifying business reorganizations commence, once capable business professionals embark on voluntarily participating in the civically-structured processes of a business enterprise. Of particular research interest is how capable business professionals take on the responsibility of such processes’ collegial control, isodistributed among all voluntarily-participating business partners and employees.
For example, how do self-organization and self-governance transpire in collegially-humane networks? Although networks are much in vogue lately, most of them are ineffective, as they are subjugated under the bureaucratically-hierarchized authority and power artifice, steeped and probably rooted in shamanistic ritualism. To be effective, a network must be both self-organized and self-governed as a collegially-humane structure, from which emerges by or of itself, a societal human system, wherein both individual and collegial control and responsibility flow at Liberty, in lieu of the authority and power chicanery.
Being a truth-seeking process, i.e., intended to unconceal ‘A
Indeed, in the dual, worldwide context of autopoietic company value- and industry supply-chains [9], the SPC-SD synthesis helps pioneering business enterprises and other societal human organizations to prosper, in culturally diverse industries. Of distinct research interest is the self-governance process, via which engaging a team of participants in continual improvement suspends, temporarily at least, if not permanently [9], the bureaucratically-hierarchized authority and power artifice, that delusion of organization, along with its dysfunctional and even disastrous effects [20].
Conclusion
These future-research directions and policymaking recommendations conclude the current praxis research on the successful reorganization of a polymer-coating production process. In conclusion, the praxis research inductively demonstrates the capability of the SD-modeling process to render the bureaucratically-hierarchized authority and power artifice obsolete and unnecessary.
And in tune with the SD-modeling process are W. E. Deming’s fourteen points [3, pp. 23–24]. These constitute a sphere of both effective and efficient tactics, highly leveraged toward employing CWQC, 6σ, SPC and TQM programs, alongside SD modeling.
As a set of practices that pioneering business enterprises already engage in, and thereby increase their effectiveness, efficiency, quality and productivity, Deming’s fourteen points are adapted from [16, Section 5.3] and slightly reworded below. This way they are consistently akin to the societal human systems’ also fourteen anthropocentric and society-centric, civic, ethical and moral ideals [16, Ch. 5 and Ch. 6].
Many business practitioners and researchers confuse civic, ethical and moral principles and values, with civic, ethical and moral ideals. Yet these are distinctly different notions.
Principles and values change continually through time, depending on prevailing circumstances. Conversely, owed to their peculiarly unattainable nature, civic, ethical and moral ideals do not change through time, no matter how insistently a society-specific culture pursues them.
Deming’s fourteen points [3, pp. 23–24]; adapted from [16, Section 5.3]
Create intentionality constancy toward the improvement of your business enterprise’s goods and services, with the explicit purposefulness of its becoming competitive and staying in business to provide jobs. Adopt the new [societal human systems] philosophy. We are in a new economic age. Western supervision must awaken to the challenge, and assume and learn to bear its responsibilities toward a collegial leadership for its integral transformation. Cease dependence on inspection to achieve quality. Eliminate the need for inspection on a mass basis by building quality into your goods and services in the first place. End the practice of awarding business on the basis of price tags. Instead, minimize the total cost of coordination by moving toward either a single or a few suppliers for any one item, by building the long-term human relationships of loyalty and trust. Improve continually and forever the system of goods production and service delivery, by improving quality and productivity, and thereby perpetually decreasing total cost. Institutionalize training on the job. Institutionalize collegial leadership, with supervision’s intent to enable people, machines and gadgets to do high-quality work. Supervision is in need of a major overhaul, along with the supervision of workers, goods production and service delivery. Drive out fear, so that everyone works effectively for your business enterprise. Break down barriers between departments, so that people in goods and services delivery, design, production, research and sales work as a team, to foresee the problematic situations encountered with every good or service. Eliminate pressing exhortations, slogans and targets for the workforce, asking for zero defects and new productivity heights. Such pressures create only adversarial human relationships, as the bulk of the causes of low quality and low productivity belong to the design of goods production and service delivery, and thereby lie beyond the collegial control of your workers. Eliminate quotas and work standards on the factory floor. Substitute with collegial leadership. Eliminate management by objectives (MBO). Eliminate supervision by numbers and numerical goals. Substitute with collegial leadership. Remove barriers that rob hourly workers of their Liberty to take pride in their work. The responsibility of supervisors must be changed from sheer numbers to quality. Remove barriers that rob people in engineering and supervision of their Liberty to take pride in their work. Inter alia, this entails the abolishment of the annual merit rating and management by objectives (MBO). Institutionalize a vigorous program of civic or political agōgē, education and paideia, toward people’s self-development and self-improvement. Enable everyone in your business enterprise to work to accomplish its integral transformation. Its integral transformation is everyone’s collegial responsibility.