
Abstract
The rapid development of gene expression profiling experiments in recent years has created a great demand for triclustering, i.e., simultaneously clustering genes, conditions or samples and time points of the time-series gene expression data. Triclustering of the time-series gene expression data is of significant importance in biological engineering due to its great potential in identifying key genes in uncharted genome regions. In this paper, a new multi-objective constrained triclustering model is formulated to detect the key genes for time-series gene expression data, where a new objective based on the Wilcoxon sign-rank test is developed to measure the fluctuation of the gene expression values across different time points. A novel population decomposition based evolutionary multi-objective algorithm with customized three-point crossover and mutation operators is proposed for the formulated model. To validate the effectiveness of the proposed method, a series of experimental comparisons are first conducted on a set of artificial benchmark datasets, and then the proposed method is applied on real-life human gene engineering problems of detecting the key gene with similar functionality in biological processes. Experimental results, compared with three previous well-established triclustering algorithms, demonstrate the effectiveness of the proposed method. Furthermore, applications of the proposed triclustering method on biological and computer engineering problems are conducted.
Keywords
Introduction
In the past few decades, microarray technologies have been widely used in bioinformatics and bioengineering to represent the gene expression information. Microarrays are employed to measure the expression levels of cell function related genes under different conditions in terms of gene expression matrices in a given organism. With the developments of gene expression profiling experiments in recent years, a large amount of microarray data are generated, and thus the demand for microarray data analysis is increasing dramatically. Analysis of gene expression microarray data can help to better understand some control mechanisms in the process of gene expression. It has been found that genes with a similar expression profile are likely to have the same biological mechanism [1, 2, 3]. Therefore, clustering of similar gene expression patterns is very crucial to discover regulation mechanisms. As an unsupervised machine learning method, clustering has been applied in many biological areas for data analyzing, such as protein sequence clustering and classification [4]. Traditional clustering methods tend to identify the data points with similar traits and assign them into clusters, and thus it can partition similar genes over a set of samples or samples over a set of genes into the same cluster, respectively. However, previous studies have reported that genes may not necessarily to be functionally related over all samples, and thus it is much more reasonable to group clusters from a subset of samples to better identify functionally related genes. To meet this end, the gene expression matrix needs to be clustered in a new way, i.e., simultaneously clustered from both rows and columns of the gene expression matrix. Therefore, the concept of biclustering was introduced by Hartigan [5], which aims at finding groups of genes with related expression levels under different experimental conditions (or samples) by simultaneously clustering both genes and samples (or samples). Cheng and Church first applied the biclustering algorithm to analyze the gene expression data, and have achieved great success [6]. Since then, biclustering algorithms have often been used to discover local patterns in two dimensional gene expression datasets [7, 8]. Biclustering differentiates itself from the traditional clustering in two ways. First, biclustering simultaneously performs clustering in two dimensions which yields a local model, while traditional clustering generates a global model. Second, it has been proved that biclustering is an NP-hard problem [9], and thus it is much harder than traditional clustering. Later, it was found that multiple time points of gene expression data needed to be collected to trace some specific biological processes, and a great amount of time-series gene expression datasets are generated. To deal with these three dimensional time-series datasets, triclustering method was proposed to perform simultaneously clustering in three different dimensions of gene expression data with time-series. Zhao and Zaki proposed the TRICLUSTER algorithm to group sets of genes with similar expression over a subset of samples during a subset of time points [10]. A set enumeration tree based triclustering algorithm was proposed by Jiang et al., where the Pearson correlation coefficient was used to measure the quality of triclusters [11]. Tchagang et al. [11] proposed a triclustering algorithm called OPTricluster for mining short time series gene expression datasets. A robust triclustering technique and its application in condition specific change analysis in HIV-1 progression Data were studied by Kakati et al. [12]. A new mean squared residue score (MSR) was introduced by A. Bhar et al. [13, 14] in
Preliminaries
In this section, the background of this study is introduced. To be specific, the basic concepts of microarray gene expression data, triclustering and the main idea of the population decomposition based evolutionary multi-objective algorithm will be described in detail.
Microarray and time-series gene expression data
The DNA microarray is also known as DNA chip and biochip which collects microscopic DNA spots on a thin glass or nylon substrates in an array [37]. By using the DNA microarrays technology [38], gene expression data can be generated and represented by matrices of expression levels of genes under different conditions such as environments, individuals, and tissues. For time-series gene expression data, each gene corresponds to a high-dimensional vector of its expression profile at each time point, and thus it can be represented by a three dimensional matrix:
where
An illustration of gene sample or condition time microarray.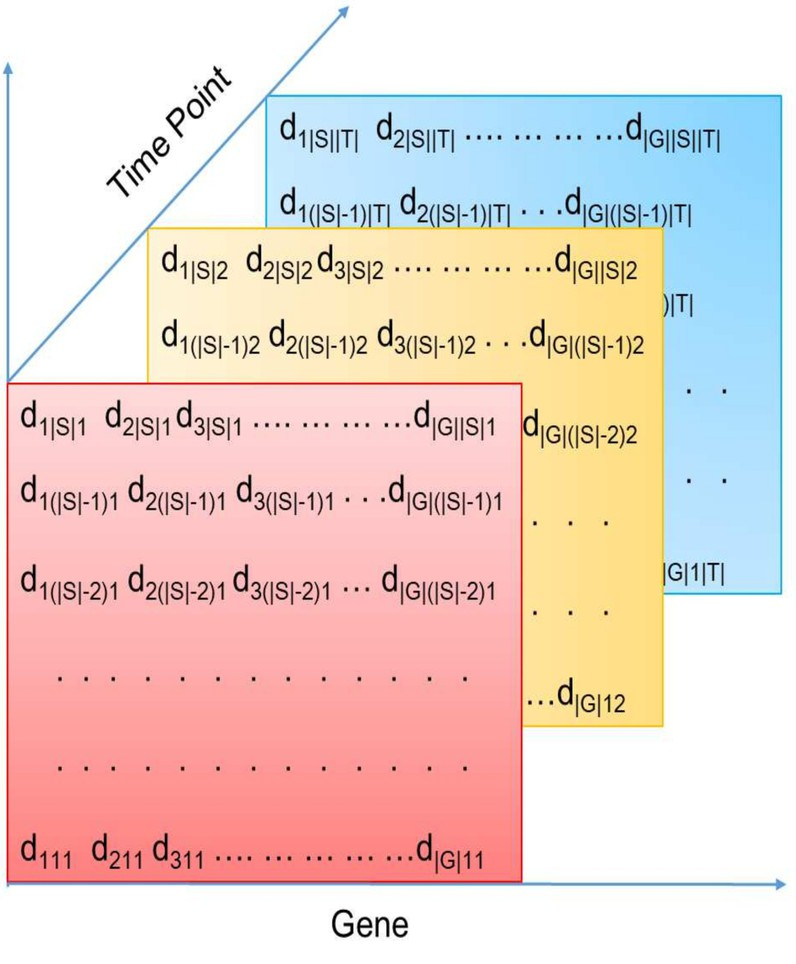
Triclustering aims at mining coherent clusters in three dimensional gene expression datasets. If three dimensional matrix
Multi-objective constrained triclustering
In this section, the proposed multi-objective constrained triclustering (MOCT) method is described in detail. A multi-objective optimization problem (MOP) can be defined as:
where
The goal of triclustering is to find triclusters with maximal size of volume, i.e., submatix of three dimensional time-series gene expression microarray, where genes show high homogeneity over a range of samples or conditions during a series of time points. Thus, the measurement of the size of a tricluster and the homogeneity among the genes in a tricluster needs to be firstly defined in detail. The size of a tricluster represented by a three dimensional submatrix can be measured by the ratio of volume between the submatrix and the whole matrix that represents the gene sample and time point microarray. Therefore, the first objective to be maximized for the proposed multi-objective constrained triclustering model is:
In this paper, the mean squared residue of tricluster is used to measure the homogeneity of the element in each tricluster. The squared residue of a matrix
here,
To maximize homogeneity, the mean square residue scores of matrix
To measure the fluctuation of each gene expression value at different time points, the Wilcoxon signed- rank test is embedded in a new objective. In statistic, Wilcoxon signed-rank test is used to evaluate weather two related samples are coming from the same distribution. Considering that the genes with coregulated functionality may be up- or down-regulated by the transcription factors during a series of time points, the Wilcoxon signed-rank test is applied to every two sets of the mean expression value of the
Here,
In multi-objective optimization, all the objectives are treated equally such that triclusters with extreme MSR scores can be generated. Therefore, a constraint that the MSR score of each tricluster should not excess a threshold
subject to the following constraints:
The threshold
The size of genes, samples and times must be bigger than zero.
Any two of the size of genes, samples and time series cannot be less than or equal to one at the same time.
Here, the first constraint defines the maximal MSR value of the resultant triclusters. The second constraint is necessary and easy to understand. The third constraint is used to avoid producing the trivial triclusters, i.e. two dimensional triclusters. For example, if
In this part, a decomposition based evolutionary algorithm with customized recombination operators, within the framework of MOEA/D-M2M population decomposition, is specially designed for the proposed multi-objective constrained triclustering model. The details of each important part of the decomposition based algorithm are first described. Then, the entire process of the proposed algorithm for triclustering is given as a whole.
Encoding and decoding
Encoding method is an important aspect of evolutionary multi-objective algorithm especially for solving discrete optimization problems. In this paper, a binary coding method is used to encode all the chromosomes. To represent every possible tricluster, a total of
An illustration of the binary representation for a tricluster.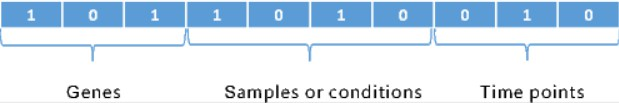
In evolutionary algorithms, recombination operation is used to create the new offspring, and it usually includes the crossover and mutation. Traditional recombination method usually randomly selects a point on the chromosome for crossover and mutation. Considering that the number of genes is much more than that of samples (conditions) and time points, the traditional renomination method will be much more likely operates only on the gene section of the chromosome if traditional recombination method is applied. In this paper, a new customized three-point crossover method based on the characteristic of the tricluster is specially designed for the proposed multi-objective triclustering model. To be specific, three points on the chromosome are selected independently when conducting the crossover operation. The first crossover point is restricted in the first
The customized three-point crossover.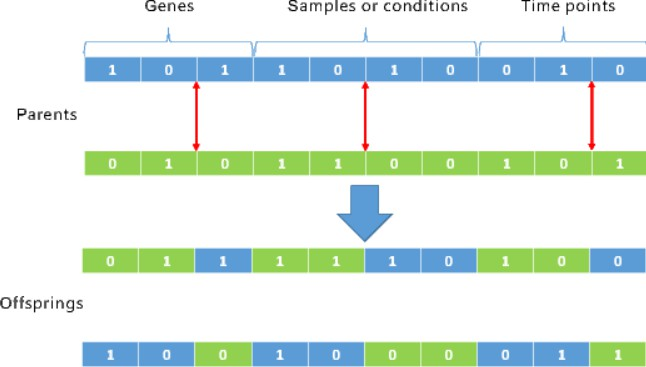
Considering the randomness of the population based search in the evolutionary algorithm, an efficient local search strategy is included to improve the search efficiency and accelerate the convergence. Following the consideration of the trade-off between MSR and the size of the tricluster in the multi- objective triclustering model, a two-step local search method is designed as follows:
Nodes adding. In this step, nodes are added to a tricluster as many as possible under the circumstance of not increasing the MSR of the tricluster.
Nodes deleting. In this step, nodes of a tricluster are deleted until its MSR is less than the threshold
Algorithm 1 gives the details of the two-step local search method. As described in step 1, the gene node from the complementary set of
It is also worthy noting that during this local search procedure, the solutions that violate the constraints (1) and (2) will also be repaired. Therefore, no extra constraint handling strategy is needed.
InputInput OutputOutput Two-step local search
Find gene
Recalculate
Recalculate
Recalculate
MSR>
Delete gene
Recalculate
Find sample
Delete sample
Recalculate
Find time point
Delete time point
Recalculate
MOEA/D-M2M is a new version of the MOEA/D, which decomposes a multi-objective optimization pro- blem into a set of multi-objective optimization subproblems. In general, it is assumed that all the objective functions to be optimized are positive, i.e.,
where
MOEA/D-M2M optimizes these
In this part, an overall view of the proposed multi-objective triclustering algorithm, using the procedures described above, is given. Figure 4 gives the main flow chart of the proposed method for triclustering. At first, the multi-objective triclustering model is formulated for the three dimensional dataset. Then, an evolutionary multi-objective optimization algorithm, with customized crossover and mutation, is specifically designed for this multi-objective model. At last, the triclusters are output and analyzed.
The main flow chat of the proposed multi-objective triclustering algorithm.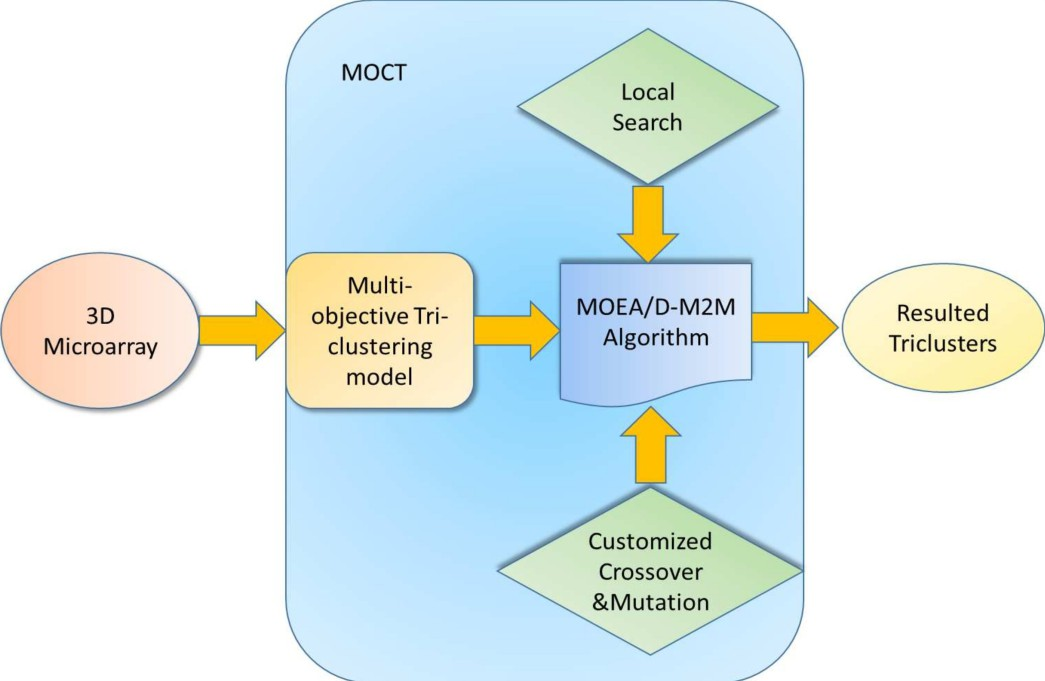
Algorithm 2, together with Algorithms 1 and 3, depicts the details of the proposed algorithm for the multi-objective constrained triclustering model.
InputInput OutputOutput M2M population decomposition based MOCT algorithmMulti-objective constrained triclustering model;
Set
InputInput OutputOutput Subpopulations updating
Rank the solutions in
In this section, experimental studies of the proposed triclustering algorithm are conducted. To be specific, the effectiveness of the proposed MOCT on a set of artificial datasets is firstly validated, and then further experimental studies for key gene detection on real-life human genome datasets are conducted to verify the effectiveness of MOCT.
Performance metrics
In this study, the Affirmation Score (AS) [14] and Statistical Difference from Background (SDB) [41] score are used to measure the performance of the proposed triclustering method and the comparison triclustering algorithms on a set of benchmark datasets.
Affirmation score
The affirmation score can be calculated as:
where
SDB score [41] is used to measure if a set of obtained triclusters is statistically different from the background data matrix, and it can be calculated as:
here,
The general settings of MOCT are kept the same as EMOA-
Population size Mutation probability is 0.9 for EMOA- For artificial datasets, parameters shown in Table 1 are used in MOCT, EMOA- For real life data sets, The parameters used in TRICLUSTER and OPTricluster are kept the same as the original studies [10, 11].
Parameters used in MOCT, EMOA-
In this part, artificial datasets AD_a, AD_b, and AD_c generated by Bhar et al. [23] are used to validate the effectiveness of the proposed tricluster algorithm in dealing with datasets with different number of time points. AD_a includes 100 genes, 10 samples and 20 time points, AD_b includes 100 genes, 10 samples and 25 time points, and AD_c includes 100 genes, 10 samples and 30 time points. Three perfect shifting triclusters of size 30
Affirmation score of triclusters obtained by the proposed MOCT, EMOA-
-TRIMAX,
-TRIMAX, and TRICLUSTER on artificial datasets
Affirmation score of triclusters obtained by the proposed MOCT, EMOA-
From Table 2, it can be seen that the proposed method has achieved promising results comparable to the three comparison algorithms in terms of affirmation score. The three well-established triclustring algorithms for comparisons have been reported to be very effective [23], and thus the effectiveness of the proposed MOCT in dealing with datasets with different number of time points can be validated from sides.
Triclustering of the time-series human gene expression data can help to better understand some key mechanisms of the biological process. In this part, a set of real-life human genome datasets are tested to further validate the effectiveness of the proposed triclustering algorithm, and they are described as follows:
Real-life dataset GSE11324 [42] GSE11324 data- set has 54675 Affymetrix human genome U133 plus 2.0 probe ids, 3 samples and 4 time points (0, 3, 6 and 12 hours).
Real-life dataset GSE35671 [43] GSE35671 data- set contains 48803 Illumina HumanWG-6 v3.0 probe ids, 3 replicates and 12 time points (days 0, 3, 7, 10, 14, 20, 28, 35, 45, 60, 90 and 120).
Real-life dataset GSE46280 [44] GSE46280 includes 54675 Affymetrix human genome U133 plus 2.0 probe ids with respect to IFN-beta-1b treatment of 6 patients across four time points.
The median SDB scores of triclusters obtained by the proposed MOCT, EMOA-
The best performance is highlighted in bold.
MOCT runs ten independent times on each dataset, and the SDB scores of the five comparison algorithms in ten runs are statistically ranked by Wilxocn rank-sum method. Table 3 shows comparison results of the five algorithms, and the proposed MOCT has achieved the best performance on all the real-life human genome datasets in terms of the SDB score. Among them, EMOA-
To show the convergence of MOCT, the following Min-mean metric is used as an indicator:
where
Variation of the normalized Min-mean value with generations for the three real-life datasets.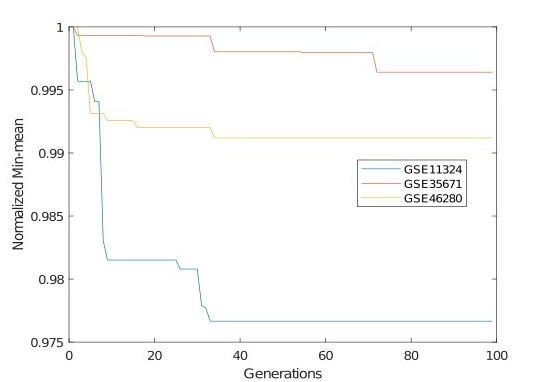
In this section, the applications of the proposed MOTC in biological and compute engineering are studied.
Key disease-related genes detection on HIV-1 progression data
HIV-1 is the main reason for HIV infections that cause one of the most deadly diseases: Acquired Immune Deficiency Syndrome (AIDS) worldwide. To study the mechanism of this disease, it is very important to identify the key disease-related genes in the progression to AIDS and death. In this part, the proposed method is applied on a set of HIV-1 progression data, which can be downloaded from the GEO database with GEO id GSE6740.1 In GSE6740, the gene expression profiles in human CD4+ and CD8+ T cells from untreated HIV-infected individuals at four different clinical stages (i.e. normal, acute, chronic, and non-progressor) are examined. The four clinical stages can be seen as four time points, and thus the HIV-1 progression data is a time-series gene expression dataset.
The samples and time points of the five resultant triclusters are shown in Table 4, and 5053 key function related genes across the according samples over the according stages from the total 22283 genes of the HIV-1 progression data are revealed. In Table 4, it can be observed that samples 1-6, 9-10 over the chronic and non-progressor stage are the most relevant. The correlation of those key genes across samples and over stages can also be observed, which is in accordance with previous studies [45].
The five obtained triclusters by MOCT on HIV-1 progression data
The five obtained triclusters by MOCT on HIV-1 progression data
Anonymous social networks based on interests are becoming more and more popular around the world, where network users highly rely on the recommendation system to build connections with other users. In this part, the proposed multi-objective triclustering algorithm is utilized to tricluster a set of 100 social active network users based on their comments collected from a social network.2 The number of comments of the 100 users has been recorded for one week (seven time points), and those comments are divided into five groups, i.e., politics, economics, culture, education and entertainment according to the content of each comment. The triclustering algorithm is used to decide if any two of the users should be recommended to each other.
The resulted ten tricusters on anonymous social network data
The resulted ten tricusters on anonymous social network data
1 indicates the tag for a tricluster.
Table 5 shows the number of users in the selected ten obtained triclusters by MOCT, and the users in each tricluster with the same tag of interest can be recommended to each other. Due to the introduction of time points, recommendation system has to consider the variations in the third dimension. This is why triclustering method can be more effectively adapted to the design of a new recommendation system. On the other hand, the triclustering results can also be used to improve the experience of customized online advertising system.
In this paper, a new multi-objective constrained triclustering model is proposed for key gene detection of microarray gene expression data with time series. The new model is featured by its new Wilcoxon sign rank test based objective to measure the fluctuation of genes expression value during a set of time points. The maximal allowable MSR value is used as a constraint in this new model such that population search can be more flexible than the traditional methods. A new M2M population decomposition based evolutionary algorithm is designed to address this new model. To effectively encode the chromosome, a novel customized recombination strategy is proposed, and a two-step local search is developed to accelerate the population convergence. Experimental studies on both artificial datasets and real-life human genome datasets have been conducted, and performance comparisons with previous representative triclustering algorithms verify the effectiveness of the proposed triclustering method. The applications in identifying the key disease-related genes on HIV-1 progression data and building recommendation system for anonymous social network users also show its great potential in biological and computer engineering.
In the future, the applications of the proposed MOCT will be extended to the other relevant application areas.
Footnotes
Acknowledgments
This work was supported in part by the National Natural Science Foundation of China under Grant 61673121, in part by the Projects of Science and Technology of Guangzhou under Grant 201804010352, in part by the the Natural Science Foundation of Guangdong Province under Grant 2018A030313505, and in part by the China Scholarship Council.