
Abstract
The geometric and semantic information of 3D point clouds significantly influence the analysis of 3D point cloud structures. However, semantic learning of 3D point clouds based on deep learning is challenging due to the naturally unordered data structure. In this work, we strive to impart machines with the knowledge of 3D object shapes, thereby enabling them to infer the high-level semantic information from the 3D model. Inspired by the vector of locally aggregated descriptors, we propose indirectly describing the high-level semantic information by associating each point’s low-level geometric descriptor with a few visual words. Based on this approach, we design an end-to-end network for 3D shape analysis that combines pointwise low-level geometric and high-level semantic information. The network includes a spatial transform and a uniform operation that make it invariant to input rotation and translation, respectively. Our network also employs pointwise feature extraction and pooling operations to solve the unordered point cloud problem. In a series of experiments with popular 3D shape analysis benchmarks, our network exhibits competitive performance on many important tasks, such as 3D object classification, 3D object part segmentation, semantic segmentation in scenes, and commercial 3D CAD model retrieval.
Keywords
Introduction
Automatic classification and segmentation of 3D models are tasks that have received substantial attention in recent years – not only because of their many applications, such as scene understanding, robot navigation, augmented reality and surface reconstruction, but also because they remain challenging. 3D point clouds [1, 2, 3] are an important type of geometric data structure of the 3D models. Although neural networks and deep learning approaches have been successfully applied to other data analysis domains, such as structural system identification [4, 5, 6, 7, 8, 9], defect and crack detection [10, 11, 12, 13], traffic network management [14, 15], image processing [16, 17, 18], and earthquake magnitude prediction [9], it is nontrivial to apply them to analyze 3D point clouds. To address 3D point clouds using deep learning, most researchers first transform such data into a structural representation and then feed the representation into the neural network. At present, the methods to create structural representations of from 3D models can be roughly divided into three types. (1) Operate directly on a 3D point cloud dominated by handcrafted features [19, 20]. (2) Convert a 3D point cloud into multiview images [21, 22, 23]. (3) Convert a 3D point cloud into a 3D volumetric representation [24, 25, 26, 27].
Illustration of the low-level geometric and high-level semantic features of the aircraft.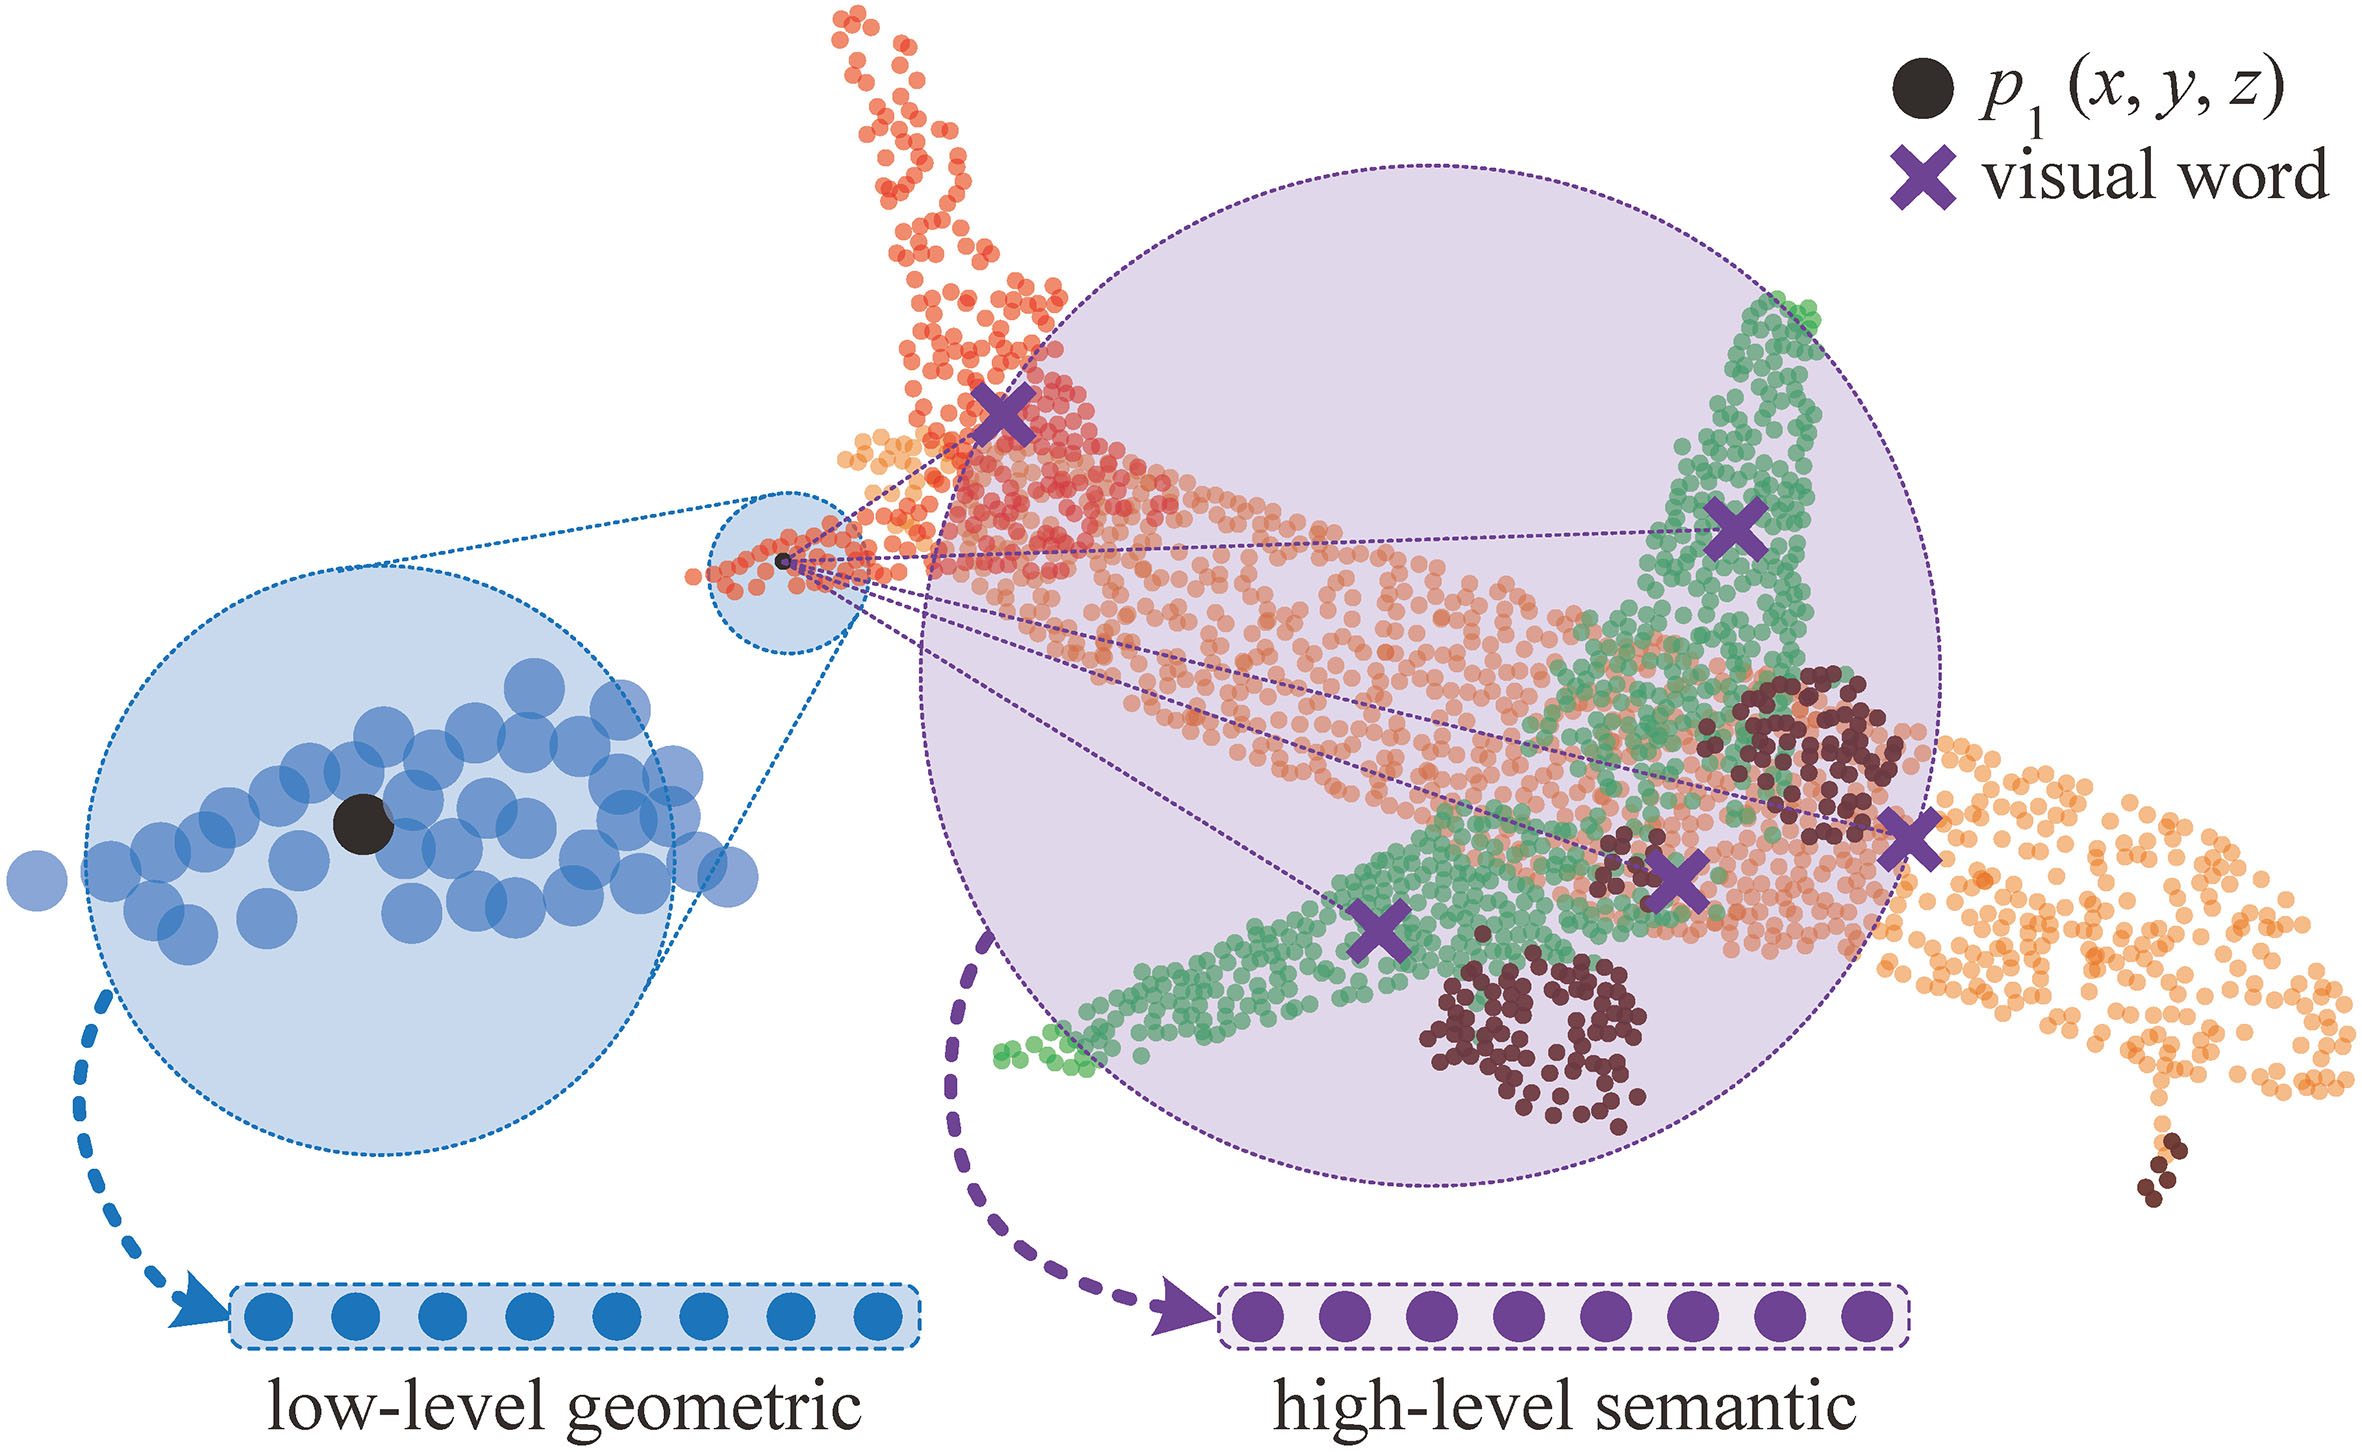
Among the existing works, four problems still exist when applying deep learning to 3D point cloud classification and segmentation: (1) A 3D point cloud is a low-resolution resampling of the geometric shape of the 3D space. No strict grid structure exists, which makes it difficult to directly learn the semantic information from 3D point clouds using deep learning. (2) A 3D point cloud, which is a set of points that are scattered in the 3D space, is much more complicated than images. The pose transformation and geometric distortion of a 3D point cloud makes it more difficult to classify and segment. (3) A 3D point cloud is a set of points without a specific order. Thus, deep learning cannot learn an order-invariance function to canonicalize input point clouds.
The goal of this work is to enhance the performance in 3D shape analysis and make the 3D point cloud easier to classify and segment. To achieve this goal, we propose a novel network for 3D shape analysis that combines pointwise low-level geometric and high-level semantic information, named pointwise geometric and semantic learning network (PointwiseNet), whose intuition is shown in Fig. 1.
The low-level geometric features (point
Based on this idea, we develop two types of pointwise fixed-dimensional vectors, including low-level geometric and high-level semantic features. As shown in Fig. 2, the pointwise feature learning component in our proposed network is composed of three phases: a spatial transformer network (STN), the K-nearest neighbour (KNN) algorithm, and a vector of locally aggregated descriptors (VLAD). The STN module enables our network to be invariant to input rotation, while the KNN and VLAD modules are used to extract the pointwise low-level geometric and high-level semantic features, respectively.
To verify our claims and justify the design choices in PointwiseNet, we performed experiments on a number of benchmark datasets (ModelNet [24], ShapeNet [1], S3DIS [31], and 3D CAD model database [32]). The results demonstrate that the proposed method achieves state-of-the-art performance.
This work provides the following three main contributions:
We present a novel method based on the VLAD mechanism to extract high-level semantic information from point clouds. The high-level semantic information is indirectly described by the relationship between each point’s low-level geometric descriptor and a few visual words; this relationship allows machines to infer the high-level semantic information of the 3D point cloud. We construct an end-to-end network for 3D shape analysis, dubbed PointwiseNet, which combines pointwise low-level geometric and high-level semantic features. The network has the ability to classify and segment 3D models, and it does not require any pretraining. Four different strategies, including pointwise feature extraction, spatial transform, uniform operation, and pooling operation, enable PointwiseNet to address be rotation invariant, translation invariant, and robust to the disorder of point cloud data.
The remainder of this paper is organized as follows. Section 2 briefly reviews some related works concerning the use of deep learning with 3D data. Section 3 outlines the overall framework of our network for 3D point cloud classification/segmentation. Sections 4 and 5 present some implementation details, such as descriptions of the STN, KNN, and VLAD modules. The experimental results on several datasets are reported in Section 6, followed by our conclusions in Section 7.
Our learning framework is a unified framework based on deep learning that can be used to perform various 3D shape analyses. Recently, a large number of works have been published concerning 3D deep learning. With the efforts of the whole community over the past few years, significant progress has been made on some longstanding problems. These approaches can be grouped into four types according to the 3D shape representation used in each solution: (1) Handcrafted features; (2) Multi-view CNNs; (3) Volumetric CNNs; (4) Point CNNs. We review each of these approaches in turn.
Handcrafted features
These types of methods extract the low-level features of 3D models via some feature descriptors and then feeds them into the neural network. Many excellent feature descriptors exist, including heat kernel signatures (HKS) [33], 3D voxel grids [34], spherical harmonic descriptor [28], light field descriptor [35] and so on; however, the accuracy of this these type of methods relies heavily on the choice of handcrafted features.
Qin et al. [19] presented a deep learning approach to automatically classify 3D CAD models according to a mechanical part catalogue, and it is was the first work to successfully apply the deep learning technique to commercial 3D CAD model classification. They employed Zernike moments and Fourier descriptors to characterize 3D models as a set of multidimensional vectors and then extracted high-level features through deep neural networks. Bu et al. [20] combined HKS and the average geodesic distance into low-level features, which were then converted into middle-level features through the bag-of-features models. They utilized deep belief networks to learn high-level features from middle-level features and applied those to 3D model retrieval and recognition.
These methods use multiple descriptors to superimpose and extract low-level features with one descriptor and extract higher-level features with another descriptor; thus, they lose some information compared to the model itself.
Multi-view CNNs
Convolutional neural networks (CNNs) [36, 37, 16] and their recent improvements [38] have been successfully applied to a wide range of applications in computer vision. These methods work well because the pixels of 2D images are located at fixed positions in a strict grid framework. Because 3D point clouds have no regular format as do 2D images, most researchers typically transform such data 3D point cloud data to collections of images before feeding them to a deep network.
Recently, Su et al. [21] designed a multi-view 2D CNN (MVCNN) for 3D shape recognition that achieved promising results. First, the method projects the 3D model into an image; then, it extracts the features of the projected image using a 2D model pretrained on ImageNet. Then, view-point pooling is used to combine all the streams obtained from each view, and finally, the fused features are classified by another CNN network. Qi et al. [22] conducted comprehensive experiments to compare the recognition performance of 2D multi-view CNNs against those of 3D volumetric CNNs. Pang et al. [23] studied the challenging problem of detecting 3D objects in point clouds with discrete sampling, noisy scans, occlusions and cluttered scenes, and they designed a multiview CNN for object detection in point clouds.
The 2D descriptor is learned with a trainable neural network in multi-view CNNs rather than handcrafted features. Consequently, they do not need to store and read the handcrafted features from disk, leading to significant computational gains. Despite their state-of-the-art performances, these multi-view CNNs still cannot fully exploit the 3D geometric information in the 3D point cloud.
Volumetric CNNs
To retain the geometric information of the 3D point cloud, some volumetric CNNs have been proposed in recent years. Volumetric CNNs first convert raw point clouds into a 3D volumetric grid, which is represented as a binary probability distribution (if the voxel is in the 3D surface, its value is 1; otherwise, it is 0) and then feed it into 3D deep CNNs for classification or segmentation.
Wu et al. [24] introduced the ModelNet database and proposed learning deep volumetric representations of shapes using a deep belief network architecture for shape recognition and completion. Maturana et al. [25] proposed VoxNet, which was a pioneering effort that used 3D convolutional networks for object recognition. VoxNet can efficiently manage large amounts of point cloud data by integrating a volumetric occupancy grid representation with a supervised 3D CNN. Riegler et al. [26] proposed OctNet, a representation for deep learning from sparse 3D data. OctNet is a memory-efficient data structure, a hybrid grid-octree, which enables 3D convolutional networks that are both deep and have high resolution. Wang et al. [27] presented an octree-based CNN, named O-CNN, for 3D shape analysis. O-CNN represents the 3D shapes with octrees and performs 3D CNN operations only on the sparse octants occupied by the boundary surfaces of the 3D shapes.
Compared with multi-view CNNs, volumetric CNNs are able to better maintain the geometric information of the 3D model. Unfortunately, the performance of volumetric CNNs is largely limited by the resolution loss, and they have exponentially increasing computational costs. Additionally, while extending 2D CNNs to 3D appears to be natural, the data sparsity introduces significant challenges. Overall, the high computational complexity of volumetric CNNs and the data sparsity of point clouds prevents them from scaling up and sustaining sufficient spatial resolution to preserve the details.
Point CNNs
A 3D point cloud contains 3D coordinates of some sample points on the surface of a 3D model. Analysing point cloud data directly through CNNs will encounter three main problems: (1) Point clouds are unordered data; (2) Point clouds are typically sparse data; (3) Point clouds contain very limited information.
To solve the above problems, Qi et al. [39] proposed PointNet, which was one of the first network architectures for directly handling 3D point clouds. The main limitation of PointNet is that it cannot capture the low-level geometric information of the point cloud in a hierarchical manner. To address this problem, PointNet
Compared to volumetric CNNs, point CNNs have lower computational costs and provide better performances; however, some point CNNs focus on 3D object classification, while others focus on 3D scene segmentation. To the best of our knowledge, it is difficult to construct one general network to cover the above limitations. The purpose of this study is to combine both pointwise low-level geometric and high-level semantic information using deep learning techniques to learn more representative characteristics from 3D point clouds, as well as to explore a simpler network for 3D shape analysis.
The network architecture
The flowchart of the proposed network. N is the number of the input point clouds; C is the number of neurons in the last fully connected layer of the classification network; M is the number of categories in part segmentation or semantic segmentation in scene tasks; FC stands for a fully connected layer, and the numbers reflect the layer sizes.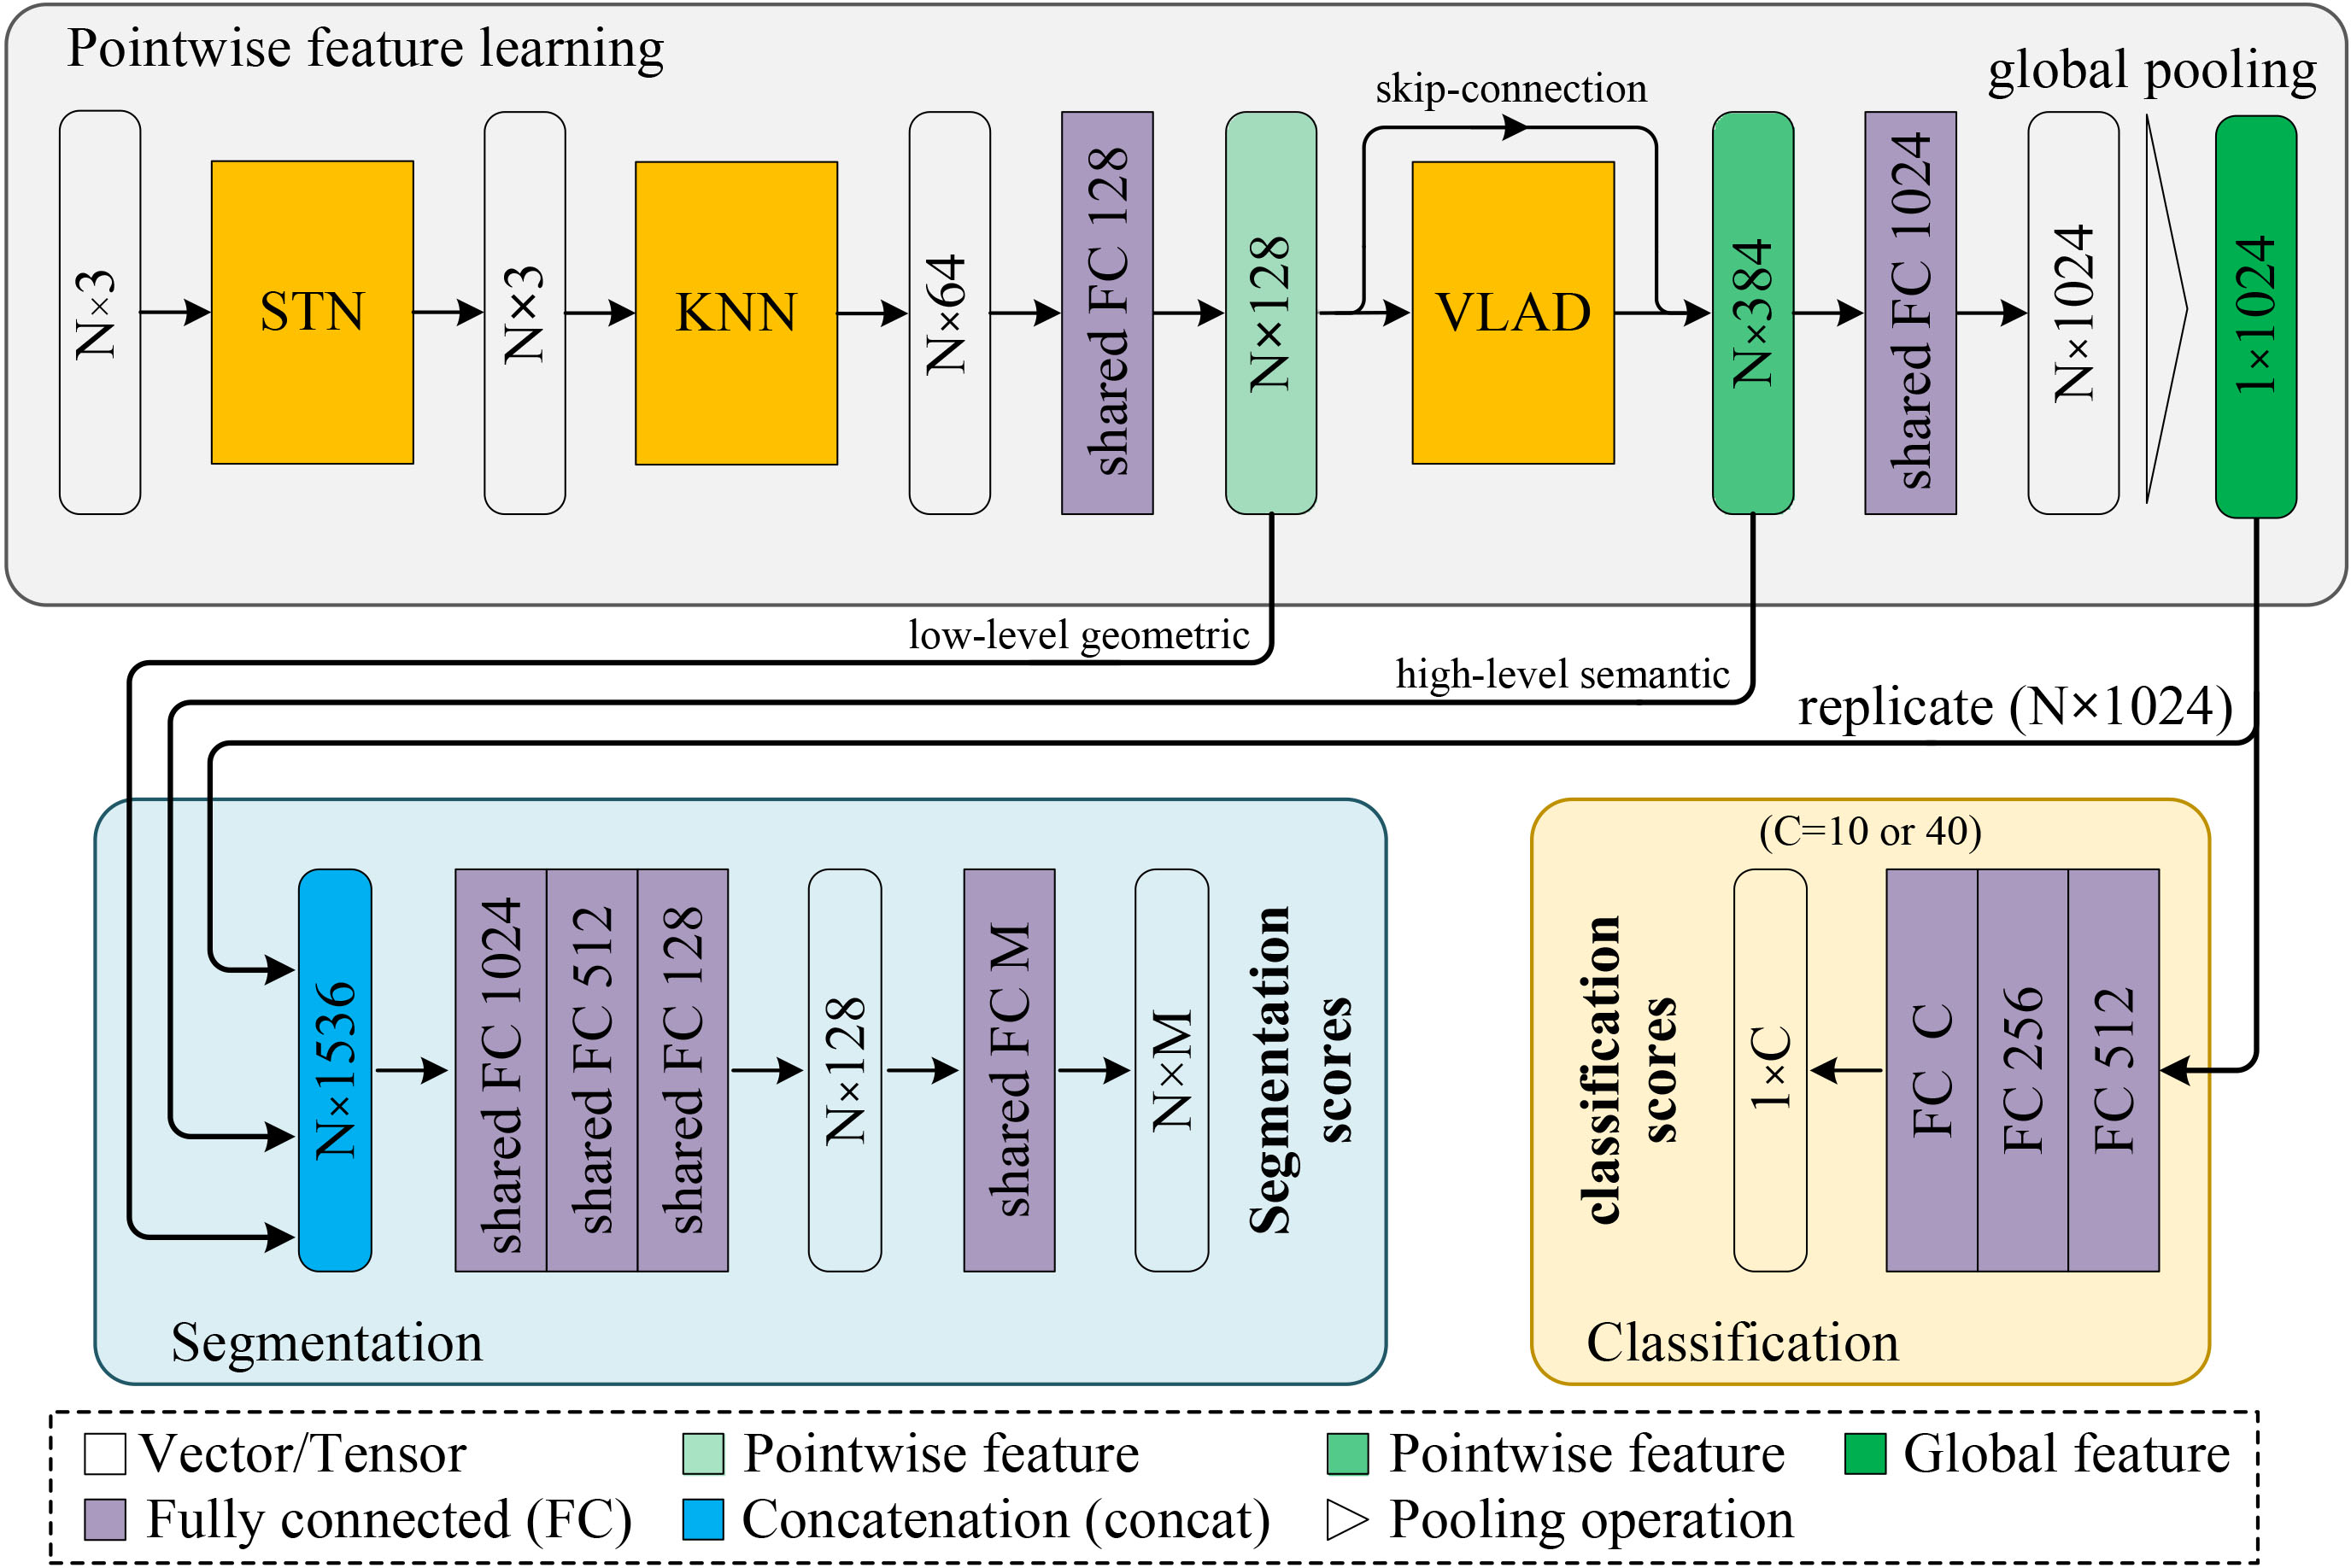
Figure 2 shows the network architecture of our PointwiseNet, which consists of three main components: pointwise feature learning, classification and segmentation.
The pointwise feature learning consists of three phases: STN, KNN, and VLAD. (1) The STN module is used to apply transformations such as rotation and translation (Section 4). (2) The KNN module is used to extract the pointwise low-level geometric information for each point of the 3D point cloud (Section 5.1). (3) The VLAD module is used to extract the pointwise high-level semantic information for each point of the 3D point cloud, which is indirectly described by the relationship of each point’s low-level geometric descriptor with a few visual words (Section 5.2).
Classification network
For the 3D object classification task, the complete classification network consists of pointwise feature learning and classification. The feature learning takes
Segmentation network
For the 3D semantic segmentation task, the complete segmentation network consists of pointwise feature learning and segmentation. The feature learning process takes a single object for part region segmentation as input, while the segmentation component concatenates the three output vectors (low-level geometry vector, high-level semantic vector, and global feature vector) into a 1,536-dimensional feature vector. This vector is then input into the four fully connected layers to obtain the final classification result, which consists of
Spatial transform
In this section, we show how the STN module makes our model invariant to input rotation. The original 3D point cloud is represented as a set of 3D points
where
Jaderberg et al. [43] introduced the idea of a spatial transformer to align 2D images using deep networks; however, that effort was limited by its inability to be spatially invariant to the 3D point cloud. We need the representation learned from the input 3D point cloud to be spatially invariant, which can be achieved by extending the above research [43] to the 3D case. To achieve end-to-end training, we design a learnable module, namely, the STN module shown in Fig. 3, to obtain the transformation matrix.
Illustration of the structure of the STN module.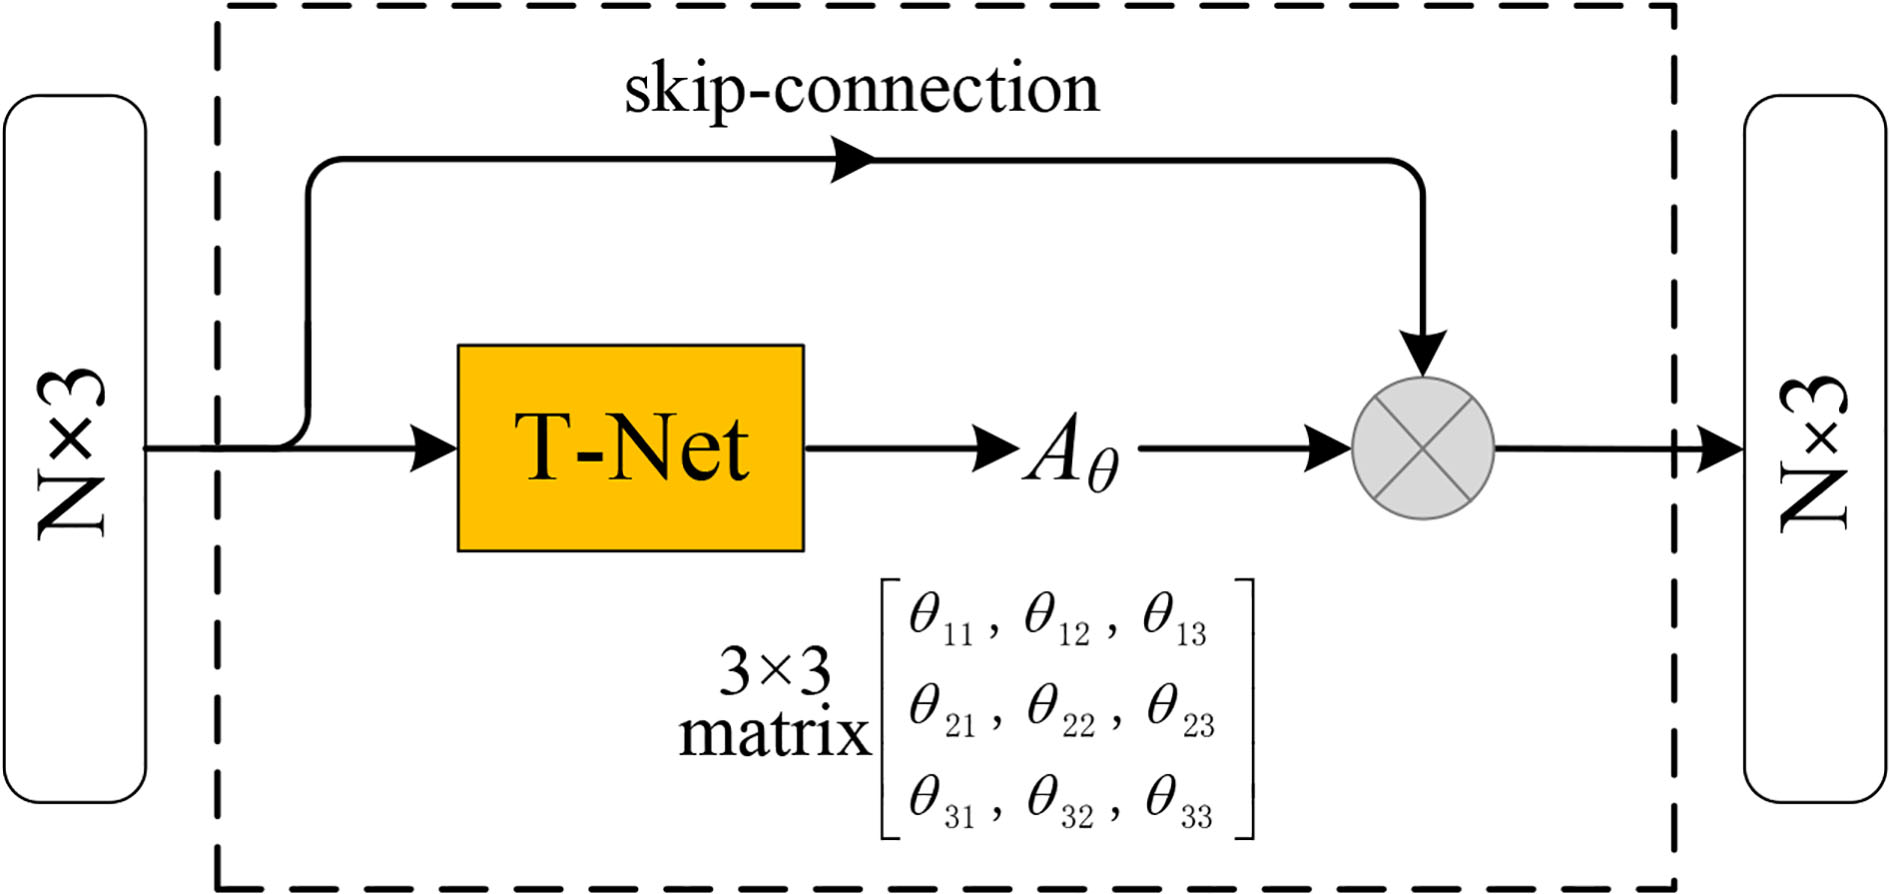
The STN module is split into two parts: T-net and matrix multiply. T-net is a regressor network (including a number of hidden layers), which takes the original 3D point set as input and outputs the 9 parameters of the transformation matrix
As shown in Fig. 2, the KNN and VLAD modules both have unique advantages: neither can replace the other because they extract features from different levels. Thus, the two sets of features (the low-level geometric features and high-level semantic features) represent a 3D point set from different viewpoints.
Low-level geometric feature
After performing a spatial transformation on the 3D point set, our model needs to be able to capture the low-level geometric feature from nearby points. We propose extracting the low-level geometric feature based on the pointwise KNN search method (as shown in Fig. 4), which mainly includes the following three steps: (1) KNN search; (2) unified coordinates; (3) feature transformation and fusion.
The structure of the KNN module.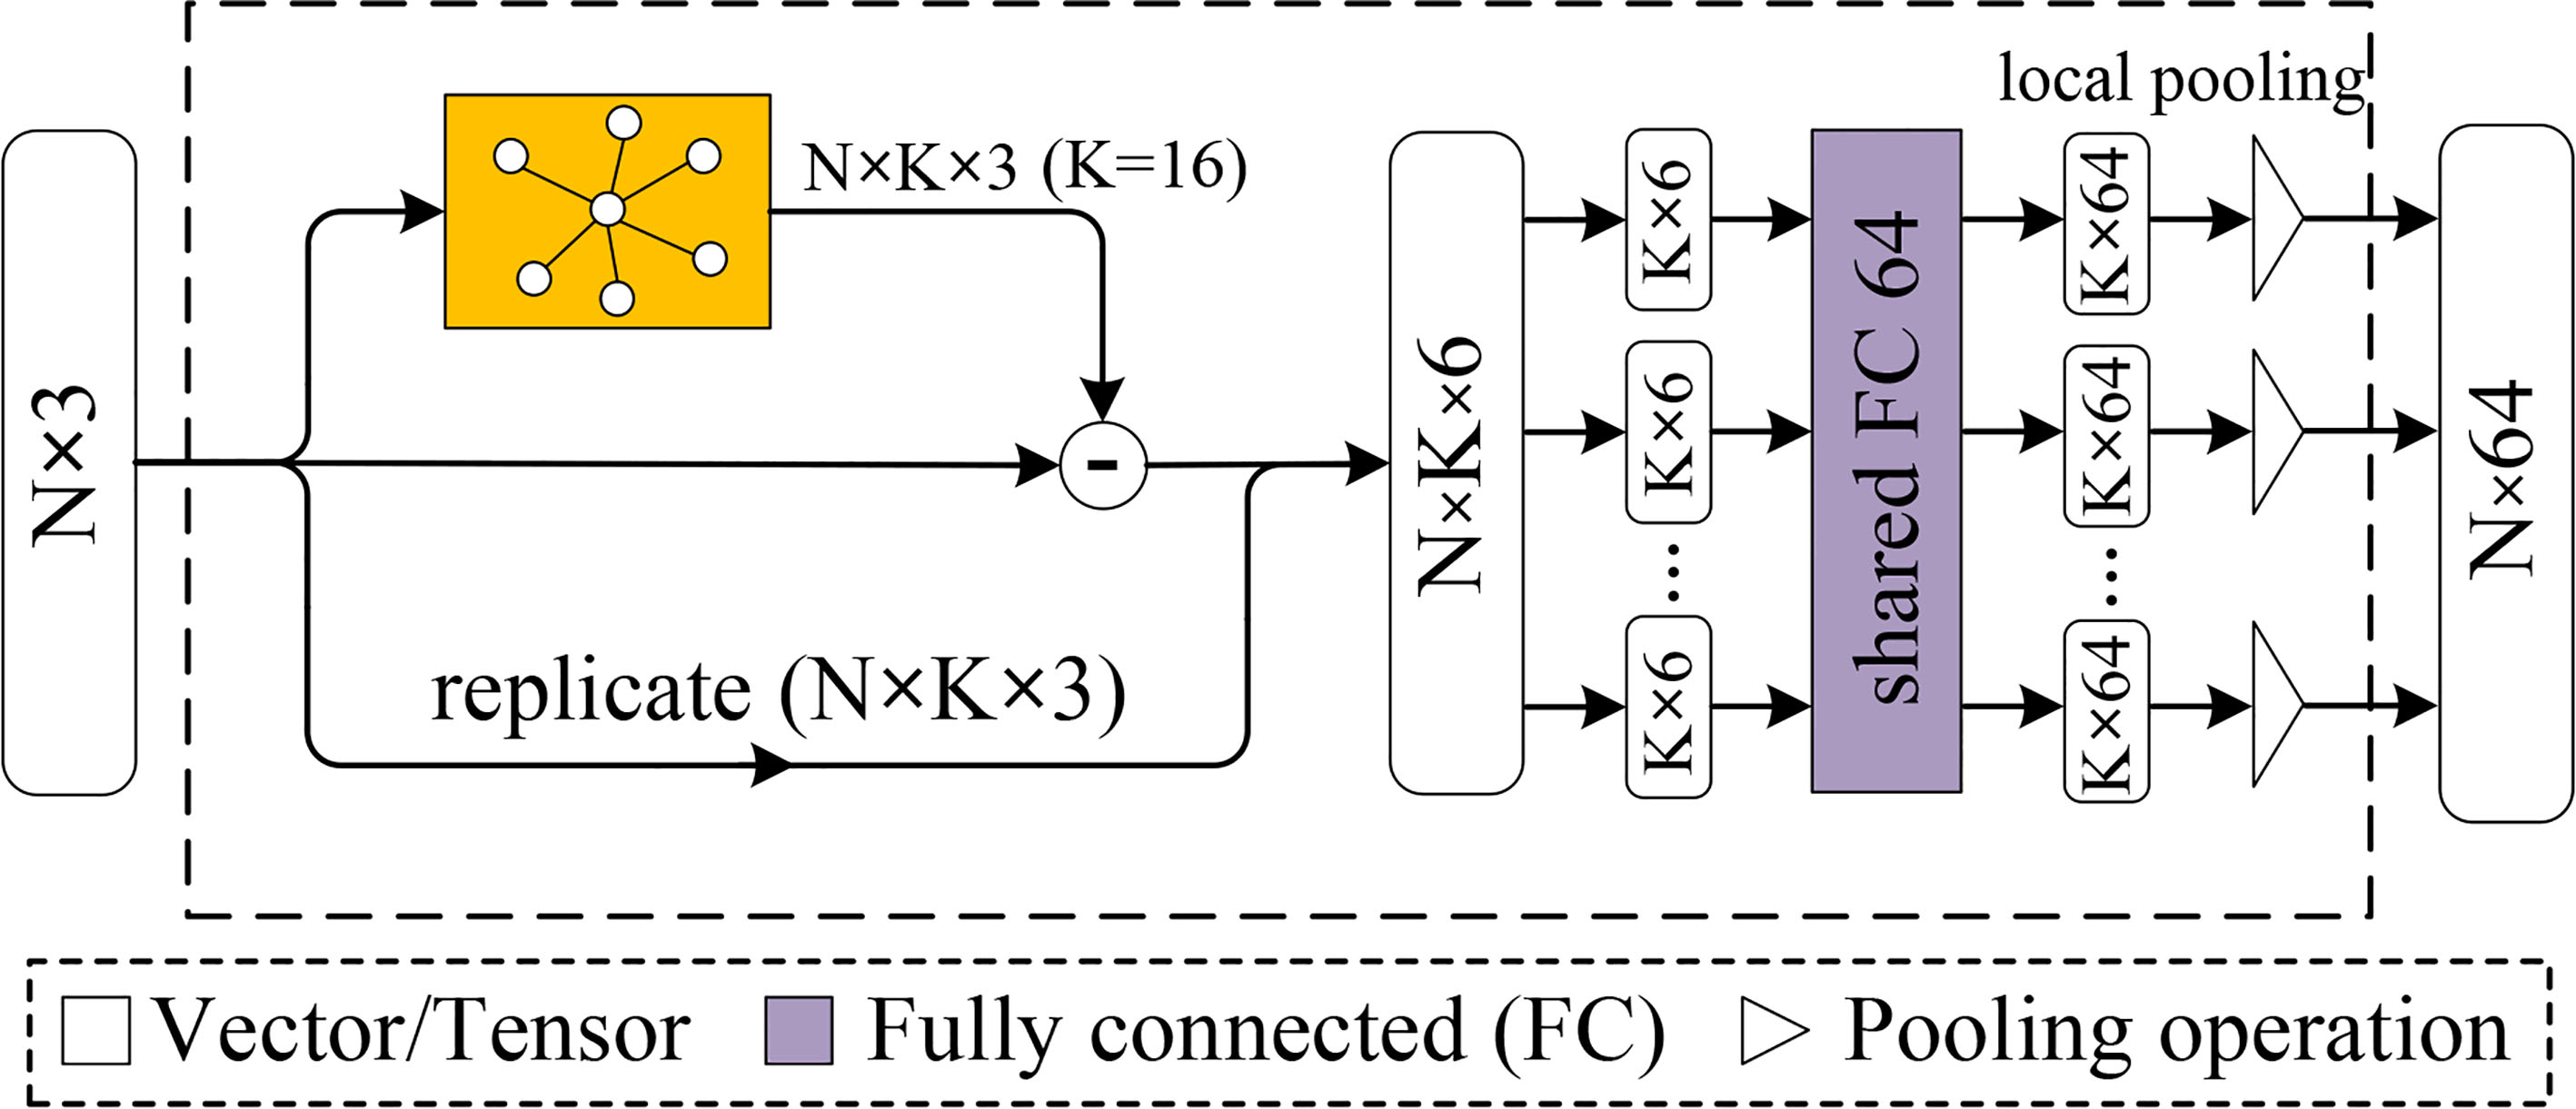
After transformation by the STN module, the original 3D point set
where
The procedure to obtain a signal vector includes the coordinate of the point
where
The output from the above section forms an
where
A pointwise local pooling layer is applied to generate the low-level geometric feature. Given the input matrix
where
After the pointwise local pooling layer, each point is represented as a 64-dimensional vector. Thus, the 3D point set is represented as an (
The structure of VLAD, which provides guidance during the decoding process by using character spatial information as supervision.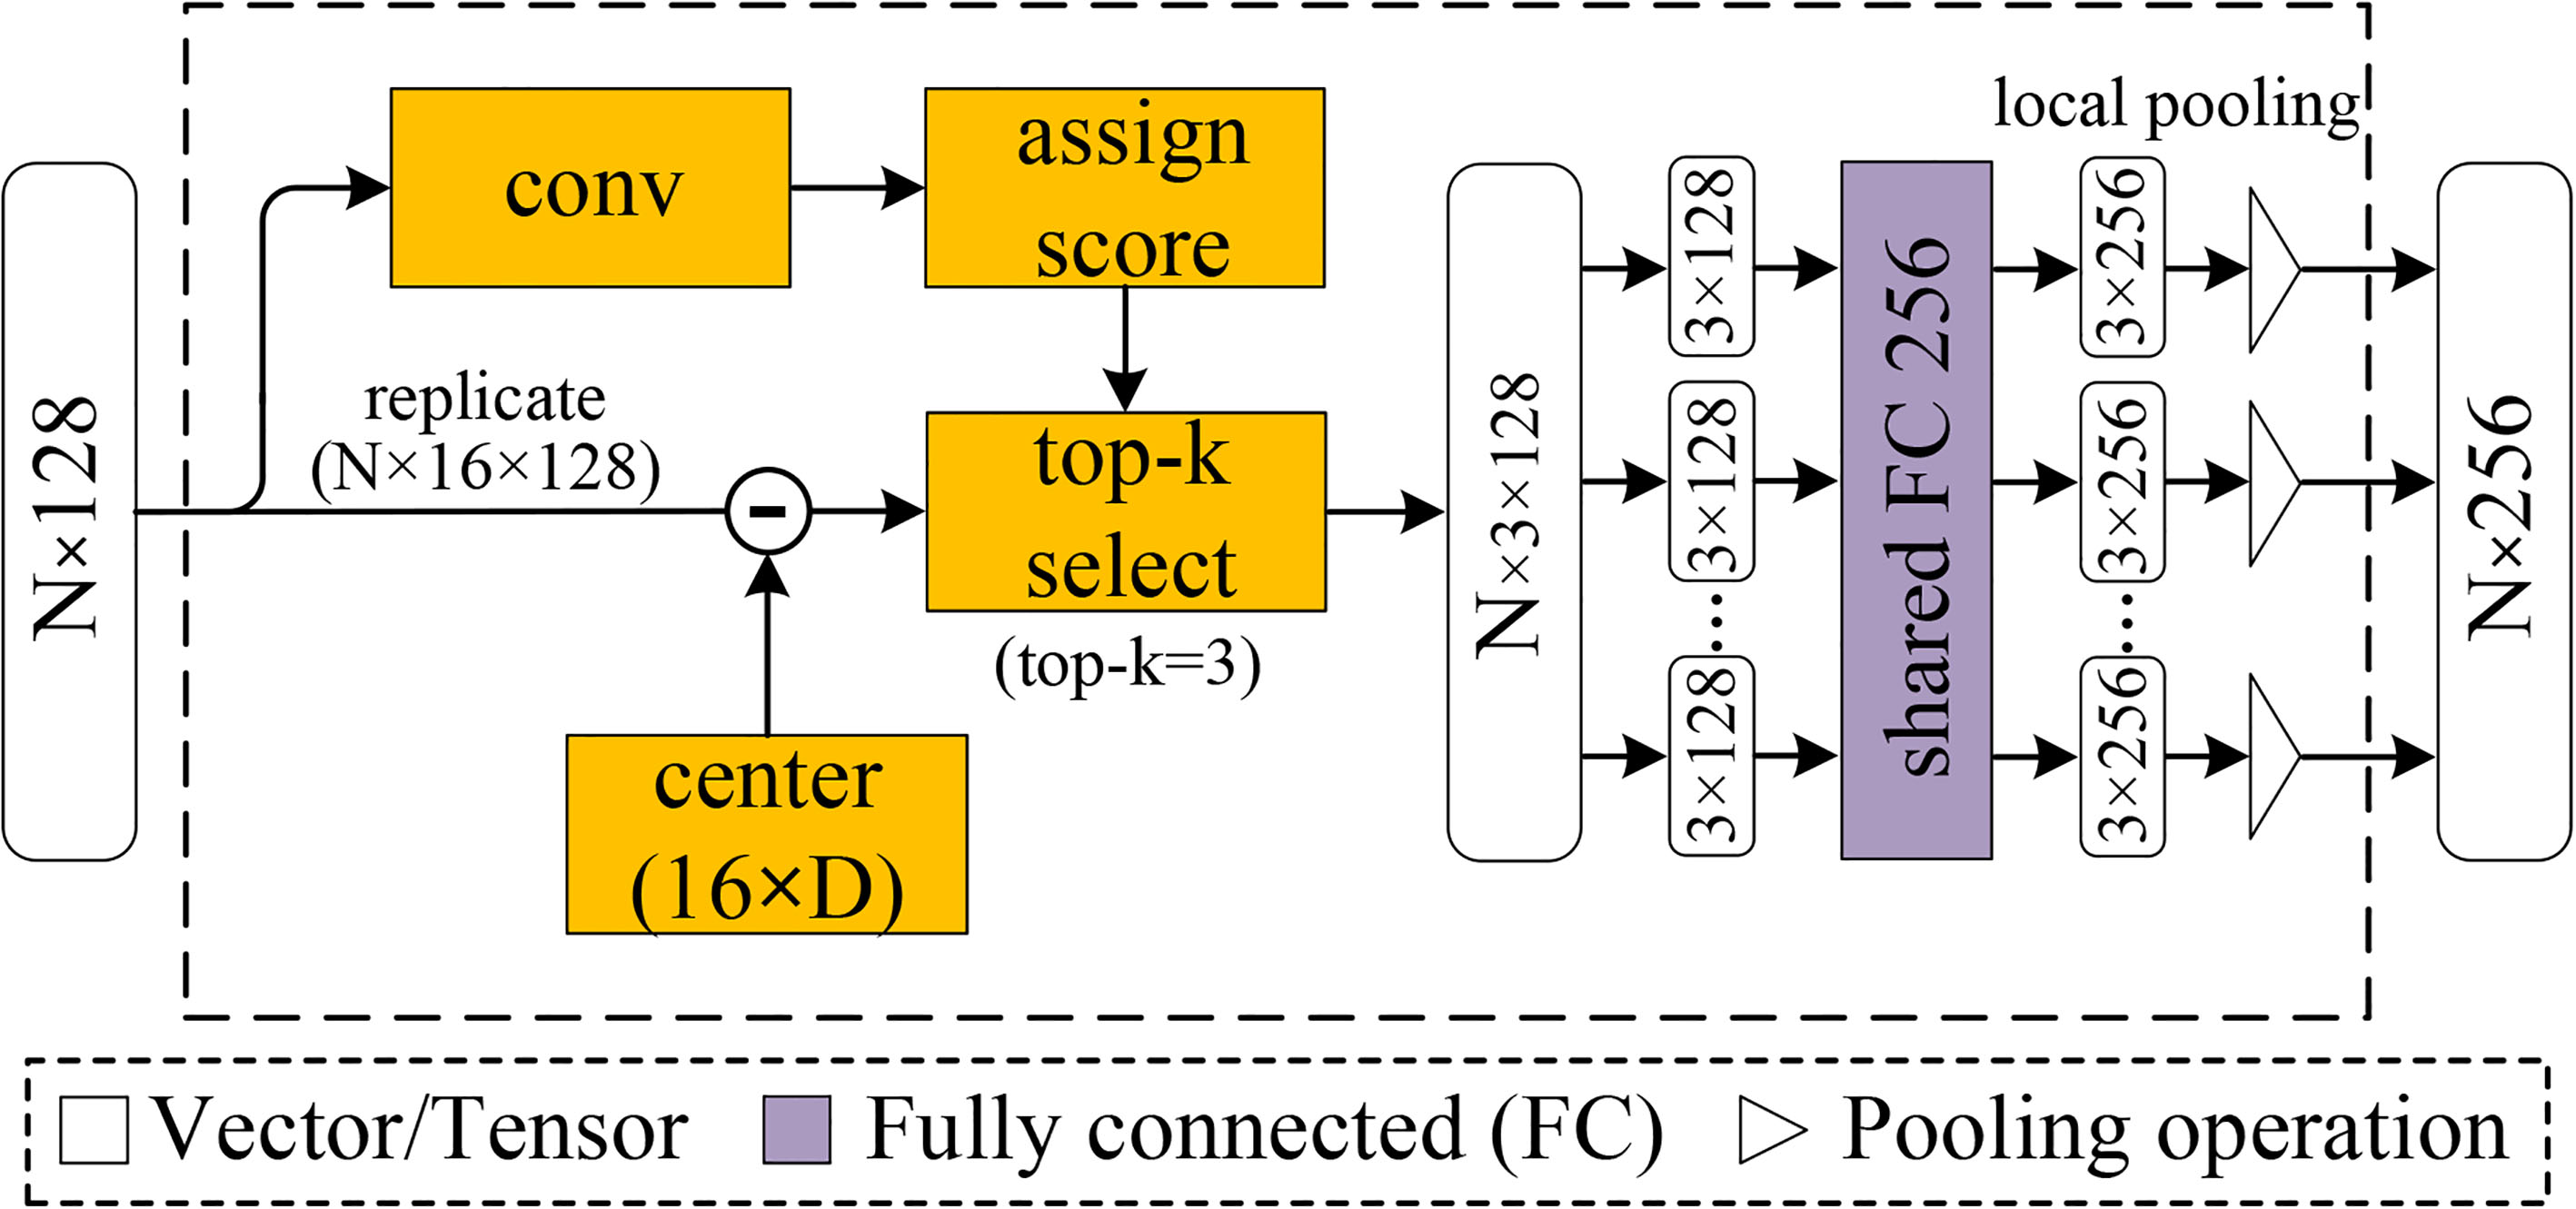
In this section, we show how to leverage the VLAD mechanism [44] to extract the high-level semantic features from the 3D point set. VLAD is a popular descriptor pooling method for both instance-level retrieval and image classification. Arandjelovic et al. [45] proposed an end-to-end deep network named NetVLAD that stores the sum of residuals for each visual word (cluster centre) of a 2D image and performs image-based retrieval for place recognition. PointNetVLAD [30] leverages on the success of PointNet [39] and NetVLAD [45] to perform 3D point-cloud-based retrieval for large-scale place recognition.
The pointwise high-level semantic feature (e.g., skeleton or part of the 3D model) is an implicit expression that is difficult to describe directly. Inspired by [45, 30], we can indirectly describe the high-level semantic feature by the relationship between each point’s low-level geometric descriptor and a few visual words. As shown in Fig. 5, the VLAD module mainly consists of the following two steps: (1) top-
Top-
VLAD feature selection
We take
where
To make the VLAD module differentiable and the coefficients easily comparable across different visual words, we apply a soft-assignment of the low-level geometric feature descriptor to the visual words. Therefore, the computation of the coefficients can be formulated as follows:
where
Note that Eq. (7) is a weighted sum of residuals (the difference between the low-level geometric feature descriptor and the visual word) for each visual word. However, each point in the 3D model may have a significant relationship with several visual words. Therefore, it is necessary to consider only the influence of visual words with higher attention scores on the high-level semantic feature. To accomplish this, we provide the following top-
.
Top-K selection. Given a low-level geometric feature descriptor
Based on Definition 1, we designed a top-
where
As shown in Fig. 5, during network initialization, the visual words are obtained by uniform initialization from [
The output from the above section forms an
The output tensor of the fully connected layer is then fed into a pointwise global pooling layer, which generates the high-level semantic feature for each point. According to our experiments, max-pooling performs better than does average-pooling. After the pointwise local pooling layer, each point is represented as a 256-dimensional vector. Here, the VLAD module can be regarded as the component that learns to extract a (
Experiments and results
In this section, we perform a set of architecture analyses to determine the important parameters of our network (Section 6.1). Then, we evaluate the performance of our PointwiseNet in four different applications, namely, 3D object classification (Section 6.2), 3D object part segmentation (Section 6.3), semantic segmentation (Section 6.4) and CAD model retrieval (Section 6.5).
To demonstrate the efficiency and efficacy of our model, we conducted all the experiments on a desktop machine equipped with an Intel Core I7-6300 CPU (3.4 GHz) and a GeForce 1080 GPU (16 GB memory). The training and testing program was implemented in TensorFlow, and the corresponding code is available from our community site.1
Architecture analysis
In this section, we focus on an ablation analysis to select the various architectures and conduct validation studies to determine the important setups. First, we introduce the datasets used in our experiments and some implementation details of our method (Section 6.1.1). Then, a hyper-parameter analysis is conducted to select the best network parameters (Section 6.1.2). After that, an ablation analysis is performed to evaluate the efficacy of each component (Section 6.1.3). Finally, we analyse different pooling operations (Section 6.1.4).
Dataset and implementation details
ModelNet [24] is a CAD model dataset that has served as a standard benchmark for 3D shape classification in recent years. ModelNet currently contains 127,915 3D CAD models from 662 categories. The 10-class and the 40-class variants of the ModelNet (ModelNet10 and ModelNet40) benchmarks, containing 4,899 and 12,311 models, respectively, are used for 3D shape classifications. ModelNet10 is split into 3,991 models for training and 909 models for testing. ModelNet40 is split into 9,843 models for training and 2,468 models for testing. To obtain 3D point clouds, we uniformly sampled 1,024 points from meshes by Poisson disk sampling using MeshLab [46] and normalized them into a unit sphere.
The network configuration of the classification model is set as follows. The loss function is
Hyper-parameter
In this section, we consider several hyper- parameters: (1) the
Therefore, we mainly analyse the influence of
Quantitative comparisons of different settings in the KNN module and top-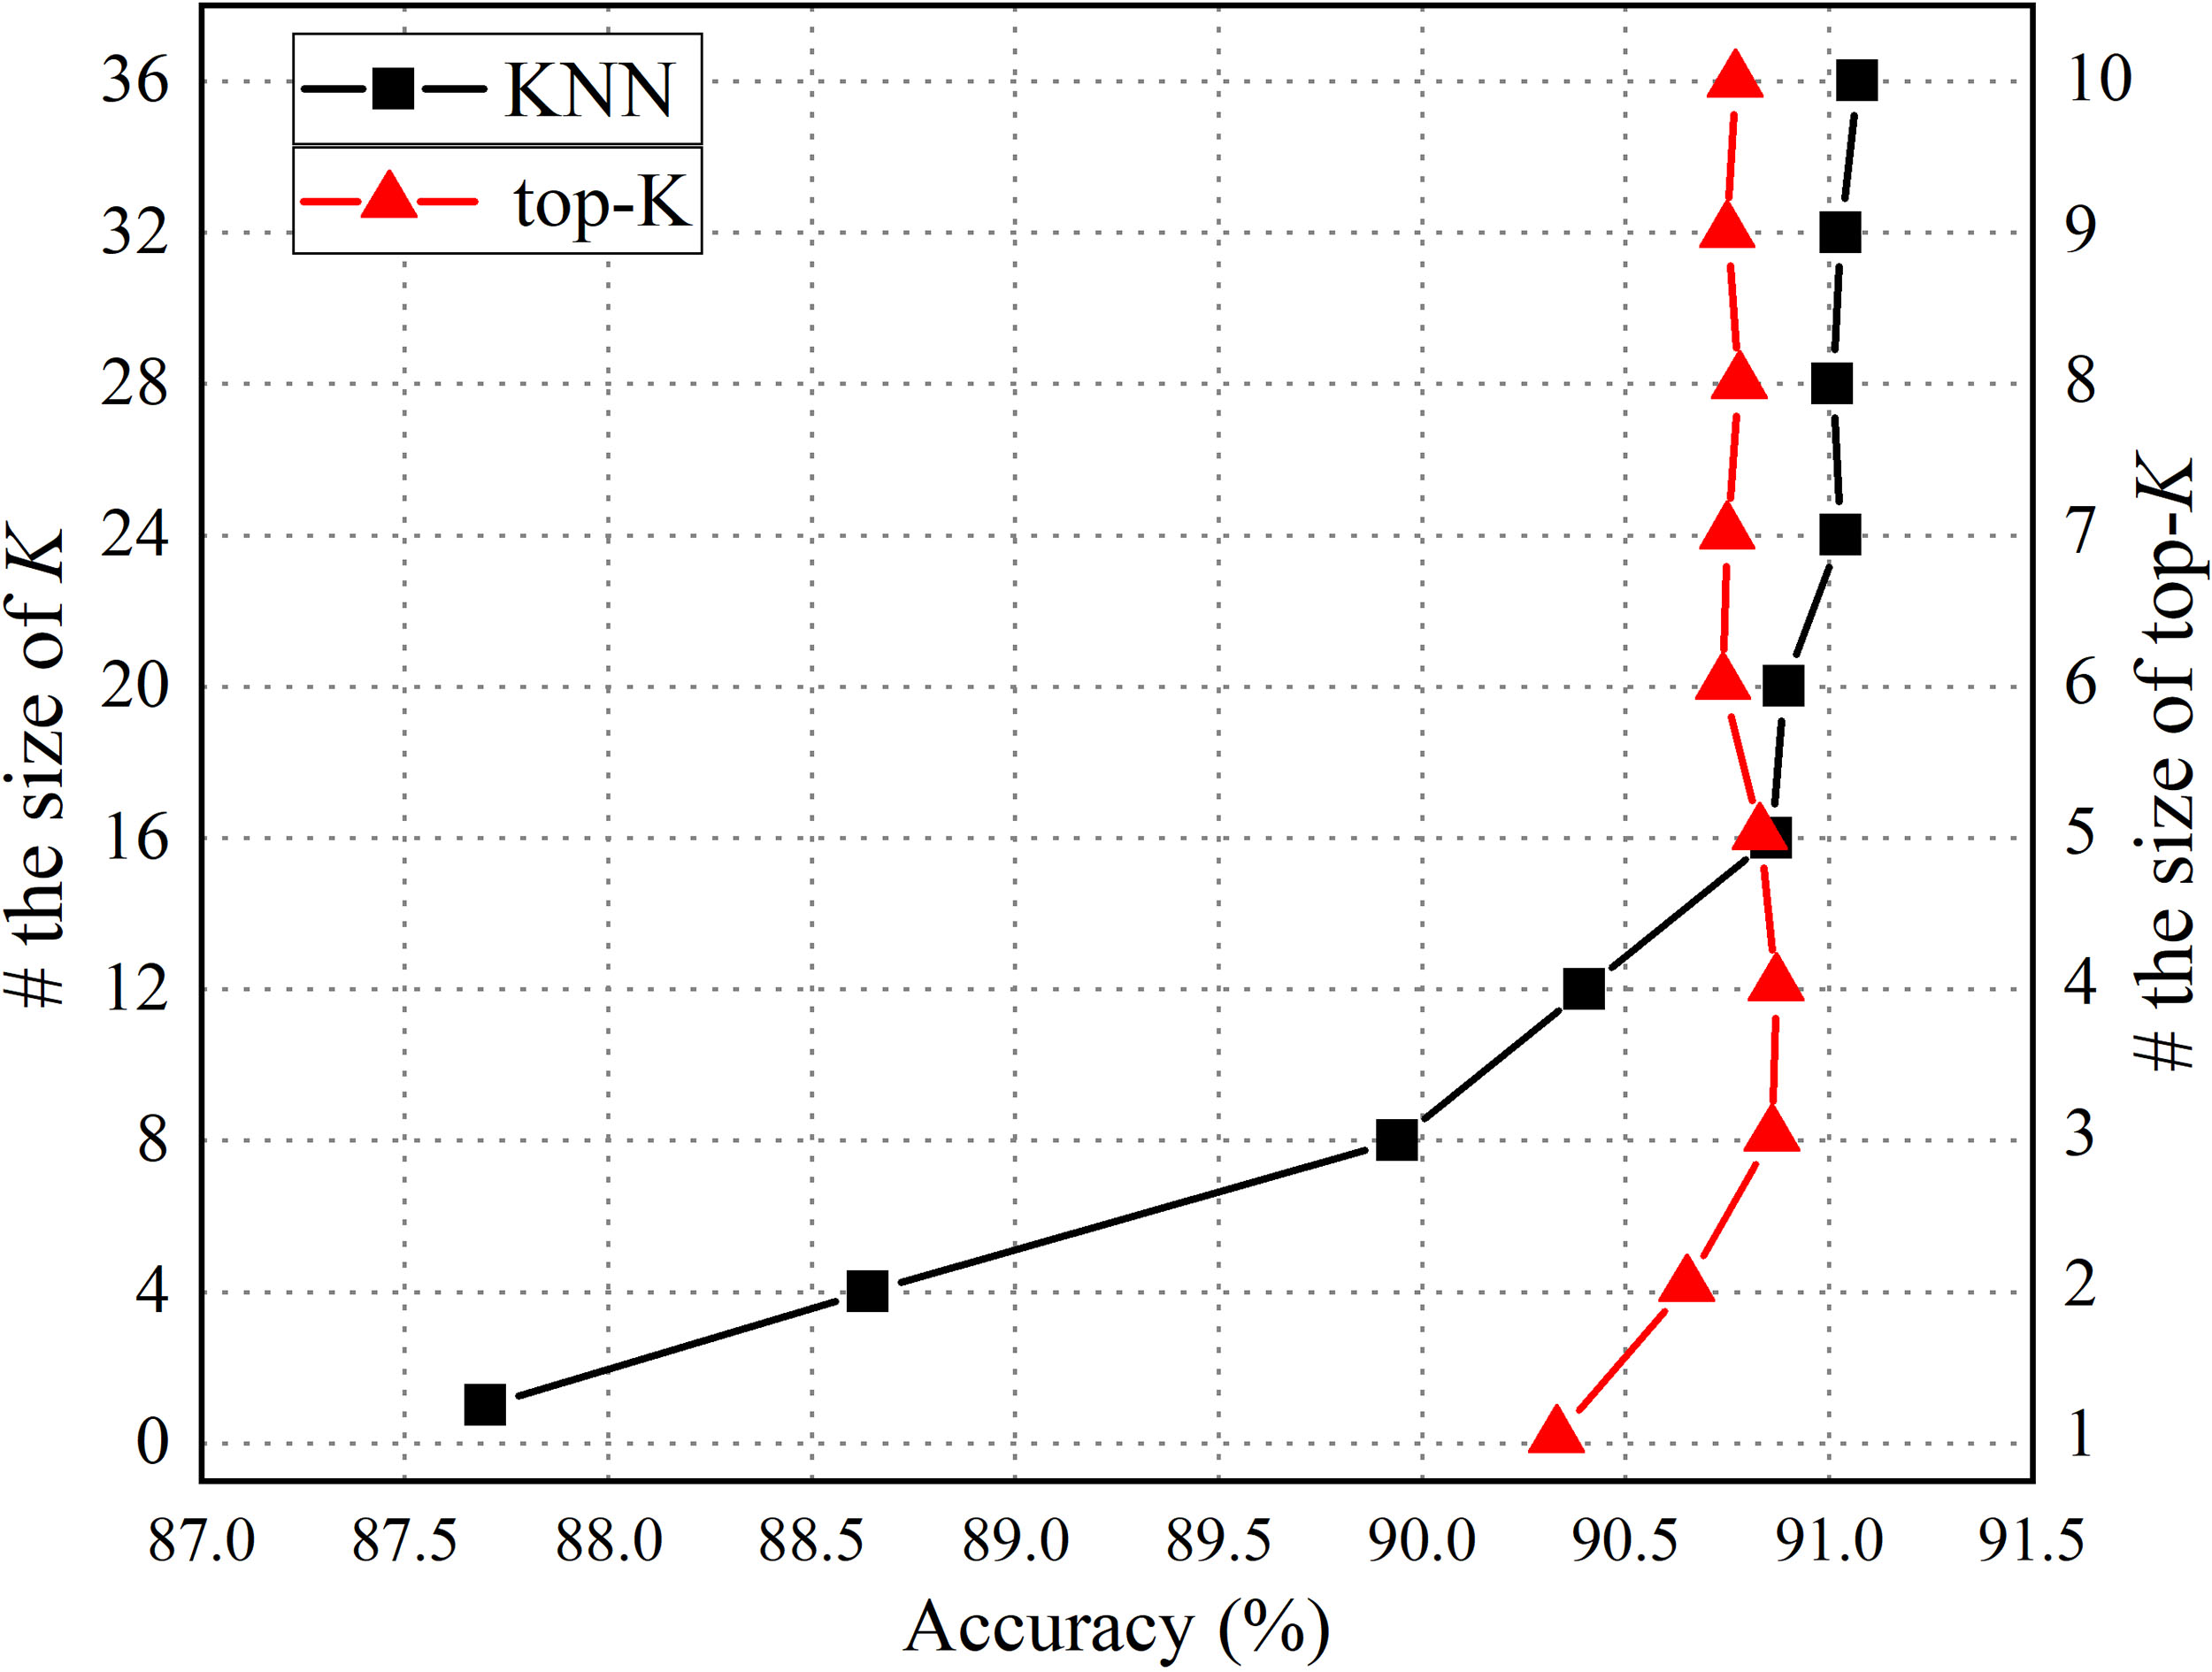
Figure 2 shows the network architecture of PointwiseNet, which is composed of three main modules: the STN module, the KNN module, and the VLAD module. To investigate the efficacy of each module, we conducted an ablation analysis on ModelNet40. A basic version that represents 3D object classification without the KNN and VLAD modules is shown in Fig. 7.
Ablation analysis. The accuracy improves when the STN module is integrated with the KNN and VLAD modules.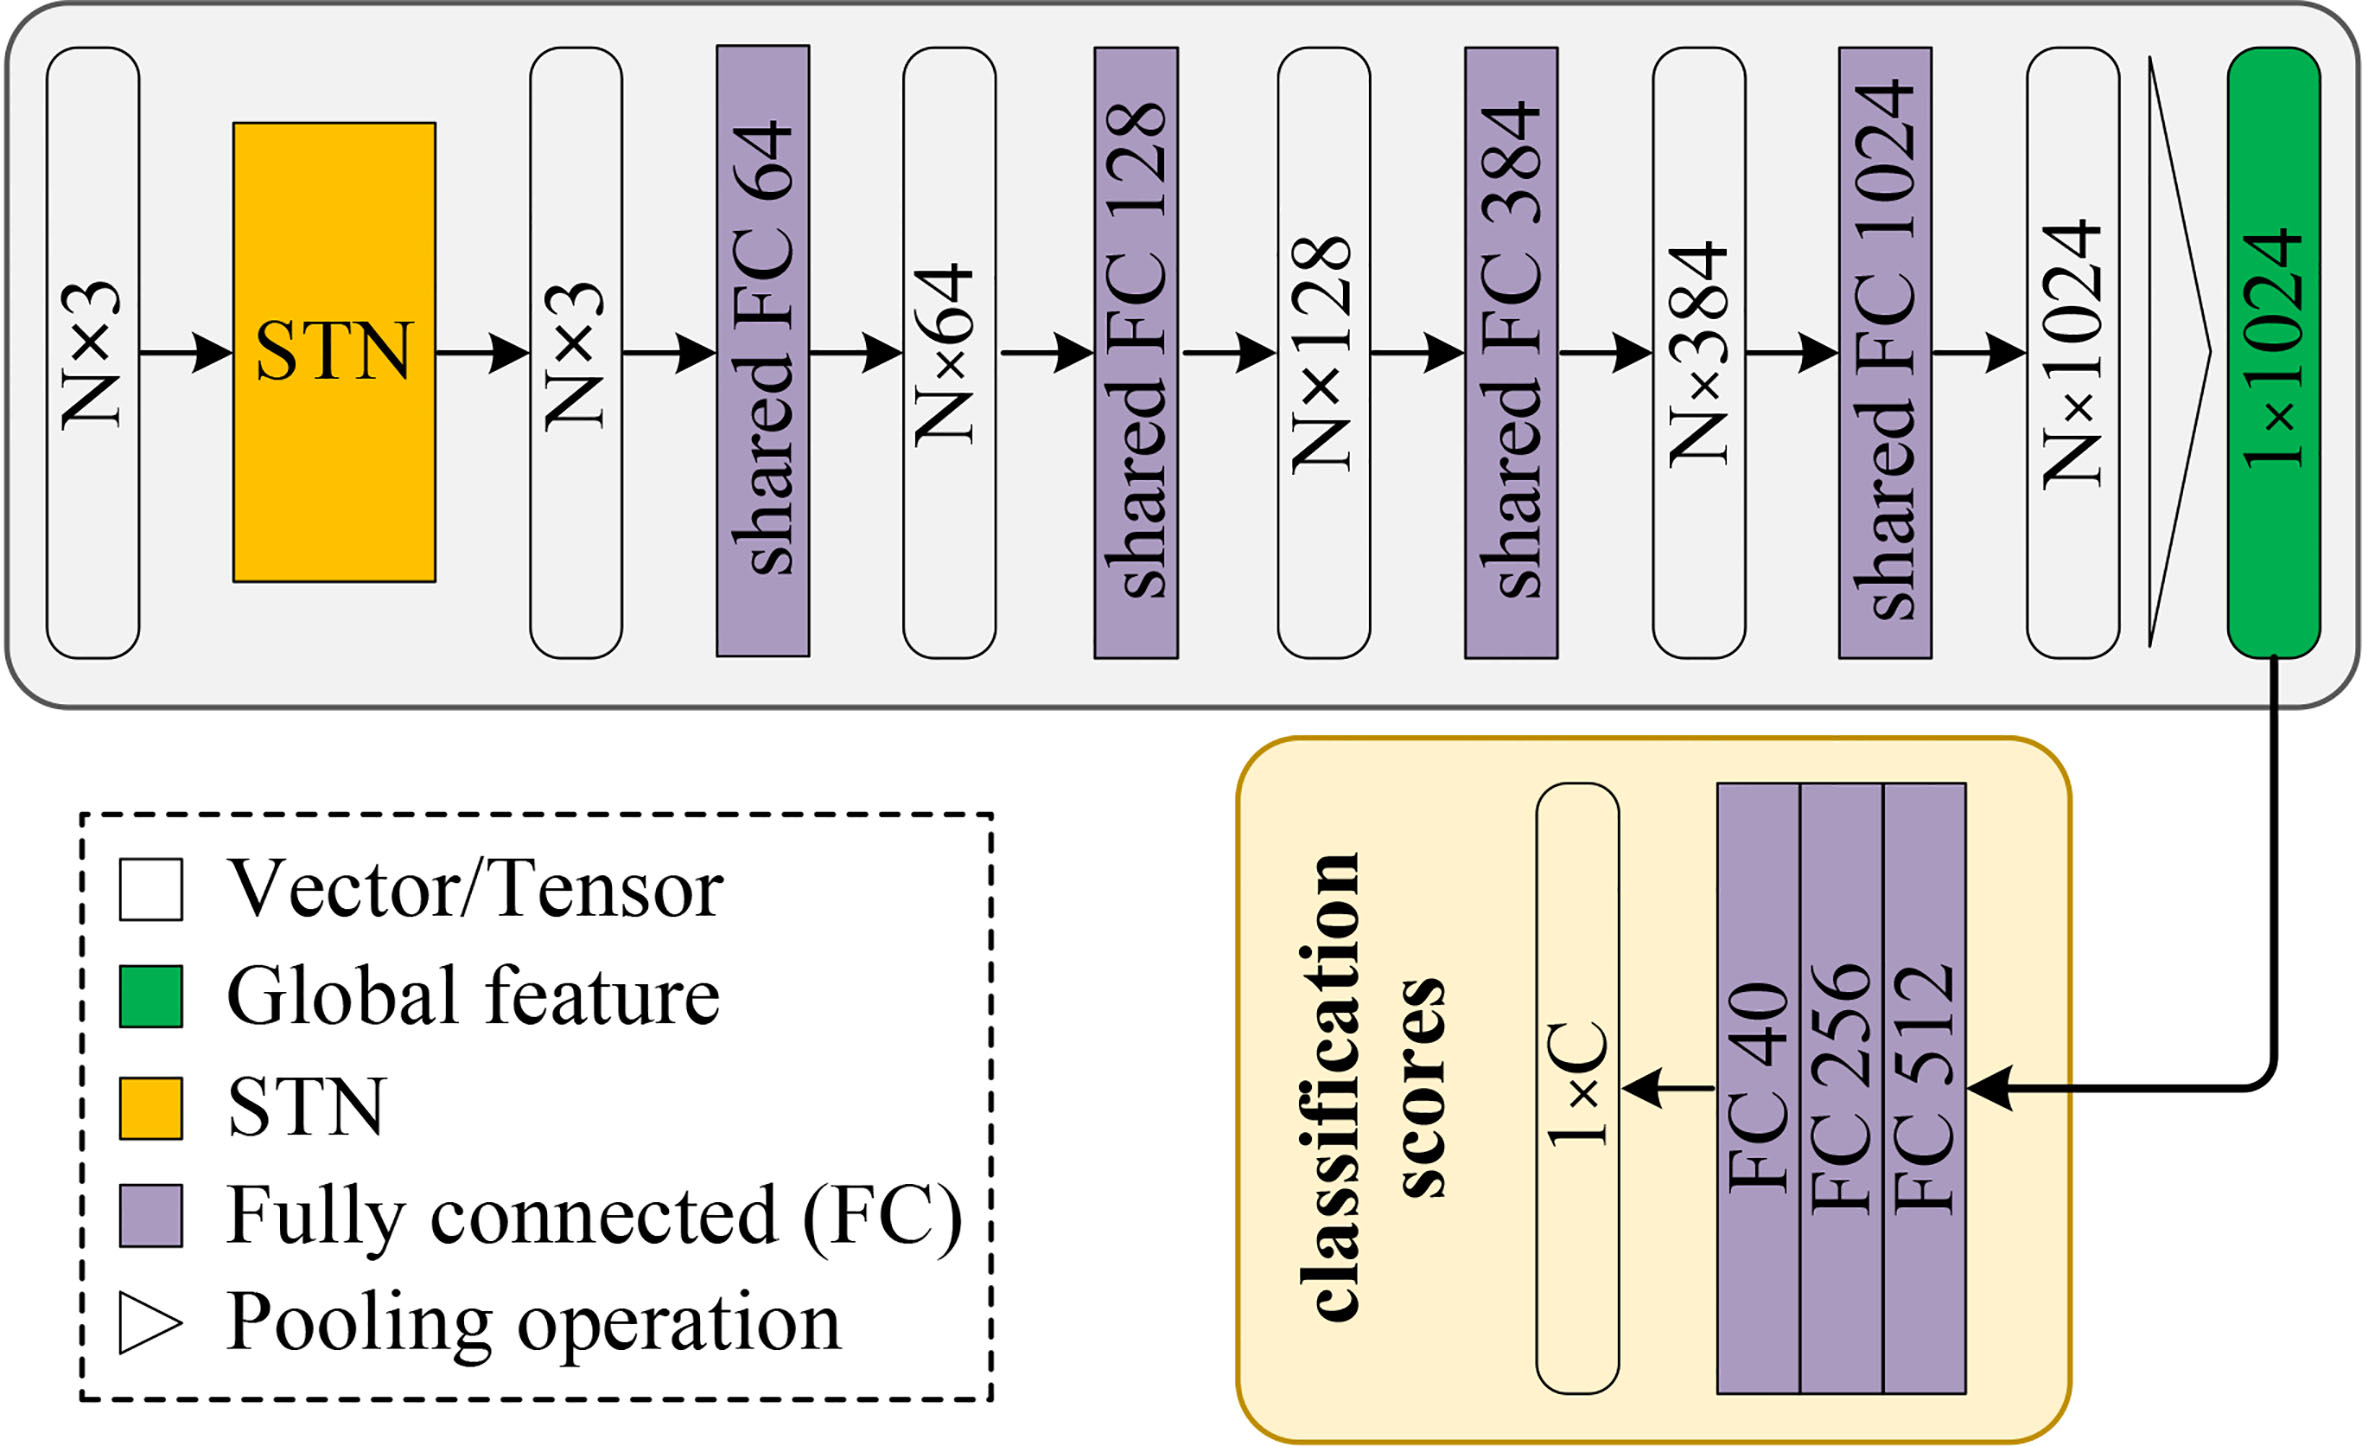
We also compared different designs for the neural network architectures, and the results are reported in Table 1. The first row presents the results of a basic version with only the STN module. Unsurprisingly, the performance without the KNN and VLAD modules is poor. The second row presents the results of integrating the STN and KNN modules, and the third row presents the results of integrating the STN and VLAD modules. As the results show, the introduction of the KNN and VLAD modules alone enhances the performance by 2.72% and 5.10%, respectively. When all three modules are integrated, as shown in the last row, PointwiseNet achieves a classification accuracy of 90.86%.
Effects of KNN and VLAD modules for 3D object classification on ModelNet40
We analyse the results of this experiment as follows: (1) Although different modules make different contributions to the classification accuracy, the final classification accuracy could be further improved by adding more modules. (2) In the 3D object classification task, the high-level semantic feature is more important than the low-level geometric feature, which fully demonstrates that the VLAD module effectively extracts the high-level semantic feature. (3) PointwiseNet achieves the state-of-the-art performance even with a much smaller input data size (
In this section, to study the influence of different pooling operations (including max-pooling and average-pooling), we quantitatively evaluated the proposed approach on the ModelNet40 benchmarks for 3D object classification. For this study, the effect of pooling operations effects includes are as follows. First, the pooling operations reduce the computational complexity caused by the high-dimensional feature vector. Second, the pooling operations cause the global feature to retain more semantic information. Finally, the pooling operations make our model invariant to input permutations.
As shown in Fig. 2, our model includes two pooling operations, namely, local pooling and global pooling implemented as either max-pooling or average-pooling. We compare the different pooling combination strategies in Table 2.
Comparison of different pooling combination strategies on ModelNet40
Comparison of different pooling combination strategies on ModelNet40
As shown, in both the local pooling layer and global pooling layer, the use of average-pooling does not contribute to the accuracy improvement; instead, it degrades the performance. In contrast, the use of max-pooling in both layers contributes to the performance improvement. Based on these results, we adopt max-pooling to extract both local features and global features in this study.
ModelNet shape classification. Comparison of the accuracy of the proposed model with the state-of-the-art models. Our network achieves better performance on ModelNet10, and it achieves state-of-the-art performance on ModelNet40 compared to other deep networks on 3D input. The top 2 ranked values are highlighted in bold and the first and second are shown in red and blue, respectively
ModelNet shape classification. Comparison of the accuracy of the proposed model with the state-of-the-art models. Our network achieves better performance on ModelNet10, and it achieves state-of-the-art performance on ModelNet40 compared to other deep networks on 3D input. The top 2 ranked values are highlighted in bold and the first and second are shown in red and blue, respectively
In this section, we show the efficiency of PointwiseNet when applied to representation learning and 3D point cloud feature extraction from 3D point clouds. We quantitatively evaluated the proposed approach on the ModelNet10 and ModelNet40 benchmarks (the same dataset as in Section 6.1) and compared it with several state-of-the-art methods (including MVCNN [21], 3DShapeNets [24], OctNet [26], VoxNet [25], O-CNN [27], RGCNN [47], PointNet
From Table 3, PointwiseNet outperforms all the other methods that only use points as input data on the ModelNet10 dataset. PointwiseNet is 3.7% better than ECC [49] with an input data size of
On the ModelNet40 dataset, PointwiseNet achieves state-of-the-art performance among methods based on 3D input (3D volumetric grid). There is only a small gap between PointwiseNet and MVCNN [21], which we believe is due to MVCNN pretrained on ImageNet images from 1000 categories and fine-tuned on all 2D views of the 3D shapes in the training set. However, the drawback of MVCNN is that one needs to prepare multi-view images of the 3D data, and thus, it is computationally more expensive. We conclude that our PointwiseNet can achieve performance similar to that of the mature multi-view CNN. Compared with point-based methods, our results are better than all previous single-model results except for Kd-Net (depth 15) [42], but the input data size required for PointwiseNet is only 1/32 of the Kd-Net (depth 15).
From Table 3, PointNet
Part segmentation is a challenging task in the 3D object recognition domain, and it is defined as a per-point classification problem. We use the model discussed in Section 3 to predict the part label of each point in a 3D point cloud object (e.g., in an aircraft, each point can correspond to the body, wings, tail or engine). Similar to [39], we utilize the intersection over union (IoU) of each category as the evaluation metric. The IoU of each shape is averaged over the IoU of each part that occurs in this shape. The mean IoU of each category is obtained by averaging the IoUs of all the shapes in the category. The overall mean IoU can then be calculated by averaging the IoUs of all categories. We employed the segmentation module of our architecture as discussed in Section 3 to predict part labels for individual points within point clouds.
Dataset
ShapeNet [1] was released in May 2015, and the repository has already been widely used by hundreds of groups in academia and industry. ShapeNet is used for 3D reconstruction, 3D shape analysis and synthesis, 3D printing, and scanning data analysis. In this study, we adopted ShapeNet to evaluate our architecture for part segmentation. ShapeNet contains 16,881 shapes represented as separate point clouds from 16 categories with per-point annotations (with 50 parts in total). In this dataset, both the categories and the parts within the categories are highly imbalanced, which poses a challenge for all methods, including ours. To
Part segmentation results on the ShapeNet-core dataset. Intersection over union (IoU) is reported as the evaluation metric. The top 3 ranked values are highlighted in bold and the first, second and third places are shown in red, blue and green, respectively
Part segmentation results on the ShapeNet-core dataset. Intersection over union (IoU) is reported as the evaluation metric. The top 3 ranked values are highlighted in bold and the first, second and third places are shown in red, blue and green, respectively
Results of part segmentation on the validation data of the ShapeNet part dataset.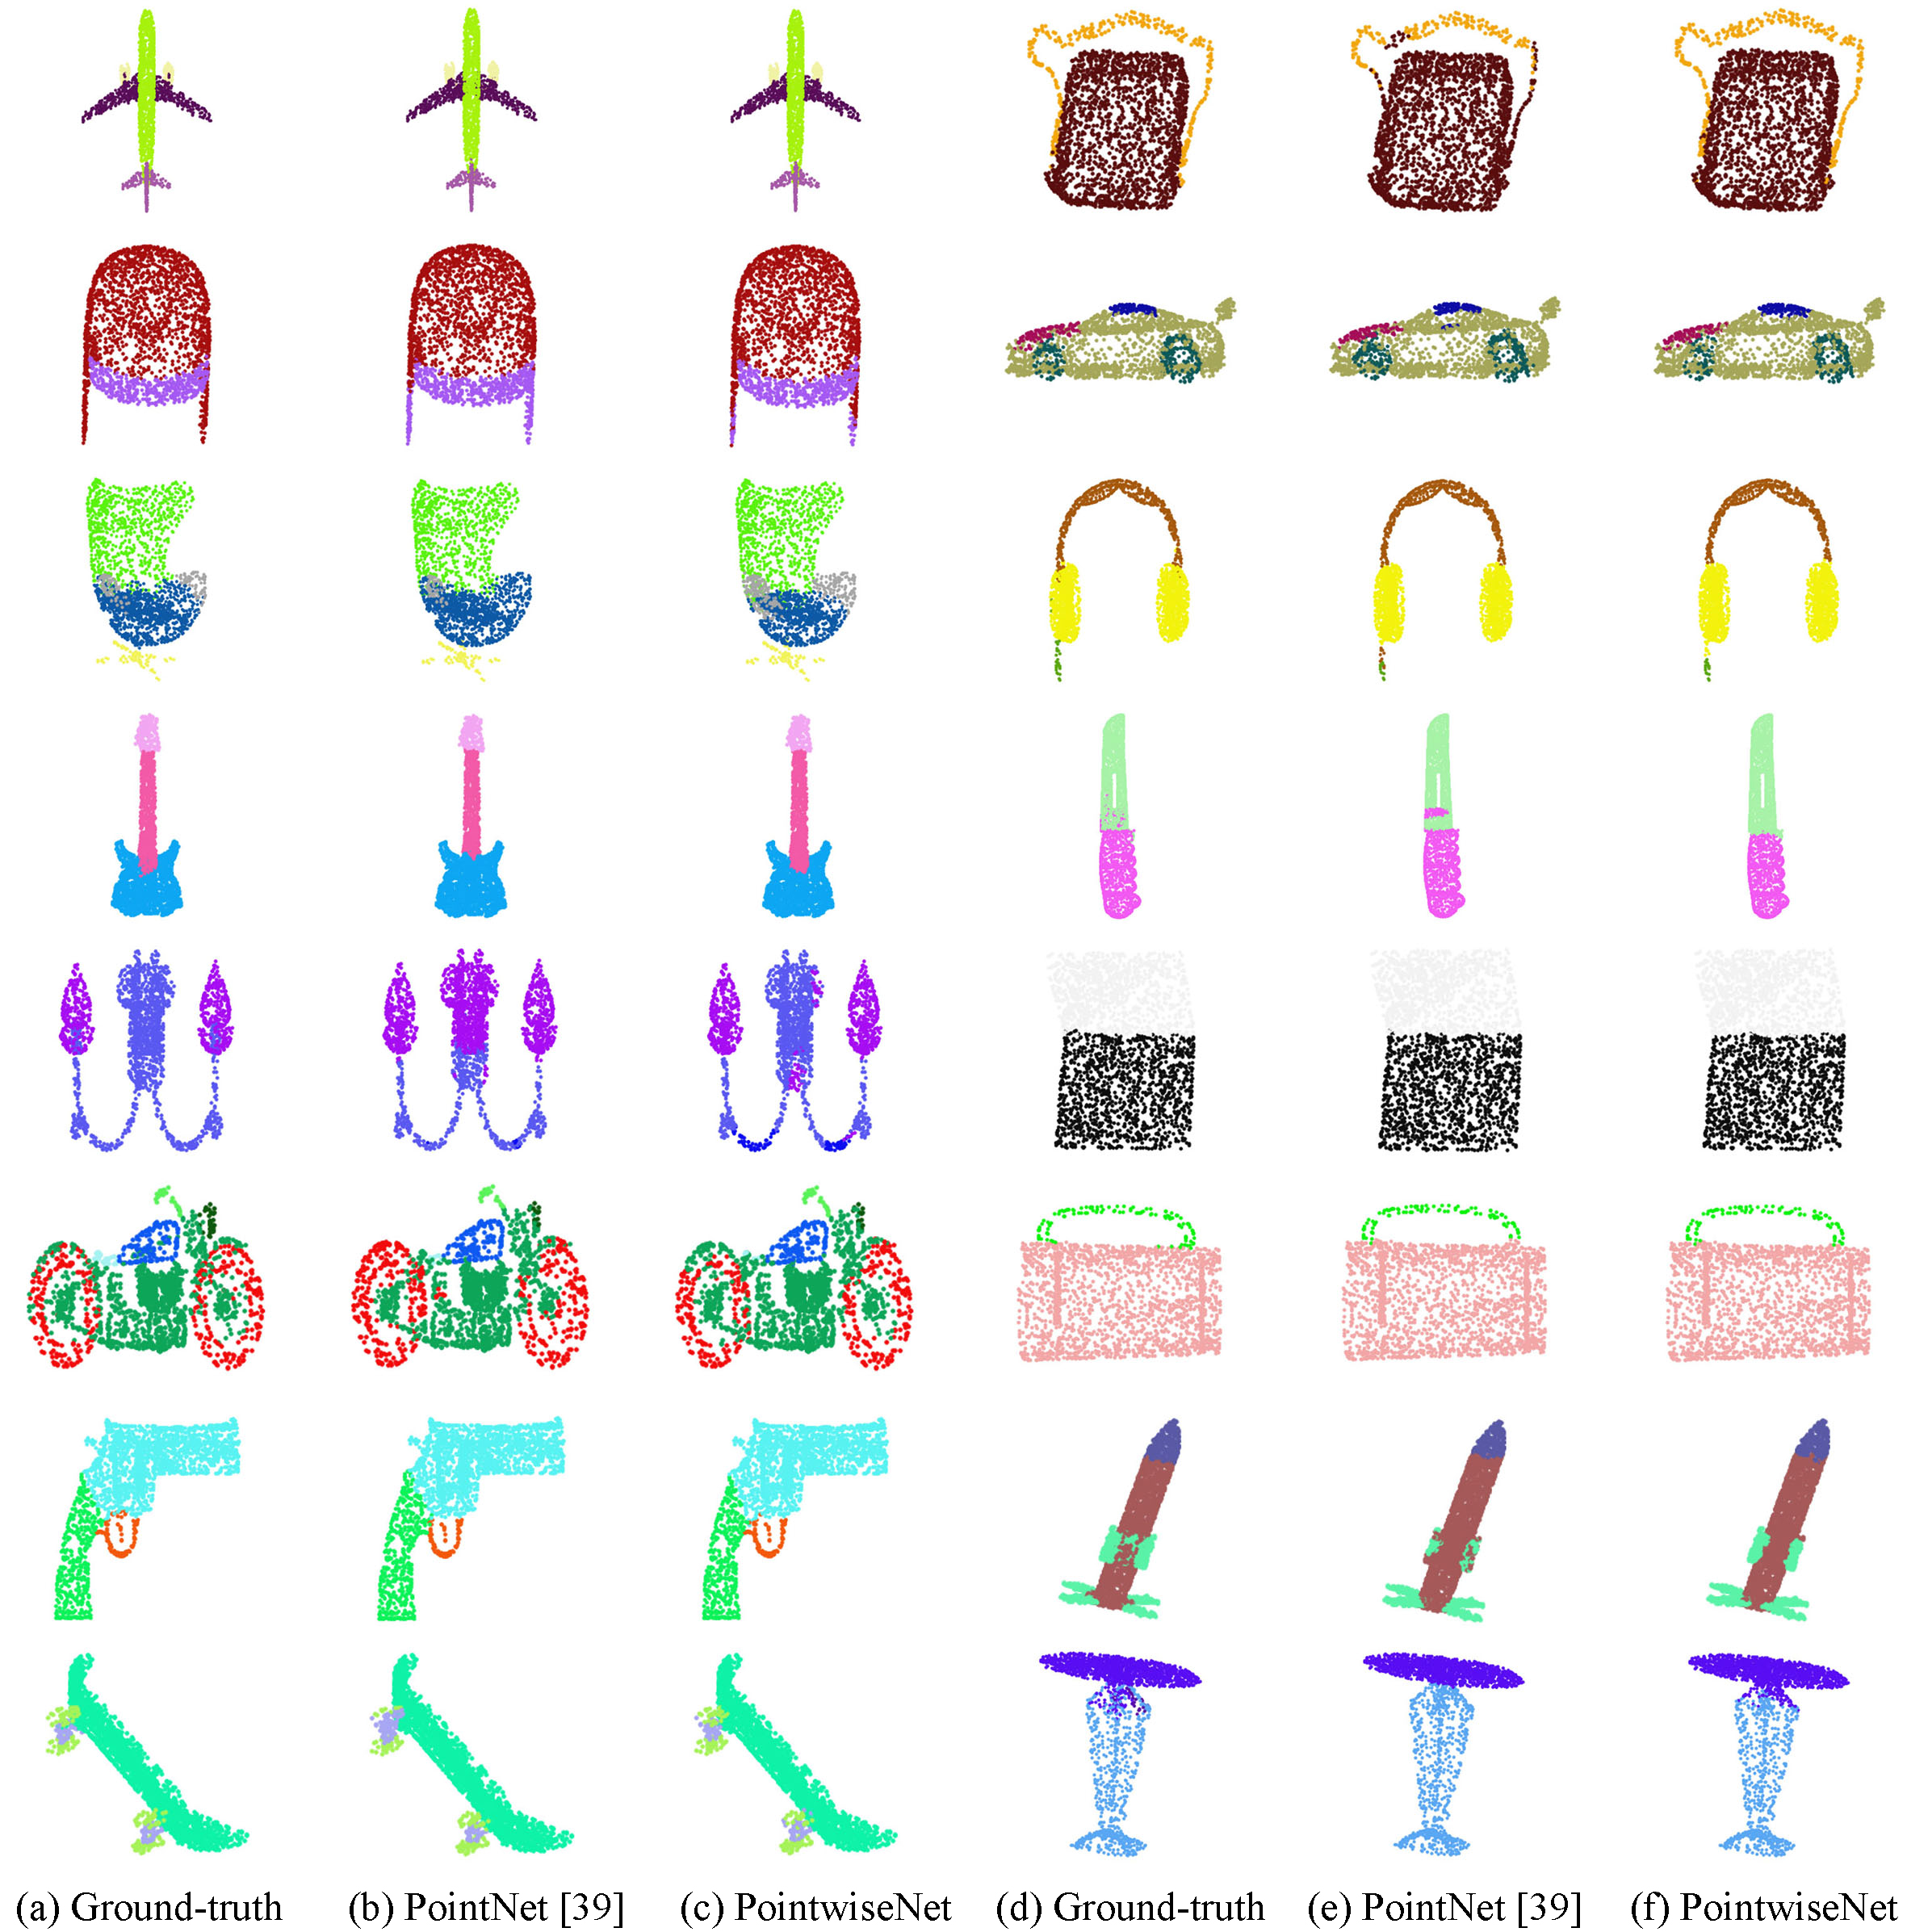
convert a CAD model into a point cloud, we use the same strategy as that discussed in Section 6.2 to uniformly sample 2,048 points for each object.
The network configuration of the segmentation model is set as follows. The
Results
We compare our network with Wu et al. [51], 3DCNN [39], ShapeNet [1], Kd-Net [42], PointNet [39], RGCNN [47], 3DmFVNet [52], So-Net [48], and PointNet
From the experimental results, the overall mean IoU of PointwiseNet is equivalent to that of PointNet
Compared with PointNet
Some segmentation results from PointwiseNet are visualized in Fig. 8. Examples are plane, bag, cap, car, chair, earphone, guitar, knife, lamp, laptop, motor, mug, pistol, rocket, skate and table. Due to space limitations, it is impossible to show all the examples; thus, we randomly selected a model from each category for visual comparison. For each group of objects, the leftmost one is the ground truth, the middle one was predicted by PointNet [39], and the right one was predicted by PointwiseNet. Zooming into Fig. 8, by observing the details of the segmentation results, we can find that the segmentation accuracy of this method is significantly better than that of PointNet. For example, in the second case of the first line (bag), PointNet incorrectly splits part of the tape while PointwiseNet does not. Moreover, in the second case of the fifth line (lamp), the segmentation result of PointwiseNet is closer to the ground truth.
Semantic segmentation in scenes
To validate the suitability of PointwiseNet for large-scale point cloud analyses, we also conducted experiments on a semantic scene labeling task.
Dataset
S3DIS [31] contains 3D scans from Matterport scanners in 6 areas, including 271 rooms. Each point in the scan is annotated with one of the semantic labels from 13 categories (chair, table, floor, wall and so forth plus clutter). Each point is represented by a 9-dimensional vector of XYZ, RGB and normalized location within the room (from 0 to 1). To perform scene segmentation, each squared-meter block of the scene (measured on the floor), sampled to 4096 points, is fed into the network. The predictions for all the blocks are then assembled to obtain the prediction of the entire scene.
Implementation details
Because semantic segmentation is similar to part segmentation, our network can easily be extended to semantic scene segmentation, where point labels become semantic object classes rather than object part labels. The input to the semantic segmentation network is the 9-dimensional vector of XYZ, RGB and normalized room location described above. We remove the STN and KNN modules, preserving only the VLAD module. With this modification, our network is able to predict per-point semantic object classes by relying on both local and global features. The number of visual words for the VLAD module is set to 13, and the top-
To ensure a fair comparison, we conducted 6-fold cross-validation in our experiment following PointNet [39]. Specifically, the dataset is divided into 6 splits: 5 are used for training, and one is used for testing, resulting in 6 models. Finally, we calculated the average IoU and the overall segmentation accuracy over the 6 models.
Results
The results show the feasibility of our PointwiseNet for semantic segmentation. From Table 5, PointwiseNet significantly outperforms PointNet [39], SegCloud [53], RSNet [54] and A-SCN [55], achieving an accuracy of 83.36%.
Comparison of scene segmentation on the S3DIS dataset. The evaluation metric is the average IoU over 13 classes (structural and furniture elements plus clutter) and the classification accuracy is calculated on points
Comparison of scene segmentation on the S3DIS dataset. The evaluation metric is the average IoU over 13 classes (structural and furniture elements plus clutter) and the classification accuracy is calculated on points
Qualitative results for semantic segmentation. From left to right: original input scenes; ground truth point cloud segmentation; PointNet [39] segmentation results and PointwiseNet segmentation results.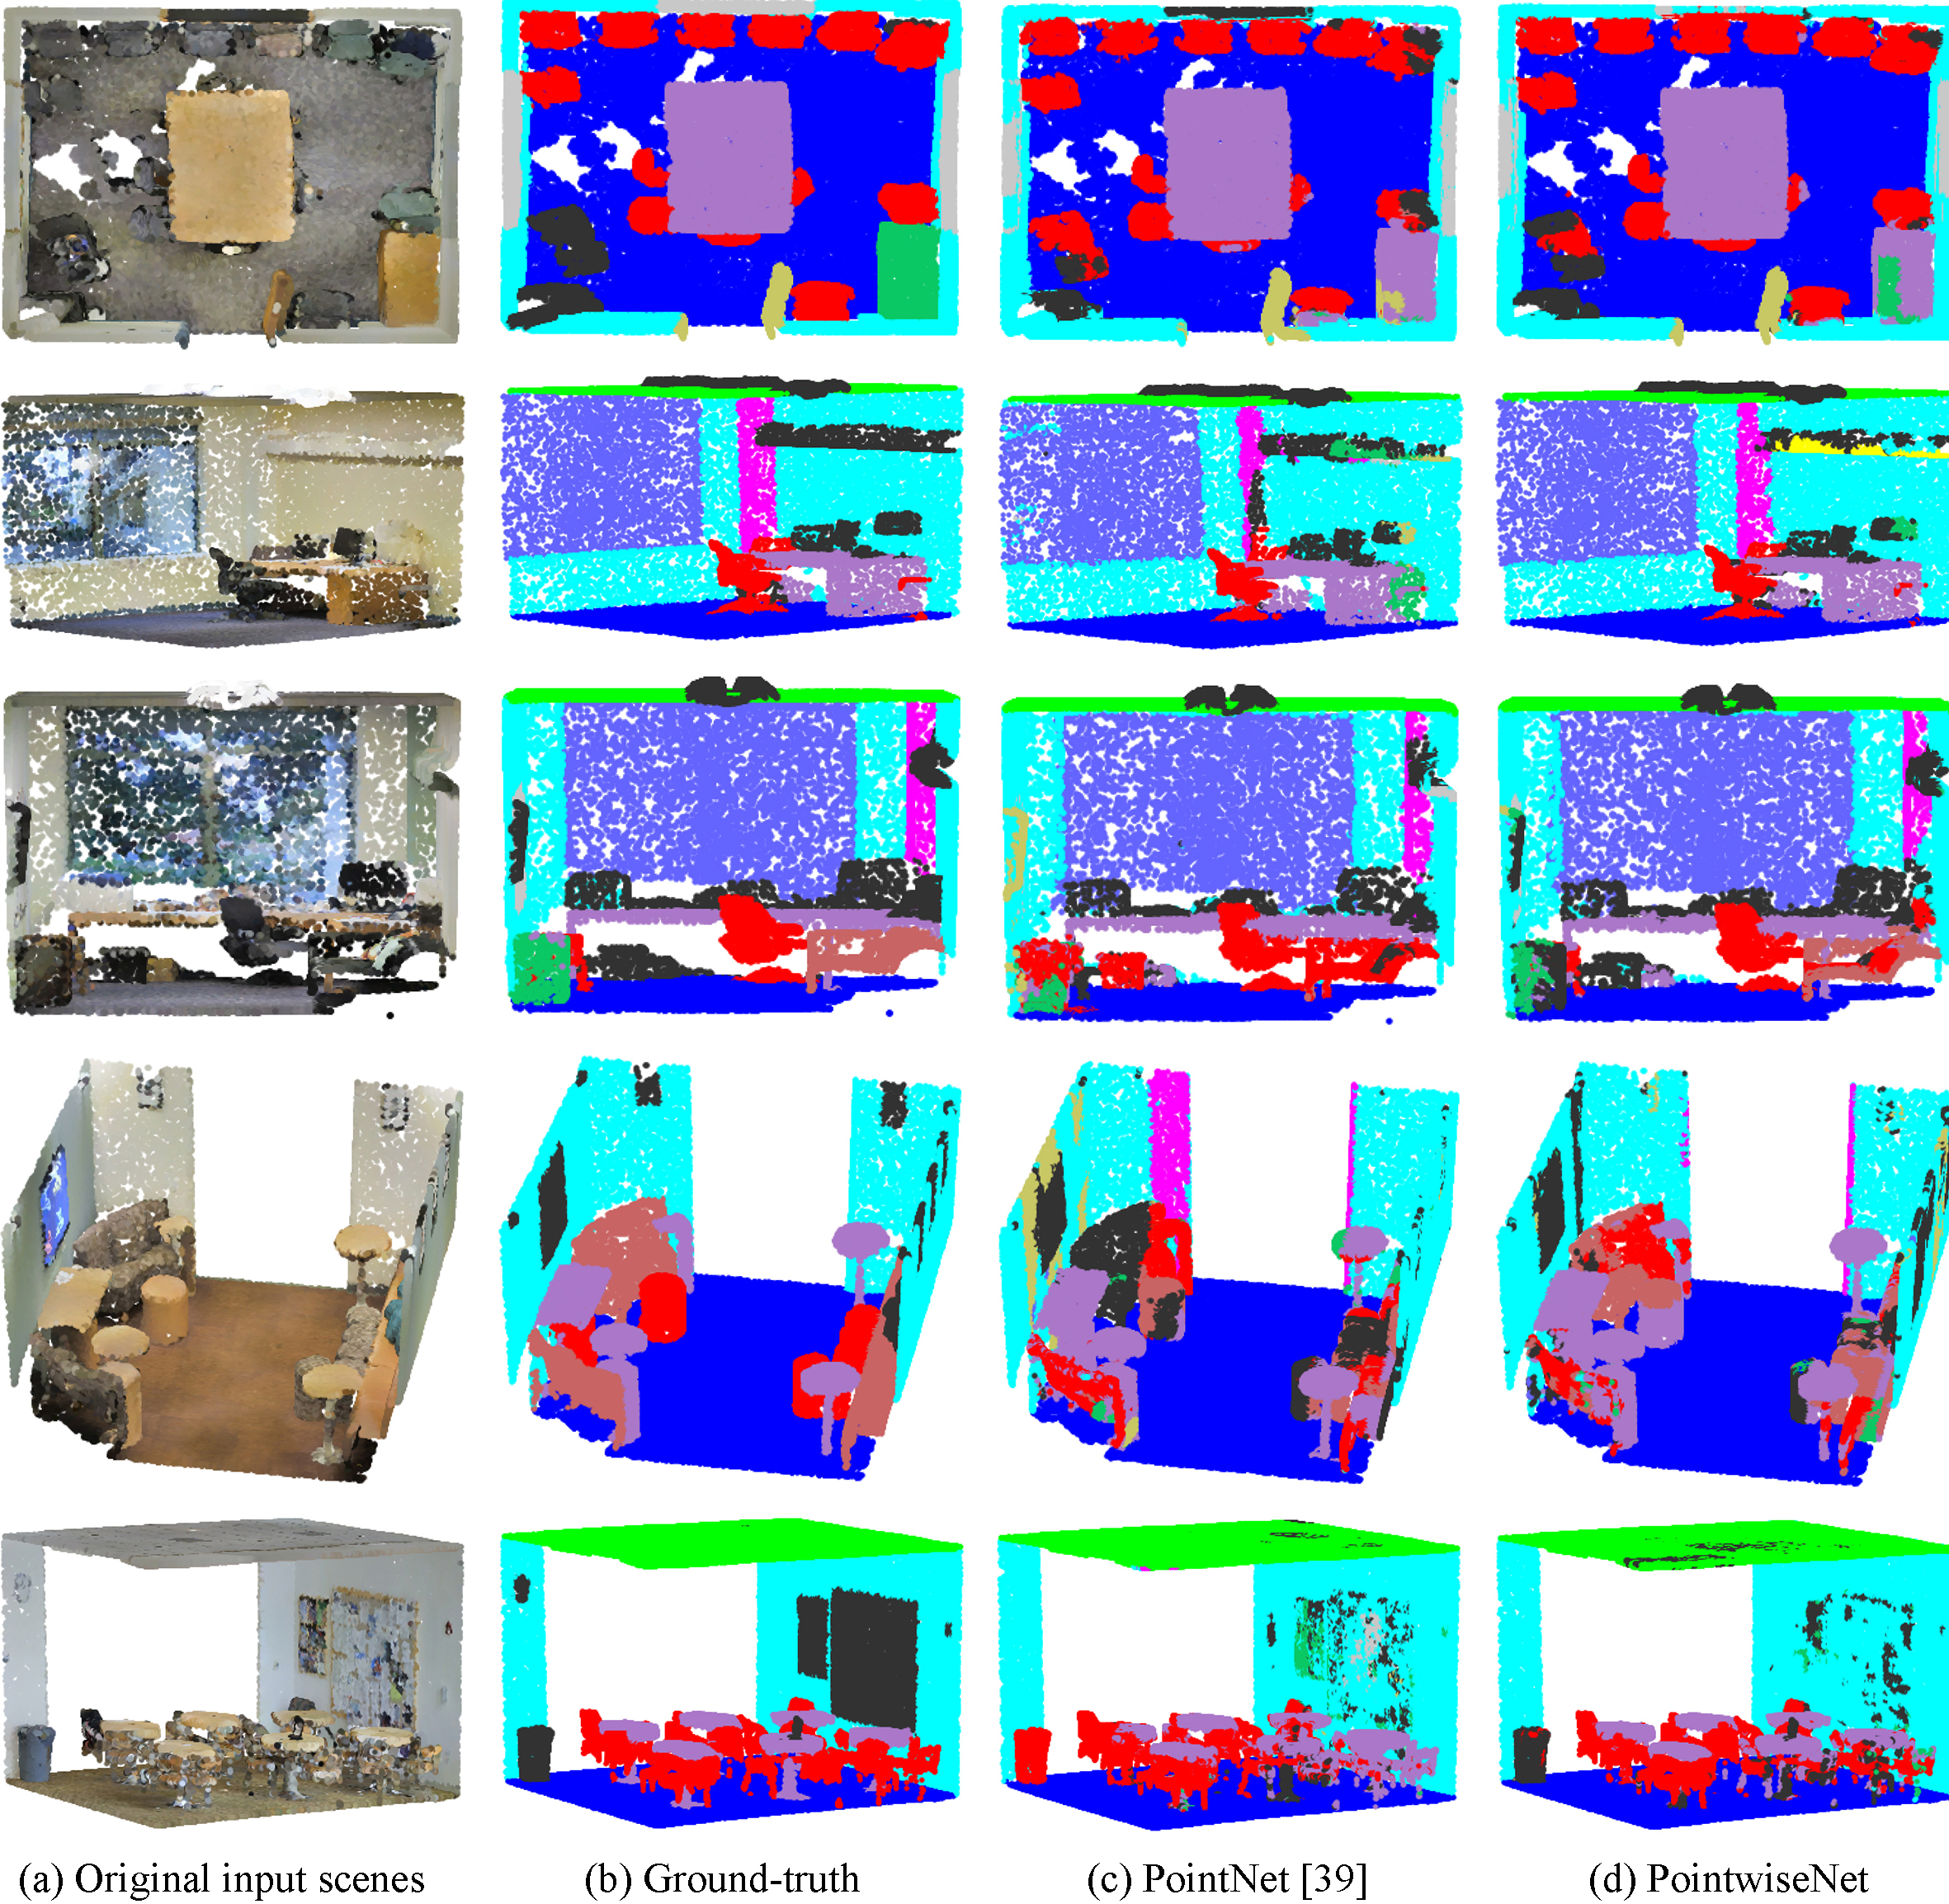
The visualization of semantic parsing is shown in Fig. 9. We selected 5 room scenes (from top to bottom are conference room #1, office #1, office #3, lounge #1, and lobby #1) from the evaluation dataset for display. The first column is the input point cloud, with the walls and ceiling hidden for clarity. The second, third, and last columns are the ground truth segmentation, the prediction from PointNet [39], and the prediction from PointwiseNet, respectively, where the points belonging to different semantic regions are coloured differently (chairs in red, tables in purple, bookcase in green, floors in blue, clutters in black, beam in yellow, board in grey, and doors in khaki). By comparing the segmentation results with the ground-truth point cloud segmentation, it can be seen that PointwiseNet effectively recognizes the objects in the indoor scene correctly.
As shown in Fig. 9, the segmentation accuracy of PointwiseNet is substantially better than that of PointNet [39]. For example, in the lower right corner of the third scene, the segmentation results PointwiseNet are closer to the ground truth than those of PointNet. Moreover, in the lower left corner of the fifth scene, PointNet recognizes the trash can as a chair while our method does not.
Currently, 3D CAD models are widely available, but a method for retrieving 3D CAD models is essential for managing and analysing such models. The key to 3D CAD model retrieval is to generate a compact and informative feature for each 3D CAD model and then using the feature to retrieve the most similar 3D CAD model. Given a query 3D CAD model and a 3D CAD model library, the similarity between the query and the candidates can be computed by their feature vector distances. The retrieval set of a query 3D CAD model is constructed by collecting all the 3D CAD models with the same label and then sorting them by the feature vector distance between the query 3D CAD model and the retrieved 3D CAD model.
Comparison of our approach and the state-of-the-art approaches
Comparison of our approach and the state-of-the-art approaches
The retrieval results. Leftmost column: queries. Right five columns: retrieved models from the 3D CAD model database.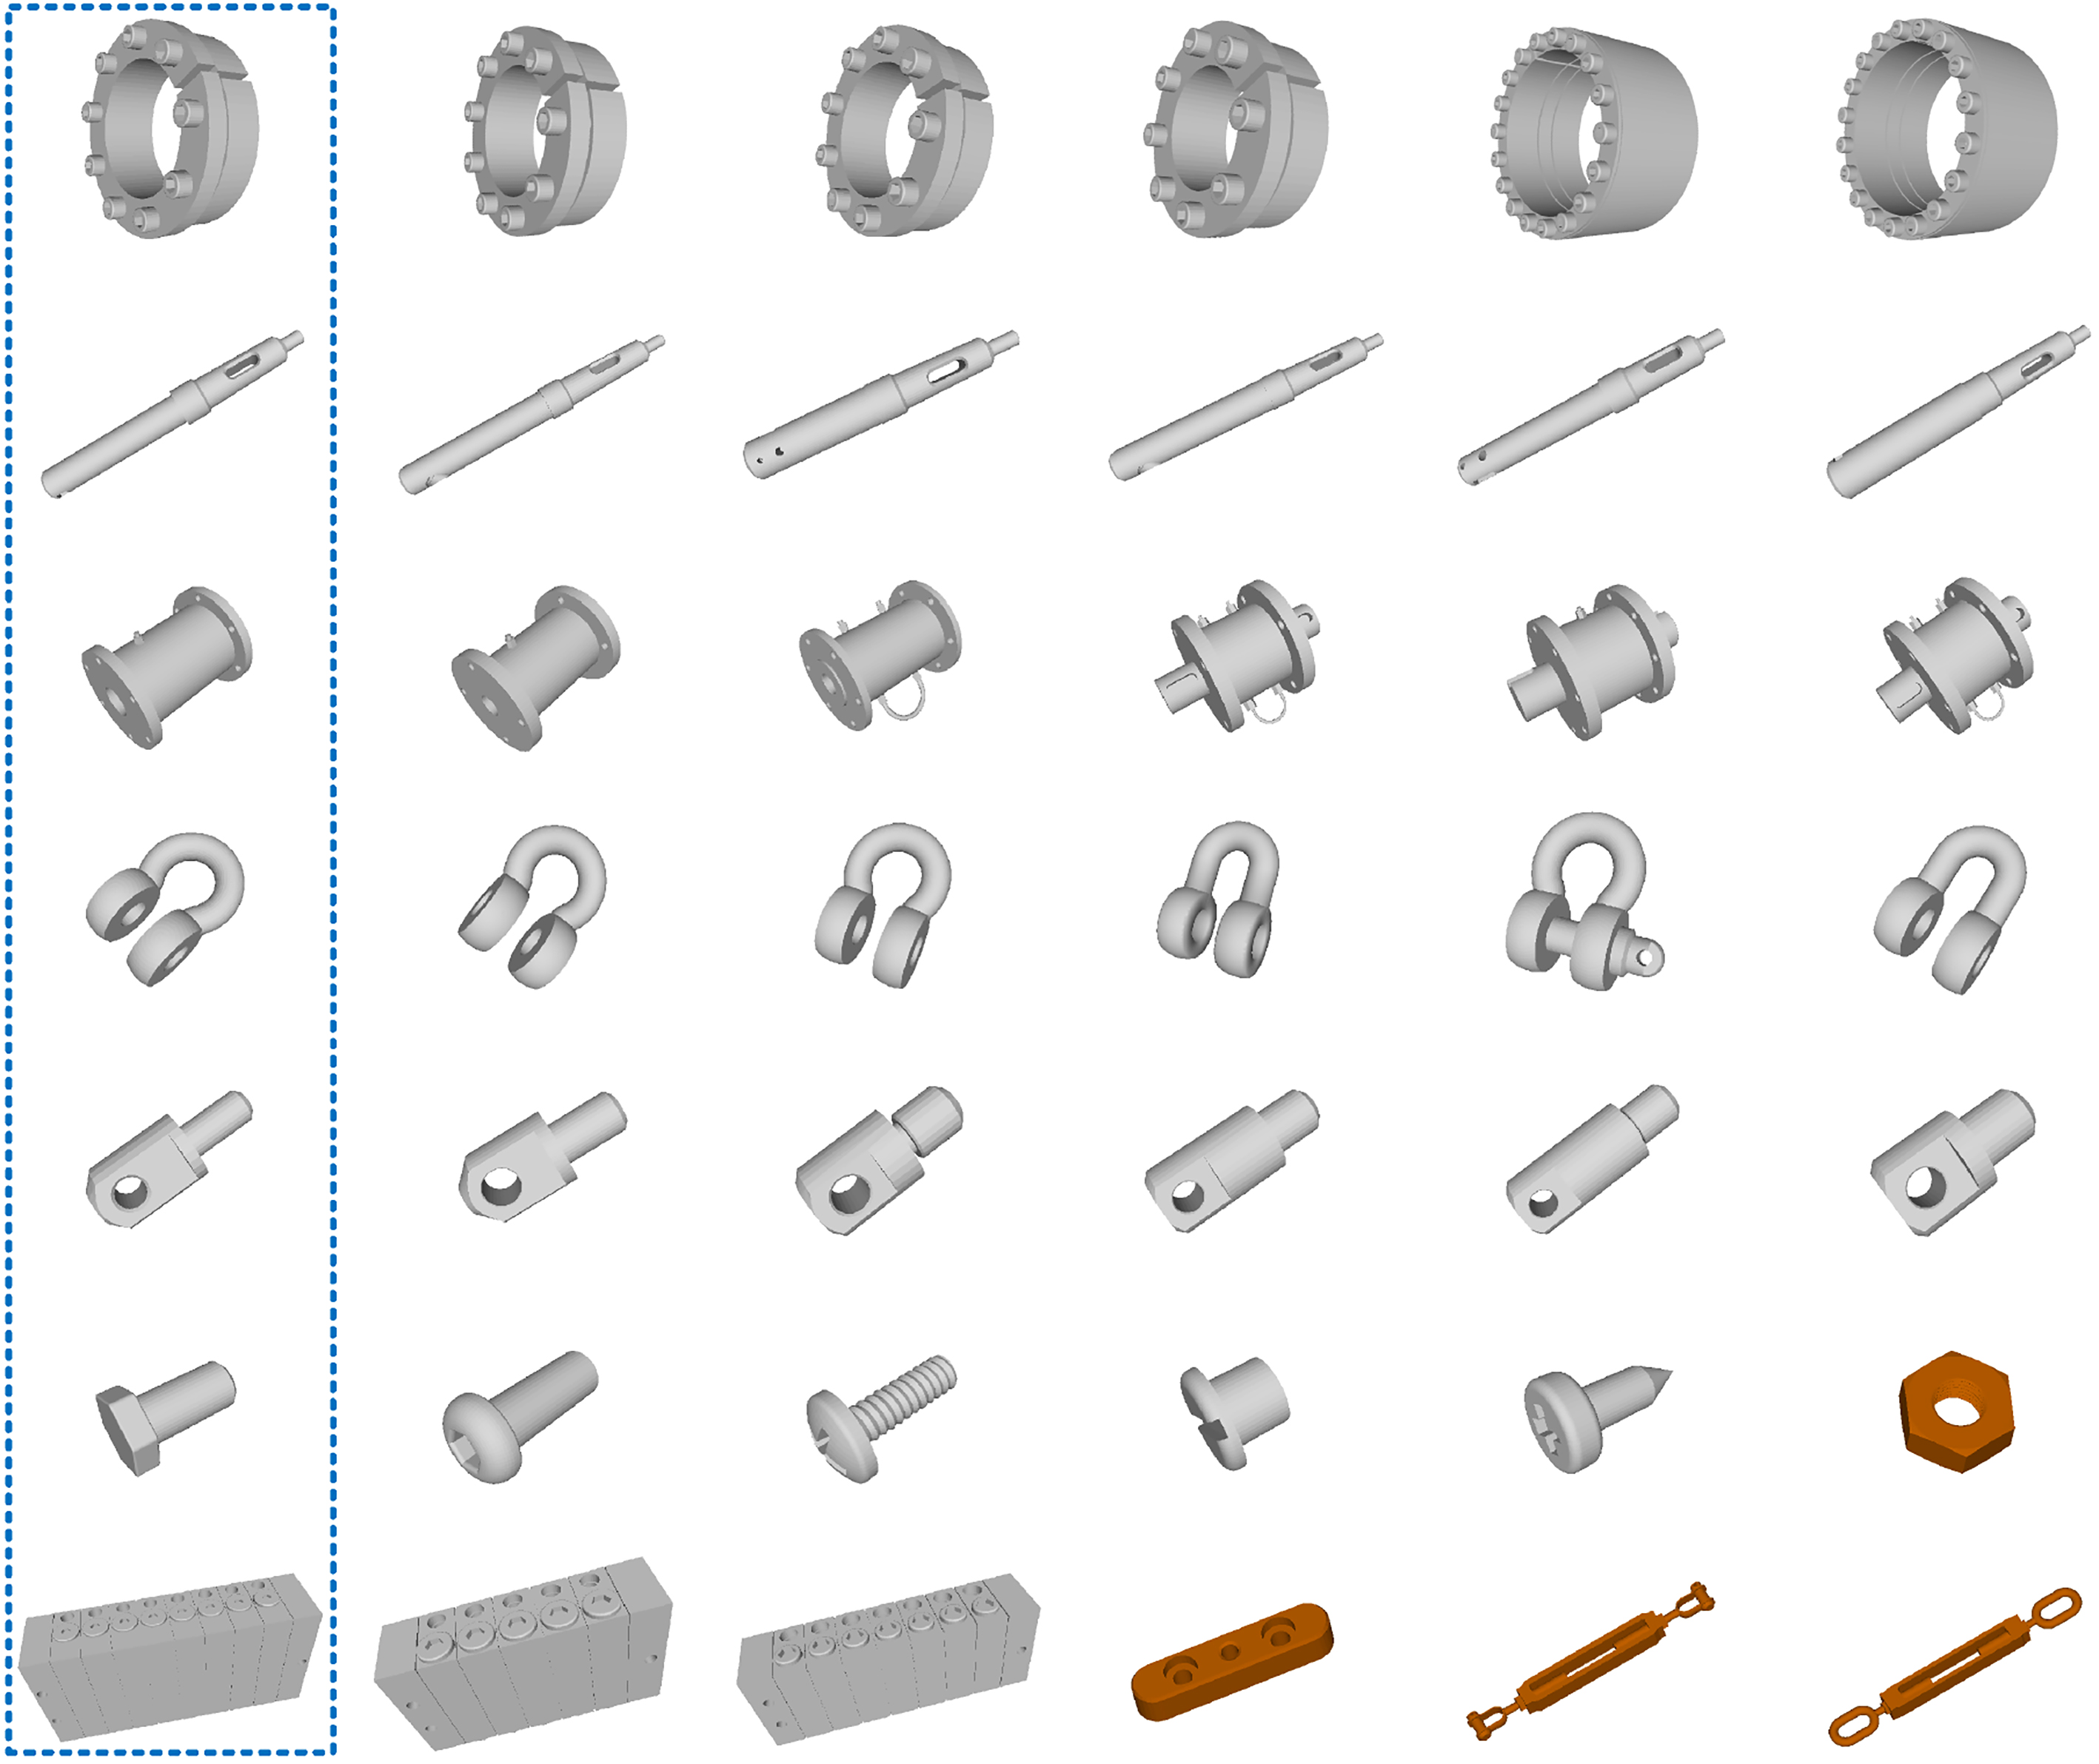
To evaluate the performance of PointwiseNet, a commercial database was used as the test dataset. The commercial 3D CAD model database [32] was generated from several mechanical manufacturing enterprises for CAD model retrieval tasks over several recent years. The models were designed by experienced engineers using mainstream commercial CAD toolkits, such as SolidWorks, Pro/Engineer, CATIA, and UG NX. The database includes a total of 7,464 models in 28 generic categories: gears, screws, nuts, springs, wheels, keys, bearing houses, flanges, washers, and so forth. The mechanical part catalogue is used as a reference for selecting those categories. The entire model dataset is divided into 5,990 samples for training, 737 samples for validation, and 737 samples for testing. We first converted the STEP-based model to an STL-based model, and then converted the STL-based model to a point cloud using the same strategy as discussed in Section 6.2.
Implementation details
We trained our network (using the same network architecture as used for our classification network) as the feature extractor and found the nearest neighbour results based on L2 distance. We set the K value of the nearest neighbour search in the KNN module to 6, the number of visual words in the VLAD module to 16, and the top-
Results
We tested PointwiseNet on the commercial 3D CAD model database and compared the results with those of the state-of-the-art methods. The quantitative results are presented in Table 6. The second column shows the features used to describe the 3D models. PointwiseNet directly consumes the point cloud, and it requires no handcrafted features. The third column shows the classifiers, and the average correct rates of each approach are compared in the rightmost column. As shown in the table, PointwiseNet performs better than all the other approaches. The advantage of PointwiseNet is that there is no need to extract handcrafted features from the commercial 3D CAD model. Instead, we need only convert the 3D CAD model into point cloud data to achieve the commercial 3D CAD model retrieval task. Therefore, PointwiseNet not only avoids the cost of storing handcrafted features but also effectively improves the retrieval precision.
Some visualization results of the model retrieval tested on commercial 3D CAD models of PointwiseNet are shown in Fig. 10. The first column is query shapes. For each query in the test set, a retrieval list (columns 2–6) is returned, which is ordered by feature similarity. PointwiseNet achieved 100% recognition accuracy for 25 of the 28 categories in the test dataset. Among the 737 samples in the test dataset, PointwiseNet incorrectly recognized only 5 models. These results show that PointwiseNet achieves the highest commercial 3D CAD model retrieval performance among all 5 compared methods.
Conclusion
In this manuscript, we present a simple end-to-end network for 3D shape analysis named PointwiseNet. PointwiseNet combines pointwise low-level geometric and high-level semantic features with the help of three phases: STN, KNN, and VLAD. The STN module makes the network invariant to input rotation. The KNN and VLAD modules extract the low-level geometric information and high-level semantic information for each point of the 3D point cloud, respectively. To impart PointwiseNet with translation invariance and fidelity to the 3D input cloud, the KNN module performs the uniform operation and a concatenation operation. Furthermore, we present the VLAD mechanism to extract high-level semantic information, which is indirectly described by the relationship of each point’s low-level geometric descriptor to a few visual words. Moreover, PointwiseNet also solves the disorder problem of point cloud data based on pointwise features and pooling operations.
Overall, the proposed PointwiseNet is simple, effective, end-to-end, requires fewer parameters, and is robust to input noise because it learns semantic information from 3D point clouds. We conducted extensive experiments on a number of benchmark datasets (ModelNet, ShapeNet, S3DIS and the commercial 3D CAD model database), and the results show that PointwiseNet achieves state-of-the-art performance.
Inspired by the recently popularized graph neural networks, in future work, we plan to consider building a deeper network composed of VLAD layers and learning the semantic relationships between distinct points by utilizing graph neural networks.
Footnotes
Acknowledgments
This work was supported in part by the National Natural Science Foundation of China under Grants 61702350 and 61472289 and in part by the Open Project Program of the State Key Laboratory of Digital Manufacturing Equipment and Technology, HUST, under Grant DMETKF2017016.