
Abstract
Clustering is the primary technique used to divide data into groups based on unknown models inherent to the data. Regulation of the entire clustering method is complicated and submitted to several uncertainties. Similarity measures one of the first decisions to be made to establish how the similarity between two objects must be measured. This research focuses on the influence of similarity measures in the hierarchical clustering to uncover patterns in heavy-tailed data. Stable distributions are the most important subclass of heavy-tailed distributions. A well-known measure of similarity is defined based on correlation of two objects. However, this measure cannot be used for heavy-tailed data. We will illustrate how to perform a hierarchical cluster analysis in heavy-tailed data by extending the similarity measure based on the correlation. We introduce a new similarity measure based on covariation coefficient. We evaluate the performance of covariation similarity and compare it to others using external and internal criteria.
Introduction
In real life, we attempt to organize similar objects together and arrange them into various groups, a simple and essential way of discovering order among the utter confusion. The aim of clustering is to uncover a system of organizing objects where members of the group have similar properties. Clustering, a main unsupervised learning method, can be utilized to investigate the structures of large and complex data. It has been applied to pattern recognition, data mining and image processing [25, 7].
The clustering methods are usually divided into two groups: non-hierarchical and hierarchical. Non-hierarchical clustering generates a single partition, whereas hierarchical clustering method generates a result named dendrogram from which various and consistent partitions can be obtained at the various levels [25, 7]. It has been extensively applied in a lot of applications, such as document clustering [12], the study of gene expression data, regulatory networks, protein interaction networks [3, 34] and foreign currency exchange market [6, 35, 17, 19].
Usually, investigators use the most common distance measures in the clustering methods without evaluating the validity of several conditions. When the various conditions are not considered, drawn conclusions are unclear, and may affect the decision-makers to wrong decisions. Furthermore, with regard to the choice of dissimilarity measures, the researcher must be aware that their choice can often meaningfully affect the results of the clustering. Also, some dissimilarity measures are not suitable when various conditions of variables are not satisfied. Such as, in this article, we will show that Euclidean distance is inadequate when the distribution of data is far from the normal distribution. We indicate our covariation similarity can solve this defect by improving hierarchical clustering of heavy-tailed data. Therefore, the identification of the proper dissimilarity measures to apply under various cases is the foremost motivation of researchers working on this topic to decide which dissimilarity measures should be utilized in the case of various conditions.
This study hopes to provide literature for making better decision on choice of appropriate dissimilarity measure for data with the heavy-tailed distribution. One of the common definitions of the heavy-tailed data is a minority of large values in the tails and a majority of little values in the middle of its corresponding density. For instance, a country’s population is often distributed such as a heavy-tailed behavior, with a minority of people in the countryside and the huge majority in urban areas [29, 31].
Hierarchical cluster analysis can be agglomerative or divisive. This article concentrates on hierarchical agglomerative clustering, a statistical procedure where groups are consecutively produced by regularly combining similar clusters together, as dictated by the dissimilarity and linkage measures chosen by a user [9, 28].
Data clustering is naturally connected to the concept of proximity. Proximities express the similarity or dissimilarity between records or objects. The first step an investigator must take is to determine the measurement that will be utilized to calculate the dissimilarity or similarity between objects. A similarity measure is often hard to define, and different similarity criteria can lead to different partitions. Most importantly, the choice of the dissimilarity measure will depend on the distribution of data.
Minkowski distance of exponent
where
Pearson’s correlation coefficient is another usually utilized tool to measure the similarity between two objects [16]. Pearson similarity is defined as
Pearson similarity calculates the correlation between two objects with respect to all attribute values.
The problem that occurs when a cluster includes more than one object is that the ordinary distance can only be measured between a pair of objects and cannot measure three or more objects simultaneously. It comes up with the use of the linkage measure, and the investigator must determine how to do the proper calculation to figure out the connection between two clusters. Once again, the aim is to determine the two clusters that are most proximate to each other to merge them together. The traditional linkages for hierarchical clustering methods are the Single, Complete, Average, Centroid, Median, Ward’s [28] and E-distance methods [32].
The rest of paper is organized as follows. In the next section, we review the related works. Multivariate symmetric stable distributions are explained in Sections 3. Section 4 introduces the covariation similarity measure based on covariation. In Section 5, we evaluate the performance of covariation similarity and compare it to other dissimilarities by the various criteria on both artificial data and real exchange rate datasets. Section 6 clarifies the conclusions drawn from the results.
Related work
So far, several papers have presented methods to cluster normally distributed data that are based on Euclidean distance, Mahalanobis distance, correlation distance, Minkowski distance, etc. [18, 11, 21, 1, 8]. Jia and Darrell [15], in 2011, proposed heavy-tailed distribution for the statistics of a gradient based image descriptors. The authors used distance measure based on the likelihood ratio test based on heavy-tailed distribution. In [30, 33], the authors used model-based clustering in the case of heavy-tailed data. In these works, the mixture of a symmetric stable distribution model is presented and compared to the mixture of Gaussians model. This proposed methodology has proven to be more robust to outliers than the mixture of Gaussians. Amorim and Mirkin [2] proposed a way to overcome the lack of defense against noisy features, using feature weights in the K-Means based on Minkowski distance. Furthermore, Aggarwal et al. [1] show that the fractional Minkowski distance is more robust to the presence of noise in the data. Fractional Minkowski dissimilarity has been always more preferable than the Minkowski distance when the noise affecting the high dimensional data is strongly far from normal [1, 8]. Many practical applications require an asymmetric dissimilarity measure. Asymmetric dissimilarity is widely used in binary data and improves the efficiency of clustering algorithms [5, 10]. Guerra et al. [13] compared some of the best-known criteria are used to cluster data with outliers or noise.
Stable distributions
Stable distributions are a class of probability models having interesting theoretical and practical properties. Their applications to many models derive from the fact that they extend the normal distribution and provide heavy tails and skewness, which are many times experienced in biological, financial, physical and big data. There is powerful experimental evidence for Stable distributions united with the Generalized Central Limit Theorem is applied to validate the use of stable probability models. Examples of application in stable models are given in [22, 4, 27]. Such data sets are not well characterized by a normal model, but some can be well characterized by a stable model.
(Symmetric
Stable, S
S [31]).
A
where
The parameter
([31]).
Let
The covariance is a particular case of the covariation. If
Similarity measure based on covariation
We describe the estimation of a covariation coefficient as a generalization of the Pearson’s correlation coefficient for S
Covariation similarity
We introduce covariation coefficient [22] as a tool to measure the similarity between two objects. Covariation similarity between
for
where
There are three groups of dissimilarity measures: Metric, semi-metric and non-metric. When they are metric, they are more correctly called distance measures. Distance measures satisfy all axioms (non-negative, the identity of indiscernibles, symmetry and triangle inequality) of a metric. Covariation dissimilarity does not satisfy all axioms of a metric exception of non-negative axiom. Thus, covariation dissimilarity is non-metric. Proving that covariation dissimilarity does not satisfy the triangle inequality, a counterexample is given by the following choice
Sometimes the non-metrics are better than the metrics. For example, it was shown fractional Minkowski dissimilarity (Minkowski with an exponent less than one) could significantly improve the effectiveness of clustering algorithms.
Experimental section
In this section, we compare the covariation similarity measure with the traditional distances in the hierarchical clustering. A lot of algorithms have been proposed for different applications and different data. To compare the results of different clustering algorithms, it is necessary to produce some validity criteria. In general, there are two fundamental criteria to investigate the cluster validity: external criteria, internal criteria. In an external criteria approach, we evaluate the results of a clustering algorithm based on a predefined structure which is imposed on a dataset and reflects the intuitive structure of the dataset. The goal of internal criteria is to evaluate the clustering structure produced by an algorithm using only quantities and features inherited from the dataset. Therefore, the misclassification and internal indices are considered as validation criteria to compare clustering performances. See [13, 9] for more information about these criteria. The proportion of misclassified objects is defined as
where
Computing misclassifications in the Table 1
Parameters of stable distribution:
Generate a dataset using the stable distribution [20]
Run the hierarchical clustering algorithm
Compute the misclassification using (1)
Repeat 2000 times steps 2 to 8
Average of misclassifications
Percentage of misclassification of hierarchical clustering with various dissimilarity and linkage measures. The best value for each column is bold
Data are simulated from a mixture of bivariate S
Real data experiments
We use daily time series of FX data for a set of 45 major currencies in the FX market from March 28, 2014, to January 2, 2015, on three continents: Europe, Asia and America and respectively three base currencies: Euro, Chinese Yuan Renminbi and U.S. Dollar. The empirical data consist of the daily FX rates collected from the website of the Pacific Exchange Rate Service (http://fx.sauder.ubc.ca/data.html). These data cause some ideas, including the interaction of international currencies, clustering of currency nodes and the model of price influences. Given the price time series of a currency exchange rate, we consider their returns series to analyze its behavior. The return of an exchange rate with price
The intuition behind using exchange rate data set is based on the following reasons:
The authors of [24] have shown that distribution of exchange rate is stable and because of infinite variance property of stable distributions, Pearson similarity is not applicable theoretically. Covariation similarity is defined for the stable distribution. In addition, in the case of Pearson’s correlation coefficient, an approximately Gaussian distribution is considered for the attributes and may not be robust for attributes that are not Gaussian distributed. Usually, the Pearson similarity is used for clustering of the exchange rate [6, 35, 17, 19] and in the same manner covariation similarity considers two objects to be similar if their attributes are highly dependent, even though the observed values may be far apart in terms of Minkowski distance. Because of this, we did not use Minkowski distance. We use hierarchical clustering based on covariation similarity to study nonlinear and linear relationship in the foreign exchange market, but Pearson similarity is just used for discovering the linear relationship between attributes.
The covariation dissimilarity or Pearson distance represents how closely stocks move together based on their dependence or correlation. This paper suggests an improvement to the method for clustering exchange rates by a new similarity measure based on covariation coefficient that is a more appropriate choice in theory and simulation results for stable data.
Internal index graphic for determining the best number of clusters and dissimilarity measure in the exchange rate dataset.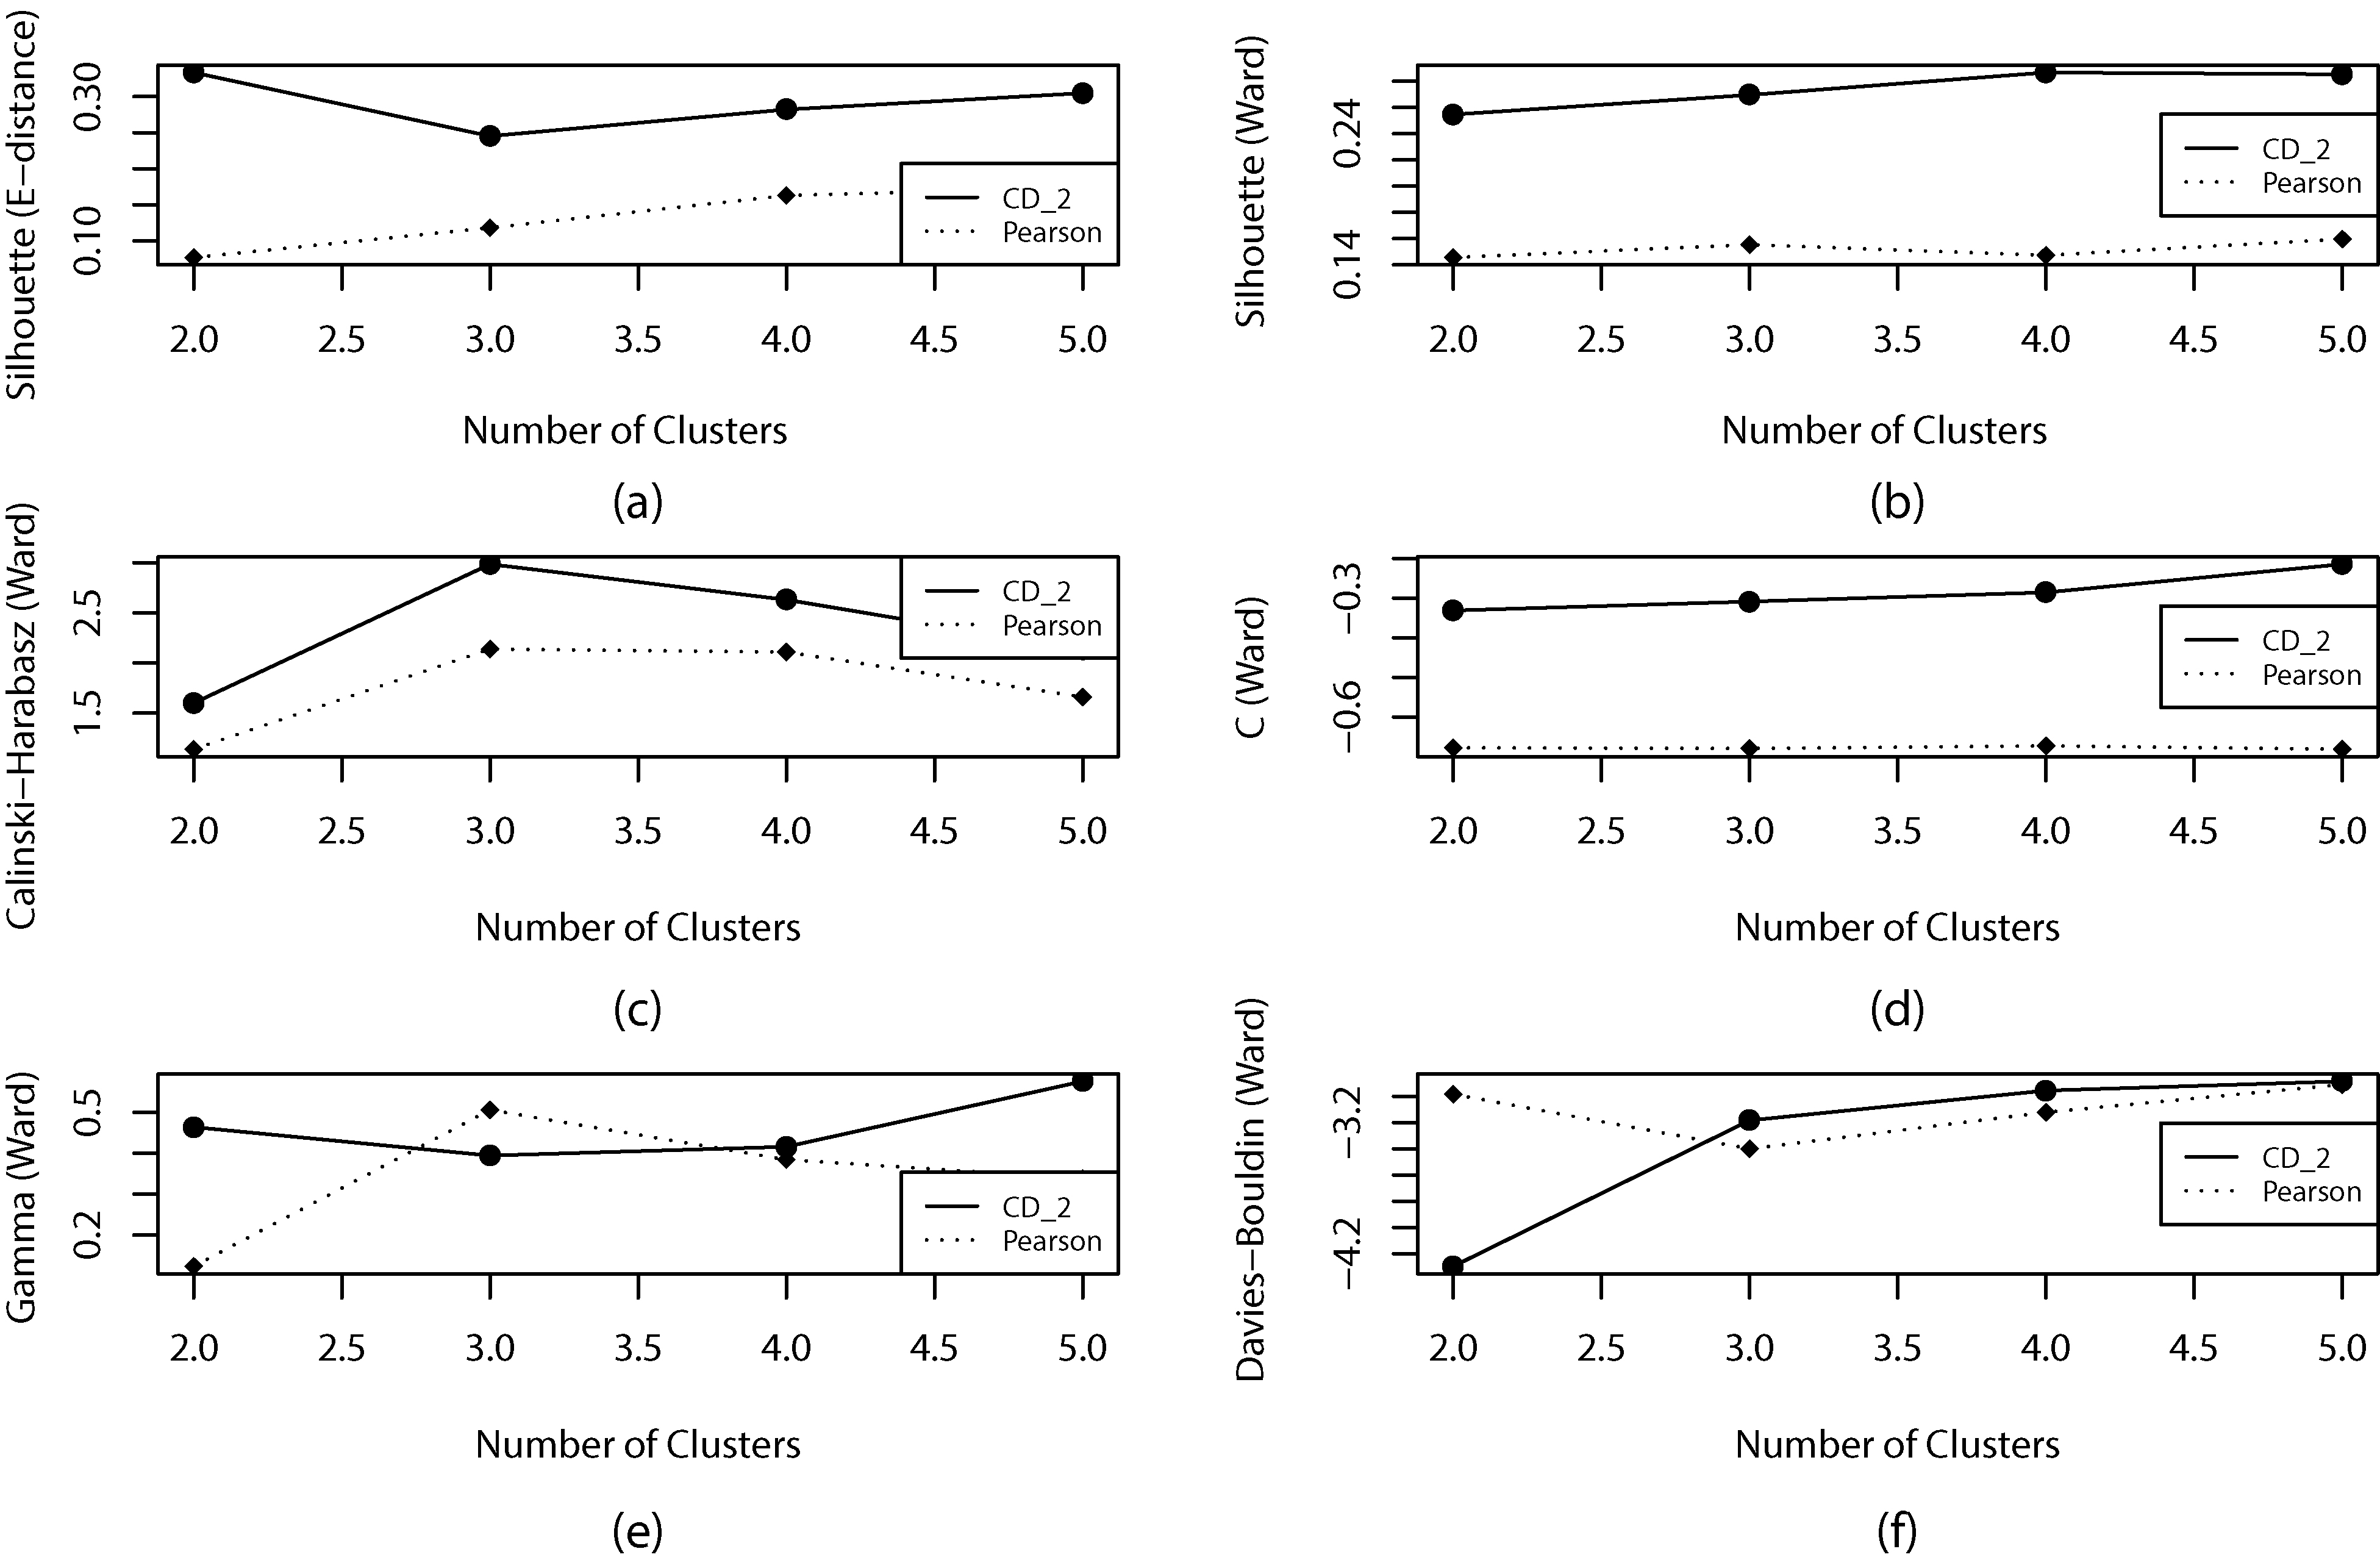
Figure 1 shows the efficiency of covariation dissimilarity using the internal indices and compare it to Pearson dissimilarity on exchange rate dataset. Approximately, stable data are similar to data with outliers and noise. The outliers objects that do not belong to any predefined cluster and random noisy dimensions features that do not contribute to separate the clusters. Therefore, we used five internal indices, including Silhouette, Calinski-Harabasz, C, Gamma and Davies-Bouldin indices similar to [13]. For simplicity, we multiply the Davies-Bouldin and C indices in negative. Therefore, the best number of cluster and dissimilarity measure is the one corresponding to the greatest value of the index similar to Silhouette, Calinski-Harabasz and Gamma indices. According to Fig. 1, the hierarchical clustering method with covariation dissimilarity gives the best results on exchange rate dataset. Moreover, the covariation dissimilarity measure outperformed the Pearson similarity. Based on Calinski-Harabas, silhouette (with Ward and E-distance linkage) and C indices, the covariation similarity measure is always better than Pearson in all numbers of clusters (Fig. 1a–d). However, regardless just one point, the covariation dissimilarity measure is better than Pearson dissimilarity in both Gamma and Davies-Bouldin indices (Fig. 1e and f).
Percentage of misclassification of hierarchical clustering of exchange rate dataset with various dissimilarity and linkage measures
Percentage of misclassification of hierarchical clustering of exchange rate dataset with various dissimilarity and linkage measures
Based on results of [17, 35], returns of exchange rate dataset were classified into three clusters based on geographical location (continent) and three base currencies. In Table 2, we evaluate the performance of covariation dissimilarity by using the misclassification and compare it to Pearson dissimilarity measure on exchange rate dataset.
According to Table 2, the hierarchical clustering method with covariation dissimilarity gives the best results in exchange rate dataset. According to his results, E-distance and Ward’s linkages performed significantly better than the other clustering procedures. The misclassification of covariation dissimilarity is approximately between 38 to 49 percent less than Pearson. Due to the high variance of exchange rate dataset, we could not compute the inverse covariance matrix and Mahalanobis distance (NA).
Conclusion
In this article, we have introduced a similarity measure based on the covariation coefficient in heavy-tailed data. The promising outcomes of the covariation similarity measure have come up with the improvement of hierarchical clustering problems in heavy-tailed data. The covariation similarity is evaluated on both artificial data and real dataset and compared with other distances. Covariation similarity measure and E-distance linkage outperformed the other methods for all values of
Footnotes
Acknowledgments
The authors would like to thank anonymous referees for their helpful comments and for careful reading that greatly improved the article.