
Abstract
Forecasting cash management, security, ease of use, and so on are important in the use of Automated Teller Machine (ATM). For this purpose, in this paper, we have discussed issues such as forecasting cash demand, fraud detection, ATM failure, user interface, replenishment strategy, ATM location, customer behavior, etc. Artificial Intelligence (AI) techniques are discussed for the detection of fraud, failure, replenishment and crash prediction. A number of statistical methods used to evaluate these forecasts are also covered in this paper. Moreover, we review AI techniques such as neural networks, regressions, support vector machines and their results in the form graphs in different sections. The literature covered in this paper is related to the past ten years (2006–2016). The approaches studied in this paper are compared in terms of data sets and prediction performance, accuracy and so on. We also provide a list of data sets available for the scientific community to conduct research in this field. Finally, open issues and future works in each of these items are presented.
Keywords
Introduction
Automatic Teller Machines (ATM) are computerized telecommunication devices providing for financial transactions in a public space without the need for a human clerk. According to estimates of ATMIA (ATM Industry Association), there were a total of 1600000 ATMs worldwide in 2007 [1]. ATMs are devices financed and managed by financial institutions providing a simple method for conducting financial transactions in a public space for customers with almost no human intervention [2].
ATM management prediction is just one issue in this respect. Predicting cash management, fraud detection, customer behavior among other issues enable organizations to present better and efficient planning and service to their customers, especially because of competition between financial institutions to accept investments and present more cost-effective services.
In Section 2, we will discuss business categories and classify the whole papers into 7 groups: forecasting cash demand, fraud detection, ATM failure, user interface, replenishment strategy, ATM location, and customer behavior. We will talk about data sets in Section 3, introduce a few data sets, and then investigate data sets specifications and features.
Classification of papers based on published year.
Diagram of investigated papers based on year.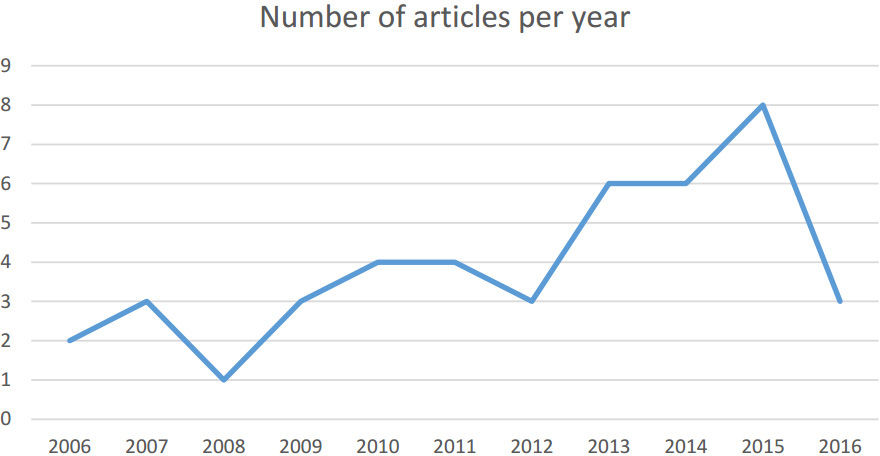
In Fig. 1, a timeline of researches in the literature is shown. Growing interest in this domain is obvious in recent years. Considering the application of AI (Artificial Intelligence) concepts in learning and knowledge extraction, the literature covered in this paper belongs to the past ten years (2006 to 2016). Moreover, Fig. 2 shows a diagram of research in recent years.
Section 4.1 introduces AI techniques applied on ATM management prediction and in Section 4.2, the literature is categorized according to techniques. We will analyze these researches in different aspects and try to provide a comprehensive overview of the literature on this subject, which can be helpful for researchers interested in this field.
Evaluation results of the studied papers are illustrated in Section 5. We have compared the AI techniques in terms of accuracy, performance, and security in ATM management. Both qualitative and quantitative results are mentioned. This section provides several valuable diagrams and tables projecting the essence of our work. In Section 6, we will pay attention to open problems and issues in this context. Finally, we will comprehensively discuss the researches and their results in Section 7. This information is collected in one table and can thus be easily compared.
For better survey, ATM management can be broadly classified into seven branches, which is discussed in the following.
ATM failure: ATMs are widely used as self-service machines by banks to serve their customers. Due to the prevalent use of ATM machines, ad-hoc ATM failures still occur despite preventive maintenance, which will cause disruptions and inconvenience to bank customers, especially for cash withdrawal transactions and can affect the reputation of bank [3].
ATM location: We analyze the papers that present models for selection of ATM locations, and discuss how to find the best place to install a new machine with recognition of the already installed machines. We assume the same points for all ATMs in terms of type, price, cost of installation, and so on. However, the utility ratio of ATMs varies given the different population, traffic and commercial environment in different locations, which decide the return on investment of each ATM [4].
Customer behavior: Financial institutions, especially banks, used to be maintained on manual entry registers and ledgers, and the customers were served through cheques and pay orders. The number of transactions used to be limited with no or few international transactions. In the past few decades, this sector has witnessed widespread application of technologies in day-to-day functions as well as interaction with clients, including the introduction of ATMs. Through ATMs outlets, the banks are able to provide a host of banking facilities and services which otherwise would not be available for customers after usual working hours of banks. The developments in technologies such as ATMs have caused difficulties for service providers (including banks) to meet the demands and expectations of their customers, which are required to focus more on perception of customers with respect to their willingness to adopt the technology. It has been established through research that customer’s response to a specific technology depends upon the quality of the offered service [5].
Forecasting cash demand: The aim of cash demand forecasting research is to find the optimal cash amount required in a specific ATM during a day or week. Several factors can affect this forecast such as economic crisis, special days, climate, holidays, festivals, natural disasters, and location of the ATMs. If the forecasting results are below the demand level, cash-outs will happen that can cause dissatisfaction of the customers [6]. For efficient cash management in ATM network, the models for cash demand for every ATM must first be created using historical data about cash-in and cash-out transactions. Cash demand for a particular ATM is affected with factors such as paydays, holidays, and seasonal demand in a specific area [7].
Fraud detection: This is a key concern for both financial institutes and bank customers as well as ATM suppliers. ATMs are subject to various types of attacks and fraud. Common types of ATM fraud include skimming, card or cash trapping, installation of malicious software as well as various physical attacks. The automated detection of ATM fraud is a relevant research topic to prevent loss or damage [23].
Peak time: Payment cards allowing for transactions in ATMs have become an indispensable tool in everyday life. Nevertheless, this phenomenon is far from being well understood, probably reflecting its minor importance in the past before the sharp increase in ATM usage in early 1980s (1). Research on payment systems has attracted growing academic attention over the last 15 years, merging monetary economics and banking theory with the study of exchange mechanisms (2). At the empirical front, information on ATM transactions is far from being completely explored. These databases have typically a large coverage and are timely since they become typically available just a few days after the reference period. However, this information is currently not taken into account by statistical institutions like Central Banks and National Statistics Institutes [9].
Replenishment strategy: ATM cash replenishment studies focus on decisions about time schedules of ATM replenishment and the amount of money to be loaded. The studies include both forecast of cash demands and optimization of replenishment schedules. This optimization should satisfy both cost constraints of the bank and demand constraints from customers. The ATM cash replenishment is an important real-life problem. A challenge in this type of problem is quality forecast since it includes complicated and noisy data. If a forecast model has poor quality in predicting future cash demands in ATMs, the replenishment policy based on the forecasted demands will not be effective. Significance of this study stems from the fact that replenishment below the actual demand leads to customer dissatisfaction, while replenishment higher than the demand leads to high opportunity cost for the bank. Hence, a methodology to optimize the replenishment amount will be apparently useful for the banks [10].
User interface: Nowadays, ATMs provide significant online support to bank customers. A limitation of ATM usage is that customers often have to wait in a queue, especially at ATMs installed in busy locations. In addition, old people tend to delay ATM usage time, possibly frustrating customers in the queue. In these situations, ATMs should “adapt” to the behavior of customers to minimize the usage time [11].
Paper category based on subject.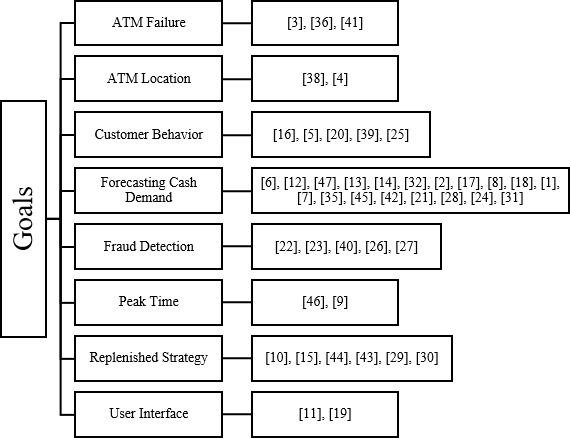
Distribution of papers based on subject.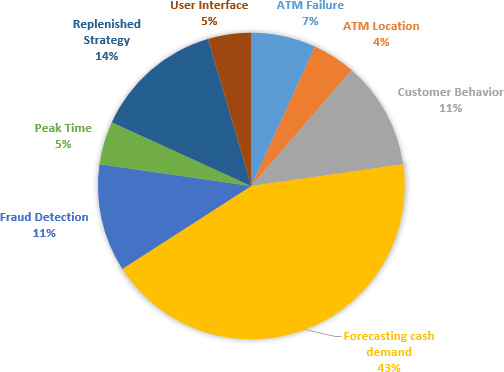
Figure 3 shows the papers according to category and in Fig. 4 we show frequency distribution of papers based on branches.
AI techniques categories used in ATM management.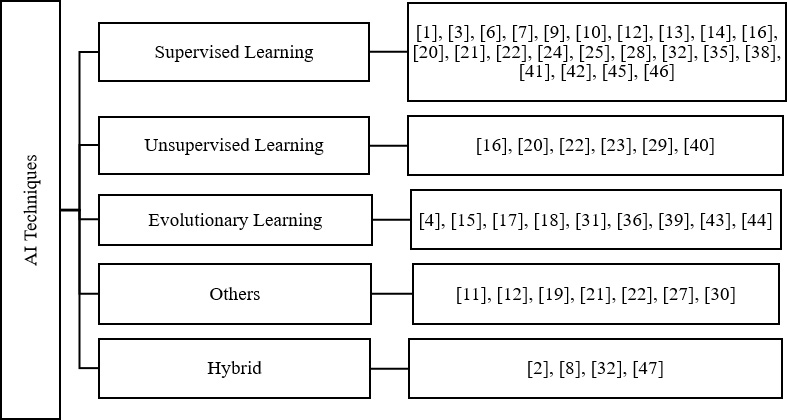
Frequency of AI technique categories used in ATM management.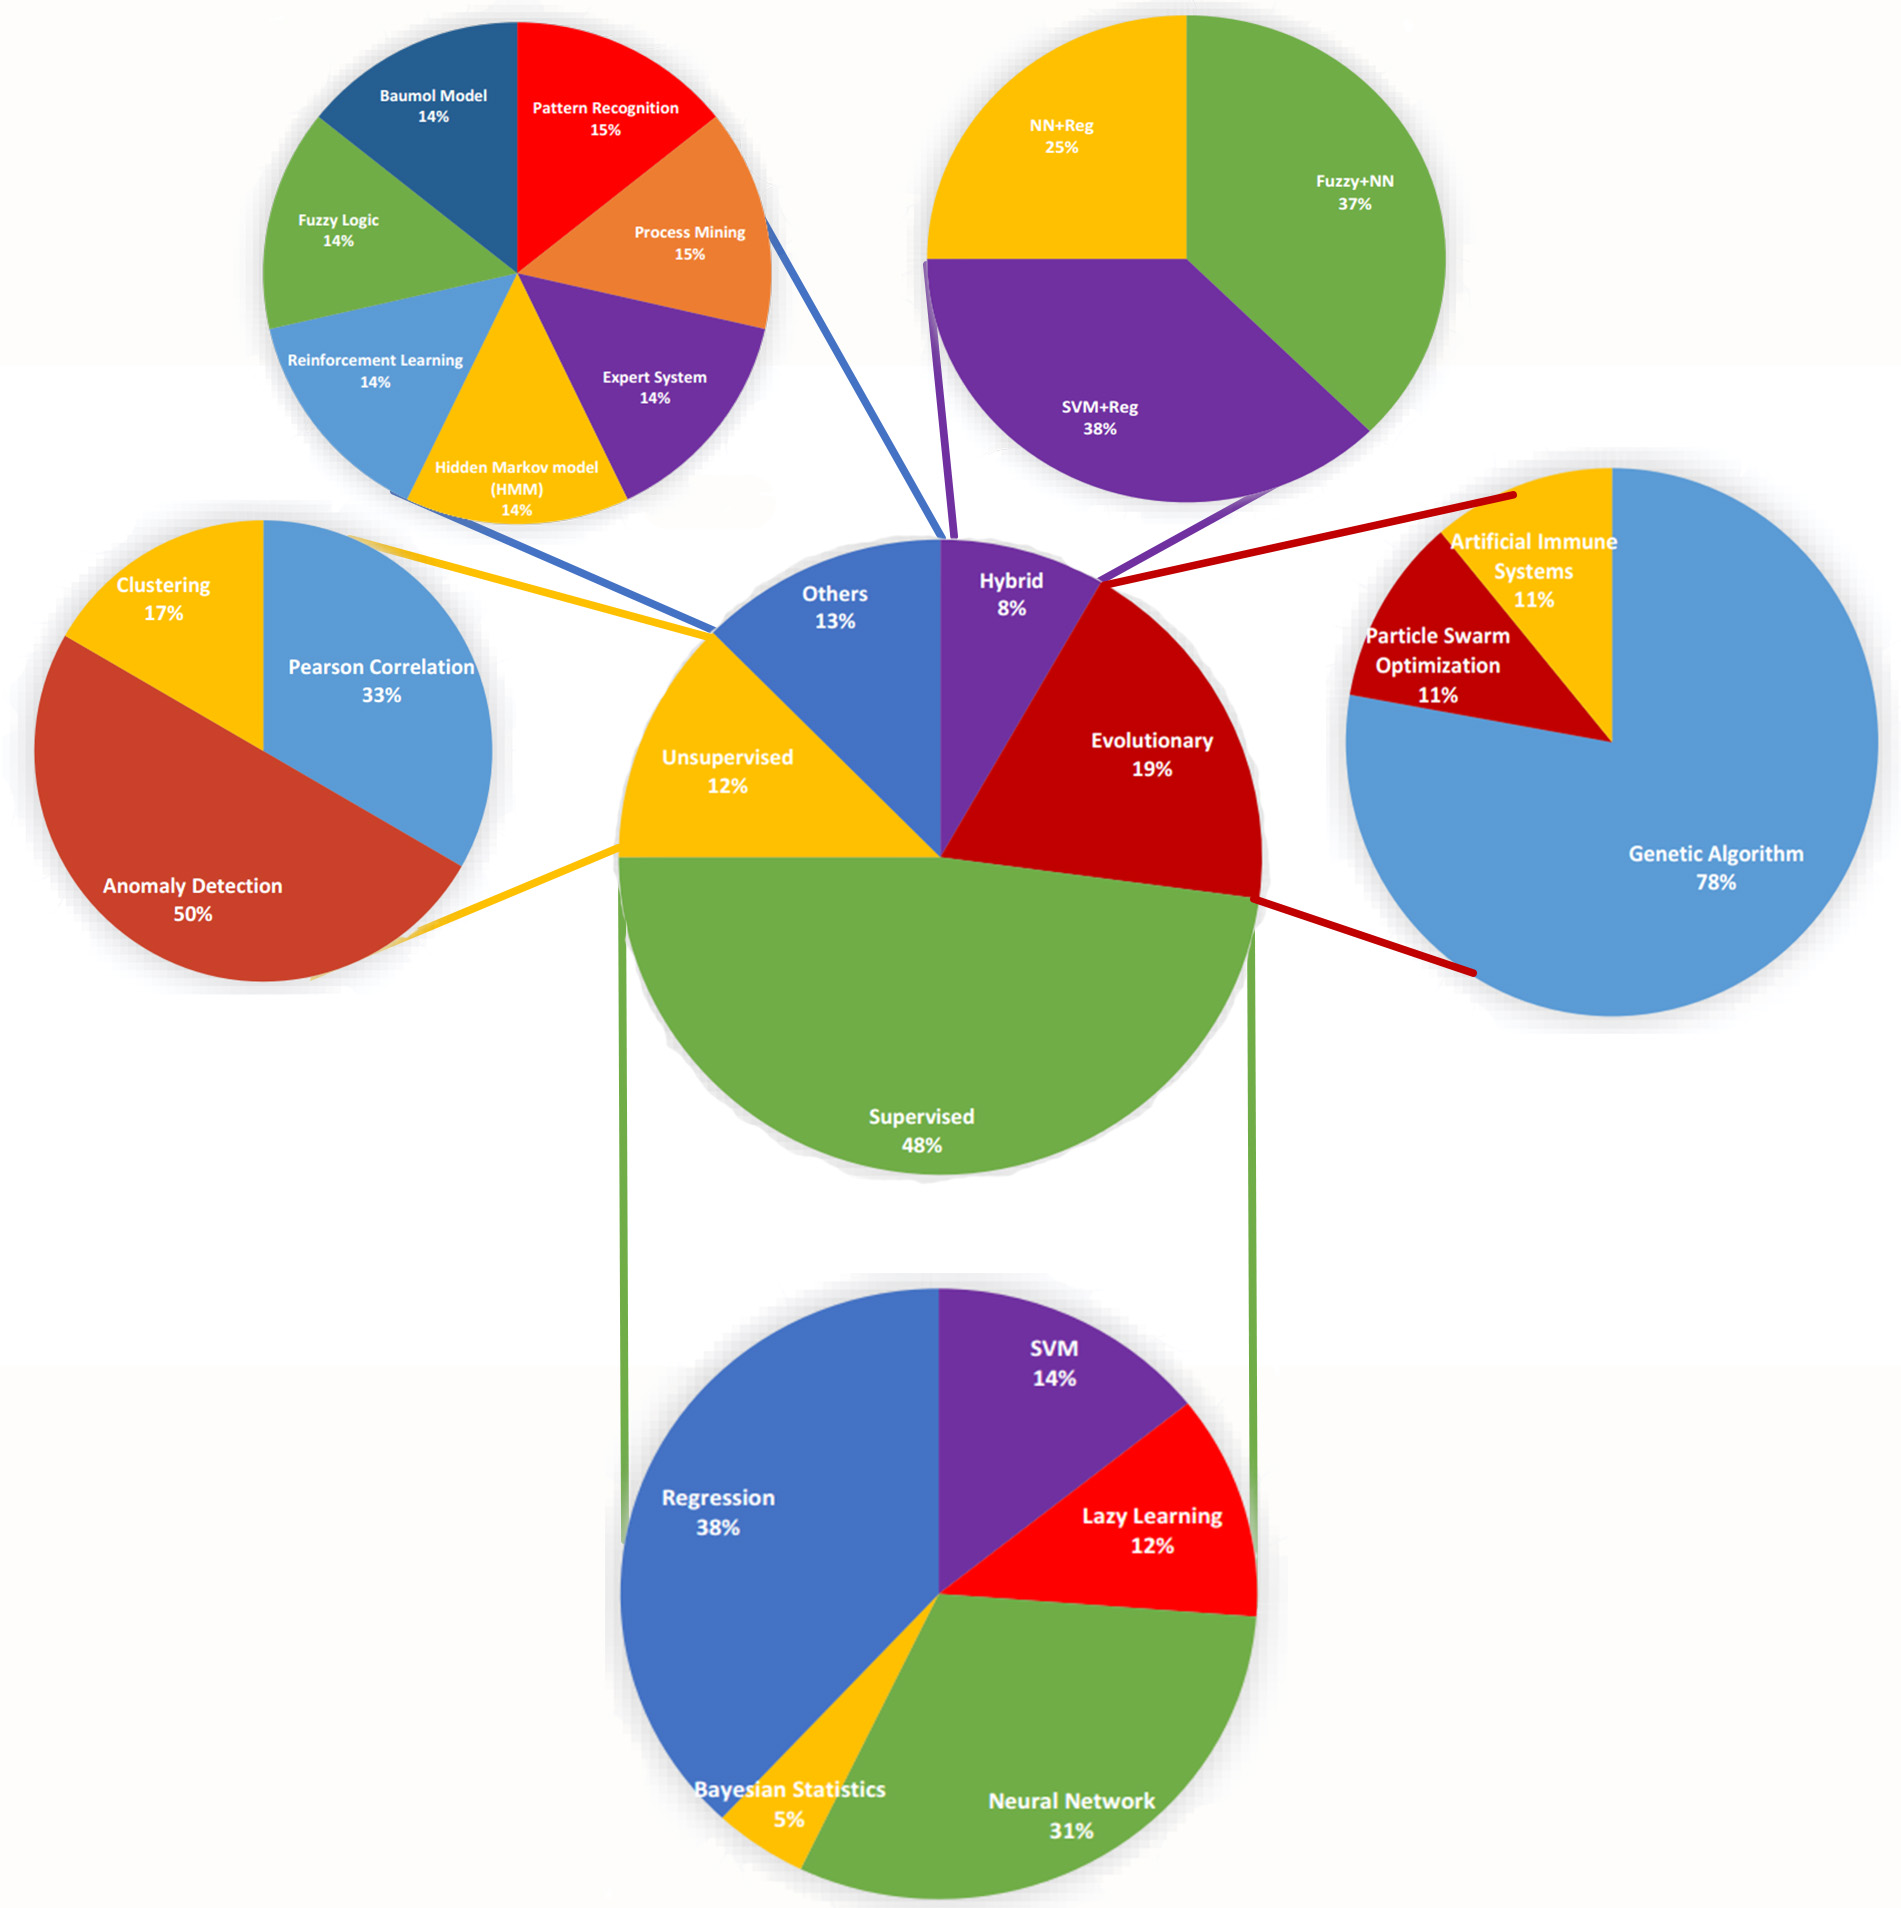
In Fig. 3, it can be seen that most researches address forecasting of cash demand. In ATM, while it would be devastating to run out of cash, it is important to keep cash at the right levels to meet customer demand. In such case, it becomes necessary to develop a forecasting system in order to get a clear picture of demands in advance [8].
The availability of data sets is an important issue in ATM prediction and cash management research. Table 1 shows data sets used in papers. All the researches conducted on this subject used a data set to apply their approaches and achieve their analysis goals. These data are collected in one integrated table; therefore, they can be easily comparable. Accordingly, one can use these data sets for their researches and tests.
Data sets used in researches
Data sets used in researches
Artificial Intelligence concepts
Artificial Intelligence (AI) is making computers modify or adapt their actions (including predictions or control of a robot) so that these actions become more accurate, where accuracy is measured by how well the chosen actions reflect the correct ones. In recent decades, AI has attracted a lot of attention in data science like diagnosis of heart diseases [37], designing software architecture [48, 49, 50], selecting design pattern [33, 34] and so on, and its techniques have been applied on almost every subject to analyze data and get accurate and reliable results based on defined goals.
Depending on the process used to extract knowledge from raw data, AI techniques can be divided into Supervised, Unsupervised, and Evolutionary Learning as shown in Fig. 5. Besides these three main categories, we can define “others” and “hybrid” categories, which complete the coverage of AI techniques used in the literature. Figure 6 shows number of each technique in this paper.
Although there exists a rich literature on different AI techniques used to predict cash management and customer behaviors, there is no comprehensive survey on the existing methods in literature. This paper aims at bridging this gap by encapsulating all the literature related to AI-based techniques for cash demand prediction, ATM failure, ATM location, listing the key data sets/sources and identifying the future trends for cash management based on AI.
Supervised Learning: This category is a type of AI technique in which a training set of examples is provided with correct responses (targets), and the technique generalizes to correctly respond to all possible inputs based on this training set, which is also called learning from exemplars. This category includes several techniques such as Support Vector Machines (SVM), Lazy Learning, Neural Networks, Bayesian Statistics, and so on. Note that each of these techniques has different algorithms. Unsupervised Learning: In this category, there is no supervisor and we only have input data. The aim is to find the regularities in the input. There is a structure to the input space such that certain patterns occur more often than others, and we want to see what generally happens and what does not. In statistics, this is called density estimation. The most popular techniques in this category include clustering, Pearson Correlation and Anomaly Detection, which use different techniques such as Probabilistic Deterministic Finite Automaton (PDFA), Probabilistic Deterministic Timed-Transition Automaton (PDTTA), and so on. Evolutionary Learning: These techniques mimic natural evolution in order to optimize a solution to a problem. These techniques exploit differential fitness advantages in a population of solutions to gradually improve the status of that population. Optimization is the most important goal in evolutionary techniques, and a variety of algorithms have been developed in this category, including Genetic Algorithm (GA), Particle Swarm Optimization (PSO), and Artificial Immune Systems (AIS). Other Techniques: Some researchers used a technique for knowledge extraction that did not follow principles of the categories mentioned above, so we put them in this category. These techniques used various concepts like statistical and dimensionality reduction or numerical optimization, which is a mathematical technique. Hybrid Techniques: Although each of the above-mentioned categories has several techniques that can be used for data mining objectives, many researchers prefer to use a combination of these approaches as a new one or as a solution for different parts of their problem. Therefore, several researches have been grouped in this category, which we name “Hybrid” category.
In this paper, we review AI techniques applied on data sets to generate prediction models of ATM management. To this point in this section, we introduce different AI techniques and works in ATM management prediction.
Supervised learning
Figure 7 shows supervised techniques used for learning in the researches. In the following, the studies applying this category are reviewed individually.
The neural network, often called the multilayer perceptron, is a semi-parametric model inspired by studies on brain and the nervous system. It is an extremely flexible model; in fact, it has been proven to be a universal approximate [13]. Structure of ANN and the data necessary to train the network are important components for success of neural network solution. In [1], the authors used simulated and real data for training and evaluation of ANNs. For every ATM machine, a separate three-layer feed-forward neural network was designed. The neural network was trained using Levenberg-Marquardt optimization method and Root Mean Square (RMS) error between predicted and real value.
Supervised techniques used in ATM management.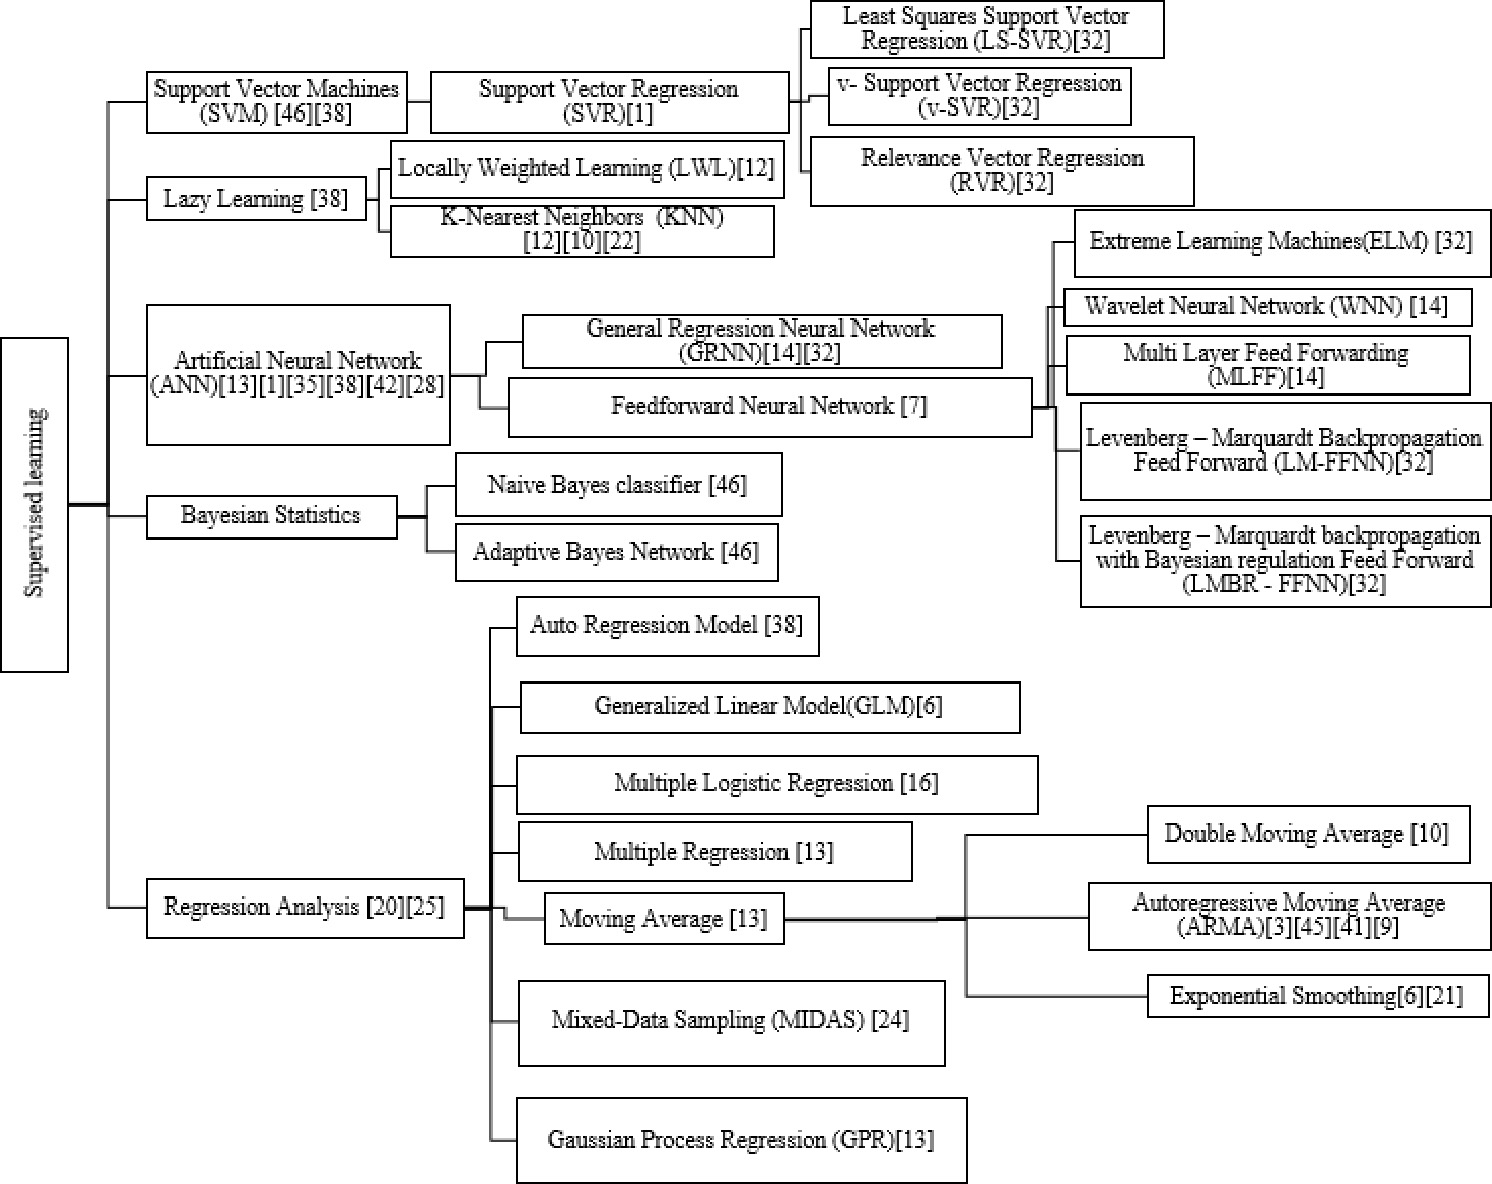
In [35], a cash forecasting system for a bank branch was implemented in MATLAB. The system performs better than other systems based on time series. Its performance was also superior to an available Excel Add-in for forecasting “Alyuda Forecaster XL 2.3”. This system can be scaled for all branches of a bank in an area by incorporating historical data from these branches. Such a system will help the bank in proper and efficient cash management.
Venkatesh et al. [14] compared the results of their work with those of direct neural network based time series analysis of original data without resorting to clustering of ATM centers. In this procedure, they employed three different neural networks, viz. Multi-Layer Feed Forwarding (MLFF), Wavelet Neural Network (WNN), General Regression Neural Network (GRNN) and the traditional Auto Regressive Integrate Moving Averages (ARIMA) separately on the entire sample without resorting to clustering. The procedure employed is as follows:
The NN5 data set used in the experiments consists of a few missing values. The missing values are imputed using mean imputation technique. Then, median-based deseasonalization method was employed to deseasonalize the data. Later, four forecasting techniques of ARIMA, MLFF, WNN and GRNN were applied on the deseasonalized data with a time lag of 7 days.
Cheong et al. [3] used three forecasting methods to forecast the number of ad-hoc failures for March 2014 using data from five months from October 2013 to February 2014, including Stepwise Autoregressive, Exponential Smoothing and Holt-Winters Additive model. These three methods were selected since they are easy to implement and understand and do not require excessive amounts of past data. Moving the average model is not used as it cannot cater to trend component in time series. Holt-Winters Multiplicative model is not used as no multiplicative seasonality effect is observed. ARIMA forecasting technique is not used as it requires excessive amounts of data, which is not available.
In [6], all the experiments were performed on SAS software platform. SAS Enterprise Guide, SAS Forecast Server, and SAS Enterprise Miner tools were used during these experiments. Basic statistical analysis was performed using SAS Enterprise Guide. SAS Forecast Server was used to enable the application of Exponential Smoothing, ARIMA, and Unobserved Component Model (UCM) approaches on their data set. Using SAS Enterprise Miner, missing values were imputed, data partitions were performed, and neural network approaches were used, including Radial Basis Functions, Multilayer Perceptron, and Generalized Linear Model.
Unsupervised techniques used in ATM management.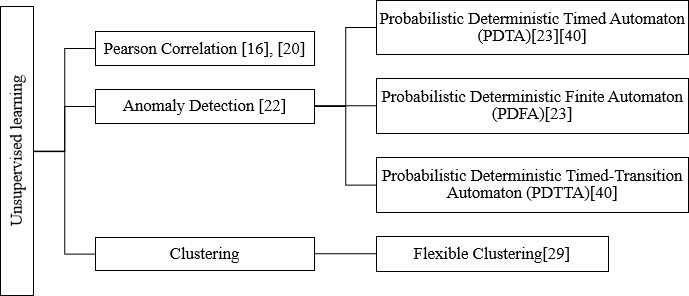
In [41], Zhao et al. introduced time series prediction method based on Auto-Regressive Moving Average (ARMA) model to describe the potential trends in successive history productivity data. [45] presented a two-step model aimed at reducing cash management costs in a bank’s branch. First, data mining was used to forecast daily cash demand, comparing an ARMA-ARCH model with a neural network. Secondly, a linear programming model was solved using the prior result. Optimal allocation of resources (cash collections and supplies) was estimated, indicating that the model can be a helpful tool to support determination of collections and supplies at the bank’s branch. The aim of [24] is to forecast private consumption using high frequency electronically recorded data from ATM and POS terminals. As this type of data is available at a higher frequency than quarterly private consumption, a MIDAS regression approach is considered for both monthly and daily ATM/POS data. [38] provided a general review on studies, efforts and development in ATMs location and cash management problem. Today, ATMs are not only available in bank branches but also at retail locations. Another important factor is cash management in ATMs. A cash demand model for every ATM is needed in order to have an efficient cash management system. This forecasting model is based on historical cash demand data, which is highly related to ATM location. Therefore, the location and the cash management problem should be considered together.
Zylius et al. [32] compared computational intelligence models when performing cash flow forecasting for one day. Adaptive input selection and model parameter identification were used with every forecasting model to perform a more flexible comparison. They applied and compared data based Computational Intelligence (CI) regression models for one day ahead cash demand forecasting.
Naive Bayes, Adaptive Bayesian Network (ABN) and SVM are the algorithms available for classification. Naive Bayes uses cross-validation and test model accuracy on the same data used to build the model rather than building the model on one portion of the data and testing it on different portions. This algorithm is fast and effective for a low volume of data. The volume limit will fall within 200 records, but it is not suitable to handle large volume of data.
In [46], the ABN algorithm supported the large volume of processed data and produced the result in a short period of time.
Unsupervised techniques used in ATM management papers are organized in Fig. 8 and their definitions are presented below.
In [16], the data collected was analyzed using multiple logistic regression analysis and Pearson correlation. The findings revealed that necessary input to the bank management to increase customers’ satisfaction was provided through improvement of ATM service quality. Anderka et al. [22] proposed an approach capable of detecting known as well as unknown attacks on ATMs, which does not require additional security hardware. The idea is to utilize automatic model generation techniques to learn patterns of normal behavior from the status information of standard devices comprised in an ATM, and a significant deviation from the learned behavior is indicator of a fraud attempt. They cast the identification of ATM fraud as a sequence based anomaly detection problem. In [23], Klerx et al. presented an approach to learn a tailored behavior model called Probabilistic Deterministic Timed-Transition Automaton in order to enable the detection of time-based anomalies. They also report on preliminary results of an empirical evaluation using a real-world data set recorded on a public ATM, indicating the practicality of their approach. [40] described an approach for anomaly and attack detection for ATMs. The approach works on multiple levels. First, Priesterjahn et al. used sensor fusion on low-level hardware sensors to get robust information about the device state. Second, they used a new model-based and self-learning anomaly detection method on diagnosis data of all ATM devices to robustly detect anomalies in the system, which might indicate an attack on the machine. Priesterjahn et al. [40] formulated the problem as a mixed-integer linear programming model and proposed an exact branch-and-cut algorithm for its resolution. Given the complexity of the problem, they also proposed a flexible clustering heuristic. All variables of the formulation were explicitly handled by the algorithm, but they could not generate all sub tour elimination constraints a priori, which would be dynamically generated as cuts since they are found to be violated.
Evolutionary learning
Figure 9 shows evolutionary techniques used for learning in the researches. In the following, the studies applying this category are reviewed individually.
Evolutionary techniques used in ATM management.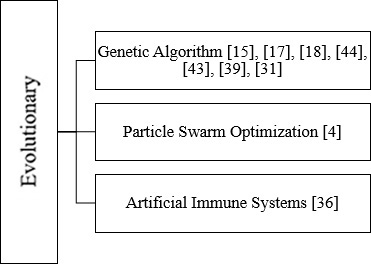
Recently, some authors attempted to optimize the cash by modeling and forecasting the demand. However, high variance and non-stationarity of the underlying stochastic process can affect the reliability of such an approach. In [18], Armenise et al. suggested the application of genetic algorithms to search and generate optimal upload strategies, which are at the same time able to minimize the daily amount of stocked money and to assure cash dispensing service. Also, in [43], this rich vehicle routing problem was solved using genetic algorithm. The periodic vehicle routing problem can be regarded as a problem of generating a group of routes for each day of a planning horizon so that the involved constraints are satisfied and global costs are minimized. The proposed model further enables to specify cases with requirements of two replenishments of some of the customers (ATMs) per day, while other customers may need only one replenishing in two days. Chamnan and Chongstitvatana [31] investigated the optimization of ATM cash inventory by means of genetic algorithm in order to produce optimal upload strategies capable of minimizing the daily amount of stocked money, still assuring cash dispensing service.
Site selection and layout of ATMs are important components of operation and management systems of banks. Different addresses usually lead to different returns. It is difficult for us to decide which place is the best one. In [4], Li et al. investigated the factors of ATMs planning and location model to make a judgment and forecast by application of the model in which they combined Geographic Information System (GIS) technology with the mathematical model. [36] presented an immune-inspired Adaptable Error Detection (AED) framework for ATMs. This framework has two levels: one is local to a single ATM while the other is networkwide. The framework employed vaccination and adaptability analogies of the immune system.
Hybrid techniques used in ATM management.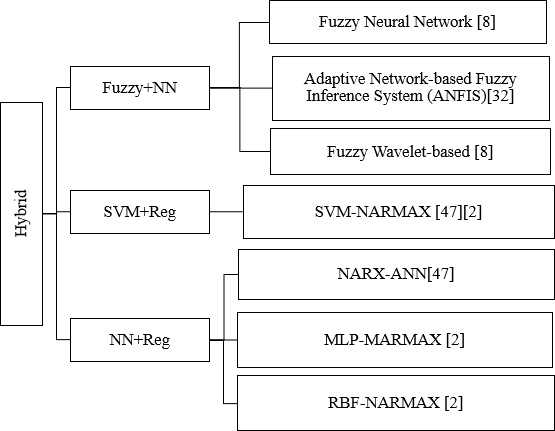
As mentioned earlier, some researchers used a combination of different categories. The main goal of these researches is to take advantage of the strengths of each technique alongside other techniques to improve the performance and efficiency of proposed approaches and find the best results. In the following, we will review these researches that are separated by the combined categories presented in Fig. 10.
The process of cash demand in ATM is highly affected by holidays as well as seasonal and calendar ceremonies. These effects can be incorporated into classical neural network models that could be used for cash demand forecasting. However, cash demand varies with time. In [32], we see that a much more flexible approach is needed to incorporate neural networks for cash demand in ATM. The advantage of popular SVMs over neural networks applied for regression was experimentally denied when cash demand forecasting was performed with training data with a long history. However, Support Vector Regression (SVR) may be more effective for data with a shorter history. An interval type-2 fuzzy neural network (IT2FNN) applied for cash demand forecasting is another approach that adapts to dynamic nature of ATM cash flow and (as author claims) is better than other systems based on time series.
In [2], Ramírez and Acuña forecasted the daily ATM cash demand using dynamic models of type Nonlinear Autoregressive Exogenous inputs (NARX) and Nonlinear Autoregressive Moving Average with Exogenous Inputs (NARMAX) performed by Neural Networks (NN) and Least Square Support Vector Machine (LS-SVM) to predict One-Step (OSA) or Multi-Step (MPO). The aim is to determine which model produces better results. In [47], we see a comparative study between NARMAX and NARX models developed with ANN and SVM when they are used to forecast cash demand for ATMs. A simple methodology was proposed for developing SVM-NARMAX models. The best results were obtained with NARX-ANN models. In addition, no significant differences were found between NARX and NARMAX for both ANN and SVM. Hence, it seems advisable to choose easier models such as NARX and a user-friendly tool like ANN at least for this particular application.
Others techniques used in ATM management.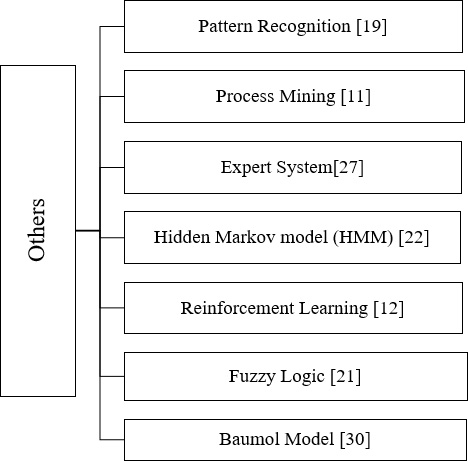
Besides the techniques mentioned above, we have found some research efforts suggesting alternative techniques, which we categorized as “Others” shown in Fig. 11. In the following, we will consider them.
Omari and Omariba [19] used pattern recognition. A biometric system is essentially a pattern recognition system that operates by acquiring biometric data from an individual, extracting a feature set from the acquired data and comparing this feature set against the template set in the database. A limitation of ATM usage is that customers often have to wait in a queue, especially at ATMs installed at busy locations. In addition, old people tend to delay ATM usage time, possibly frustrating customers in the queue. In these situations, ATMs should “adapt” to the behavior of customers to minimize the usage time. To this end, Mahmood and Shaikh [11] applied data mining techniques to an ATM transaction data set obtained from an international bank based in Kuwait. They pre-processed this data set, and converted it into a specific XML format to mine it through the ProM (Process Mining) tool. [27] attempted to describe the application of AI techniques on the investigation of ATM fraud in Nigeria. An Expert System (ES) was proposed, which provided and supported the storage and intelligent interactive processing of the knowledge acquired as well as experience of the human expert in the domain of criminal investigation, law and justice. In order to demonstrate the practical applicability of Anderka et al. [22] approach, they implemented three specific sequence-based anomaly detection methods, each of which was based on one of the basic principles. The three methods are threshold-based sequence time delay embedding (t-stide), K-nearest neighbor approach (k-NN), and Hidden Markov model (HMM). In [12], Teddy and Ng proposed a novel local learning model of the pseudo self-evolving cerebellar model articulation controller (PSECMAC) associative memory network to produce accurate forecasts of ATM cash demands. As a computational model of the human cerebellum, our model can incorporate local learning to effectively model the complex dynamics of heteroskedastic time series. [21] focused on fuzzy time-series and grey theory models. Both were designed to handle forecasts when few past observations were available. The performance of the two AI techniques was compared to that of two simple methods of double moving average and double exponential smoothing. Instead, Agoston et al. [30] concentrated on a further possibility of cost reduction: optimizing the cash management problem as one single problem. Doing so, contractual prices between banks and the cash in transit firms can be generally modified, allowing for further cost reduction relative to individual optimizations. In order to show the pertinence of this procedure, they have determined possible Pareto-improvement re-contracting schemes based on a Baumol-type cash demand forecast for a Hungarian commercial bank, resulting in substantial cost reduction.
There are several criteria to evaluate AI techniques. Some of these criteria are specific to a special technique, while others are used in general. Below, we give definitions of some criteria used in studies, and will then discuss the results obtained for two of them. At first, we should define TP, TN, FP, and FN and will then define criteria based on them.
True Positives (TP): Denotes the number of positive instances correctly classified.
True Negatives (TN): Denotes the number of negative instances correctly classified.
False Positives (FP): Denotes the number of positive instances incorrectly classified.
False Negatives (FN): Denotes the number of negative instances incorrectly classified.
MAPE: It expresses accuracy as a percentage and is calculated by the following formula where
The difference between
SMAPE: All models are selected based on their accuracy on the test set. Some researchers used the Symmetric Mean Absolute Percentage Error (SMAPE) as their error measure as it is the main measure considered in competition. In order to evaluate the performance of different models, some researchers applied SMAPE parameter, which is a variation of MAPE. SMAPE formula is defined in Eq. (2). Where
Sensitivity (Recall): The proportion of cases correctly classified as positive among all the observed positives, which is defined in Eq. (3).
Precision: It refers to the number of correctly classified instances for each of the specific predicted classes, which is defined in Eq. (4).
Probability: Measures the likelihood that an event will occur.
Reliability: In statistics and psychometrics, it is the overall consistency of a measure.
IA: The index of agreement (IA) developed as a standardized measure of the degree of model prediction error, which varies between 0 and 1. A value of 1 indicates a perfect match, and 0 indicates no agreement at all. It is a dimensionless statistic and its value should be assessed based on (a) the studied phenomenon, (b) measurement accuracy and (c) the model employed. IA becomes intuitively meaningful after repeated use in a variety of problems [47].
With
Chromosome (EC & CC): A chromosome represents a possible set of rule specifications. Each specification is a point in
where
where
noting an integer division by the symbol. Similarly, if we assume
Akaike information criterion (AIC): It is computed as Eq. (11).
Where
Security: It is the degree of resistance to, or protection from, harm. It applies to any vulnerable and valuable asset, such as a person, dwelling, community, item, nation, or organization.
Accessibility: It refers to the design of products, devices, services, or environments for people who experience disabilities.
Evaluation criteria chart.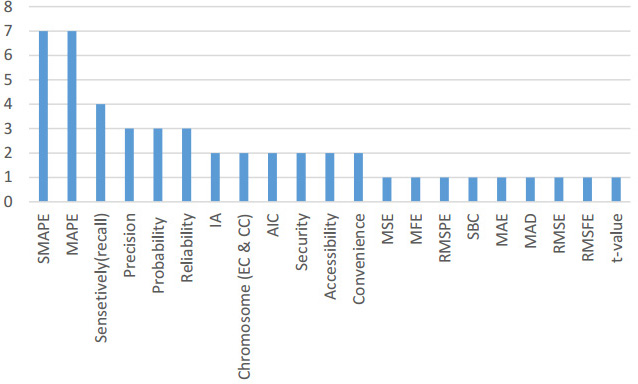
Convenient: Procedures, products and services intended to increase ease in accessibility, save resources (such as time, effort and energy) and decrease frustration.
RMSE: It is an estimate of standard deviation from the random component in data and defined by the following equation:
Where MSE is the Mean Square Error or Residual Mean Square:
SSE is also called the summed square of residuals and is usually labelled as SSE.
Mean Forecast Error (MFE): For
Ideal value
RMSPE: Root Mean Square Percentage Error is calculated according to Eq. (15):
and the median percentage error of the quadratic.
SBC: Schwartz Bayesian criterion is computed by the following equation.
Where
MAE: Mean Absolute Error is a quantity used to measure how close forecasts or predictions are to theeventual outcomes. The mean absolute error is given by Eq. (17).
Where
Mean Absolute Deviation (MAD): For
Best results of MAPE prediction.
Best results of SMAPE prediction.
While MAD indicates the absolute size of the errors.
RMSFE: The Root Mean Squared Forecast Error is the square root of the MS forecast error computed as Eq. (19):
t-Value: It is a test statistic for t-tests that measures the difference between an observed sample statistic and its hypothesized population parameter in units of standard error. Figure 12 shows frequency chart of evaluation criteria. Below, we present a definition of two of the most important criteria, including MAPE and SMAPE that were used in the studies, and will then discuss their obtained results.
The below charts in Figs 13 and 14 indicate the values reported for two criteria (MAPE and SMAPE) and indicate which technique outperformed the others based on the reported evaluation results.
The best result of MAPE (20.6%) is achieved by ANN model [1]. Using flexible ANN models, MAPE varied between 15–28% and for SVR models between 17–40% [1]. Choosing different ANN settings can obviously change the performance of ANN, but in [28], decomposition of all ANN models shows the best result (37.79%).
The best result of the study, an average SMAPE value of 18.44%, is yielded by GRNN. The initial phase of clustering similar ATM centers reduces the computational task in forecasting phase, thereby improving cash demand predictions. Furthermore, clustering followed by prediction yielded much smaller SMAPE values than the traditional approach of direct prediction on the entire sample without clustering.
From a managerial perspective, identifying ATM clusters with similar daily cash demand trends helps the bank’s top management to design similar cash replenishment plans for all ATM centers falling under the same cluster. These segment-level replenishment plans could result in saving huge operational costs for ATM centers active in a similar geographical region. For a financial-services institution having ATM centers operating in different geographical regions, such huge cost savings could also be realized if the ATM segment-level cash replenishment plan is applied within operationally meaningful regions. This means that ATM clusters with similar day-of-the week cash demand patterns are defined within each operationally meaningful region [41].
The results show that the MLP-NARX model developed here allows for a high degree of quality over 85% for long-term predictions. On the other hand, the NARMAX model shows no significant advantage over NARX; therefore, NARX is better with respect to simplicity considerations [2].
Given that the best results were exhibited by NARX ANN models, which were even more remarkable regarding SMAPE index and considering the simplicity exhibited by ANN in their training of significantly lower computational efforts to find weights than to calibrate parameters of SVM, it seems advisable to choose easier models such as NARX and a user-friendly tool like ANN at least for this particular application [47].
The next one, which is an average SMAPE value of 21.57%, was reached by Exponential Smoothing. Also, we focused on special days in the UK as well as other seasonal factors [6]. With respect to RBF networks, they are also considered as a reliable alternative to tackle these problems, while LS-SVM shows poorer results [2].
ATM failure: We can forecast the number of failures for each problem category and adjust the service time required for each problem type to better plan the service engineer’s deployment [3]. Another area of research is to investigate the possibility of generating variable-length error detectors. Error detectors in the implemented framework were represented as fixed-length sequences of states that were terminated by fatal states [36]. In summary, the whole procedure provides a simplified methodology to analyze the down time of equipment failure, which can be used in the field of failure prediction and thus aid the predictive maintenance in manufacturing plant to reduce the down time cost [41].
ATM location: As mentioned earlier, there are few studies concerning ATM management. The first step is site selection and the second is cash management since these two problems are linked together [38].
Customer behavior: Future research should explore the association between age and attitude to determine its impact on ATM service quality and customers’ satisfaction. The price is an essential aspect that affects the customers’ perception of ATM service quality [16]. Several possible extensions could be conducted in future research, such as the assessment and improvement of existing ATMs as well as improvement of the graphical user interface (GUI) of GA solver to make it more accessible and user-friendly [39].
Forecasting cash demand: Cash management and forecasting is becoming an important feature of ATM networks. Generally, this problem has been studied in terms of stochastic modeling of future cash demand upon which the ATM cash upload can be sized. The majority of limitations come from high unpredictability and non-stationarity of demand [17]. The first results of ATM’s cash demand forecasting procedure showed promising results, but further experimental investigations are necessary for practical implementation of the proposed methods [7]. In the future works, we should plan to investigate the joint forecasting approach more deeply, where cash demand information of few or more ATMs is integrated or aggregated to increase forecasting accuracy. Until now, only one day ahead forecasting is contained, whereas more often multiple step ahead forecasting is needed [32].
Best results for each category
Best results for each category
Fraud detection: As the ATM technology is advancing, fraudsters are on drawing board to see how they come up with different fraud skills to beat the security. Various forms of fraud are perpetuated, ranging from ATM card theft, skimming, pin theft, card reader techniques, PIN pad techniques, force withdrawal and a lot more. Despite these threats, the banks devote little effort that is not proportional to rate of fraudsters work to defraud customers. The technology of ATM keeps developing, and the fraudsters keep improving criminal practices but the banks do not take sufficient control measures to avoid fraud at ATM. The security measures adopted by some banks are obsolete, making the measures less significant and allowing fraud at ATMs [26].
Peak time: Nowadays, ATMs are not subject to further analysis, which will improve the quality of ATM services. Using analysis, one can predict the ATM usage for the next step. The predictive data mining will be really helpful for analysis of the ATM data as well as processing the large set of records by a predictive mining (Weka) tool [46].
Replenishment strategy: In future works, the performance of forecasting might be further enhanced using other methods such as time-series regressions. The objective function for optimal replenishment can be broadened to include the lost opportunity by letting people use ATMs of rival banks in case the other ATMs of the same bank are far away [10].
User interface: Every day, people with disabilities encounter several barriers that prevent them from interaction with electronic devices in their surroundings. When the government agencies or commercial sector do not provide the necessary services or facilities, it may be necessary to enforce the introduction of mandatory regulation or legislation. In the area of accessibility of self-service terminals, the market is not providing terminals for which user organizations are deemed to be responsible in terms of accessibility. However, the introduction of mandatory requirements necessitates a clear set of guidelines that cover all relevant types of terminals and do not limit manufacturers in introduction of new ways to improve accessibility. It is a priority to develop a single common standard for accessibility across different application sectors so that manufacturers and service providers are justified as to what they are expected to provide. The next step would be mandatory legislation of this standard. Therefore, the financial institutions will not be left with an option to procure ATM systems that are inaccessible to the visually impaired people. Finally, it has been observed that the incorporation of biometric features will be essential to ensure that these systems are secure enough [19].
Lack of a survey on ATM management prediction in recent years motivated us to offer the present paper. Our aim was to cover every aspect of this domain. Hence, in the literature, we covered the papers on this field published in the last ten years. We performed three main tasks:
We did a research about data sets. For better survey, we classified ATM management into seven branches. We also observed that forecasting cash demand is the most investigated branch, and 19 papers considered this topic. In this regard, we also mentioned some issues and presented our suggestions. We explored all AI techniques, especially those applied to ATM management prediction. All the studied researches were summarized according to their categories and techniques. Experimental results stated by each research and their own criteria were reported. Ultimately, a list of issues came to our mind, which was listed in open issues section. The greatest problem is the absence of a comparison point. Since each research is different from others in terms of used data set, the number of considered features and applied technique, it is not possible to compare their reported results. We strongly suggest presenting one data set as a benchmark. On the other hand, we figured out that some AI techniques are not used at all or have received low attention.
We show the whole investigation of all papers in Appendix 1 but as regards the overall forecasting conclusion, data for each branch are presented in Table 3.
Footnotes
Appendix 1
Overall forecasting results are presented in Table 3.
Table of papers Forecasting cash demand Improvement of demand forecasting models with special days The best performance was achieved when exponential smoothing was used on the dataset, which included notable special days’ columns. The best performance among neural network methods was observed in GLM approach. However, its performance was not better than exponential smoothing method. Forecasting cash demand Forecasting ATM cash demands using a local learning model of cerebellar associative memory network The proposed PSECMAC-based forecasting model was ranked second best amongst the evaluated techniques and the third one was LWL-based model across 111 cash demand time series of competition. Forecasting cash demand For ANN (MLP), there were no significant differences between NARX and NARMAX models. Concerning SVM, NARMAX slightly improved the results obtained by NARX models at least allowing to obtain a mean IA equal to that obtained by ANN. Nevertheless, only in the case of four ATMs (1, 10, 26, 30) did NARMAX significantly improve the performance of NARX (from IA Forecasting cash demand Forecast combinations of computational intelligence and linear models for the NN5 time series forecasting competition Forecasting cash demand Cash demand forecasting in ATMs by clustering and neural networks The best result of the study, an average SMAPE value of 18.44%, was yielded by GRNN. This result was better than the result of Andrawis[13].
Sub
No. Ref.
Title
AI technique
Quantitative analysis
Conclusion
[6]
SMAPE%
Including special days
Not including special days
Regression (exponential smoothing)
19.21
21.57
Neural network (GLM)
40.64
42.52
[12]
SMAPE%
LWL-based model
28.32%
PSECMAC
27.28%
KNN
26.38%
[47]
Comparing NARX and NARMAX models using ANN and SVM for cash demand forecasting for ATM
ANN
SVM
[13]
SMAPE%
FRAC-BEST%
GPR-ITER
19.90
7.21
GPR-DIR
21.22
3.60
GPR-LEV
20.19
12.61
NN-ITER
21.11
2.70
NN-LEV
19.83
27.93
MULTI-PEGR1
19.11
2.70
MULTI-PEGR2
18.96
9.01
MULTI-PEGR3
18.94
7.21
MOV-AVG
19.55
7.21
Combined
18.95
12.61
[14]
SMAPE%
MLFF
21.10
WNN
20.60
GRNN
18.44
GMDH
20.32
Table 3, continued Forecasting cash demand Investigation of CI forecasting algorithms for short-time cash demand in ATM network The results revealed that on average, v-SVR was the most accurate model with two-year training/validation dataset. Also, the results suggested that using two years of historical daily data yielded the best forecasting results over all models (43.72% for v-SVR, which was the best option). Forecasting cash demand Forecasting cash demand in ATM using neural networks and least square support vector machine The results revealed that the developed MLP-NARX model allowed for predictions with a high degree of quality for long-term predictions. On the other hand, the NARMAX model showed no significant advantage over NARX; therefore, NARX was better, aiming to simplify considerations. Regarding the RBF networks, they were also considered as a reliable alternative to tackle these problems, while LS-SVM showed poorer results. Forecasting cash demand Optimizing ATM cash management by genetic algorithms Forecasting cash demand A methodology to improve cash demand forecasting for ATM network Comparison between the two methods and their error indicated that the employed fuzzy neural network has a smaller divergence as well as better predication than that for time series with a 13% reduction in MFE (mean forecast error). Forecasting cash demand Forecasting cash demand Cash demand forecasting for ATM using neural networks and support vector regression algorithms Despite today’s overenthusiastic beliefs about capabilities of SVR, this investigation showed that slightly better results can be achieved for this application using forecasting method based on flexible ANN. Forecasting cash demand A flexible neural network for ATM cash demand forecasting The prediction results using flexible ANN were significantly better than those resulting from linear models with seasonality coefficients (5–10% prediction errors for simulated data and 25–30% prediction errors for real data). Forecasting cash demand Cash forecasting: An application of artificial neural networks in Finance Neural network forecast results were not free from errors, but were much better than other techniques-particularly time series forecasting.
Sub
No. Ref.
Title
AI technique
Quantitative analysis
Conclusion
[32]
SMAPE% 2 year training
ANFIS
44.12
ELM
44.18
LMBR-FFNN
44.03
LM-FFNN
43.87
GRNN
44.14
LS-SVR
43.85
v-SVR
43.72
RVR
44.98
[2]
SMAPE%
MLP
NARX-OSA NARMAX-OSA
19.80 20.55
RBF
NARX-OSA NARMAX-OSA
25.63 26.03
LS-SVM
NARX-OSA
24.30
[17]
Genetic algorithm
Since genetic algorithms are computationally expensive, scalability was taken into account by a further experimentation, which assessed how performances are affected when the uploading strategy is determined for a single ATM, a group, or the whole network.
[8]
MFE% (mean forecast error)
IT2FNN
6.566
Fuzzy wavelet-based
19.438
[18]
A generative solution for ATM cash management
Genetic algorithm
In contrast to approaches based on predication of future cash demand, this approach is based on conditions, which if met suggest to refill the ATM cash. Experimental results proved that this approach is capable of suggesting reliable strategies and can improve historical cash management.
[1]
MAPE%
ANN
20.6
4.0
SVR
25.1
5.7
[7]
Feed-forward neural network
ANN
[35]
MFE%
Neural network
6.566
Regression
19.438
Table 3, continued Forecasting cash demand Cash management cost reduction using data mining to forecast cash demand and LP to optimize resources Neural network model had a better performance than the ARMA-ARCH model, confirming the prior decision of choosing neural networks as the best forecasting model. Forecasting cash demand Forecasting cash demand Forecasting cash demand An integrative online ATM forecasting and replenishment model with a target fill rate Proposed forecasting method decomposition and neural network Computational results demonstrated that decomposition outperforms an artificial neural network approach, which is considered to be a promising new technique to forecast time-series demand figures in ATM management. Forecasting cash demand Forecasting cash demand Optimal cash management for ATM center by genetic algorithm By applying Genetic Algorithm to forecast the cash demand of ATMs with 37 cabinets in the first quarter of 2014, the bank can reduce the amount of cash reserve by almost 20 percent. It can be concluded that the optimization method of the refilled ATM produces a very good result. The bank can save the “waste” cash because the forecast of the usage is reasonably accurate. ATM location ATM location Automatic ATM fraud detection as a sequence- based anomaly detection problem Independent of the sequence length, the reported F-measure values achieved by k-NN method were relatively low, ranging from 0.07 to 0.21. By contrast, t-stide and HMM achieved quite good F-measure values for certain sequence lengths, i.e. 0.85 for
Sub
No. Ref.
Title
AI technique
Quantitative analysis
Conclusion
[45]
Neural network
ARMA-ARCH
[42]
Optimization of cash management for ATM network
Artificial neural network
The simulation results showed that artificial neural network solution allows to keep the average daily cash demands’ forecasting error under 10%.
[21]
Forecasting short time-series tourism demand with artificial intelligence models
Fuzzy time series and grey theory
Although fuzzy time series and DES seemed to have better forecasting accuracy in several cases, these differences were rarely statistically significant.
[28]
Methods
MAPE%
Decomposition
37.79%
ANN #1
42.42%
ANN #2
49.02%
ANN #3
44.63%
ANN #4
42.04%
ANN #5
40.51%
ANN #6
41.06%
[24]
A mixed frequency approach to forecast private consumption with ATM/POS data
Mixed data sampling (MIDAS) regression models
It focused on nowcasting, drawing on MIDAS models seems to be advisable, which allows taking on board autoregressive dynamics delivering a better performance.
[31]
Genetic algorithm
Month
Criteria of fault (MAPE%)
January
19.26%
February
17.01%
March
102.35%
Total
138.62%
[38]
ATM location problem and cash management in automated teller machines
Neural network, local learning, SVM, ARMA
It intended to have two-stage solution procedures: the first stage is site selection and the second cash management as these two problems are linked together. It is believed that cash management policy should be established preemptively according to the ATMs locations.
[4]
Sites selection of ATMs based on particle swarm optimization
Particle swarm optimization
Based on the advanced PSO algorithm, the statistics constructed an experimental system by combining the GIS technology with mathematical mode.
Fraud detection
[22]
Sequence length,
Precision/recall
Anomaly detection
3
0.85
K-NN
4
0.21
HMM
8
0.84
Table 3, continued It automatically learned a behavior model from ATM event logs, which was then used during operation to identify abnormal behavior that indicated fraud or manipulation. The experimental results showed that the selected PDTTA model can outperform the state-of-the-art anomaly detection methods. An empirical study of Automated Teller Machine service quality on customer satisfaction The result of the tested hypothesis showed that there was a positive relationship between accessibility and convenience; therefore creating an accessible point of ATM use will make transaction convenient for the customers.
Sub
No. Ref.
Title
AI technique
Quantitative analysis
Conclusion
Fraud detection
[40]
Generalized ATM fraud detection
Test set where the ratio of artificial anomalies is 10%
F-measure
Event-based
Sequence-based
PDFA
0.63
0.51
PDTTA
0.9
0.71
Fraud detection
[23]
On the usage of behavior models to detect ATM fraud
Probabilistic deterministic timed-transition automaton (PDTTA)
The threshold
Fraud detection
[26]
Challenges of Automated Teller Machine (ATM) usage and fraud occurrences in nigeria – a case study of selected banks in minna metropolis
Data mining (empirical research)
Research showed that customers are much comfortable with the electronic banking system, among which ATM is just one component out of various services of e-banking. As the usage of ATM is increasing, its openness to security threat is ascending.
Fraud detection
[27]
A framework for computer aided investigation of ATM fraud in Nigeria
Expert system
The interactive processing considered a number of key factors that can be related, weighted and alternative deductive reasoning evaluated with the intention of identifying the set of culprits involved in a given case.
User interface
[11]
Adaptive Automated Teller Machines
Process mining
The results revealed that the majority of representative ATM users (more than 70%) were willing to employ the first, second and fourth interfaces.
User interface
[19]
Investigating ATM system accessibility for people with visual impairments
Pattern recognition
The financial institutions will not be left with an option to procure ATM systems inaccessible to the visually impaired. Finally, it is seen through this paper that the incorporation of biometric features will be essential to ensure that these systems have sufficient security.
Customer behavior
[16]
Multiple logistic regression analysis
Pearson correlation
Customer behavior
[5]
Evaluating customer perceptions towards ATM services in financial institutions; a case study of Pakistani banks
Data mining
As a result of increase in the number of ATMs, the number of transactions also witness a phenomenal increase. The customer’s personality characteristics were also found to have a positive influence on the use of ATMs.
Customer behavior
[20]
Factors affecting on customers’ satisfaction an empirical investigation of ATM service
Correlation and Regression analysis
The results showed that cost effectiveness of ATM service was a core service quality dimension and significantly affected the overall customer satisfaction in ATM service provided by commercial banks.
Table 3, continued
Sub
No. Ref.
Title
AI technique
Quantitative analysis
Conclusion
Customer behavior
[25]
Customers’ financial needs satisfaction and self-service technology banking: The case of automatic teller machines (ATMs) in Jordan
Regression analysis
The result indicated that which factor impact on the achievement of customers’ financial needs satisfaction.
Customer behavior
[39]
Allocation of heterogeneous Banks’ automated teller machines
Genetic algorithm
It is strongly believed that such a solver will aid banks in finding the best assignment of heterogeneous ATM machines to banks’ locations. Also, it can be used to obtain other information, such as whether banks should lease or buy ATMs.
Replenished strategy
[10]
Optimization of ATM cash replenishment with group-demand forecasts
Nearest neighborhood
From the past cash demand forecasting, it was observed that MAPE ranged from 20% to 45%. This study has an average MAPE of 20% or lower, which shows reasonably better performance than the ones given by the literature.
Replenished strategy
[15]
ATM cash management using genetic algorithm
Genetic algorithm
Based on analysis, the banks managers disagreed to select one or three days per week for their ATMs cash charges.
Replenished strategy
[44]
Routing optimization for ATM cash replenishment
Genetic algorithm
Deriving the optimal cash deployment strategy for a network of ATMs involves the analysis of logistics costs, inventory policies as well as routing of replenishment vehicles. The optimal cash deployment strategy focuses on reduction of cash-related expenses while guaranteeing that ATMs do not run out of cash.
Replenished strategy
[43]
Modeling and optimization of ATM cash replenishment
Genetic algorithm
The optimal cash deployment strategy focused on reduction of cash-related expenses provided that ATMs do not run out of cash. The periodic vehicle routing problem can be seen as a problem of generating a group of routes for each day of a planning horizon so that the constraints involved are satisfied and global costs are minimized.
Replenished strategy
[29]
An inventory-routing problem with pickups and deliveries arising in the replenishment of Automated Teller Machines
Mix-integer programming model, flexible clustering heuristic
Solving the problem with the proposed clustering procedure yielded better upper bounds for all instances, with average improvements of 29.94% and attaining 47.17% improvement in one case.
Replenished strategy
[30]
Pareto improvement and joint cash management optimization for banks and cash-in-transit firms
Pareto-improvement re-contracting schemes based on a Baumol-type cash demand forecast
For enhanced predictive power, the representative ATM model was dropped in favour of different ATMs with different turnovers and loading frequencies – and with customers who withdraw cash randomly but with a systematic seasonality. However, unlike the representative ATM model, it does not allow for finding Pareto optimal points through closed mathematical formulae – hence, the deterministic nature of the simulation model.
ATM failure
[3]
Ad-hoc automated teller machine failure forecast and field service optimization
Autoregressive moving average (ARMA)
By recommending to deploy the maximum number of engineers in each zone for the entire 2-week schedule, the number of unattended ATM failures drops to zero with a surplus of 269 idle hours. These surplus hours are very small as compared to the bank’s current practice and represents a cost savings of 28.6%.
Table 3, continued Immune-inspired adaptable error detection for Automated Teller Machines Classification (artificial immune systems E-mail classification (AISEC) algorithm) The results showed that during the offline training phase, classification performance of the static AISEC algorithm with the evolutionary process was not better than the static AISEC algorithm without the evolutionary process. For the online testing phase of AISEC algorithm, it was confirmed that the incorporation of novel fatal sequences of states improved the classification performance of the AISEC algorithm, which was in contrast to the exploratory evolutionary process. This led to the conclusion that the continuous learning used by AED is associated with improvement in its detection capability. Equipment fault forecasting based on ARMA model Auto-regressive moving average (ARMA) model The comparison between forecasting values and actual values as well as Mean Absolute Error (MAE) comparison between the proposed method and ARMA model method showed that the proposed method has high accuracy.
The ATM usage for every location was calculated. Further decision about providing service to the customer was left to the bank management. The location of ATM, which provided service to the customer, was determined with their usage level.
Sub
No. Ref.
Title
AI technique
Quantitative analysis
Conclusion
ATM failure
[36]
Classification accuracy
Dataset A
Dataset B
Static AISEC
93.33%
90.53%
Static AISEC Evolutionary process
83.11%
90.53%
online AISEC Evolutionary process
85.78%
89.93%
Static AISEC incorporational of fatal sequences
86.67%
91.53%
ATM failure
[41]
Mean Absolute Error (MAE)
Forecasting by proposed method
Forecasting by ARMA model only
2.48%
3.78%
Peak time
[46]
ATM service analysis using predictive data mining
Adaptive Bayes network, support vector machine, naive Bayes
Peak time
[9]
Calendar effects in daily ATM withdrawals
Regression
In general, the results indicated that cash withdrawals were negatively affected the day before holiday. This effect is even more pronounced during the holiday. Concerning the day after the holiday, the results are less general, pointing on average to a positive effect. This type of profile is clearly stronger and statistically relevant in the Christmas and New Year periods. The results point to the presence of important calendar effects.