





Abstract
Natural rubber (NR) latex is sensitive to mechanical influences which can occur at almost every stage of its manufacturing process. Moreover its mechanical stability can also change during storage or be modified with the addition of suitable soaps such as oleates, laureates, and stearates [1]. Hence the Mechanical Stability Test (MST) is of vital importance to the rubber industry as it gives an indication of the quality of the latex. Currently the assessment is performed manually by trained laboratory technicians, following the procedures as defined by the ISO 35 standard mechanical stability test. However, the test is highly dependent on the human visual capability and the experience of the laboratory technician performing the test, potentially leading to either inconsistent or inaccurate results. In this paper, we proposed a computer vision-based mechanical stability classification system to minimise the potential for biasness in the current standard test. We investigated this with a novel feature descriptor – Histogram of Size Distribution (HSD) that is based on the coagulum count and size. Experimental results demonstrated that the proposed system was able to provide essentially good classification accuracies on the data tested.
Keywords
Introduction
Natural rubber (NR) latex is a complex, renewable biosynthesis polymer commonly extracted from the Hevea Brasiliensis tree. Its unique characteristics such as high strength, excellent elasticity and processability make it a useful raw material for mass production for a wide range of common products, for example surgical gloves, tyres, foley catheters, etc. [2]. Hence the quality of the raw NR latex which has a direct impact on the manufacturing processes as well as the performance of the end-product is of major industrial and economic importance [3]. Unfortunately, its quality varies with climate, temperature, rainfall, altitude, drainage of the soil, age and state of health of the tree [4]. Moreover unavoidable mechanical manipulations (shear force) introduced during either the pumping, transportation or processing of the concentrate can destabilise the NR latex significantly. Hence there is a need for a standard quality assessment in order to ensure that a particular batch of NR latex is suitable to meet the requirements for a specific application [4]. As rubber was planted on a commercial scale as early as 1877 [5], many of the processes, equipment and techniques used to manufacture rubber products have not changed much but are either still used or referred to, till this day. This is especially true for many of the testing equipment and techniques [6, 7, 8, 9]. To ensure the quality and processibility of the latex concentrates, various tests [6, 7, 8, 9, 10, 11, 12, 13] have been proposed and they essentially attempt to give a measure of the quality of the latex concentrate. These tests either exploit the rubbing or high-speed stirring mechanism as a mechanical influence to sufficiently degrade the quality of the NR latex. Apart from these techniques, a few studies have centred on the development of the test machinery [7, 9, 10, 12, 13] to measure the mechanical aspects of the NR latex. The first known piece of work on the estimation of latex stability using the aforementioned technique was with the Hamilton Beach Mixer [10]. Novotny and Jordon [6] subsequently proposed improvements to the mechanical stability test involving high speed stirring with a constant speed motor that is able to control the formation of the solids very carefully. Murphy [7] devised a test apparatus designed for a much simpler hand rubbing test under controlled conditions as a mechanical stability test for NR latex. The apparatus consisted of a moulded rubber nose which can be rotated with a sun and planet motion over a latex sample that had been spread onto a glass plate. The end point of the test was defined as the number of seconds the film of latex commerce to break up into small flocculum. The Crude Rubber Committee of the Division of Rubber Chemistry, American Chemical Society proposed a standard procedure for determining the mechanical stability of latex [11]. The effect of different variables, such as, total solid content, speed of stirring, temperature and size of the sample on mechanical stability time was studied by Dawson [8]. Maron and Ulevitch’s [9] contribution to this body of work involved a mechanical stability test that subjects the latex to a shearing force exerted by a metal disk under load, rotating in contact with a polyethylene surface. The coagulum formed in the operation of the machine for a definite time and under specified conditions was taken as a measure of the mechanical stability of the latex. Effectively, this gives a measure of the ability of the latex to withstand the colloidal destabilisation caused by the mechanical influences such as agitation. Gorton and Swinyard [13] proposed an alternative which uses a high-speed cone-plate viscometer to perform the stability test of NR latex. This can shorten the duration of the test as the device operates at a high and constant shear rate – which was achieved by rotating the cone at speeds of 1,000 rpm. The end point in this test is defined as the time for a 30% increase over minimum torque reading. This then gives a certain measure of how well the latex performs under such mechanical influences. In short, the existing approaches can be grouped into two main categories. The first category implements the hand-rubbing mechanism which has long been used by rubber technologists to obtain an approximate evaluation of latex mechanical stability. The end-point which is a direct indication of quality of NR latex is given by the time taken for the latex film to start breaking into small flocculus. The first sign of such flocculus is an indication of colloidal destabilisation. In practice, the hand rubbing test is more convenient and fairly fast. However, in order to have a more systematic and accurate mechanical stability indication, a relatively larger number of users have adopted the high speed stirring test rather than hand-rubbing test. Nevertheless, more recent investigations have focused on finding a more accurate, consistent and convenient metric for the end-point, for instance, the torque reading of the stirrer, the amount of flocculus formed for a definite duration, as well as the time required for occurrence of visible flocculation. However these may still suffer from high variability and subjectivity which will ultimately affect the test results. The predicament arises from the variations in the NR latex sample preparation, test procedure, apparatus used, test conditions, as well as different quality metrics implemented even due to the lack of consensus between the related technical personnel as well as the stakeholders. The usability and consistency of the mechanical stability test was greatly improved with the establishment of a standard test by the International Organisation for Standardisation (ISO) [14], videlicet ISO 35:2012 that aims to regularise the conditions and procedures for the test.
The standard test is widely adopted by the rubber-processing industry today. Nonetheless some challenges still remain. For example, the definition of the quality metric used in ISO 35 namely Mechanical Stability Time (MST) requires the individual analysts to spot the first occurrence of flocculation1
Flocculation is a process in which particles adhere to form small clumps or masses.
The rest of the paper is organised as follows. Some of the more significant prior work related to the use of computer vision are discussed in the next section. This is followed by Section 3 which describes the details of the proposed method. The next section after this includes details of the data collection as well as the experimental setup. Section 5 analyses the experimental results obtained. Finally, some conclusions are drawn in Section 6.
Proposed framework for MST classification.
Computer vision techniques have been successfully used in many fields [15, 16, 17, 18, 19, 20]. More specifically, there is some similar work done to investigate the use of computer vision to determine the size of objects. Kamel et al. [21] investigated the use of image processing to compute the particle size distribution of toulene droplets with microphotography under non-ideal lighting conditions. Each droplet was identified using a border following technique. Furthermore each toulene droplet was assumed to be elliptical and the areas were computed based on this assumption. The results were compared with those obtained from a commercial particle size analyzer – the OPTON TGZ-3. Particle size and the size distribution are also very important in many industrial sectors and Zhang et al. [22] were particularly interested to determine the size of coal particles. They studied 467 coal particles from four different sizes. Using a computer vision approach nine measurements, representing the width of the coal particles along various axes were computed, these were then compared with those they had obtained from physical measurements using nothing more than a pair of Vernier calipers. While they only managed to obtain 70% correlations with the physical measurements along most of the axes but they managed to achieve a maximum of 85% measurement accuracy along one of the axes. Shanti et al. [23] investigation focussed on determining the diameter of gravel which were verified against sieve analysis results. The objects were quite large and can be easily seen with the naked eye. The images were subjected to standard image processing techniques. For objects which are of much larger sizes, Nandi et al. [24] investigated the use of machine vision-based techniques for automated mango fruit sorting based on the size and maturity of the fruit. The maturity measurement was based on the RGB colour intensities using the Gaussian Mixture Model (GMM). The four different maturity categories of five different mango varieties were validated by three independent experts. These then form the ground truth. Unlike latex particles, the sizes of the mangoes are significantly larger. Other similar work on the use of computer vision to determine the size of objects involved airborne dust particles [25], grains [26, 27], wheat straw [28] and bacteria colonies [29]. Lai et al. [30] proposed hashing to encode an image into a vector of visual features followed by quantisation or projection to generate a new binary code which formed the inputs to a deep neural network to correctly identify a large set of different images. Nevertheless, their approach is significantly different for MST classification as we are looking for the first occurrence of large particles at each stage of the MST testing. While their approach is reported to be accurate, it is more sophisticated and large computing resources are required due to the more complex network architecture used to learn the input patterns. Approaches based on Deep Learning usually works well when there is huge amount of data to train the data and in the case of latex, to generate such a large amount data would not be feasible nor cost efficient.
In summary, computer vision has been used to determine particle sizes and this has been used to investigate a wide range of different objects of various shapes and sizes. Nevertheless this had been done with the sole purpose of computing the actual size of the objects. In this paper, we proposed a computer vision-based approach which can minimise much of the subjectivity and inconsistency in the quality assessment of NR rubber latex. Our earlier investigation centred on the feasibility of statistical features such as coagulum count and coagulum size distribution on the MST determination [31] for latex quality assessment with encouraging results that showed a good correlation with the manually-annotated MST. We are extending this by introducing a new feature, Histogram of Size Distribution (HSD) that is based on coagulum size distribution as part of our proposed computer vision-based approach to complement the ISO 35 standard procedure to determine the MST for NR latex more accurately and consistently. This can help eliminate human biasness in the results while providing a quantifiable measure of the quality.
This section explains the details of our proposed framework which is summarised in Fig. 1. It consists of 4 key steps with the first 3 processing the images for eventual classification.
As shown in Fig. 1, the first step is to binarise the input image by selecting an appropriate threshold to separate the object-of-interest – coagulum from the background pixels. Technically image binarisation depends purely on the histogram analysis of colour intensity and can be expressed as,
where
where the dilation operator
where
where
Preparing NR latex for MST
The standard approach for the mechanical stability tests starts by preparing about 80 g (Fig. 2a) of the NR latex concentrate diluted with an ammonia solution to about 55% total solids (Fig. 2b). This mixture is then immersed into a water bath (Fig. 2c) to ensure that this is maintained at a constant temperature of 36–37
Processes involved to conduct the MST test manually.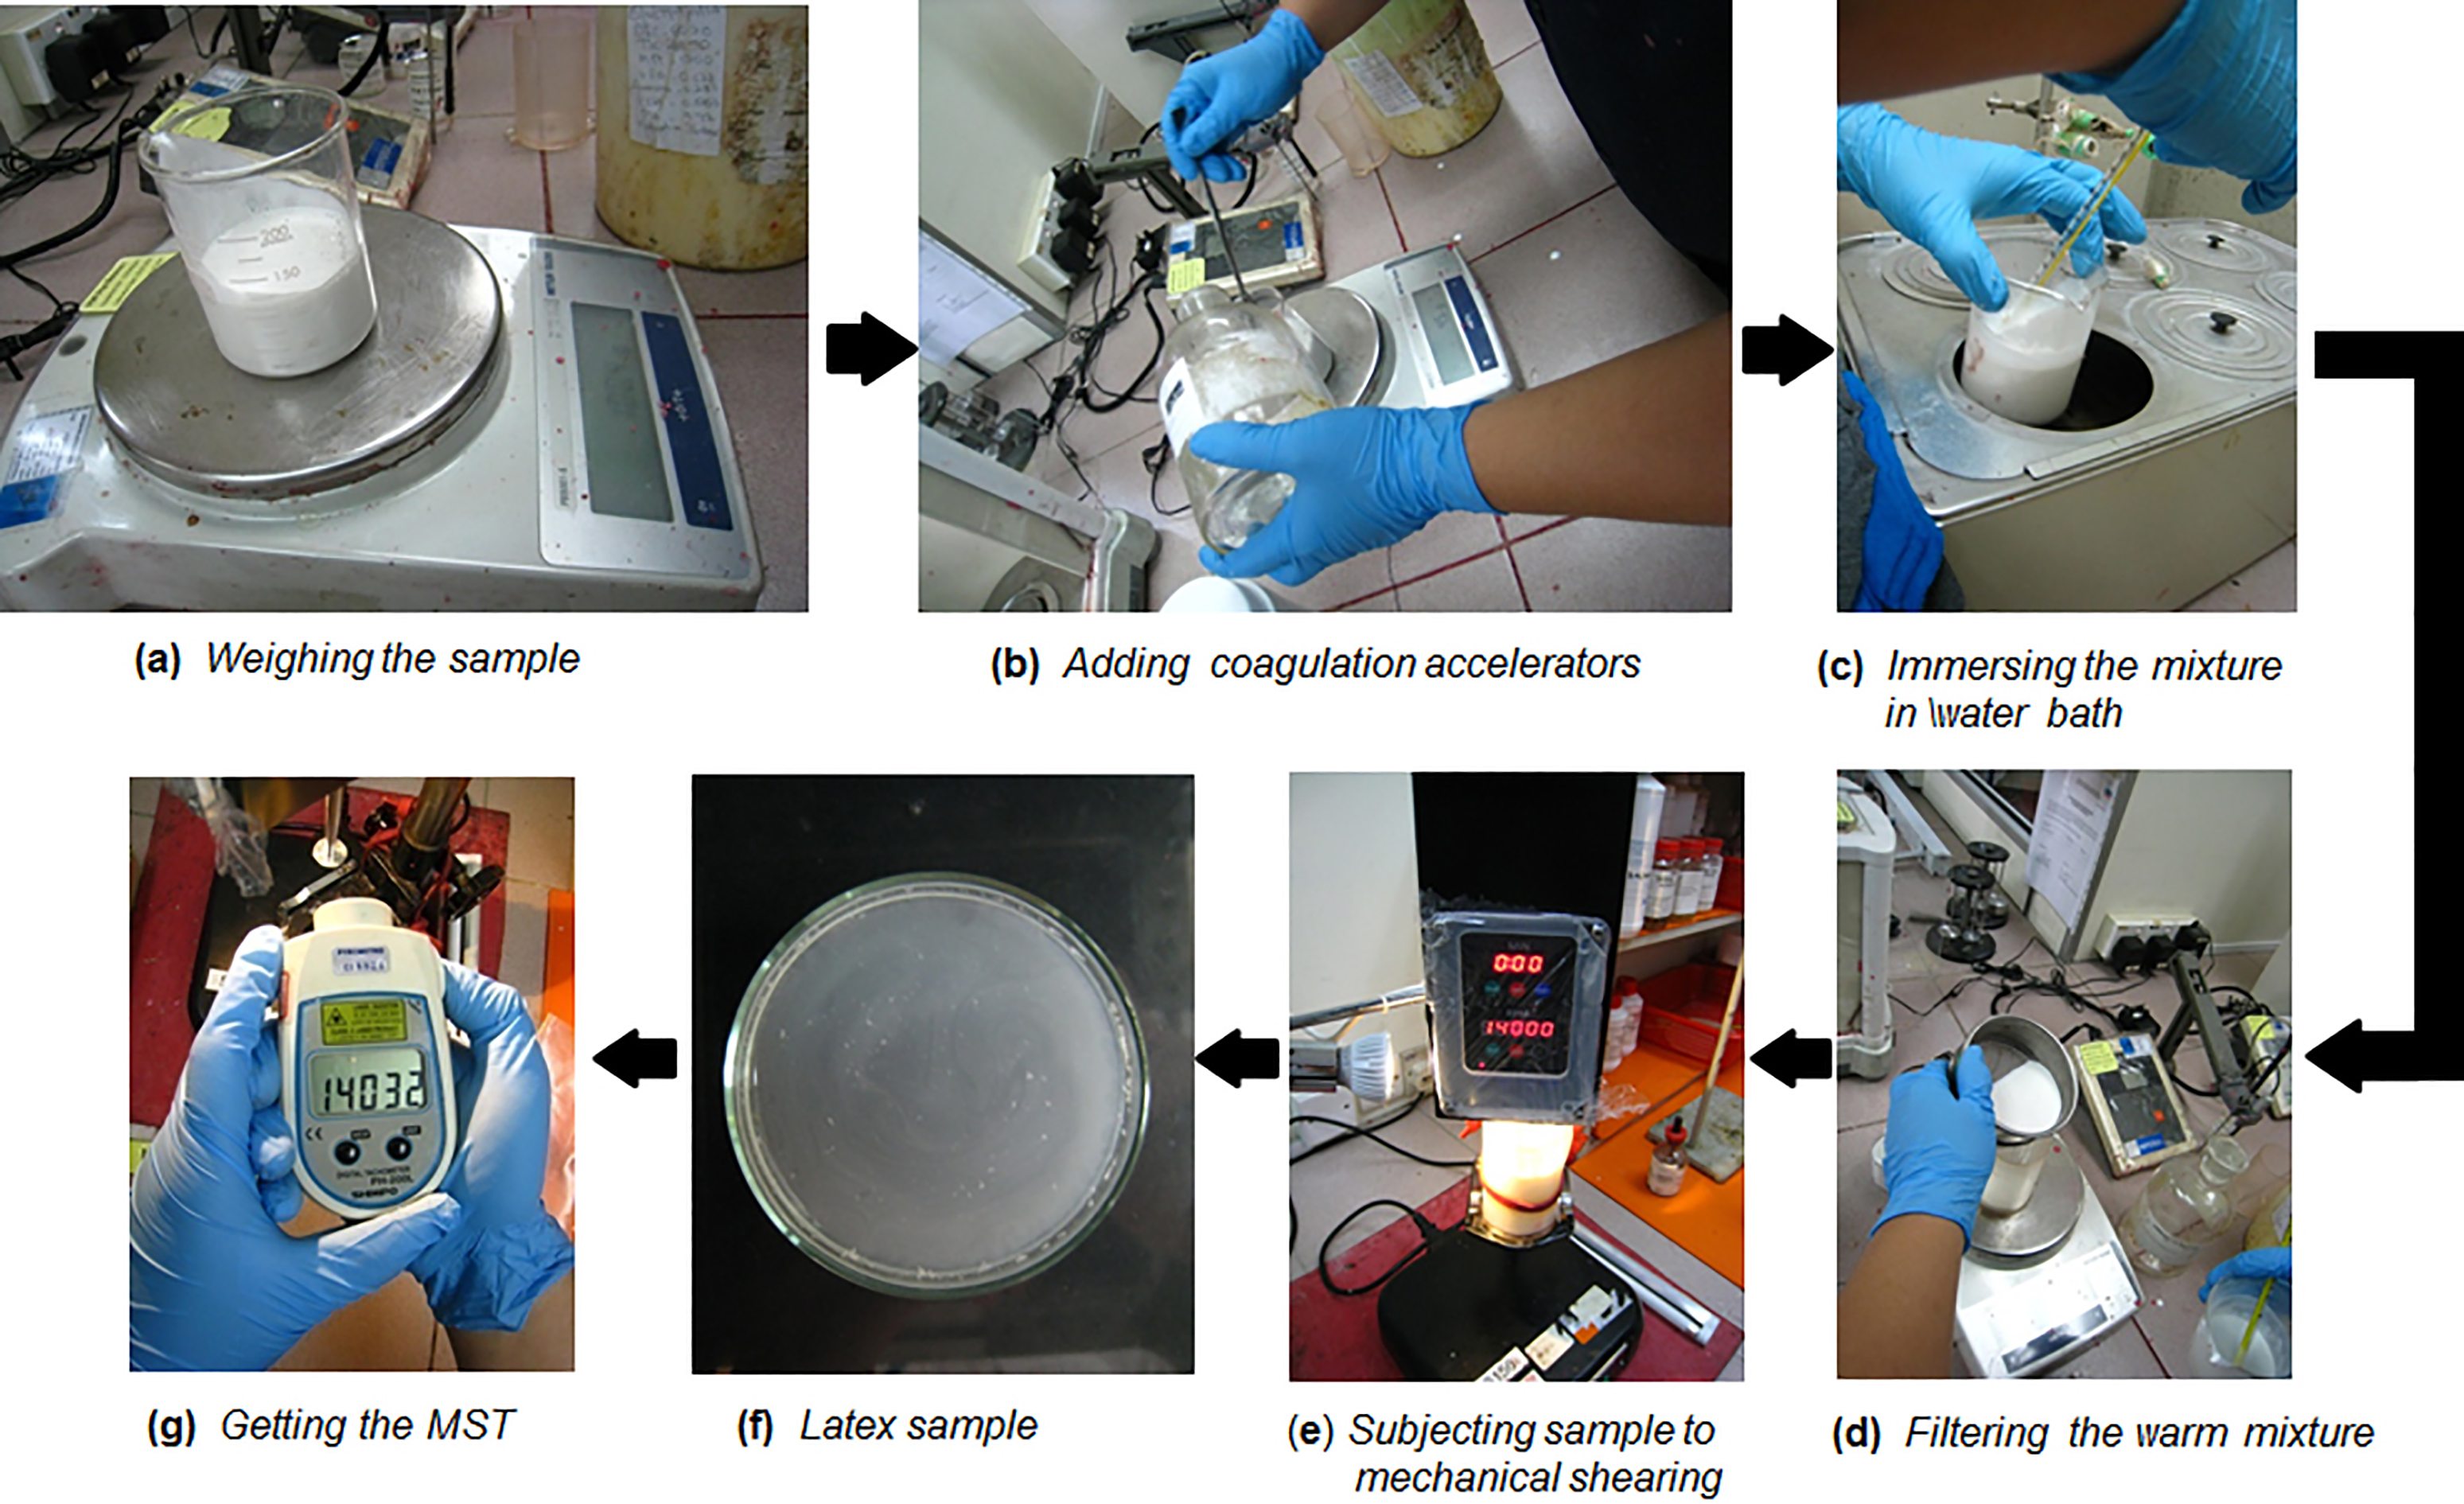
The stirring continues but samples of the mixture (Fig. 2f) were taken at regular intervals for analysis until the MST point is reached (Fig. 2g) [32]. Each sample was dropped into a petri-dish containing distilled water (Fig. 2f) and then placed into the imaging chamber with controlled lighting. Photographs of the latex samples in the petri-dish were then taken with a standard Digital Single-Lens Reflex (DSLR) camera fitted with a 60 mm f2.8 macro lens. This is repeated until signs of mechanical destabilisation, i.e. large number of obvious coagulum is observed. The whole process involving taking samples at regular intervals to identify the MST takes at least 20 minutes to complete. The data collected would involve three basic classes, viz., pre-MST, MST and post-MST.
In the 50 laboratory experiments, we collected a total of 620 high-resolution images. Under the close supervision of an experienced laboratory technician, the entire data set is then carefully annotated into 3 classes: pre-MST, MST, and post-MST comprising 400, 87, and 133 images respectively. Due to the significant class imbalance in the data set which causes the learning process to be biased towards the majority classes, with the minority classes being ignored in machine learning, we down-sampled the two majority classes by randomly selecting the images to comply with the number in the minority class, resulting in a more evenly-distributed set of images for each class. The images were then cropped into a smaller size of 800
Images of mechanical stability test in various classes: (a) Pre-MST, (b) MST and (c) Post-MST.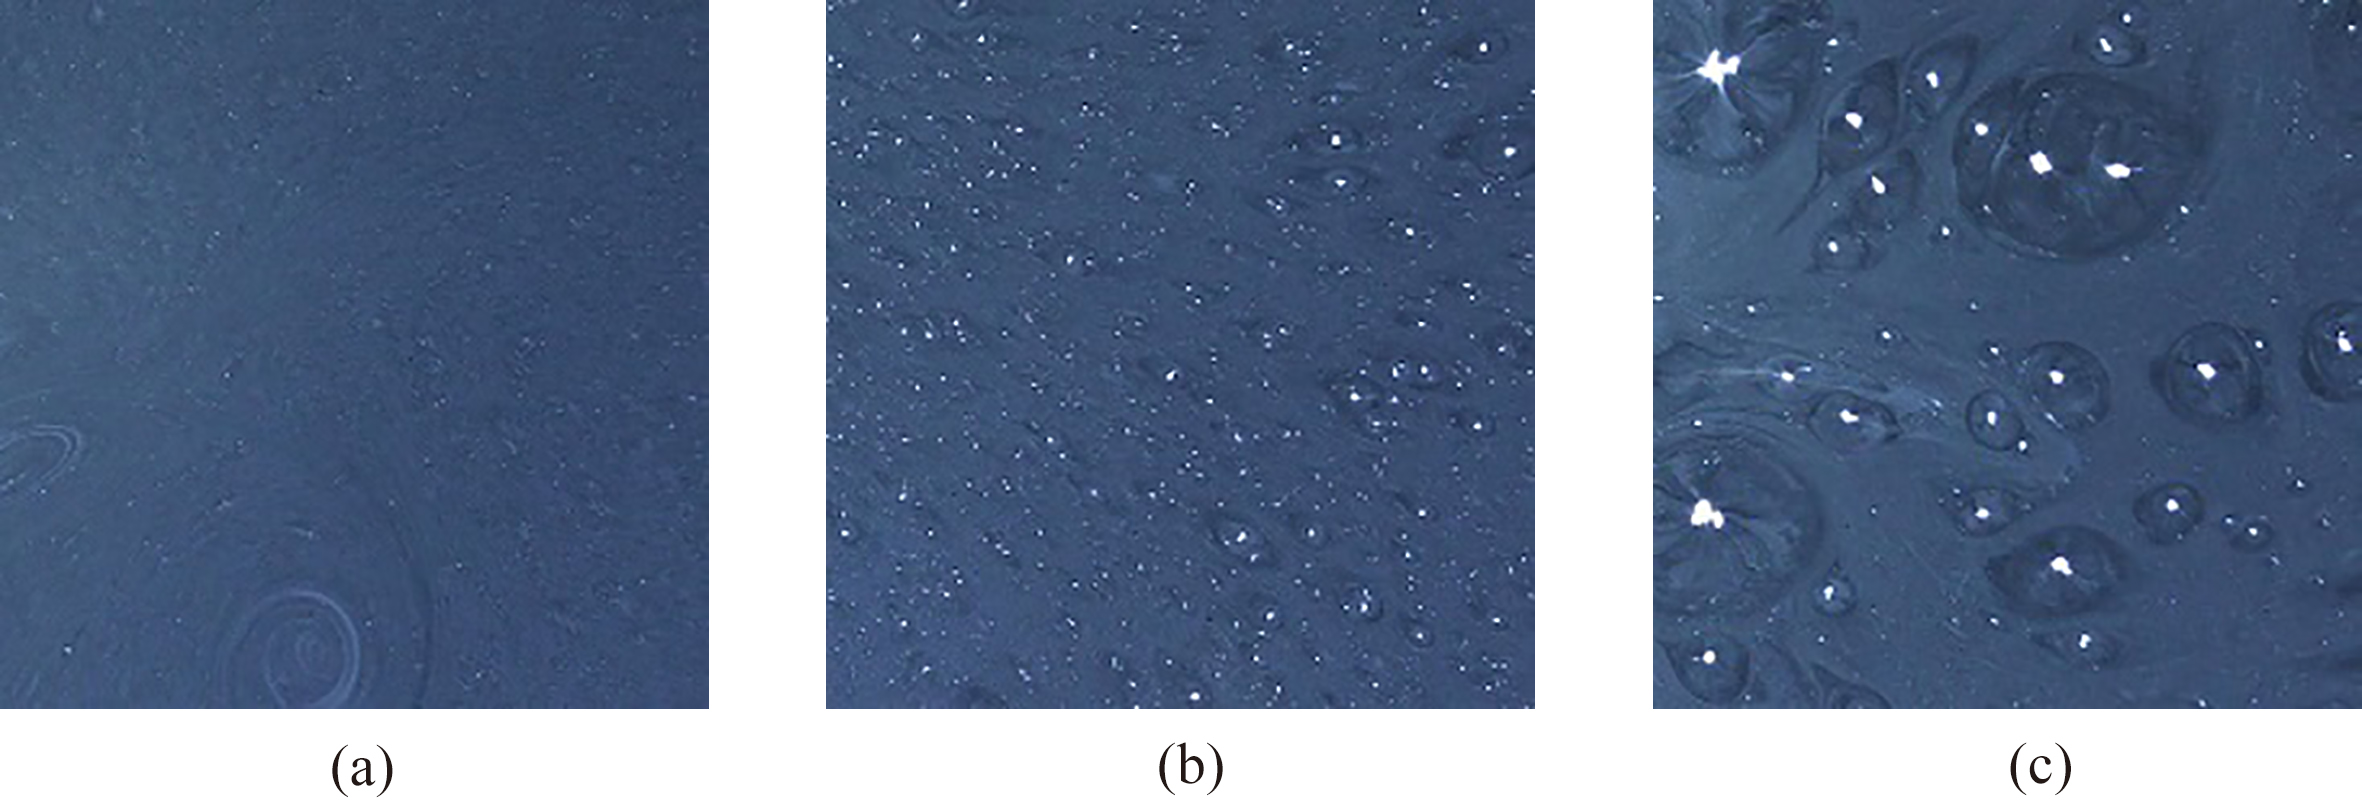
We then performed 70:30 cross-validation on these data to generate a reference set and test set respectively.
The
Results and discussions
Figure 4 shows the results of using different binarisation thresholds on the MST test images and measuring the average classification accuracy. The best accuracy achieved was 91.45% for a threshold,
Effect of binarisation threshold T on MST classification accuracy. This experiment is performed under optimal parameters: nearest neighbour, 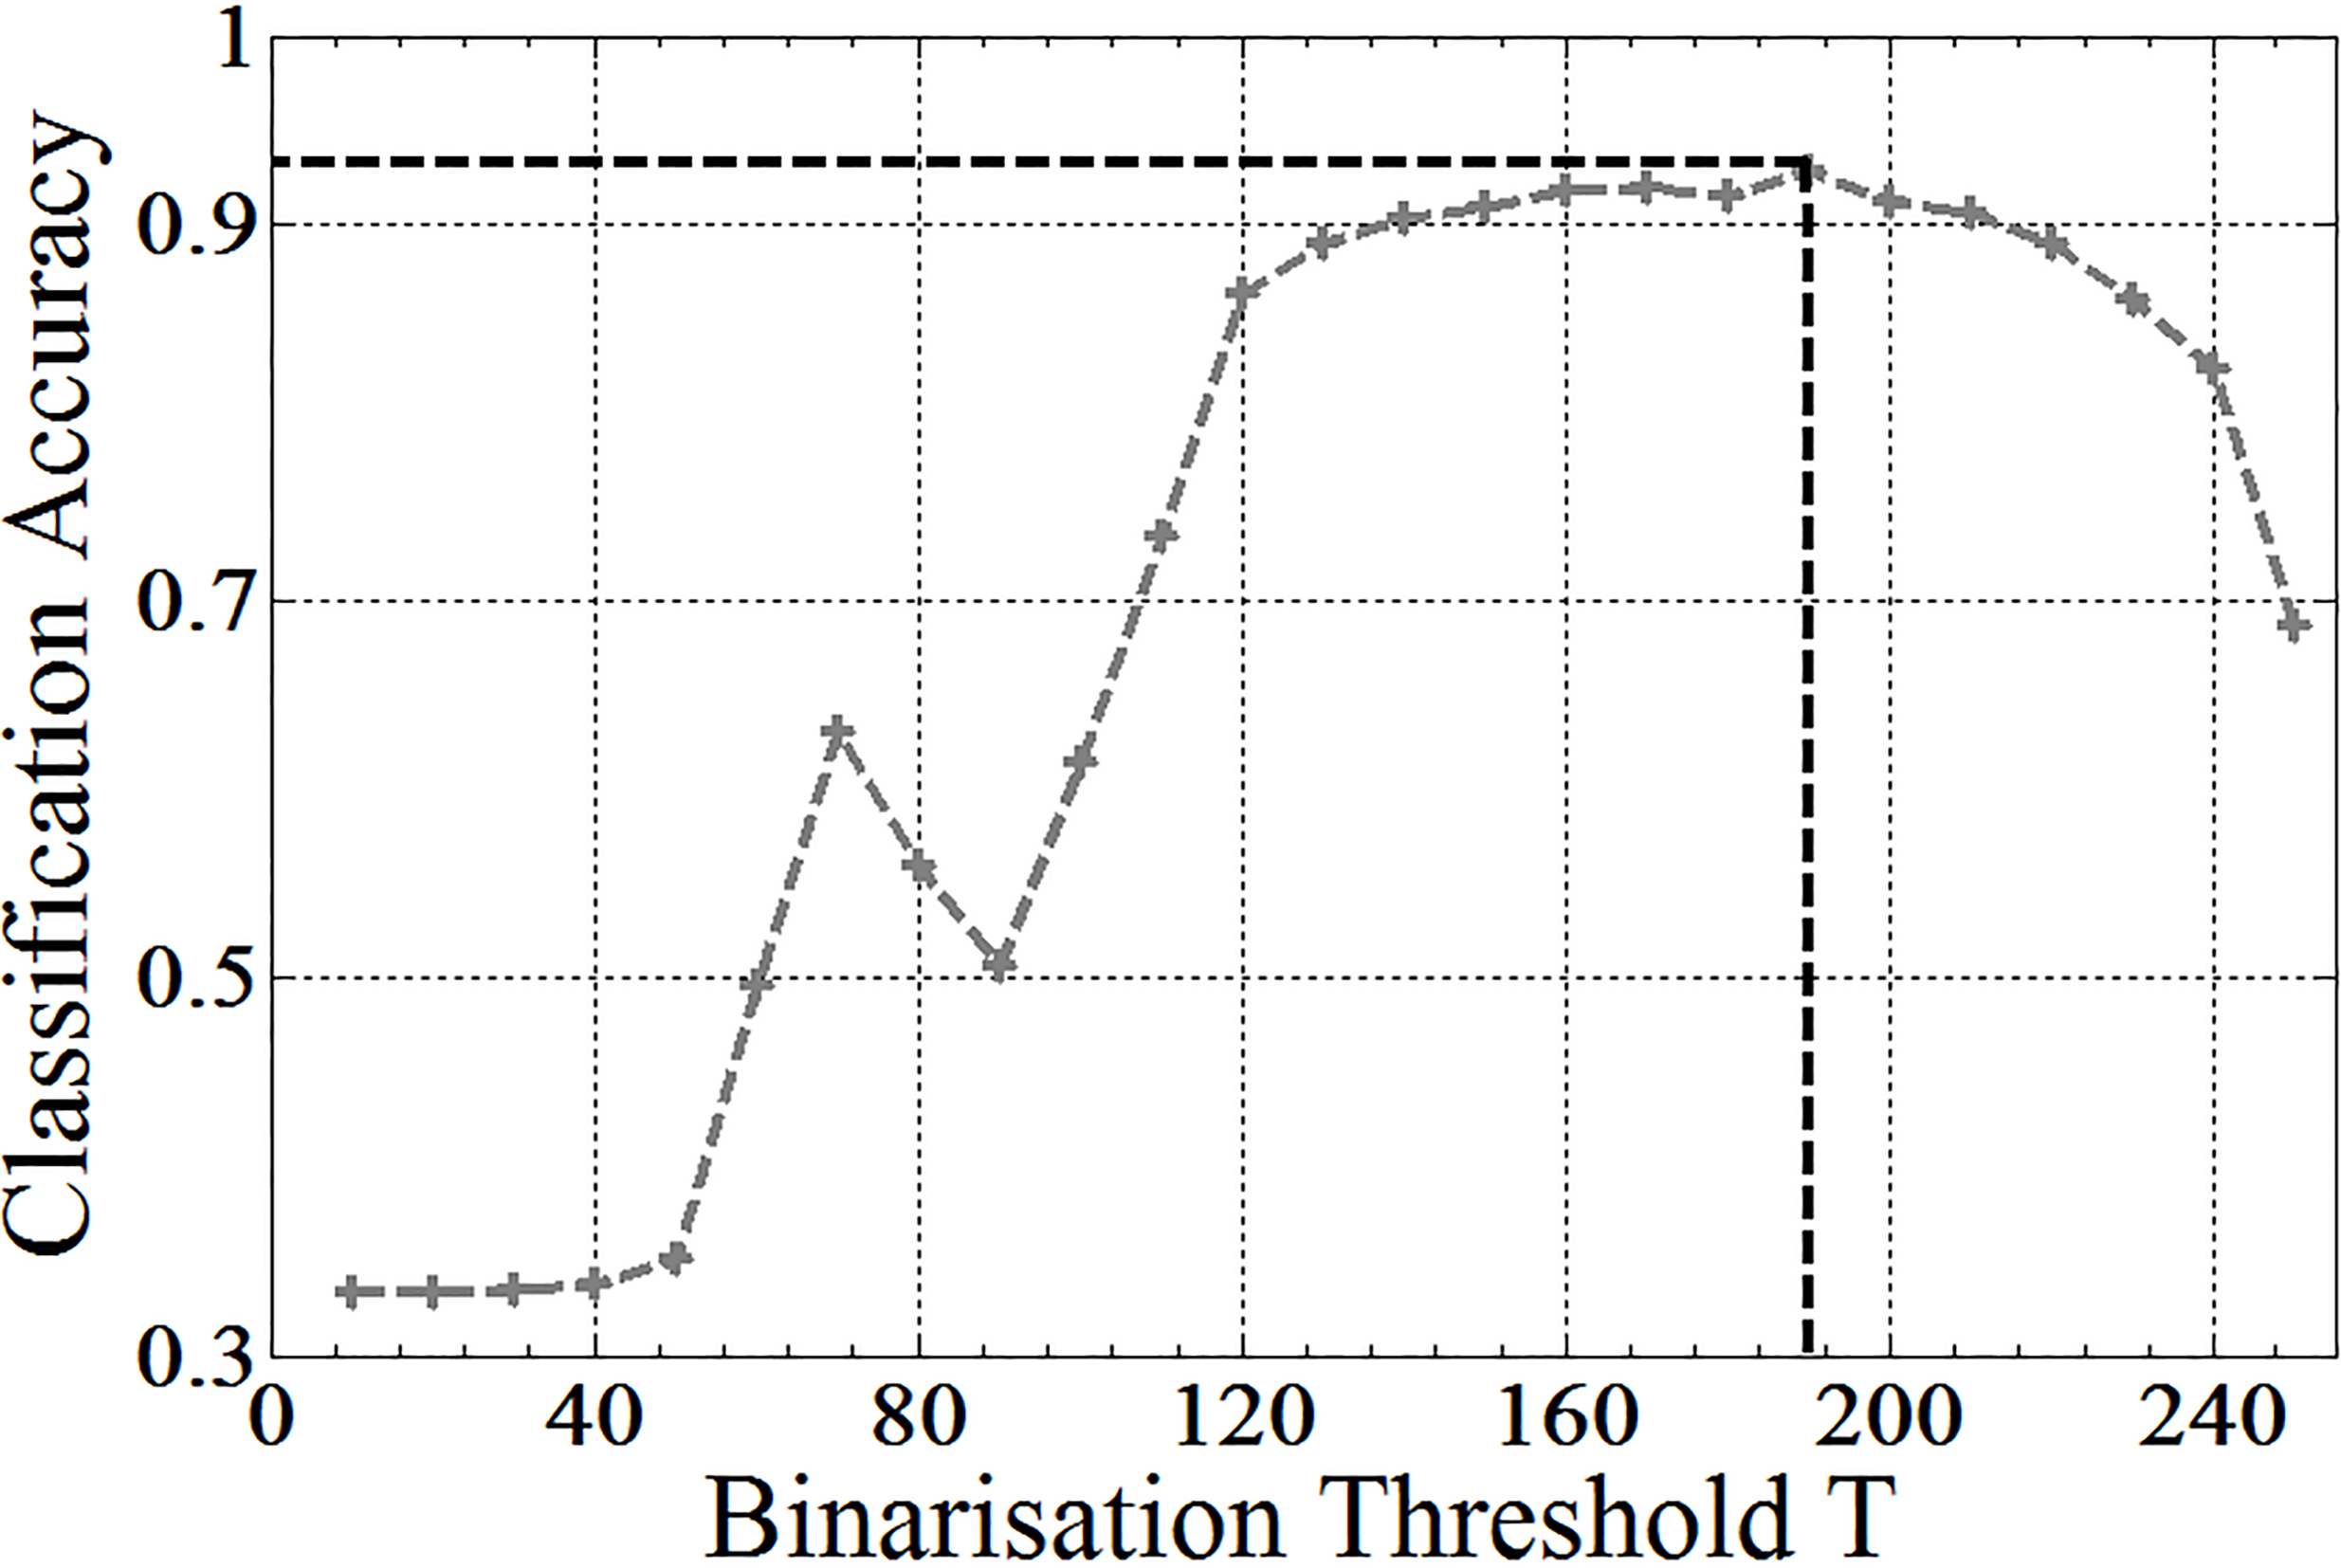
Figure 5a shows the effect of number of bins,
Figure 5b shows the effect of the number of clusters,
Effect of number of bins n (a) and number of nearest neighbour k (b) on MST classification accuracy. This experiment was performed under optimal parameters: binarisation threshold, 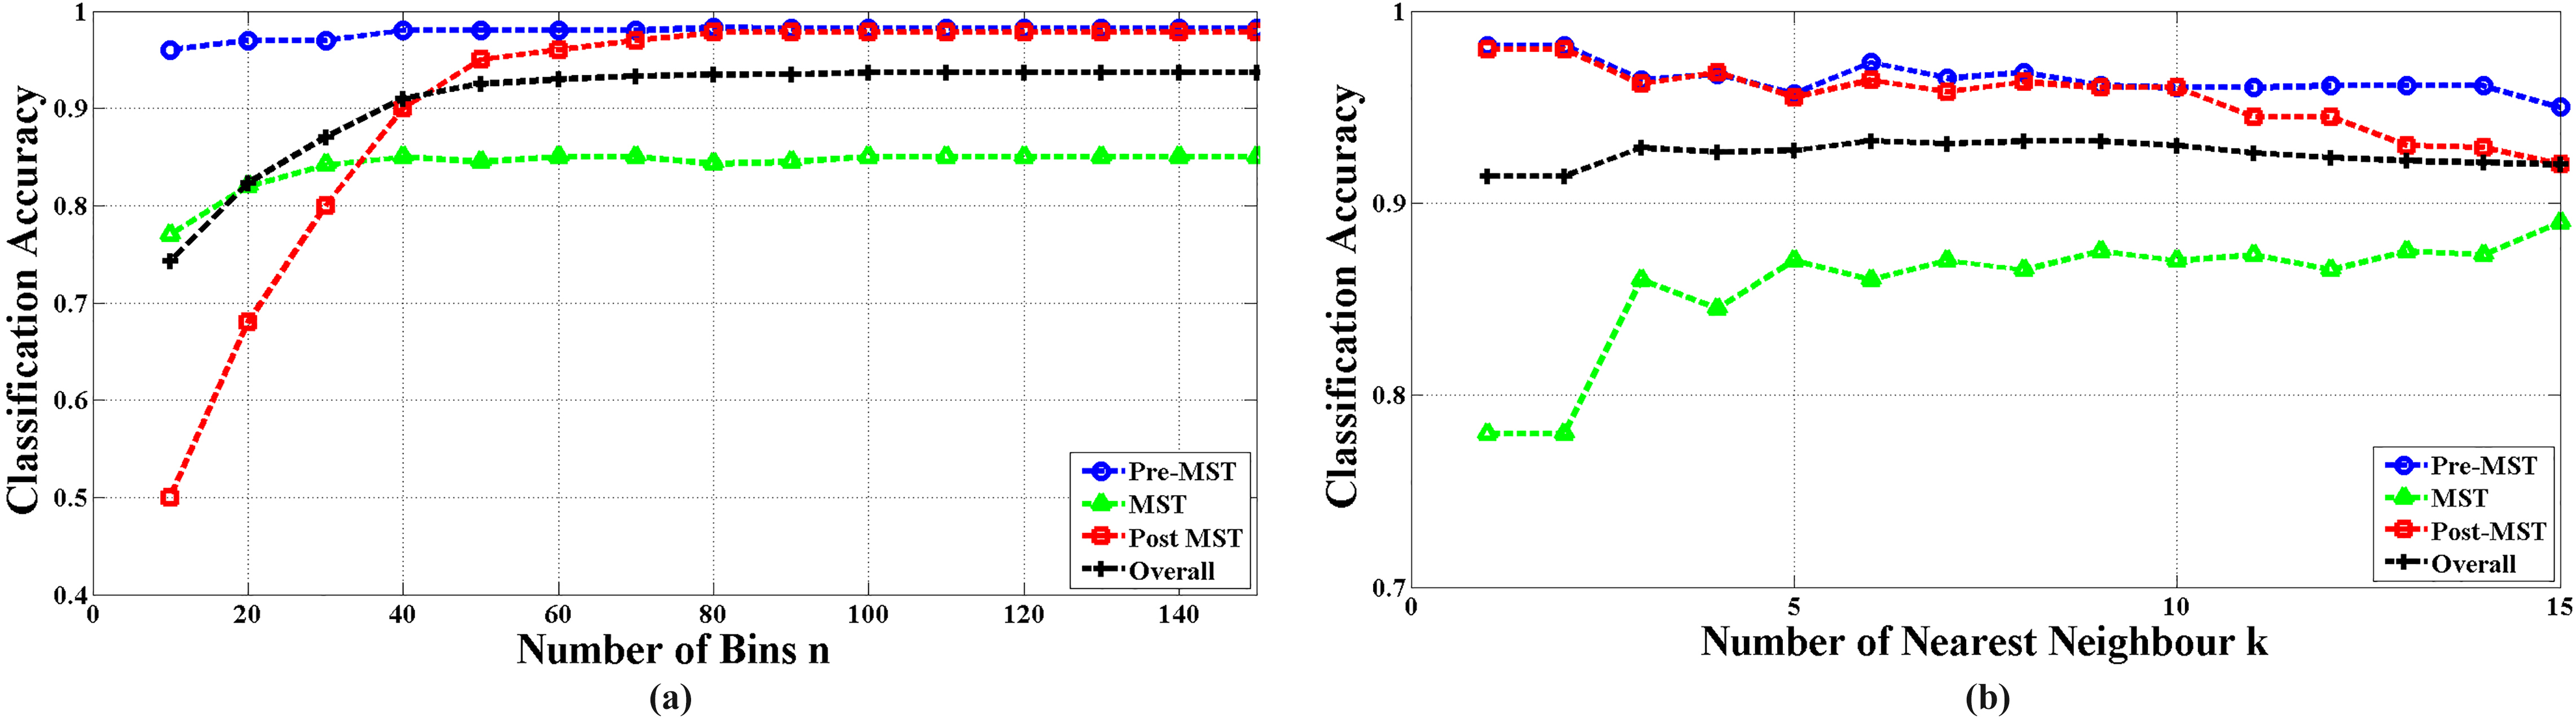
Images of the latex concentrate for various MST classes.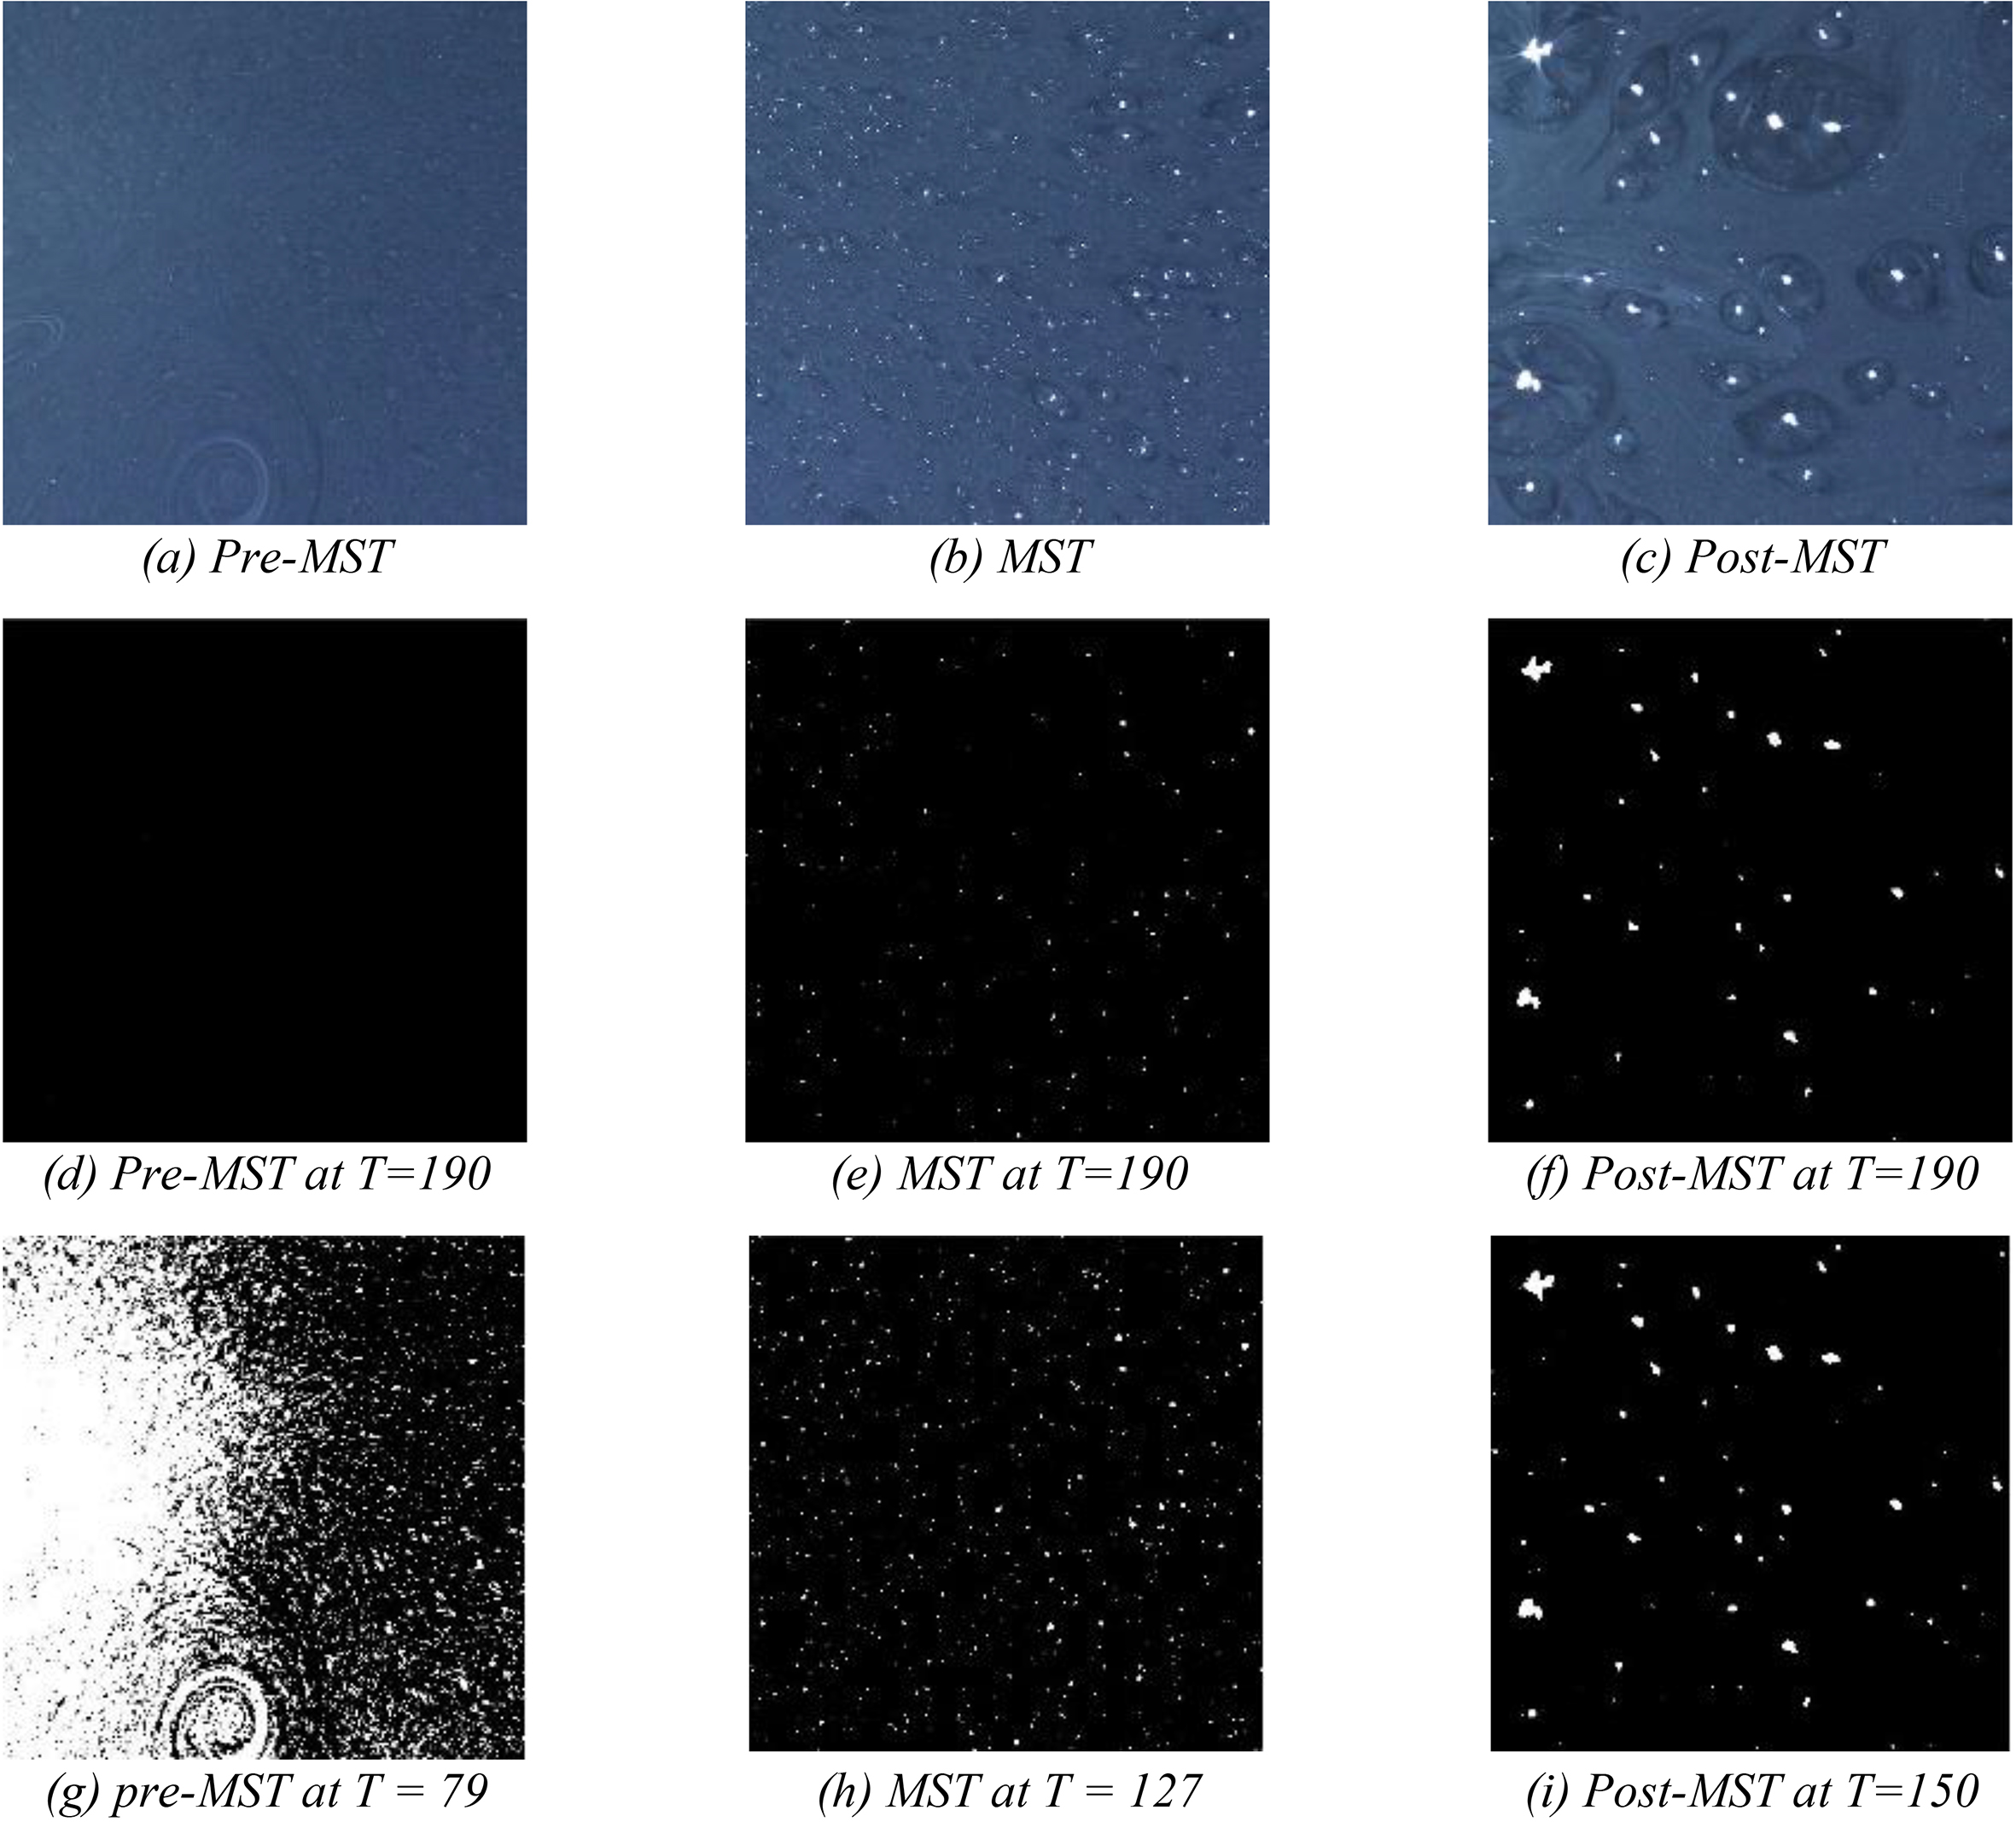
Nevertheless, for each individual MST class, the accuracy increases sharply when
Figure 6 shows a sample of the images from the MST data set representing the three different classes, viz. pre-MST, MST and post-MST (Fig. 6a–c), their corresponding binary images as well as those which had been processed by thresholding. Besides the fixed-threshold binarisation with the threshold
Figure 7 shows the features based on HSD obtained from the binary images of the three different classes. It is obvious that the features are quite dissimilar for each different MST class as their characteristics are very distinctive even to the naked eyes. For some of the figures shown here, even though there may not be any particles detected in the other bins, there are always some particles in the first bin. Furthermore, when comparing the number of particles for this first bin, the lowest count is observed for the pre-MST and the highest from MST. The Post-MST features, on the other hand, have a wider distribution of particles of different sizes and not just in the first bin. Nonetheless, it can be seen that for each class, the highest number of particles are in the first bin.
Table 1 shows the confusion matrices for the MST classification accuracy obtained with the optimal parameters. For each category, classification accuracies were obtained for both fixed binarisation threshold and Otsu’s adaptive threshold. These are shown in Table 1a and b. The overall classification accuracy for fixed binarisation threshold and Otsu’s adaptive threshold were 92.86% and 85.45% respectively. Again, the results demonstrated that an effective fixed binarisation threshold performs significantly better than the adaptive threshold in the MST data set for individual class accuracies as well as overall classification accuracy. Amongst all classes, the highest accuracy achieved is 97.07% for pre-MST followed by post-MST classification at 96.03%.
Confusion Matrix for MST Classification accuracy
This experiment was performed using the optimal set of parameters: nearest neighbour,
HSD generated from different classes.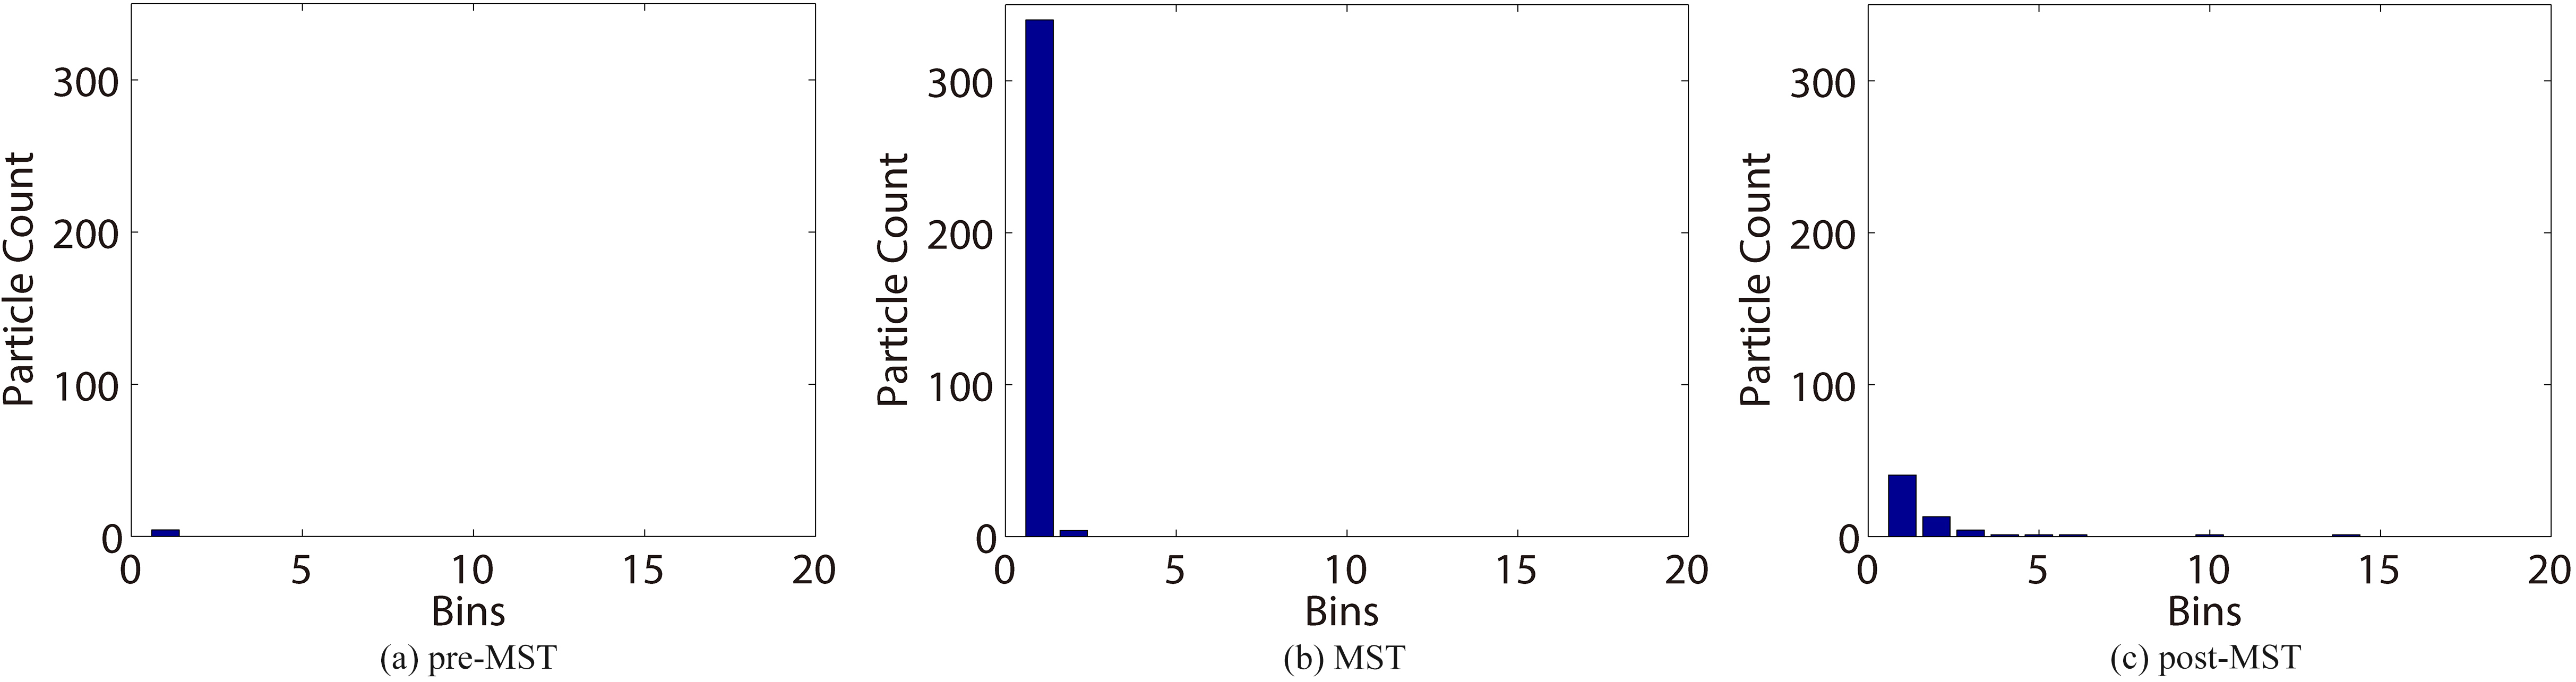
We used the principal components to further analyse the results of these Mechanical Stability tests. Principal Component Analysis (PCA) is a common technique which has been used for dimension reduction [36] and pattern analysis [37]. It is a feature extraction technique that generates new features which are linear combination of the initial features [38, 39]. PCA maps each instance of the given dataset present in a
where
Since the objective is to have the greatest possible variance, this can be achieved by selecting the most appropriate value of the numerical coefficient,
Using only the first two components generated from the PCA, the visual maps of each MST data set are shown in Fig. 8. There is a clear distinction between the individual classes which indicates the effectiveness of the HSD features selected. In the case of the pre-MST class it is nicely clustered at the bottom left corner of the map in Fig. 8a. They are not as scattered as the other two classes. This may explain why the pre-MST class always has the best classification accuracy. Moreover there is also a better segregation of the data for the other two classes – as shown in Fig. 8b and c. Nevertheless MST has the lowest classification accuracy at 85.45%.
Comparison of classification accuracies for various features
Visualisation of MST data set as scatter plots.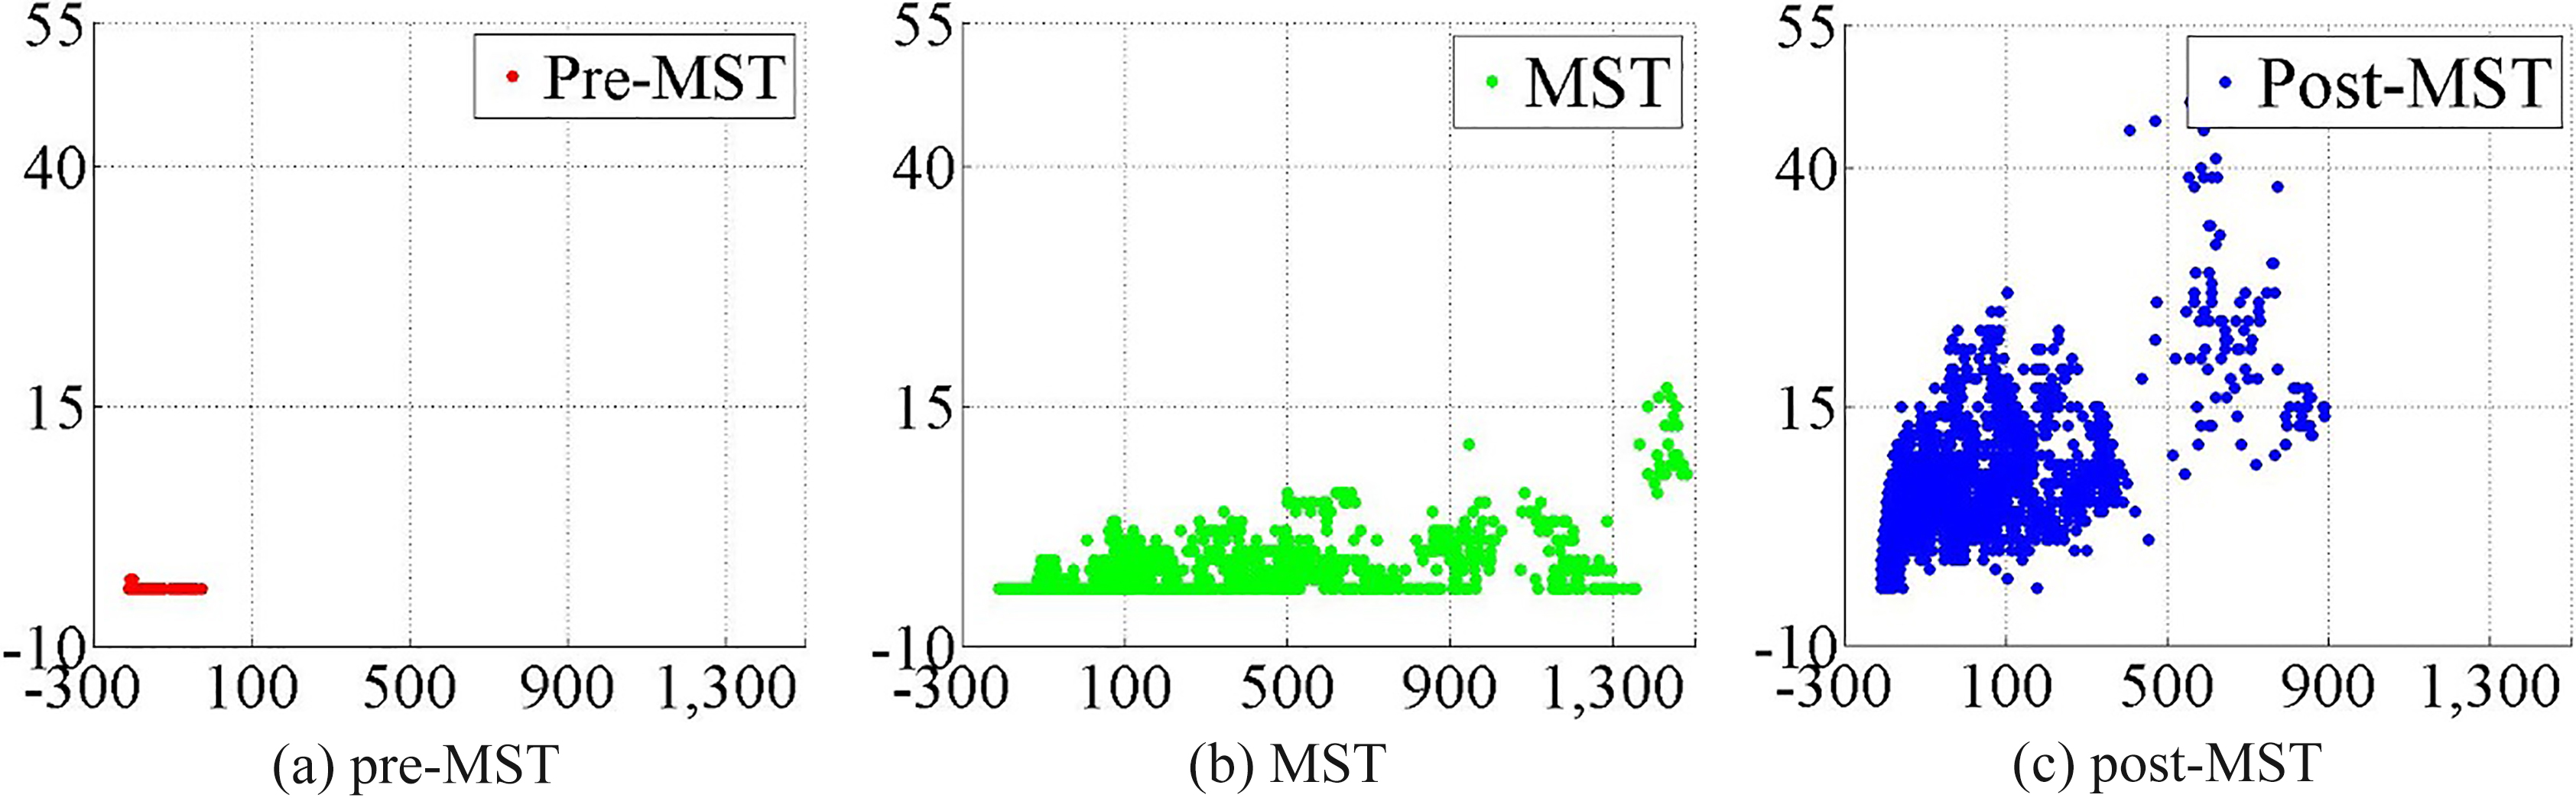
Misclassification of MST as pre-MST constitutes the largest error overall – accounting for 14.15%. The reason behind this can be explained when the entire data set is visualised as shown in Fig. 9. We can now see that there is a significant amount of overlap between the pre-MST and MST classes at the bottom left corner leading to the misclassification error of MST as pre-MST that was previously shown in Table 1.
Visualisation of overall MST data set on scatter plot.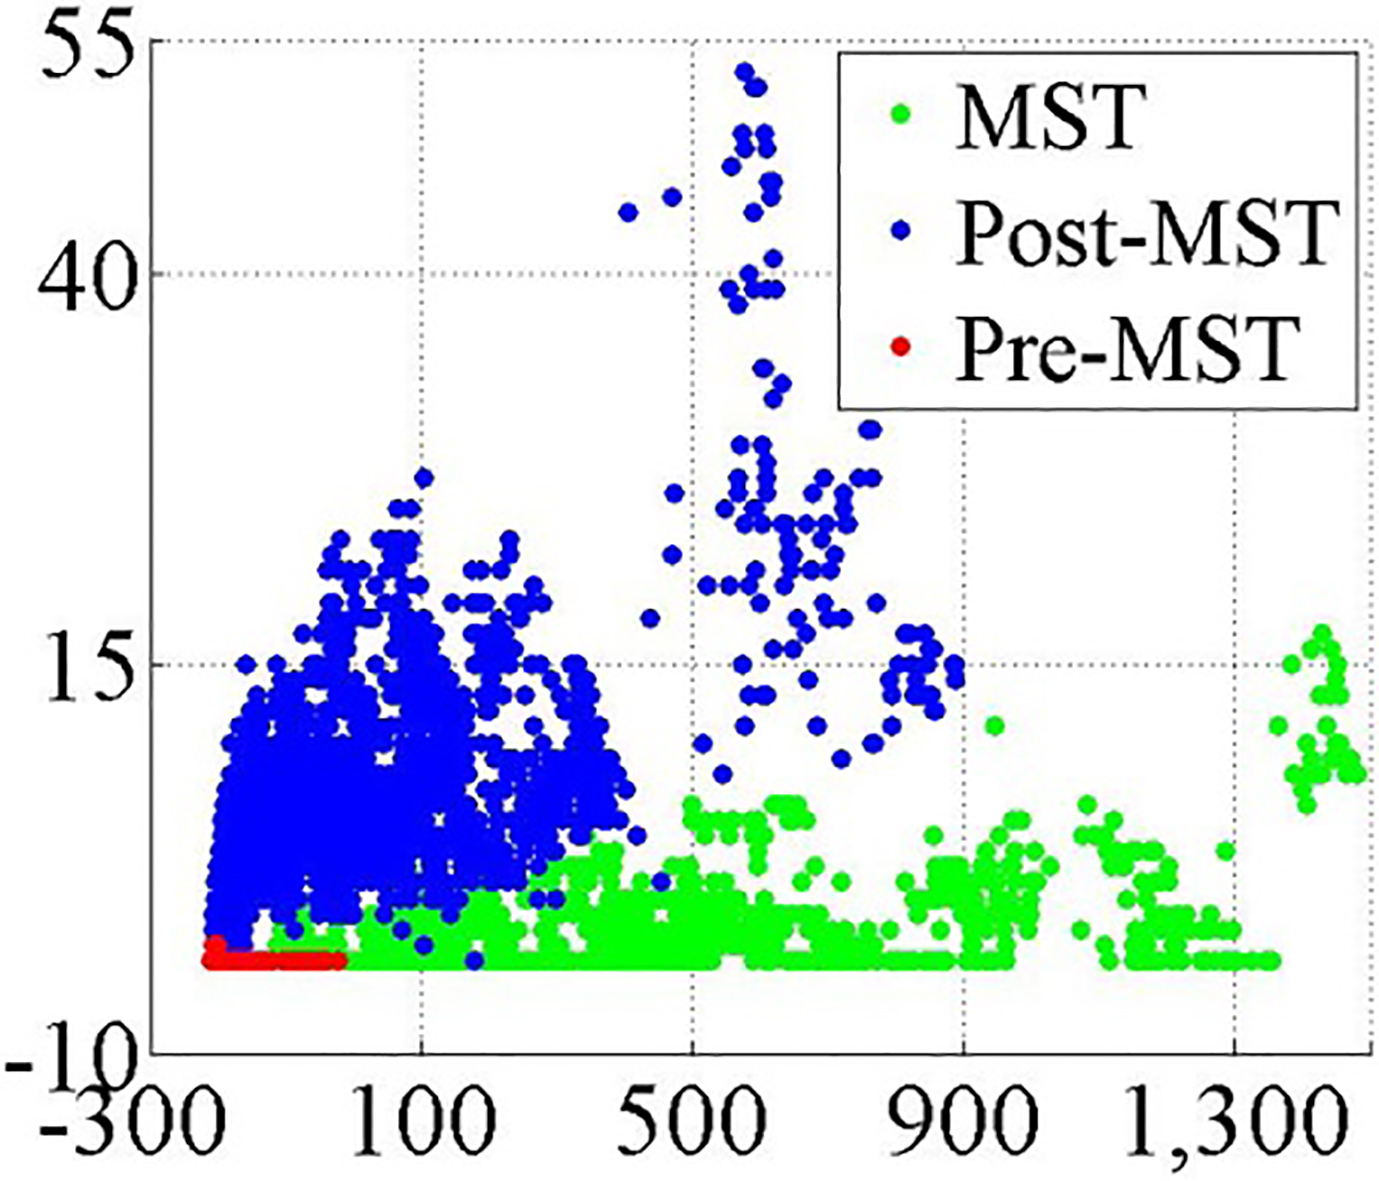
We also investigated how the proposed HSD performs against other sets of features generated by three common techniques.
The first one that we investigated generates a robust set of features based on a locally normalised HOG which has been extensively used for object detection [41]. This set of feature is based on evaluating a well normalised local histogram of image gradient orientations in a dense grid. Essentially Dalal and Triggs showed that HOG can be a good feature set to represent an object as local object appearance and shape can be characterised by the distribution of local intensity gradients. The HOG feature set is generated by dividing the image into small regions and accumulating a local one – dimensional histogram of gradient directions of the colour intensity for each region.
Scale invariant feature transforms (SIFT)
The next set of features investigated were widely used with high object recognition accuracies. SIFT basically involves generating a set of features sampled at a large number of repeatable locations using a staged filtering approach. With these features a simple nearest neighbour classifier was able to reliably identify the correct objects [42]. SIFT features were generated for the MST data.
Wavelets
The final technique was inspired by the work of Yu and Slotine [43] who developed an algorithm for the rapid categorisation of various types of images. Their proposed algorithm has a two-layered architecture where the first layer performs a wavelet transform followed by grouplet transforms in the second layer. It was able to generate a set of features which are both scale- and translation-invariant, achieving results which exceeded those from other state-of-the art techniques in object recognition. This was also used to generate a set of features from the MST data sets.
Feature sets generated from each of these three techniques were tested with kNN and their results summarised in Table 2. Amongst the features considered in this work, the proposed feature, HSD gave the best overall performance of 92.86% amongst the four features investigated.
Moreover, the HSD performed significantly better than any of the other 3 techniques for the pre- and post-MST tests. For these two classes, the average classification accuracy for the HSD features is 96.56% (97.09% pre-, 96.03% post-) compared with 92.59% (97.08% pre-,88.10% post-), 72.95% (70.63% pre-, 75.26% post-) and 81.94% (90.34% pre-, 73.54% post-) for wavelet, SIFT and HOG respectively.
The proposed technique offers a number of significant advantages over the existing manual MST determination. Firstly, it eliminates the subjectivity and inconsistency caused by human biasness, yielding an independent and yet more robust set of test results. Besides, it can assist the laboratory technician to identify the MST end point. Additionally, the proposed technique is simple and cost-effective, with minimum additional hardware needed – basically a DLSR camera and normal computer. Most importantly, the method fully complies with the ISO 35 testing standard for determining the mechanical stability of NR latex concentrate.
Conclusions and future work
Even though several techniques may be used to test the mechanical stability of the latex concentrate, a commonly used test that is widely adopted by the rubber industry is the one based on ISO 35 standard. Nevertheless there is a significant amount of subjectivity in identifying the end point due to either inconsistency in interpreting the results or human errors that are related to the human visual system. In this paper we proposed a computer-vision based solution to help determine the mechanical stability for natural rubber latex concentrate.
The proposed HSD feature set provides a good balance between classification accuracy with computational efficiency by exploiting the information on the distribution of coagulum size, generated from the ISO 35 standard that is widely used to determine the quality of NR latex. Our proposed computer-vision based approach is more superior to the conventional manual approach as it assists the human operators in their tedious manual inspection task. Only non-specialised and common equipment is needed to capture the images during the MST testing. Besides, the computation needed to generate the set of HSD features is neither huge nor requires additional or specialised computing hardware. The set of HSD features is also intuitively useful for human interpretation if necessary.
The results compares quite well too with the results of three other modern methods used to generate the feature sets. Among these three other methods investigated here, Yu and Slotine’s [43] two-layered wavelet-grouplet transform for image classification is known to be able to generate a set of features which are both scale- and translation-invariant. It has been reported that their two-layered wavelet-grouplet transform performed quite well, with results that exceeded those from other state-of-the art techniques in object recognition. And yet, our experimental results also showed that the HSD feature set was capable of differentiating the various MST classes with an average overall classification accuracy of 92.86%, surpassing the two-layered wavelet-grouplet transform and other feature sets. Furthermore due to its the implementation simplicity, the proposed HSD technique can facilitate cost-effective computerised mechanical stability test of natural rubber latex concentrate.
Despite having obtained encouraging results with this new approach there are several potential areas for improvement. Some preliminary work involving multi-thresholding of the MST images with artificial bee colony (ABC) have shown promising results [44], and this is something that can be explored further. Finally, we would like to investigate this approach on other types of colloids that are commonly used to manufacture a variety of industrial products.
Footnotes
Acknowledgments
The authors would like to acknowledge the support of Ministry of Education (MOE) Fundamental Research Grant Scheme under project number (FRGS/1/2014/TK04/TARUC/02/1) for the work reported here. The authors would also like to thank Chooi Pheng Khoo and her technical team at the R&D Department of Weir Minerals (M) Sdn. Bhd. who have unselfishly spent their time and effort to help us collect the data described in this paper. They have also been very patient in assisting us to identify the three main classes of the MST tests for NR latex concentrate on the images collected.