
Abstract
Passenger transport safety evaluation plays a very important role in the development of China’s railway. In order to obtain the optimal indicator weight in railway passenger transport safety evaluation, firstly, fuzzy theory and analytic hierarchy process are combined in this study to provide the change interval of each evaluation Indicator weight and generate different weights in every interval. Then it will generate evaluation results for different indicator weights through the simulation experiment of Monte Carlo Simulation and get the variance of evaluation results through quantitative methods. At last, the variance will be treated as the fitness function of genetic algorithm to do backward feedback to realize the optimization of indicator weight, and optimized weight will be used in the calculation of passenger safety evaluation result of all kinds of China’s railway companies. The experimental results show that the method can fine tune the weights on the basis of full respect of the experts’ evaluation of the index weights, and make the evaluation results more actually reflecting the safety management level of the railway company.
Keywords
Introduction
Evaluation flow chart.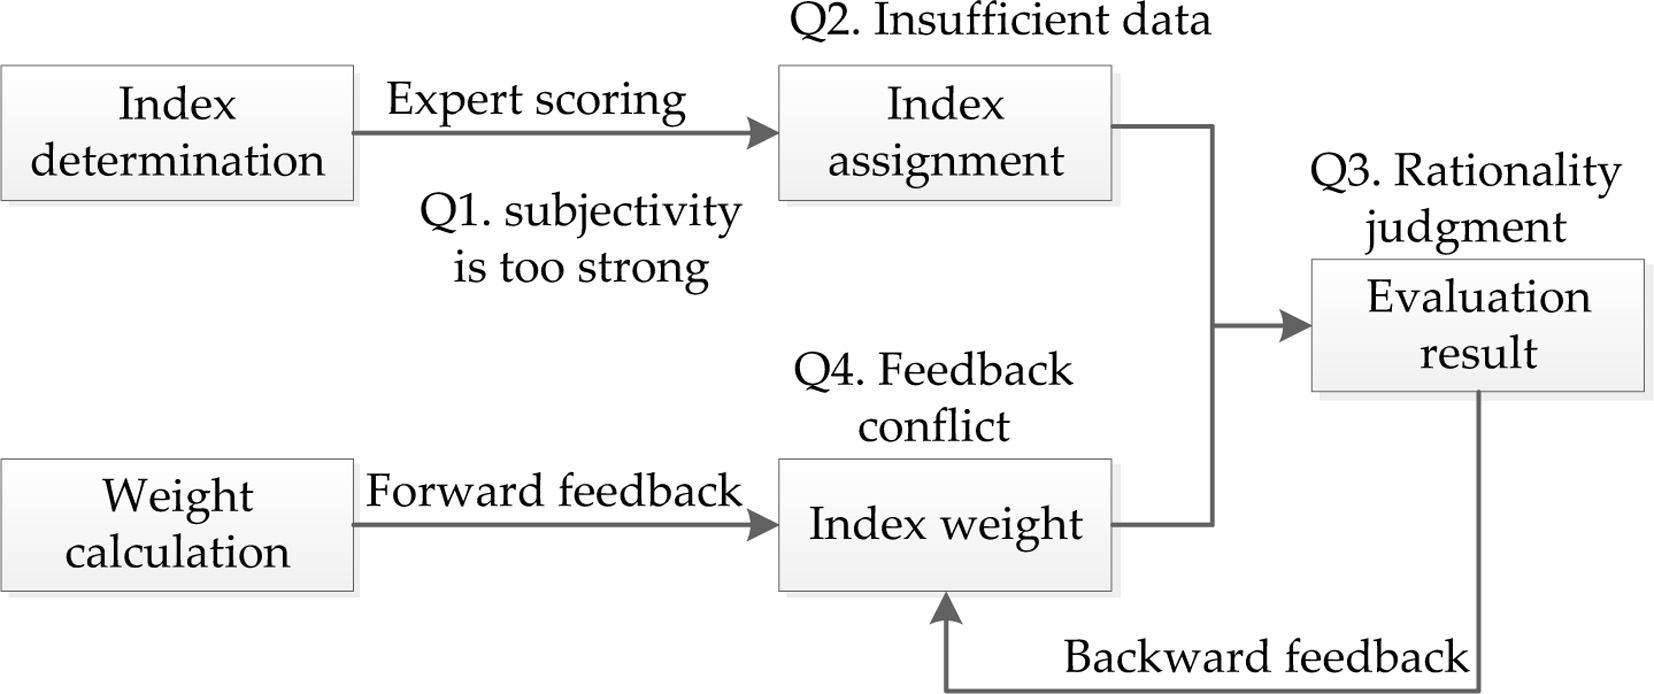
With the speed up campaign of existed railway passenger trains in China and more and more operated newly-constructed high-speed railways and intercity passenger special lines, the pressure of railway passenger transport safety has increased gradually, and risk type and risk degree have changed a lot. The improvement of the railway passenger transport guarantee not only depends on compliance with related work safety laws and regulations of transport companies but also needs the scientific and effective monitoring of governmental administrations. Under the long-term influence of government-enterprise integration in China’s railway, there are not too many studies of railway safety evaluation on the basis of government surveillance. In fact, many risk-based analysis methods for avoiding casualties and property losses have been developed, including pre-hazard analysis (PHA) [1], fault tree analysis (FTA) [2, 3, 4], safety check list [5], risk matrix analysis [6, 7] and risk probability analysis [8, 9]. These methods make a significant contribution to security risk management in the complicated decision-making environment. However, all these studies evaluated the railway passenger safety status from the perspective of post-evaluation, and the number of accidents, casualties and severity were set as the main decision-making variables [10, 11]. In fact, there are many other factors that will affect the safety management level of railway passenger transport, and the effects of different indicators on the evaluation results are different. In general, most of the existing studies use indicator weight to distinguish the impact of different indicators on evaluation results. In the process of railway passenger transportation safety evaluation, the weights of different indicators are usually determined by expert rating method [12, 13]. And different weight scores have a great influence on the evaluation results. Therefore, how to determine the index weight reasonably becomes the key problem of railway passenger transportation safety evaluation.
At present, the weight determination methods of comprehensive evaluation at home and abroad mainly include three types [14, 15]. One is subjective empowerment, such as expert rating, Delphi method and analytic hierarchy process (AHP) [16]. The second type is the objective weighting method, such as entropy weight method [17], variation coefficient method and correlation coefficient method. Another method is the combination of subjectivity and objectivity [18, 19]. First, the weight is determined by subjective weighting method, and then the comprehensive treatment is carried out by systematic method [20, 21, 22, 23, 24], such as ELECTRE method, fuzzy comprehensive evaluation method, PROMETHEE, etc. In general, index weight is directly given by experts in the field of rail safety evaluation, which makes the weights is highly affected by the expert preference. In order to avoid the negative effect, on the basis of the initial weights, fuzzy set method is applied to generate the weight change interval. And then, the optimal weight is obtained by judging the variance of the evaluation result. In other words, the weight vector which can maximize the variance of the evaluation result is the optimal weights.
For some preventable potential dangers and risks, prevention and control are mainly conducted in terms of performance examination of safety personnel [25] instead of proposing clear safety evaluation methods in terms of safety risk theory. Figure 1 displays current solutions and existing problems of this issue. It can be seen from Fig. 1 that this evaluation issue has some problems as follows: Firstly, the evaluation value of qualitative index is obtained by expert scoring, and it has strong subjectivity compared with objective data obtained by accurate calculation method [26]. Secondly, the quality and quantity of the qualitative evaluation are limited, the randomness and uncertainty of the evaluation results are consequently further amplified. Thirdly, related methods of quantitative analysis of pros and cons of evaluation results are inefficient, especially in soft projects like railway passenger transport safety evaluation. There is no standardized evaluation result to be compared with evaluation results from design plans. Thus indicator weight cannot be adjusted through evaluation results to form a feedback mechanism. The last and the most important point is that indicator weight is adjusted by expertise of experts, consistency check and other forward feedback mechanisms generally. Thus how to avoid the conflict between the two feedback mechanisms should be taken into consideration when constructing the backward feedback mechanism.
Some relevant solutions are presented in this study to solve above – mentioned problems as shown in Fig. 2. Thereafter, based on the new evaluation flow, this study combines fuzzy theory and analytic hierarchy process together and designs a method for indicator weight optimization to be used in the railway passenger transport safety evaluation system in China.
Railway passenger transport safety evaluation indicator system
Evaluation flow chart after improvement.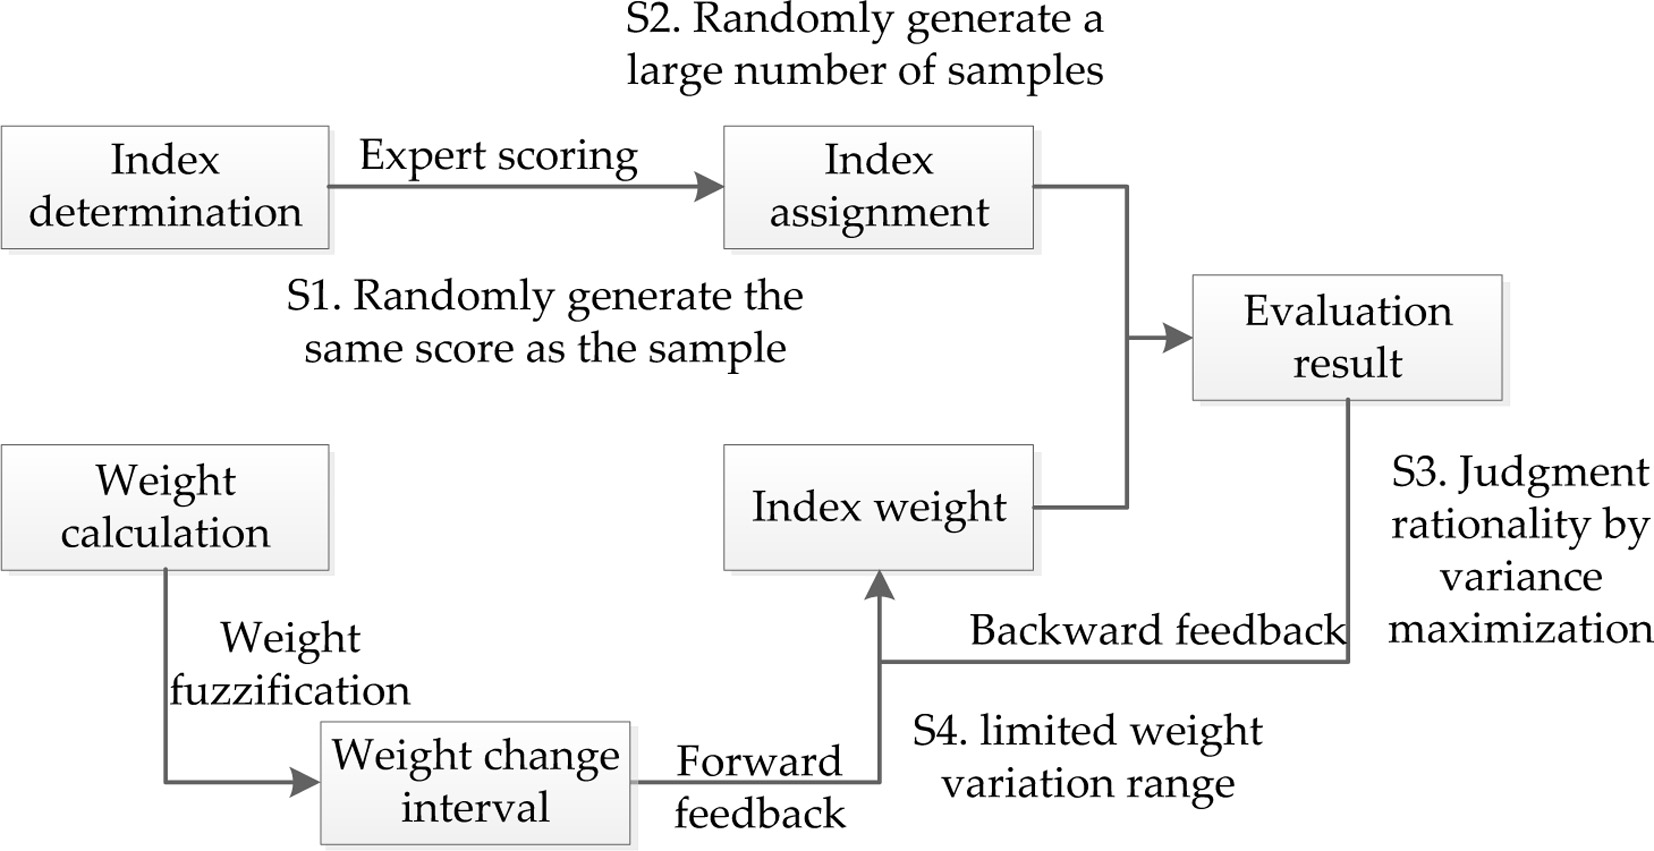
Selection of evaluation indicator
According to the risk management theory [27], there is a strong causal relationship between railway passenger transport safety and risk. Only by recognizing risk sources and risk factors in the process of railway passenger transport effectively can the passenger transport safety guarantee be improved effectively. Thus, from security supervision perspective, some preliminarily possible risk sources in railway passenger transport are recognized in different views of external passenger safety sensing and railway system internal management in this study. On the basis of 6 types of risk sources, an indicator system contains 12 evaluation contents is established as shown in Table 1.
Calculation of initial weight
In view of the small amount of sample data obtained in this study, the initial weight is determined by using subjective methods. As Delphi method is easily influenced by subjectivity when the amount of samples is small, the deviation is large. Thus AHP method is chosen to be the preliminarily calculation method for setting the weight in this study. Main procedures of AHP are including: establish the system hierarchical structure, and construct two-two comparison judgment matrix and consistency check. The forth column of Table 1 displays the indicator preliminary weight through AHP.
Generation of weight change interval
There is a great deal of randomness in the light of the expert selection and expert scoring. Therefore, the fuzzy theory [28] is used to determine the change range of the weight value in this study and the search space of the optimization algorithm is determined.
Confirmation of membership function
First, choose fuzzy set
where,
For parameter setting, in order to fractionize the indicator weight, this study gets the variance of normal membership function through the interval range formed by the initial weight. This means making the intercept (width) of fuzzy set
Membership function parameters
Gauss membership function.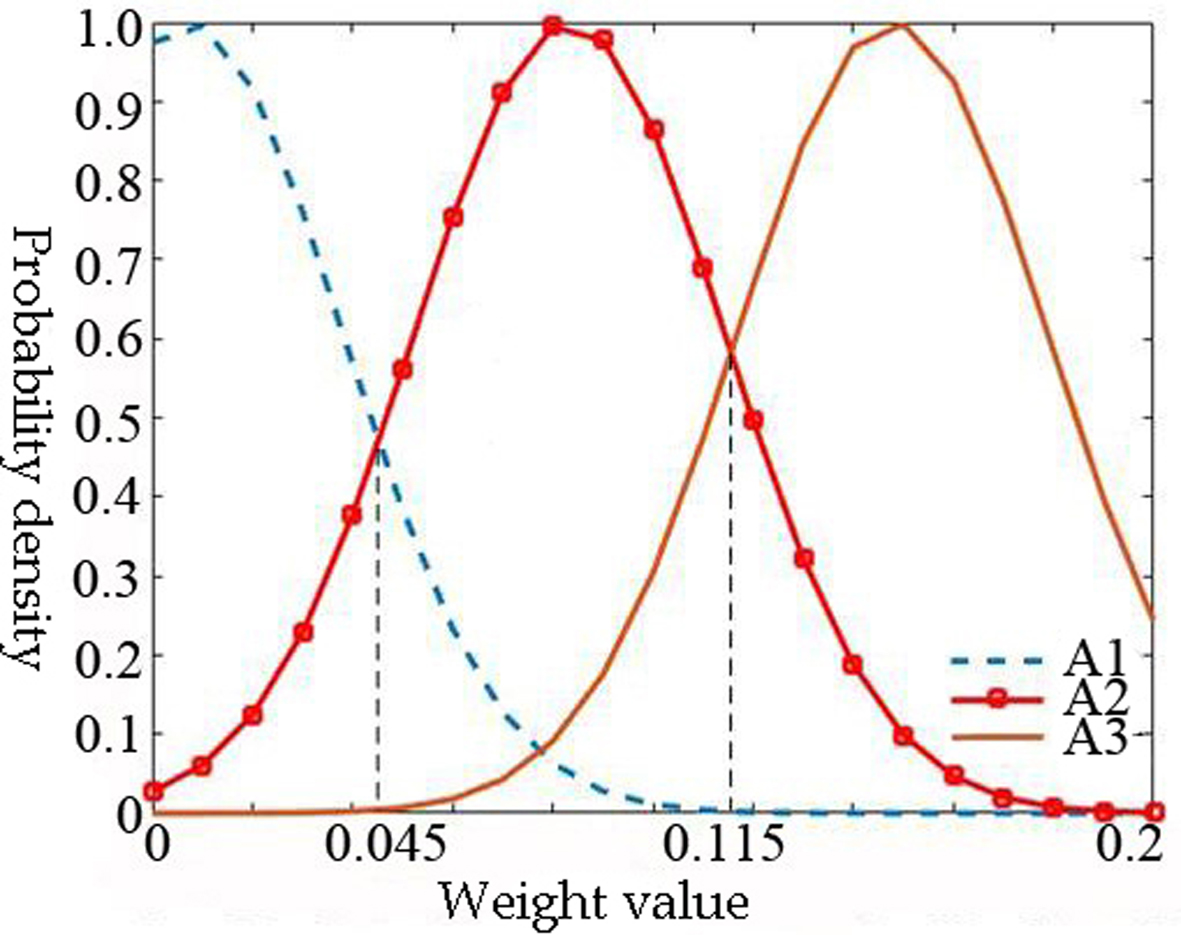
Firstly, the membership is calculated by using the initial weight value of each indicator. Then according to the Maximum Membership Principle, it is determined which level each of the 12 initial weight values belongs to. The purpose of this research is to ensure that the weight change of each indicator does not exceed its current level. Therefore, it can be calculated that the abscissa of the intersection of the three membership functions in Fig. 3 is 0.045 and 0.115 (i.e. the threshold of the three grades division). As a result, the weight interval of each indicator can be determined as shown in Table 3. The third column of Table 3 shows the fuzzy level of the weight of each indicator that is determined by the Maximum Membership Principle. The fourth column shows the interval of the fuzzy set that each indicator belongs in (i.e. the allowed range of the indicator weight changes).
Range of weight values
Range of weight values
Generation of indicator score
In order to simulate the evaluation process, this research generates 12 sets of random numbers based on 12 safety evaluation indicators. In each set of data, there are 5000 random integers ranging from 0 to 100, which are the initial scores of the indicators. An analysis of the scores given by experts indicates that the data generally obey the normal distribution. Therefore, in order to be as close as possible to the actual situation, all the 12 sets of data are generated based on Lindeberg-Levy central limit theorem, as shown Eq. (4.1). The data generated are random number sequences that follow the normal distribution, and they share the same mean values and variance with the data obtained from expert survey.
where,
This equation illuminates the main principle of the central limit theorem. If the random variable sequence
(a) Comparison of different variance results; (b) Comparison of different variance results.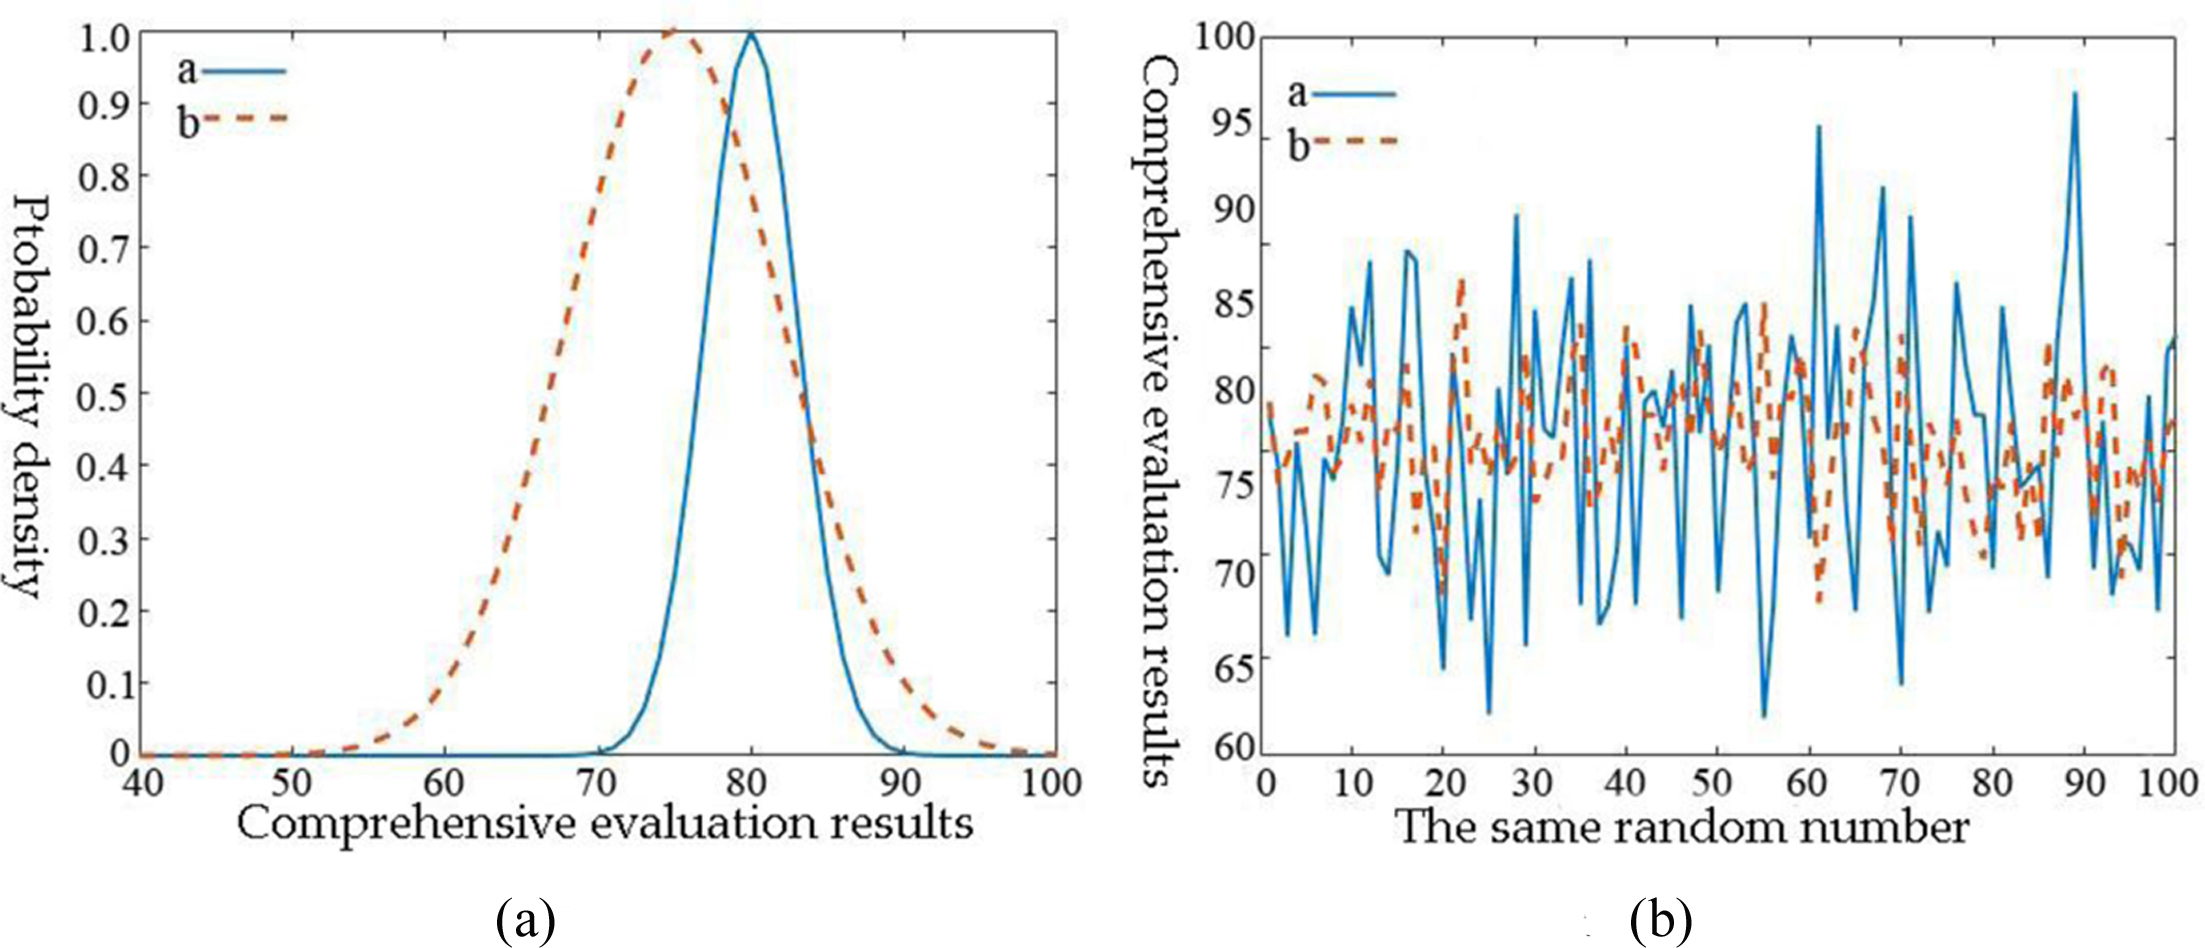
In order to obtain more accurate evaluation results, it is necessary to find the right indicator weight. And the greater the variance of the evaluation results is, the better the different evaluation objects can be distinguished, so we think that the indicator weight that maximizes the variance of the evaluation results is the optimal weight. In other words, the variance of the evaluation result is the criterion to get the best weight. In this research, the results of the railway passenger safety evaluation are summed with multiple indicators’ weighted scores. Based on the random score data mentioned above and the initial indicator weights, this research obtains a set of evaluation results that contain 5000 data, which are used to simulate 5000 times railway passenger safety evaluation. Different combinations of random scores and indicator weights will produce different evaluation results. Therefore, this research will take a pair of indicators as chromosomes and its corresponding variance as a fitness function, so as to design a genetic algorithm to solve the following mathematical problems:
Subject to
where,
In this research, the basic idea of conducting negative feedback adjustment of the indicator weights based on the variance of evaluation results is that: if the change of one of the indicators has no significant influence on the final evaluation result, then the weight of this indicator should be zero; otherwise, if the evaluation results vary on one indicator, then this indicator should be given a greater weight. Variance is an important indicator of the degree of divergence in statistics. Following the idea of variance maximization, a set of weights should make the total variance of the corresponding evaluation results reach the maximum [30], so that the evaluation results can be more reasonable in explaining the actual situation in terms of the overall coverage and the sensitivity to the score, as shown in the following figures.
It can be seen from Fig. 4a that for the two groups of evaluations results generated through different indicator weights, the evaluation results of Group A, whose variance is larger than the other group, ranges from 54 to 100, while the evaluation results of Group B ranges only from 70 to 90. Apparently, the evaluation results of the first group appear more conducive to distinguishing different security situations of railway enterprises in safety evaluation work. Furthermore, larger variance can also contribute to a more uniform probability distribution of the evaluation results. Figure 4b shows the details. As for the two sets of evaluation results generated through the same random numbers (100 numbers are randomly selected), the evaluation results of Group a, whose variance is larger than the other group, has a more dispersed distribution and a more volatile fluctuation. This indicates that the evaluation results of Group a have a better sensitivity to the change of score, and it can reflect the change of evaluation results caused by the change of score in a more intuitive manner.
Genetic algorithm is a computational model which simulates the natural selection and genetic mechanism in the process of biological evolution in Darwin’s theory. It is a method to search for the optimal solution by simulating the natural evolutionary process. In the genetic algorithm designed in this research, one chromosome is composed of a set of indicator weights. Therefore, the main problem to be solved is to ensure that the offspring chromosomes that experienced mutation and crossover can still meet the requirements of the formula 6, that is, the sum of their weights is one. In this research, the problem is solved by using the method of single-point crossover: first of all, when the two parental chromosomes cross at any of the gene positions, the sum of genes will change. This change will be shared by the other 11 genes that are not crossed, in order to maintain the sum of genes of the offspring chromosomes as 1, as shown in the Fig. 5.
Single-point crossover.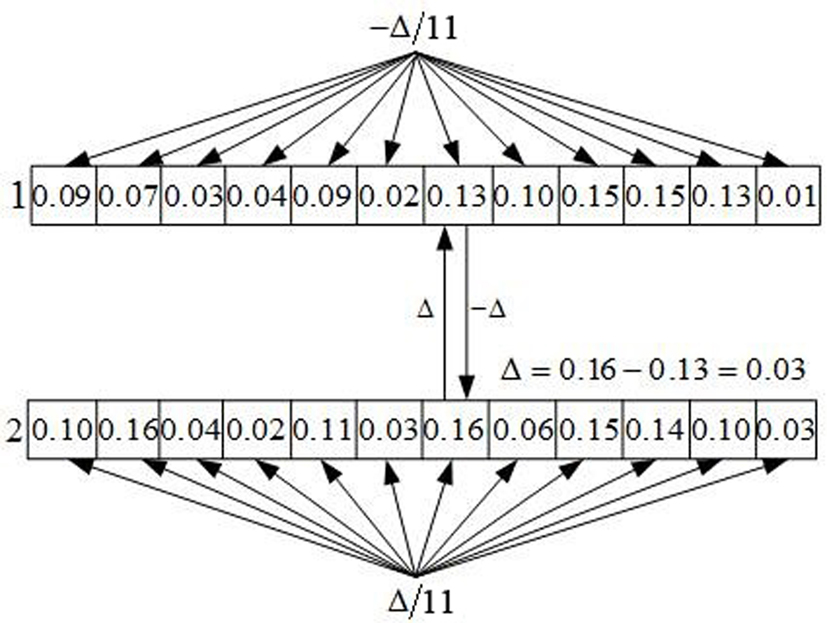
Weight optimization and evaluation results
It can be seen that as the sum of genes of chromosome 1 increases by
Convergence of genetic algorithms.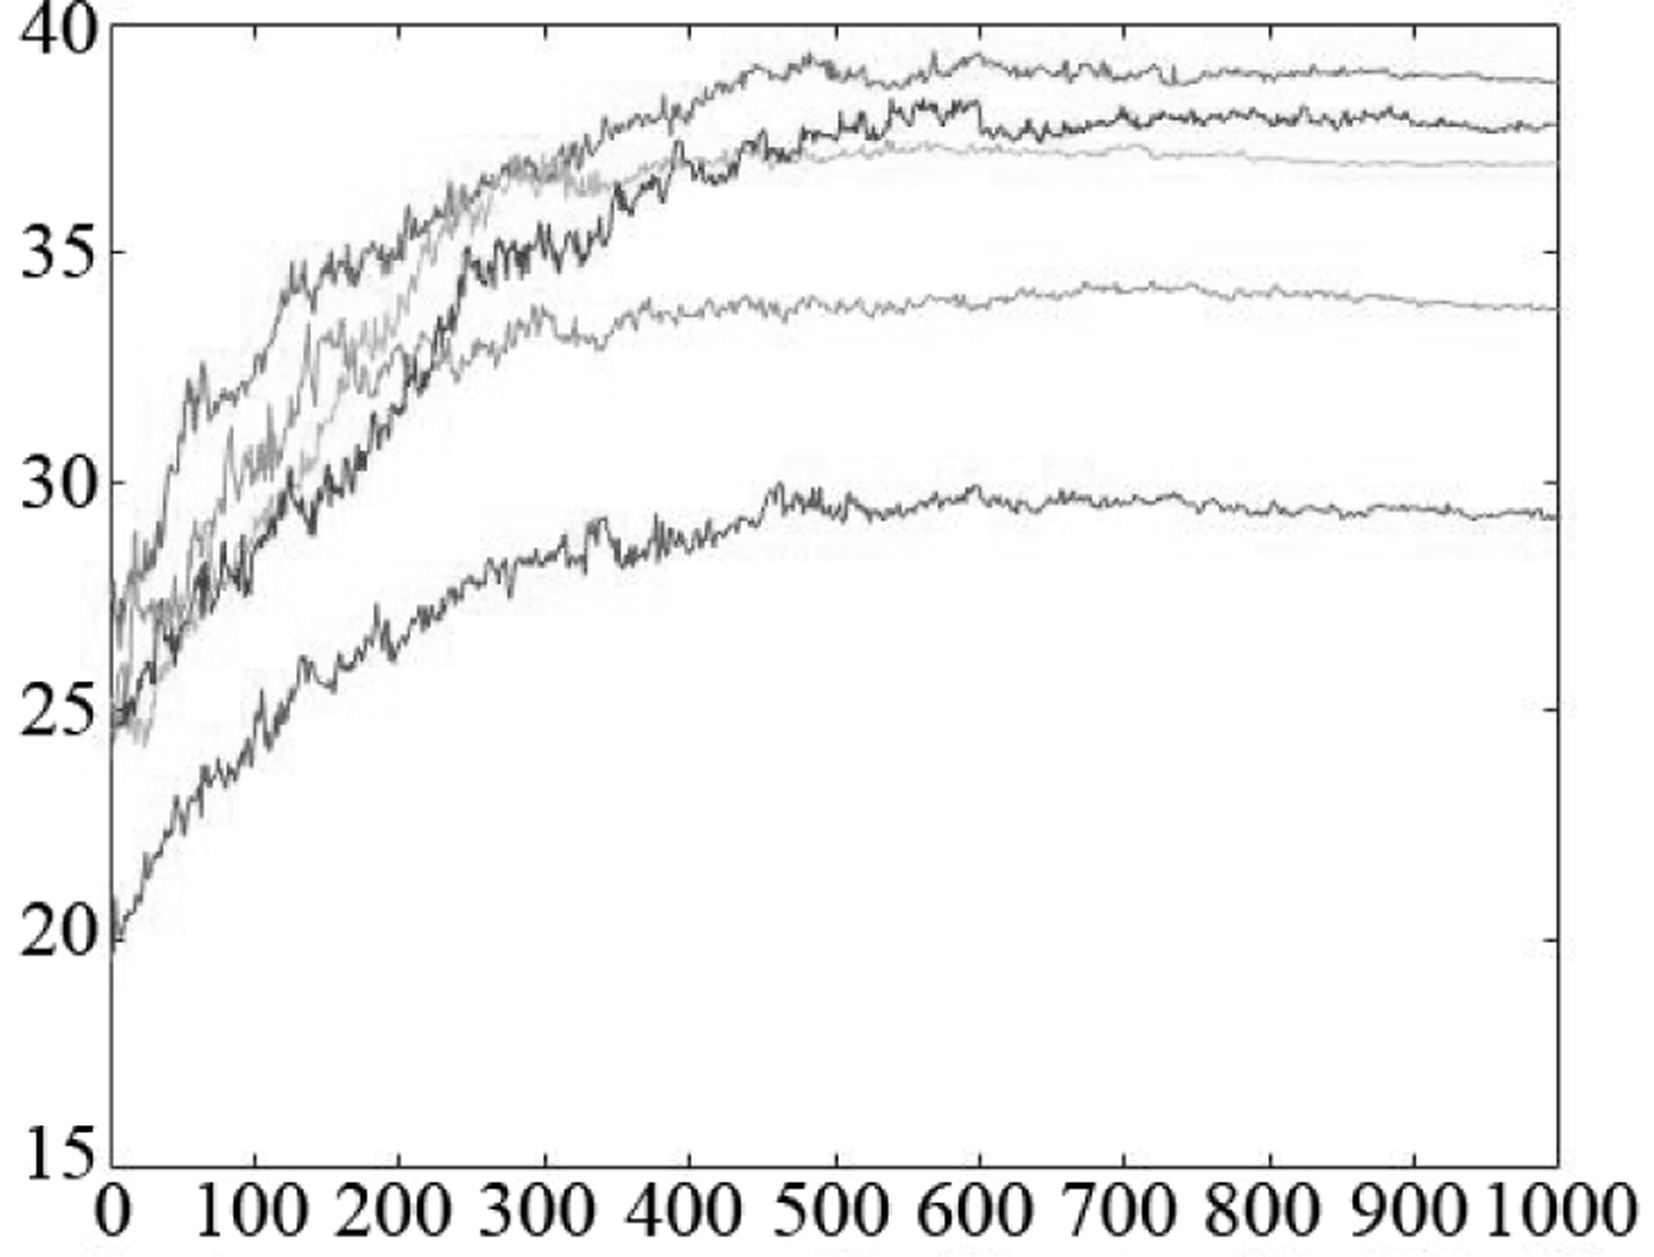
This research optimizes the indicator weight based on the randomly generated scores, the weight intervals obtained from experts’ research and the fuzzy theory, and the genetic algorithm designed. The algorithm runs five times in total, each based on a different set of random scores. The crossover probability of the algorithm is set to 0.9, and the maximum number of iterations 1000. Figure 6 illustrates the convergence of genetic algorithms.
As can be seen from Fig. 6, in the optimizations based on different random scores, all the algorithms converge around 500 times. For the sake of generality, the mean value of the optimal chromosomes in the five optimizations is taken as the final indicator weight, and will be used in the calculation of the evaluation results in real projects (see Table 4). The last column of Table 4 shows that there are large changes in the weight of some indicators. The main reason is that the initial weight is completely dependent on the experience of experts, ignoring the impact of different index attributes on the evaluation results. A more objective and reliable evaluation calculation should be achieved based on the optimized weight indicators and the experts’ scores.
Conclusions
Based on the feedback adjustment mechanism derived from the multiple attribute decision making (MADM) problems, fuzzy theory and analytic hierarchy process (AHP) are proposed in this study to solve the expert preference problem. The preference effect of initial weight on the evaluation result is weakened by generating weight change interval. To some extent, it solves the problem that the past methods rely on subjectivity. Moreover, a quantitative method based on the maximizing variance is proposed in this research for determining the indicator weight in the railway safety evaluation. The stochastic numerical simulation method is introduced into the optimization algorithm to solve the problem of small sample size. Finally, genetic algorithm which is one of heuristic algorithms is applied to the optimization model for obtaining the optimal weights. According to the empirical analysis of railway passenger transportation safety evaluation, the empirical results show that the optimized method is proposed in this research is more effective than subjective method. It can better reflect the actual safety management level of railway enterprises
Footnotes
Acknowledgments
This research is supported by the National Natural Science Foundation of China (71571011) and Fundamental Research Funds for the Central Universities (2017YJS110).