






Abstract
Traditional standing long jump measurement relies only on visual reading and manual recording, which makes the recording of data subjective and arbitrary, making it difficult to ensure the accuracy and efficiency of long jump performance. To address the shortcomings and deficiencies of traditional measurement methods and to avoid the interference of subjective bias on results, the research aims to provide a more accurate, automated, and objective measurement method. Furthermore, the research will provide new technological means for the measurement of related sports projects. In contrast to the utilization of human motion recognition technology, the study introduces image recognition technology into the domain of standing long jump testing. This technology enables the calculation of distance through the application of image processing and perspective transformation algorithms, thereby facilitating the realization of a distance measurement function. Specifically, this includes using wavelet decomposition coefficients and morphological denoising to improve the performance of wavelet threshold denoising, achieving feature extraction of image edge information, adding vibration sensors and CNN algorithms to adjust the angle of offset images, and designing a multi-step long jump distance measurement system. The combination of wavelet decomposition coefficients and morphological denoising utilized in the study demonstrated lower mean square error (50.8369) and signal-to-noise ratio (24.1126) values, with a maximum accuracy of 96.23%, which was significantly higher than the other two comparison methods. In the context of different feature information recognition, the ROC curve area of the algorithm model proposed in the study reached over 85%, with a deviation in the dataset of all below 0.5. The minimum absolute and relative errors between the measurement results of this method and the actual test results were 0.01 cm and 2%, respectively. The overall deviation of the system was 0.35, indicating high stability. The proposed long jump measurement system has the potential to enhance the efficiency of testing for the standing long jump, while also forming a complementary mode with traditional distance measurement systems. This could collectively serve the intelligent instrument market, providing technical means for the development of sports teaching projects.
Introduction
The standing long jump is a common and important test in sports, occupying a significant position in school physical education curricula. The traditional method of measuring long jump results often relies on subjective judgment and operational skills of the measurement personnel, resulting in inaccurate results and low measurement efficiency [1, 2]. Therefore, developing an automated and high-precision standing long jump measurement system is of great significance for promoting the development of sports and evaluating individual physical fitness. The current approach to measuring and recording sports test data relies primarily on manual recording, which is susceptible to subjective judgment and external environmental factors such as visual angles and personal experience. This can affect the accuracy and fairness of the results [3]. The application scope of relatively intelligent instruments and equipment is relatively narrow, and their popularity is greatly limited. Furthermore, manual recording of sports data is greatly influenced by subjective factors, and information transmission in multiple layers can lead to data omissions or errors.
The most commonly used ranging techniques rely on laser or visual processing methods. However, the data range of laser measurement is limited, and its measurement accuracy is affected by factors such as instrument equipment failures, time delays, and signal frequency modulation. Furthermore, in complex external environments such as changing lighting and weather conditions, the stability and accuracy of standing long jump distance measurement may be affected. Previous studies have predominantly employed human posture visual technology and visual positioning algorithms for long jump distance measurement, or utilized video images to ascertain standing long jump outcomes. However, the prevailing approach was to analyze the limb movement characteristics of long jumpers, with comparatively less discourse on image distance measurement-related technology [4]. The edge detection algorithm for determining the landing point of long jump is a pivotal determinant of ranging accuracy. Previous studies have predominantly employed human posture visual technology and visual positioning algorithms for the measurement of long jump distances, or have utilized video images to determine standing long jump results. However, the prevailing approach has been to analyze the limb movement characteristics of long jumpers, with less discussion on image distance measurement-related technology. The edge detection algorithm for determining the landing point of long jump is a crucial element in achieving accurate ranging. Previous research on edge detection techniques may be limited by factors such as resolution and contrast, which can result in misjudgment of the position of long jump points. Additionally, the state of the long jump is affected by various factors, including inertial posture, jumping direction, and training intensity. Furthermore, standing long jump involves numerous steps, making it challenging to comprehensively grasp its ranging situation through simple posture recognition. The research employs image processing technology and region detection methods to enhance the identification of long jump landing point images, minimize errors, and ensure that the recognition of edges and key features is not compromised by noise interference. A systematic design was implemented based on the motion characteristics of standing long jump, encompassing image denoising and region detection. The designed standing long jump ranging system is comprised of three main components: a standing long jump data acquisition system, a long jump image recognition system, and a long jump performance display platform. The long jump data acquisition system is primarily responsible for the retrieval and storage of user information, as well as the collection of long jump image signals and foul signals. The long jump image recognition system is divided into three distinct stages: image preprocessing, image target extraction, and image recognition ranging. The performance display platform is responsible for the display and management of user performance data. This recognition method effectively enriches the theoretical content related to sports image ranging recognition and provides practical reference value for current physical fitness testing research.
Literature review
For the complexity of human motion, WesternK et al. proposed an optimal inverse control method, which is used to control and analyze the data of Standing long jump at different distances under the assumption that the control target is relatively static. At the same time, relevant motion strategies are proposed to better grasp the dynamic data of control targets and jump trajectories. The experimental results showed that this control method can effectively analyze the motion state process and help long jumpers improve their professional level [5]. Beato M et al. analyzed the effect of different levels of inertia on the effect of overload on the long jump, i.e. the subjects were asked to perform horizontal and vertical jump changes under moderately light and high inertia exercises. The results showed that centrifugal overload exercise was effective in activating the athletes’ physical performance, increasing their long jump performance and the rate of reverse movement [6]. Becker et al. analyzed the mechanisms influenced by focus during the preparation and execution phases of the vertical jump, so that the subjects were subjected to two separate jumping experiments with internal and external focus as different constraints. The results showed that the external focus produced better jump performance, while the focus had a strong positive performance effect in the execution phase [7]. Taha Z et al. took archers as the research object and introduces hierarchical clustering analysis and support vector machine to conduct experimental analysis on their physical fitness changes and physical fitness indicators during exercise. The experimental results indicated that the experimental model can effectively evaluate the professional skill level of athletes and identify high potential athletes [8]. Musa RM et al. proposed to analyze athletes’ skill parameters and ability levels by neural network and clustering classification model. The results showed that the method has better classification accuracy for the assessment indexes, and its classification accuracy exceeds 90%, which can effectively provide targeted input for sports talent training program [9].
At the same time, there are often noise issues in sports images, making them difficult to recognize and judge. Sun B scholars proposed a coupled diffusion model for image feature extraction and denoising to solve the problem of poor image quality of martial arts competition video. The results showed that the equation model can transfer the direction of positive and negative gradients, with a diffusion ratio exceeding 60%. It can effectively process image results and provide a good evaluation tool and means for improving the skill level of athletes [10]. The quality of the images of sports algorithms under the automatic control of the physical system can be compromised to a large extent, so Rosney S et al. proposed to fix the dynamic view with a wide-angle detection network and to automate the processing of sports broadcasts with the help of neural networks and view simulation algorithms. The results showed that the algorithm can effectively automate the processing of images and apply a high degree of accuracy [11]. Based on the current issue of low accuracy in track and field target detection, Zhang Y et al. used deep learning to perform minute analysis on moving targets and implemented image denoising using adaptive differential methods. At the same time, morphological filtering was introduced into the method to process the Binary image, and the human body was classified and recognized with the help of proportion. The results indicated that the modified parameters set by this research method greatly alleviate the detection error situation in deep learning, and have high detection accuracy and efficiency [12]. The motion of the image target in sports video makes it more difficult to propagate the video. Yang X et al. designed a vision system supported by computer big data technology and analyzed the motion images with the help of background frame difference. The results showed that the system has a good visual propagation application with good detail content and clarity of the image [13]. For the problem of noise in image information processing, Shen W proposed to generate confrontation conditions with graphical attention networks, which in turn enables the extraction of feature details and constructs a compound loss function. Experimental results demonstrated that the algorithm can effectively reduce the interference of noisy data on the basis of ensuring image quality information [14]. Pu proposed an improvement to the system analysis design using motion video. The results demonstrated that the system is effective in extracting motion training image information and that its performance in key frame and recall metrics is good. This is highly instructive for application [15].
In summary, the state of long jump movement is influenced by factors such as inertial posture, jumping direction, and training intensity. Some scholars have used clustering analysis, support vector machines, and neural networks to evaluate the skills of participants in motion, and the results have also proven that this method has good recognition performance. Although predecessors have carried out a lot of research on the long jump, the Standing long jump itself contains many steps, and its image will be affected by background noise and inspection accuracy, which will be different. The above scholars have a broad research level but lack more detailed content. Therefore, according to the action characteristics of the Standing long jump, the system design is carried out from image denoising and area detection, which can better avoid the above drawbacks and provide a better detection means for data reading.
Exploring the application of automatic distance measurement for standing long jump based on image denoising and area detection
In order to better realize the realization of the automatic distance measurement system for Standing long jump, the research is discussed from two aspects. First, a long jump measurement and recognition system based on image denoising and area recognition is proposed, and it is realized from three aspects of image preprocessing, image denoising, and distance measurement algorithm design to improve the accuracy of image information processing. Then in the second part of the method, based on the actual application of the Standing long jump, the system design is carried out, and the database design, data transmission and data output are analyzed to better improve the application and effectiveness of the system design. The objective of this research is to develop an automated distance measurement system for the standing long jump. This system will be designed to address the limitations of traditional long jump performance measurement methods by leveraging the characteristics of standing long jump movements. The system will be based on two key components: image denoising and region detection. The schematic diagram of the system model proposed in this study is shown in Fig. 1.
Schematic diagram of the overall research methodology.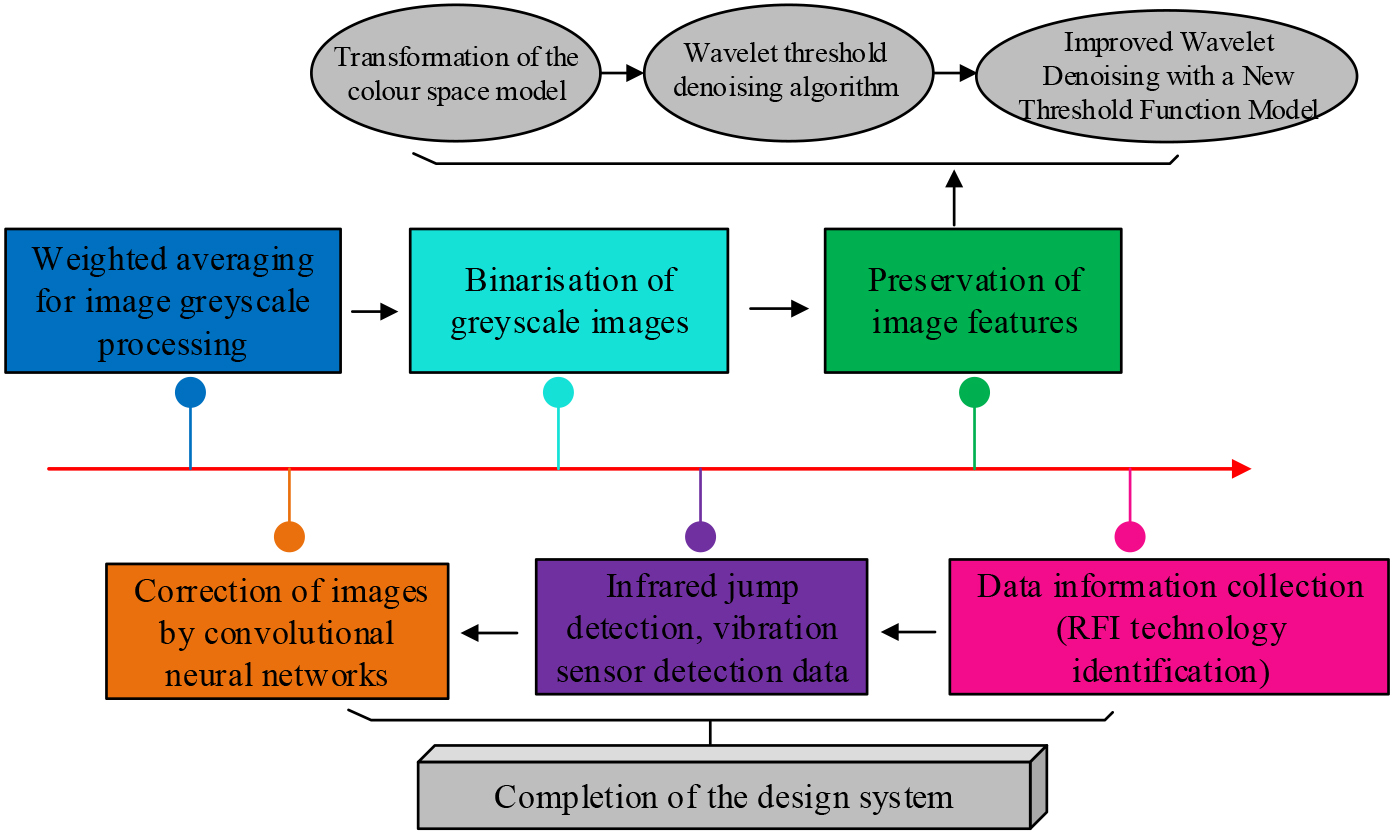
The long jump data is collected and then analyzed for image recognition, and the distance measurement process is achieved through image pre-processing, test area extraction and area measurement respectively, wherein the image pre-processing part, the image data is greyed out and binarised to achieve image information recognition. Grey-scale processing of images means changing the luminance value in the image pixels for change, i.e., changing the pixel point component value in the color image. Common grey-scale processing methods include the maximum value method, the average value method and the weighted average method. The common grey scale methods include maximum, average and weighted average. The grey scale transformation of color images is to avoid the interference of excessive information in the color image to the extraction of key information and to reduce the complexity of the image. The maximum and average methods use the maximum and average values of the three components of the color image as the greyscale values, but these two methods are more likely to lead to distortion of the lightness and darkness of the image, making it difficult to retain and extract the image properties and luminance information [16, 17, 18]. In this study, the image is greyed out with the help of a weighted average and the greyed-out image is binarized, i.e., the grey value of the pixel is set to 0 or 255 and an appropriate threshold is selected to reflect the characteristics of the whole and part of the image, so that the image is presented in a better way while retaining the characteristics. The binarisation of the grey scale image is done to distinguish the background area from the target area, and when the color difference between the two types of areas is large, the study is carried out with the help of the maximum inter-class algorithm. The probability of setting the image grey level to
At the same time, there are differences in the grey scale characteristics of different images and the probability of occurrence of the target image
In Eq. (2),
In Eq. (3),
Schematic diagram of two models.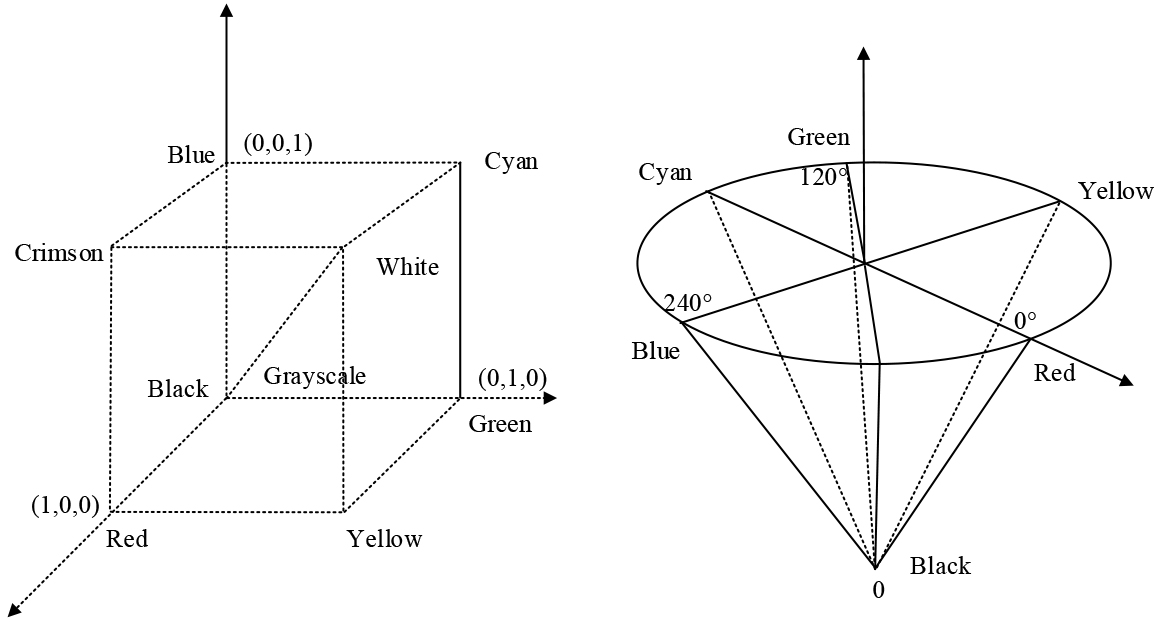
The RGB model is mainly based on the red, green and blue primary colors as the three-dimensional spatial axes, where the numerical difference between black and white can be expressed as a difference in greyscale; the HSV model is based on the parameters hue, saturation and lightness, which indicate the overall warm and cold atmosphere, the proximity to the spectral colors and the brightness of the colors respectively. The conversion and stereoscopic rendering of color images with the help of color space mean that the initialized HSV model thresholds are bound to the sliders and the read-in images are thresholded for application. The conversion formula for the two color models is shown in Eq. (4).
In Eq. (4),
In Eq. (5),
In Eq. (6),
Schematic diagram of opening and closing operation.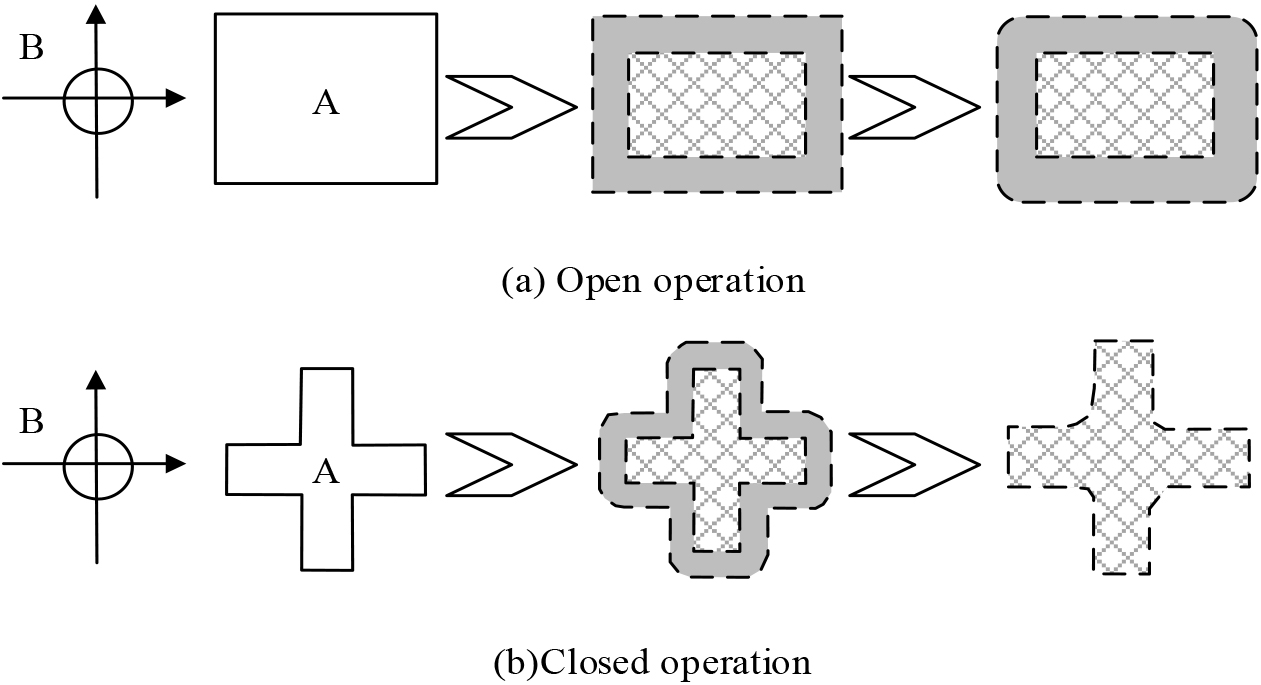
Finally, the test area is calibrated and the redundant background image is removed by means of the maximum connected area method. Here the area transformation is carried out by first detecting the corner points of the area and then transforming the quadrangular coordinates with pixel point information through a perspective transformation to obtain a three-dimensional image plane in three-dimensional space. This is often done by means of interpolation and boundary filling, so that the perspective transformation ensures that the spatial points are restored within the limits of the transformation parameters. The transformation formula is shown in Eq. (7).
In Eq. (7),
In Eq. (8),
The system is designed in terms of data acquisition, image recognition and result display. The data acquisition part consists of six modules, including authentication, image acquisition, test area, jump detection and landing detection. The BCM2837 chip and Linux kernel processor operating system are chosen as the controller to ensure better performance of the system. Figure 4 shows the overall flow diagram of the long jump system.
Overall flow chart of long jump system.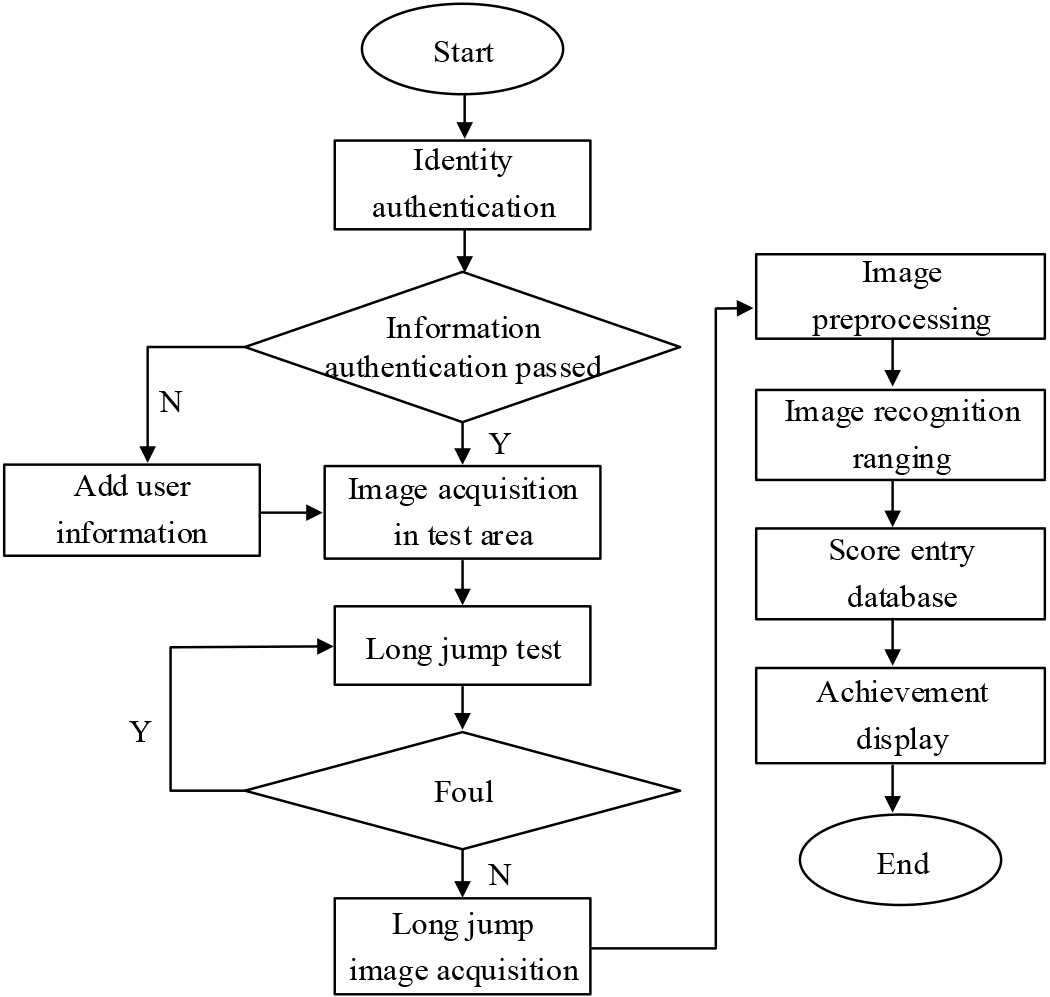
In the preparatory phase of the jump, the infra-red alignment device can be employed to ascertain whether the user has fouled, that is, whether the alignment light from the device is parallel to the jump line. Once the user’s toe exceeds the jump line, the infra-red fiber optics will be shifted to block it, prompting the microcontroller to commence operation and triggering the alarm alert device. When the user has completed the long jump test, there is a small deviation in the vibration generated by the ground on which the user stands, so the sensitivity of the landing detection will have an impact on the user’s long jump performance. Figure 5 shows the design of the long jump acquisition system.
Schematic diagram of long jump acquisition system design.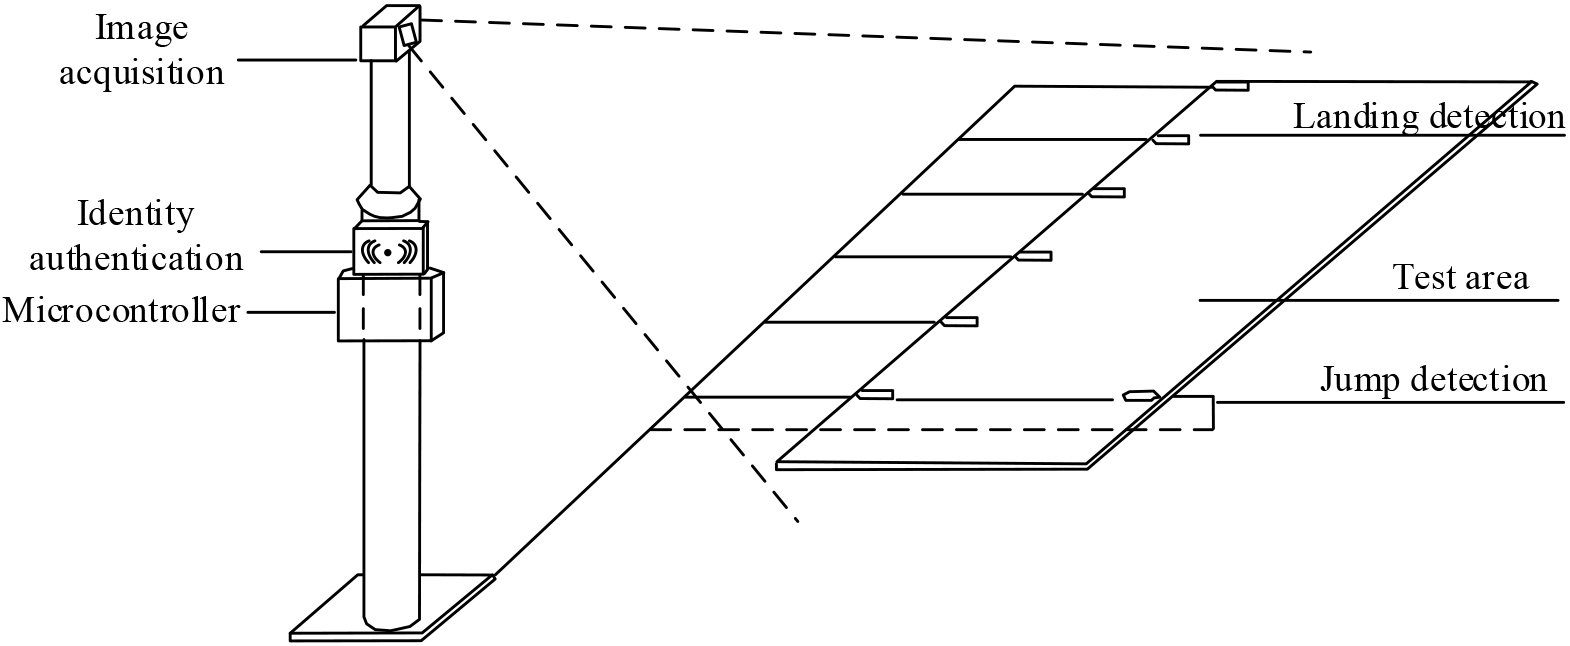
In identity authentication is mainly by means of radio frequency identification (RFID) technology to carry out information recognition, RFID to radio frequency signal as an information transmission medium to realize space coupling processing, RFID technology can effectively make data information sent to the decoder, complete the electronic label information recognition and collection [23, 24]. When the user’s identity information is collected, the image collection area and the test area will collect image data on the user’s long jump performance within the field of view, and use the resolution and focal length as important evaluation indexes for the clarity of the image information and the correction effect. Therefore, this study uses normally closed vibration sensors for detection, and its content structure is shown in Fig. 6.
Content structure diagram of vibration sensor.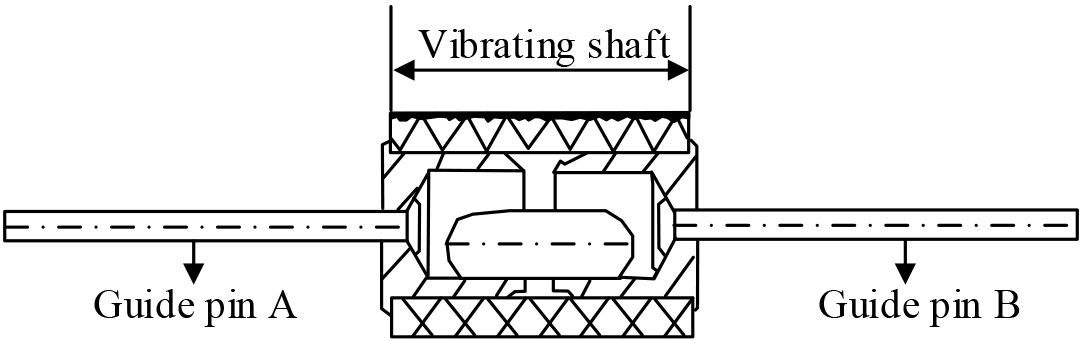
When the vibration sensor detects vibration, the internal current vibration axis will be displaced, which will cause the current to cut off and cause the indicator light to be unlit. The long jump images are also considered to have a skewed angle when data is entered, and a correction of the long jump images is investigated to reduce the interference caused by the skewed angle to the image data reading. A large number of long jump images are selected for the customization of the image library, the number of samples is expanded by translation and scaling, and the target images are calibrated by means of a convolutional neural network (CNN). The above database mainly comes from the long jump data images of students from a certain school. CNN use input, convolutional and pooling layers to achieve local connectivity, parameter sharing and downsampling, and are widely used as one of the learning models for deep learning networks in the field of image recognition [25]. The convolutional layer in a CNN involves the number of convolutional layers and the size of the local field, and the value of these two parameters can affect the network’s The value of these two parameters can have a significant impact on the training time and feature extraction accuracy of the network. The research design of the convolution of the convolutional layer is shown in Eq. (9).
In Eq. (9),
The system design model proposed in the study achieves the recognition of distance measurement through the recognition of long jump images. Also during the experiments, the analysis is carried out with the help of two main metrics, accuracy and recall. Accuracy and recall are two metrics that are widely used in the field of information retrieval and statistical classification to evaluate the quality of the results. Accuracy is the ratio of the number of correct messages extracted to the number of messages extracted, and recall is the ratio of the number of correct messages extracted to the number of messages in the sample. Both take values between 0 and 1. The closer the value is to 1, the higher the accuracy or completeness rate is. In order to verify the performance effectiveness of its design, Firstly, the effectiveness of the proposed denoising method is demonstrated, and the results are shown in the Fig. 7.
In Fig. 7, the denoised image can better extract content information compared to the original image, and the wavelet denoised image can better retain the main information of the image, eliminating the interference of unnecessary noise data on image extraction. The combination of wavelet denoising and morphological denoising proposed in the study effectively avoids the interference of partial local information on the main information, and has a better extraction effect on image information. At the same time, the application effect of the proposed improved wavelet threshold method is analyzed, and the results are shown in the Table 1.
Improved wavelet threshold results
Improved wavelet threshold results
Schematic diagram of the effect before and after image denoising.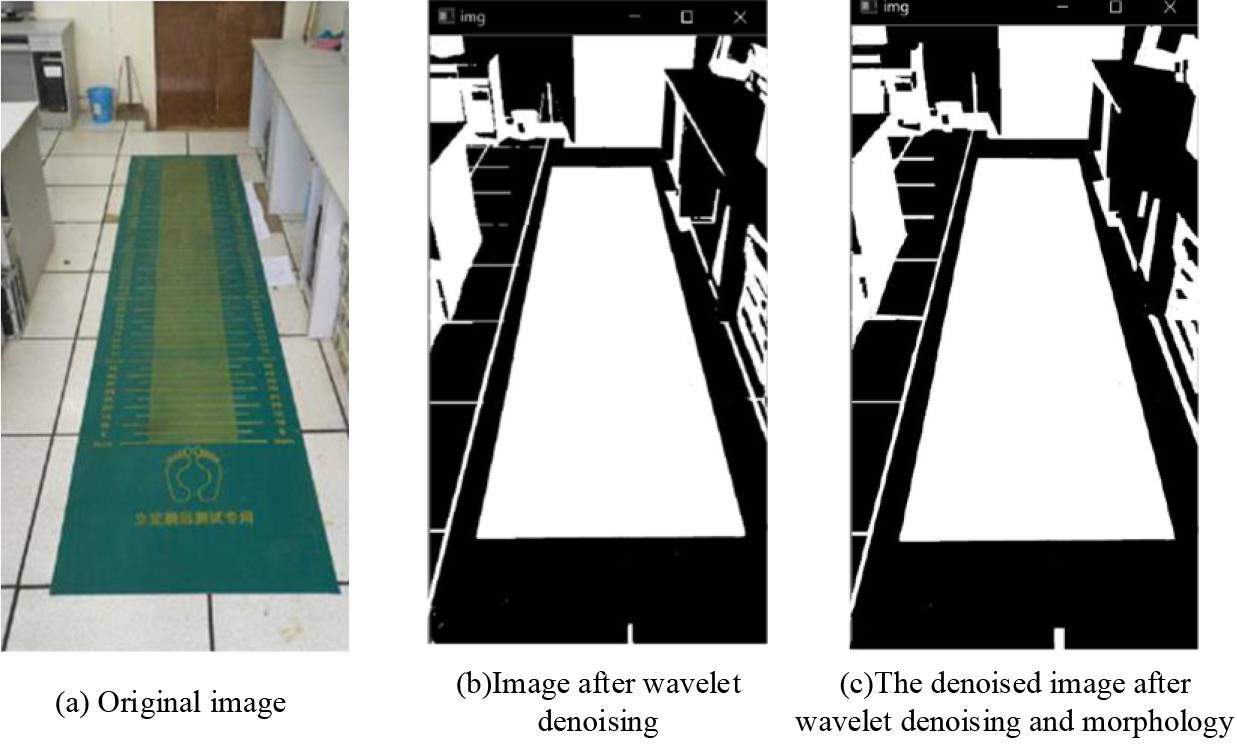
The results in the table show that, in the threshold function, when the K value is at different values, its peak signal to noise ratio and Mean squared error are different. When the K value is 1, its Mean squared error is the smallest, 52.1823, and the denoising effect is the highest. When K value is in the range of greater than 1 or less than 1, its Mean squared error starts to rise. The study utilizes a threshold function model to improve the wavelet algorithm. In fact, the improved algorithm processes the parts of the decomposed wavelet coefficients that are greater than or equal to the reference threshold, quantizes the parts that are less than the reference threshold, and enables the denoised image to retain more image information. Subsequently, further steps are taken the function training results as well as the image denoising effect are analyzed and the results are shown in Fig. 8.
Comparison of function training results and image denoising effects.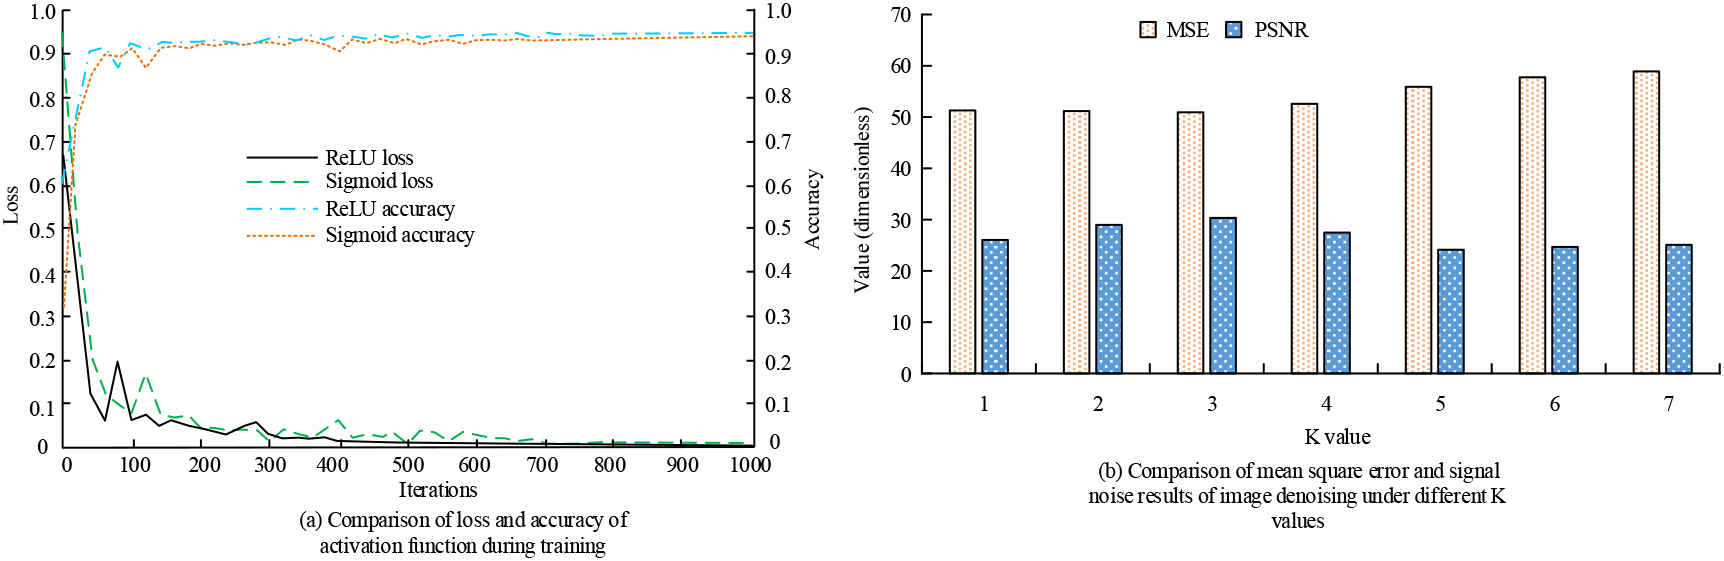
In Fig. 8, the loss values of the ReLU and Sigmoid functions show a downward trend with the increase in the number of iterations, with the ReLU function showing a more pronounced downward trend and a smaller fluctuation in the loss value during the iterative process, with the loss value basically converging to 0 at the number of iterations above 400, while the Sigmoid function basically converges to 0 only at the number of iterations above 700. What can be seen from the accuracy rate is that the ReLU function has a relatively smooth change in the accuracy curve, with a maximum accuracy of 95%, while the Sigmoid function also shows an increasing trend in accuracy, but there is a small fluctuation in the number of iterations less than 200, with a maximum accuracy of 94.6%, which is lower than the ReLU function. The above results show that the ReLU function has better application performance and better feature accuracy extraction. At the same time, it also shows that the wavelet decomposition coefficient adopted in the study can better cope with the change of K value, and its joint morphological denoising shows low mean squared error and signal to noise ratio values, with the minimum MSE and peak signal to noise ratio (PSNR) values reaching 50.8369 and 24.1126. When the threshold value is greater than 1, the mean square error of the image starts to be audited, and the image denoising effect is poor this time. When the value of the threshold K is 1, the denoised image at this time can retain better detailed information, and the application effect is better. Subsequently, performance analysis is conducted on the collected long jump image information. When using long jump image processing, the real-time collected long jump images are collected, including the original long jump image information. A total of 12367 image information are collected.
Comparison results of accuracy and recall of different image denoising effects.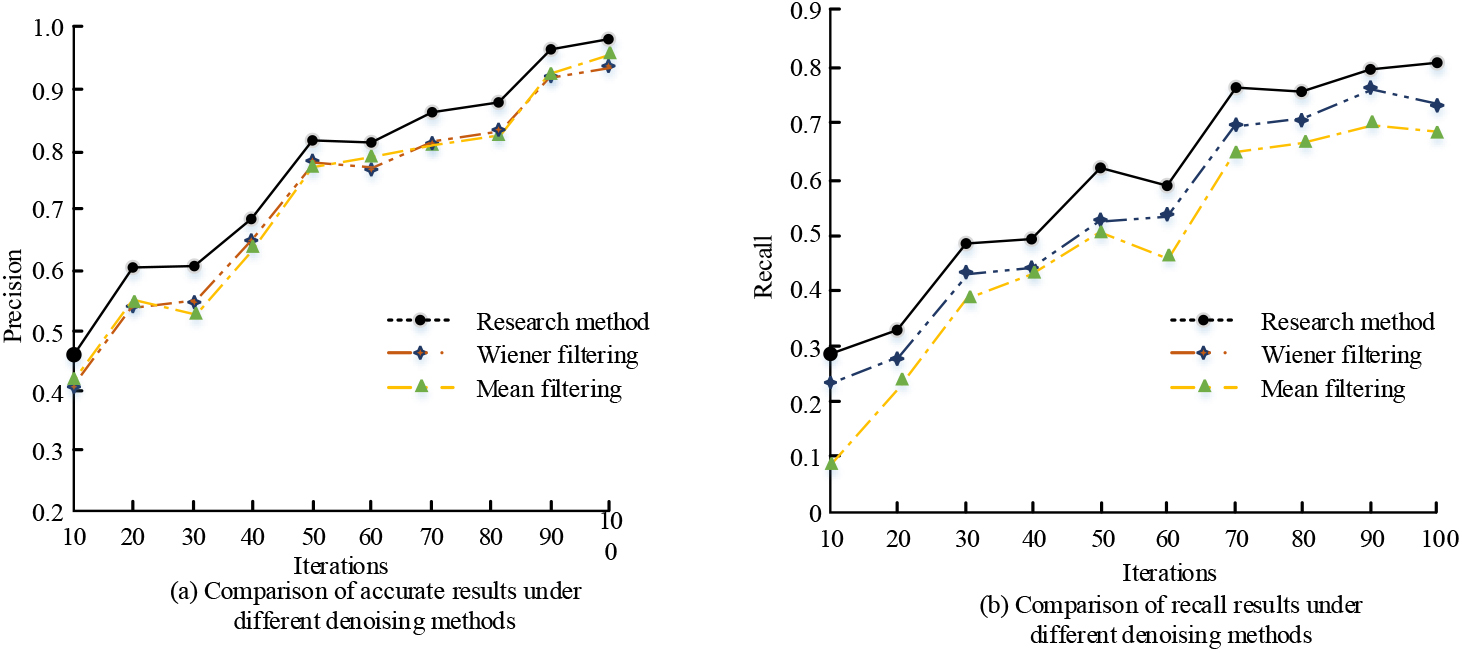
In Fig. 9a, the accuracy results of the mean filter, Wiener filter and the studied image denoising method are compared. The accuracy of the mean filter and Wiener filter, as common image denoising methods, shows an overall increasing trend, with a maximum accuracy of 94.23% and 93.25%, which is much lower than the maximum accuracy of 96.23% achieved by the studied method. At the same time, the proposed denoising method achieved a recall rate of 80.79%, which is better than the other two denoising methods. The method proposed in the study is used for indoor and outdoor scene detection, and the results are shown in Fig. 10.
Correct matching of indoor and outdoor ranging images using different algorithms.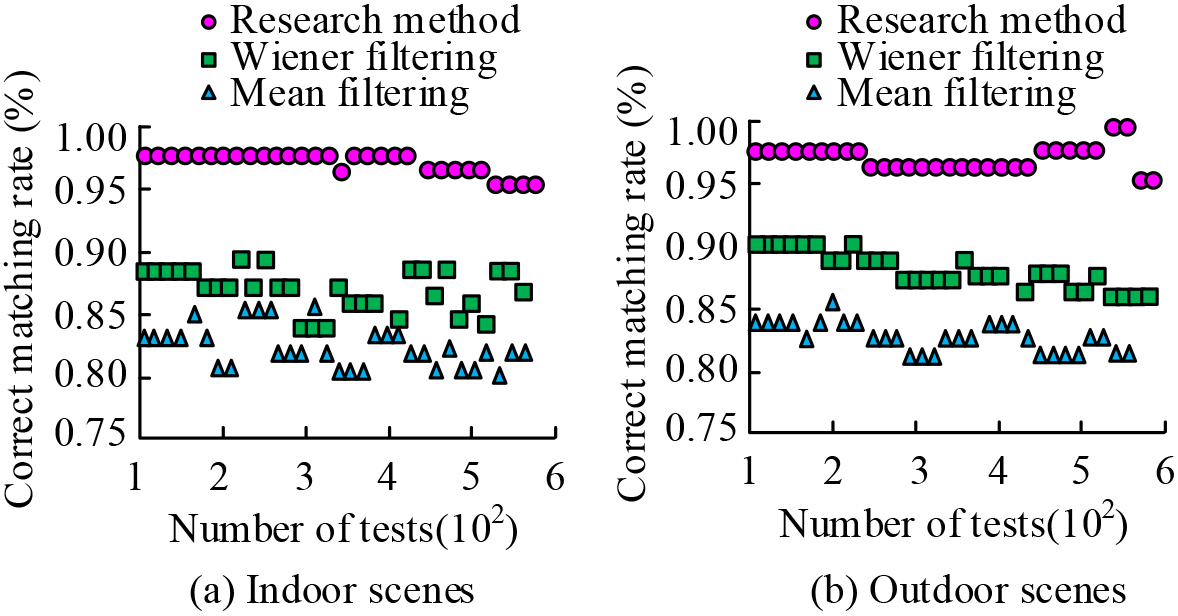
The results presented in Fig. 10 show that the proposed processing algorithm exhibits accurate matching rates of 96.14% and 97.22% in different scenarios. In addition, the application effect is observed to be relatively stable. In contrast, the processing accuracy of the other two algorithms is found to be inferior to that of the proposed algorithms, and they are significantly affected by external environmental disturbances. The receiver operating characteristic (ROC) curve is a comprehensive evaluation of the accuracy and recall rate, and has good intuitive properties. And set the standard layer, convolution layer core, core size and offset in CNN as 5, 10, 9 and 1 respectively, and then analyze the recognition results of different feature information, as shown in Fig. 11.
In this section of the study, a comparison is made between the gradient of gradients (HOG) technique and the CNN algorithm. Among them, the HOG algorithm maintains good invariance in image geometry and optical deformation, performs well in feature extraction of rigid objects, and has good similarity in calculating the gradient size and direction in the horizontal and vertical directions of the image with the matrix changes conducted by research methods. To some extent, it can minimize the parameter changes when comparing the HOD algorithm with the proposed algorithm. At the same time, the CNN algorithm is a basic algorithm with simple operation and low parameter variation, which can effectively recognize feature information. The results in Fig. 8 show that the results of Receiver operating characteristic shown by the image features of HOG technology and CNN algorithm are different, specifically, the area of verification and recognition of Receiver operating characteristic of the two algorithm models is smaller than the algorithm model proposed in the study. The ROC curve area of the proposed algorithm model achieved more than 85%. The algorithmic model is then analyzed for test time and accuracy as well as overall standard deviation results and compared with the CNN model and the Faster R-CNN model, the results of which are shown in Table 2.
Comparison of image recognition performance under different algorithm models
Comparison of ROC results of different image feature recognition algorithms.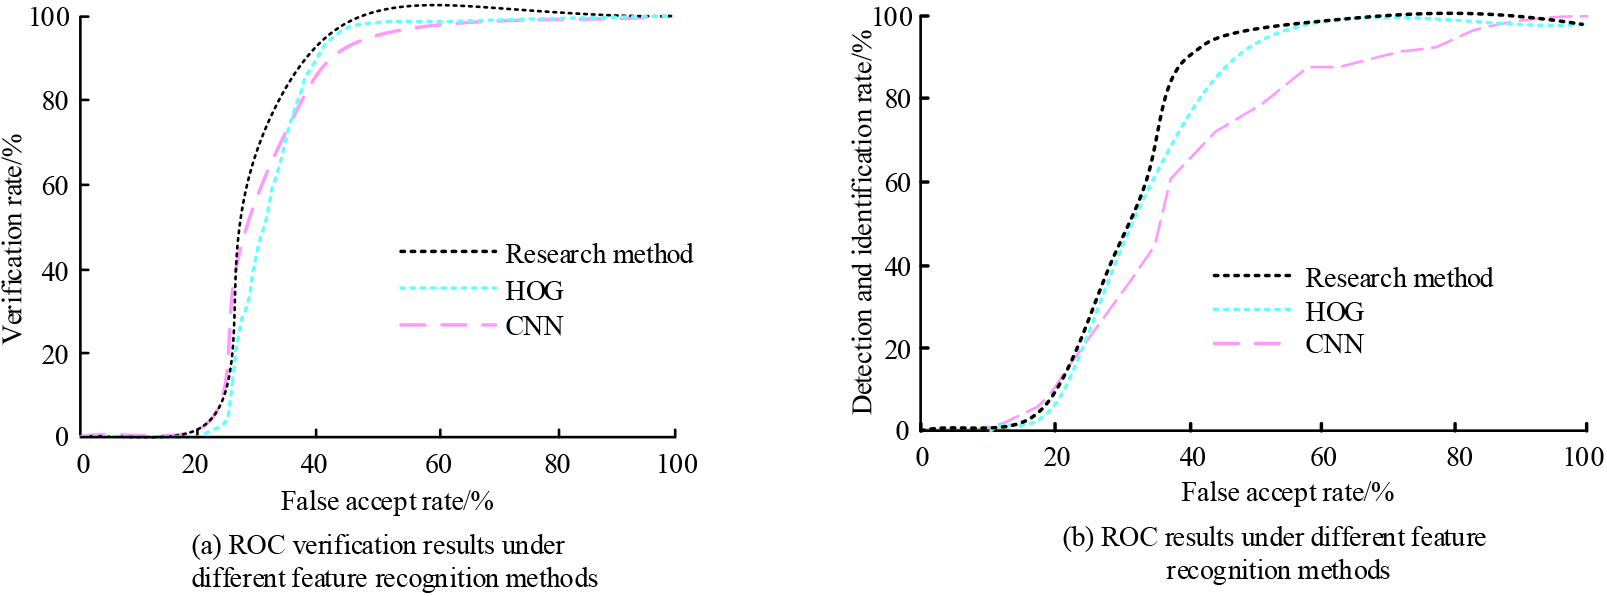
The results in the table show that the performance of the three model algorithms differs significantly across the three datasets, where datasets 1–3 respectively indicate the increasing amount of data information contained. The Faster R-CNN algorithm introduces the region proposal network (RPN) into the CNN, i.e., the extraction of regional features is achieved by setting the corresponding vector window size. In this table, the CNN and faster R-CNN took a longer time to test in the dataset, basically above 70 ms, and their test accuracy is no more than 85%, which is lower than the method used in the study. The overall standard deviation of the CNN and Faster R-CNN is higher than 0.5 and the variability of the values is more obvious, while the deviation values of the proposed method are 0.46, 0.35 and 0.46 for the three datasets, and the overall stability of the system is better. To better analyze and test the designed long jump distance measurement system, the study selected some of the recorded data from the long jump test data for comparison of the test results, and the statistical results are shown in Fig. 12.
In Fig. 12, the difference between the actual long jump scores under different test numbers and the system test scores is very small, with the actual maximum test scores for 11 numbers exceeding 250 cm. in terms of absolute and relative error, the absolute error under different test numbers does not exceed 1.5 cm, the relative error does not exceed 80%, and the minimum absolute and relative error values reach 0 cm and 0% respectively. The above results show that the system has high accuracy and error values between test results and actual results, and can better identify and analyze users’ test results. Different long jump habits can lead to different take-off and landing methods. The study selected 10 testers for standing long jump testing, and the results are shown in Table 3.
Standing long jump performance test results
Comparison of scores and error results between actual long jump results and test results.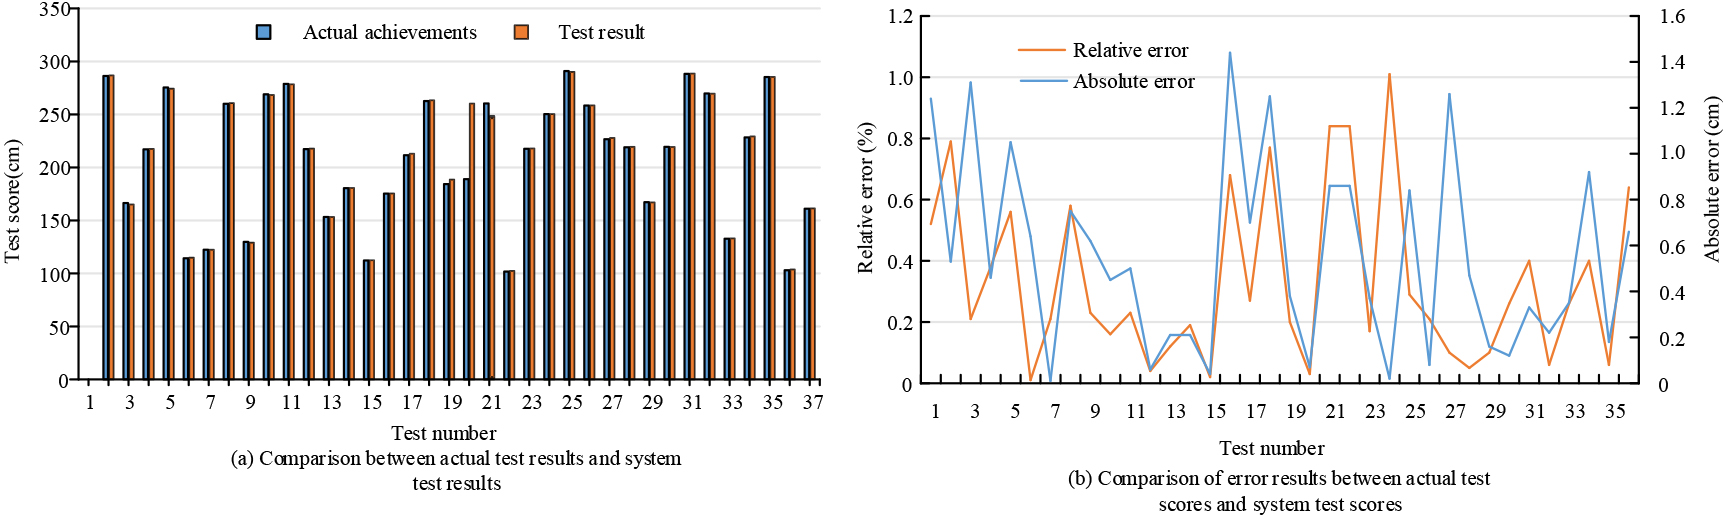
The results in Table 3 show that out of 10 standing long jump tests, 9 measurements had an error of less than 1 cm, while the remaining 8 measurements had an error of less than 2 cm, with an average absolute error of 0.506 cm, which basically meets the accuracy requirement of measuring 1 cm in standing long jump test results. The above results indicate that the recognition technology proposed in the study can effectively determine long jump movements, and it has good application effects in detecting movements during takeoff and landing. The processing time for positioning the landing point is related to the time it takes for the athlete to stand and walk. In most cases, the proposed method can measure the final result within 10 seconds after the athlete completes the standing long jump.
The study designed the long jump system based on the characteristics of the standing long jump and the problems of its current testing means, and carried out performance tests and application analysis. The results demonstrated that the ReLU activation function utilized in the study exhibited a minimal loss value and, at a number of iterations exceeding 400, had essentially converged to 0. In contrast, the Sigmoid function only exhibited convergence to 0 at a number of iterations exceeding 700. The maximum value of accuracy achieved by the model was 95%, and the image denoising effect under wavelet decomposition was evident, with the minimum MSE and PSNR values reaching 50.8369 and 24.1126, respectively. The proposed denoising method and image feature extraction method showed high accuracy and ROC when compared with other algorithms, and the overall data variability was less volatile. The maximum accuracy of the algorithm in the performance test was 85.23%, and the overall standard deviation of the system was at least 0.35, with good stability of the overall performance variation. The absolute error between the test result and the actual result of the system was no more than 1.5 cm, and the relative error was no more than 80%, which can better analyze the distance measurement of the long jump information data. The standing long jump test, designed for research purposes, is capable of functioning normally in both indoor and outdoor settings. However, it is important to note that the ranging effect is relatively stable, yet still exhibits certain limitations and shortcomings. In future research, the use of deep learning techniques and lighting models can be employed to enhance image recognition algorithms and improve their compatibility under external environmental conditions, such as varying lighting conditions and background complexity. Additionally, the introduction of hidden Markov chain algorithms, video object segmentation algorithms, and other such techniques at a later stage can facilitate the monitoring and analysis of the long jump stage. Video stream analysis should be introduced to avoid latency issues. The proposed algorithm should be applied to more interdisciplinary research in order to validate its effectiveness.