






Abstract
With the explosive growth of electricity consumption, the demand for electricity by electricity users is increasing. As a core component of power supply, the safe and stable operation of transmission lines plays an important role in the normal operation of the entire power system. However, traditional monitoring methods for transmission line operation status face challenges such as limited accuracy, lack of real-time feedback, and high operational costs. In this paper, the Firefly algorithm is used to monitor the running status of transmission lines. Through synchronous testing with the traditional particle swarm optimization algorithm, it is found that the average accuracy of the Firefly algorithm in voltage and current measurement is improved to 93.13% and 93.66% respectively, which is better than the traditional algorithm. Firefly algorithm shows high precision in various power equipment monitoring, the average monitoring accuracy is 95.62% and 93.06%, respectively, which proves that it has stronger performance in transmission line monitoring and can achieve more stringent monitoring requirements. Through the comparison experiment of the algorithm, it proved that the Firefly algorithm had a strong performance in the transmission line operation status monitoring, and could more accurately identify the transmission line fault, which provided a new idea and new method for the safe operation status monitoring of transmission lines.
Introduction
As the backbone of the power system, the transmission line undertakes the key task of transmitting the electric energy generated by the power station to various areas. They play a vital role in ensuring the stability and reliability of the electricity supply and are the cornerstone of modern socio-economic activities and daily life. Once the transmission line is faulty or damaged, it will not only seriously affect the normal operation of the power grid, but also may cause serious accidents. Therefore, it is particularly critical to carry out scientific and standardized operation and maintenance of transmission lines.
To optimize the operational status of transmission lines, more efficient, accurate, and cost-effective monitoring technologies are needed. In this regard, the firefly algorithm, as a new intelligent optimization algorithm, has shown excellent performance in a variety of practical application scenarios because of its fast convergence speed, excellent global search ability, and strong robustness. The application of the firefly algorithm to the condition monitoring of transmission lines is not only an ideal choice but is also expected to significantly improve the monitoring effect.
By integrating the firefly algorithm into the transmission line monitoring system, the monitoring accuracy and response speed of the system are improved successfully. Compared with the traditional particle swarm optimization, the results show that the Firefly algorithm can achieve 93.13% and 93.66% accuracy in voltage and current measurement, respectively, which is superior to the traditional algorithm. In addition, the Firefly algorithm also shows a higher average monitoring accuracy in the monitoring of various power equipment, 95.62% and 93.06% respectively, which proves its strong performance in the monitoring of transmission lines and can meet the more stringent monitoring requirements.
The innovation of this study lies in the optimization and improvement of the firefly algorithm to adapt to the monitoring requirements of transmission line operation status, thus significantly improving the efficiency and accuracy of monitoring. At present, this research is still in the stage of theoretical development and laboratory testing, mainly focusing on the development of algorithms for monitoring applications. Looking forward to the future, the research will continue to deepen and strive to further improve the algorithm, apply the firefly algorithm to a wider range of fields, and comprehensively improve the overall performance of the monitoring system.
In addition, this paper also discusses the application of the firefly algorithm in the monitoring of different power equipment, including the monitoring of key components such as the tower, insulator string, and ground wire of the transmission line. Through careful monitoring of the operating status of these equipment, problems such as tower tilt, corrosion damage, insulator surface pollution, voltage balancing ring damage, wire foreign body suspension, and wire sag can be found and dealt with in time, to ensure the safe and stable operation of the transmission line.
All in all, the transmission line operating condition monitoring method based on the firefly algorithm proposed in this paper is not only innovative in theory but also shows significant advantages in practical application. With the deepening of future research, the firefly algorithm is expected to play a greater role in the field of power system monitoring and make important contributions to improving the stability and security of the power grid.
Related work
After searching for information, the following scholars’ research on transmission line monitoring has been found. Hu Shuangting proposed a structurally optimized vibration-driven triboelectric nanogenerator for harvesting vibration energy from transmission lines, reducing vibration damage, and converting it into electrical energy for monitoring line status. This paper introduces the energy management circuit to enhance the charging efficiency, and verifies the effectiveness of vibration attenuation and wireless transmission in a simulated environment, showing the advantages of its design and performance. This research provides an efficient energy solution for transmission line monitoring and helps to improve the reliability of the grid [1]. Nafees Muhammad Nouman gave a comprehensive look at smart grid security, with special emphasis on the importance of situational awareness. He proposes a threat modeling framework to analyze the impact of cyber-physical attacks on smart grids, evaluate intrusion detection, moving target defense, and joint simulation techniques, and explore situational awareness and metrics to understand attacks [2]. Shakiba Fatemeh Mohammadi conducted a comprehensive survey of transmission line fault detection, classification, and location technologies. The need for fast and accurate identification tools to provide power and prevent unnecessary power outages was highlighted. This paper reviews various machine learning algorithms and artificial neural networks that have been applied to fault detection, classification, and location of transmission lines. Through this work, he has contributed to the development of advanced fault diagnosis techniques for transmission line monitoring in power systems and smart grids [3]. Luo Yanhong conducted a comprehensive investigation and research on intelligent transmission line inspection based on unmanned aerial vehicles. This paper first reviews the origin and development of intelligent power inspection, and then introduces in detail the process of intelligent transmission line inspection and three key problems: UAV path planning, trajectory tracking, and fault detection and diagnosis. Finally, the challenges faced by power inspection are pointed out and future solutions are put forward [4]. The above studies discussed multiple aspects of transmission line monitoring, which provided insights into this research topic. These methods have played an important role in promoting the development of this field. However, some traditional algorithms have some limitations when applied to the dynamics and complexity of transmission line monitoring. For example, the traditional particle swarm optimization algorithm may have the problem of premature convergence, while the gas algorithm may require a large amount of computation
After searching for information, find the following research literature on the Firefly algorithm. El-Shorbagy proposes a new hybrid algorithm that combines the advantages of genetic and firefly algorithms, aiming to overcome the shortcomings of firefly algorithms and solve engineering design problems. In this hybrid system, a new generation of individuals is formed through the mechanisms of both algorithms to prevent falling into local optimal solutions, introduce sufficient diversity of solutions, and achieve a balance between exploration/exploitation trends. This study demonstrates the advantages of the firefly algorithm in engineering optimization problems, especially its potential to prevent premature convergence and improve search efficiency [5]. Gao J proposed a model combining extreme gradient elevator and firefly algorithm to predict Young’s modulus and unconfined compressive strength of rocks, which is superior to other methods in terms of prediction accuracy and generalization ability [6]. Shaban WM has developed a chaotic-based firefly algorithm that significantly improves the ability to predict chloride ion permeability in recycled aggregate concrete and effectively optimizes its durability [7]. Liu J proposed an improved Firefly algorithm, which effectively improves the exploration efficiency and convergence speed of the algorithm through enhanced attraction and random term modules, significantly superior to the standard Firefly algorithm and other variants [8]. These studies provide empirical and theoretical support for power system optimization based on the Firefly algorithm, and they demonstrate the advantages of the Firefly algorithm in engineering optimization problems, including the potential to prevent premature convergence and improve search efficiency, which has important implications for developing and improving transmission line monitoring methods. In addition, these studies expand the application range of the firefly algorithm and provide new ideas and tools for improving the accuracy and efficiency of transmission line monitoring.
Investigation of transmission line monitoring and firefly algorithm
Main technologies
Transmission line operating condition monitoring refers to the comprehensive monitoring of transmission line parameters [9, 10]. Monitoring technology includes the following parts:
(1) Sensor technology
Sensor technology refers to the technical means of installing various sensors on the transmission line to monitor the running state of the transmission line in real-time.
(2) Infrared imaging technology
Infrared imaging technology is very sensitive, it uses infrared imaging instruments for detection and analysis. It can pinpoint hot spots on the surface of the line to analyze potential failures.
(3) Vibration analysis technology
The technology uses vibration to detect loose connections, tower instability, structural failures, etc. The sensor converts the signal into digital data for analysis, monitoring anomalies in real time.
(4) Data analysis technology
Data analytics technology combines sensor data with historical data to evaluate transmission lines and predict potential failures. Maintenance management supported by data analytics includes assessing transmission line health, predicting potential failures, and scheduling preventive maintenance activities.
In summary, data analysis technology plays a key role in transmission line monitoring, improving the reliability and security of power infrastructure through real-time monitoring and analysis of various parameters.
The main technologies for monitoring the operation status of transmission lines are shown in Fig. 1.
Main technical diagram for monitoring the operation status of transmission lines.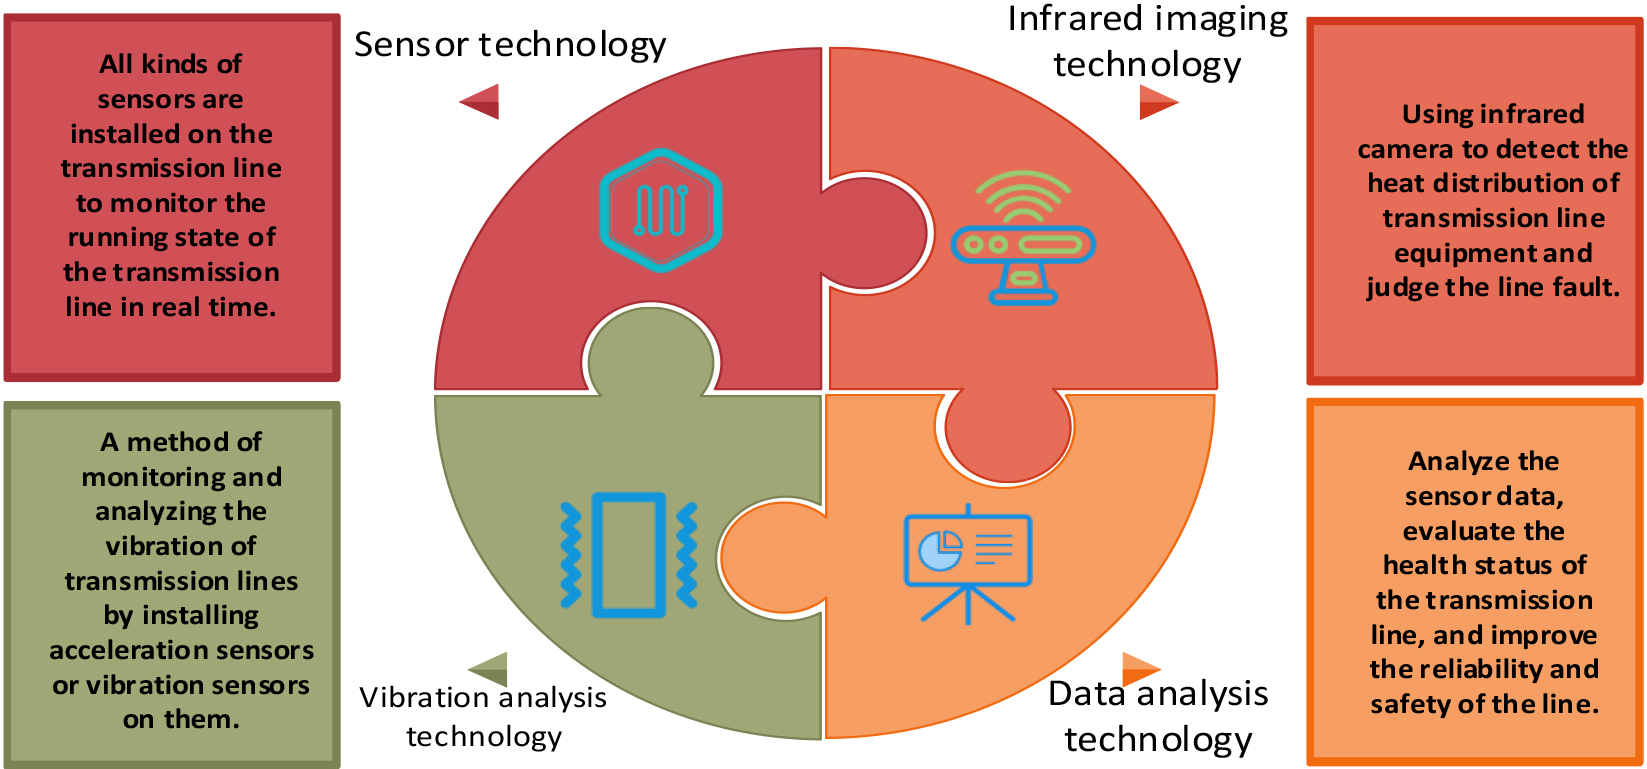
In the monitoring of transmission line operation status, by understanding the operation status of the transmission line, including changes in parameters such as power, voltage, current, temperature, and wind speed, abnormal situations and potential problems of the line can be detected early, to take corresponding measures to ensure the safe and stable operation of the transmission line [11, 12]. The main aspects of monitoring the operation status of transmission lines are as follows:
(1) Wire vibration monitoring
The wires in transmission lines are subject to various factors that can cause vibration during operation, such as wind force, current, temperature, etc. Among them, wind power is one of the main reasons for wire vibration. To detect abnormal wire vibration promptly, vibration sensors or monitoring cameras are usually installed on the transmission line to monitor the vibration of the wire in real time, and the data is transmitted to the central control room for processing and analysis. By processing and analyzing vibration data, it is possible to determine whether the wire vibration is normal. In case of abnormal situations, the central control room can take corresponding measures promptly, such as adjusting the wire tension, replacing damaged wires, adjusting the operation mode of the transmission line, etc., to ensure the safe and stable operation of the transmission line.
Excessive vibration can lead to increased fatigue in conductors, which can lead to wire failure over time. This can cause safety hazards and even physical damage to adjacent structures and equipment. Vibration-induced stress can cause the tower to destabilize or collapse, with catastrophic consequences for the power system and the surrounding environment
(2) Tower tilt monitoring
Usually, the tower would tilt due to various reasons, which may be caused by geological terrain, meteorological disasters, traffic accidents, and other reasons. In transmission lines, the tilt of the tower can hurt the operation of power equipment. For example, the tilt of the tower can cause a decrease in the distance between wires, which can easily cause short circuits in the wires, and even cause significant losses and disasters to the tower and equipment. So tower tilt monitoring is very important. In addition, tower tilt monitoring plays a vital role in facilitating maintenance operations. By providing real-time data on the condition of transmission towers, maintenance personnel can prioritize maintenance work, allocate resources more efficiently, and schedule maintenance activities more precisely.
(3) Wire icing monitoring
Using infrared thermal imaging, ultrasonic equipment, and other technologies to monitor the icing of wires, assess the risk, find problems, and deal with them in time.
Main process of firefly algorithm
The Firefly algorithm is a meta-heuristic optimization algorithm, which originates from the natural behavior of fireflies [13, 14]. The Firefly algorithm, inspired by the flickering behavior of fireflies in nature, is a meta-heuristic optimization algorithm that simulates the process of firefly foraging and mating. The way it works is that brighter fireflies attract other fireflies, and this attraction diminishes with distance. Through the initialization of algorithms, attractiveness calculations, motion logic, and brightness updates, each is accompanied by a clear mathematical representation. The influence of key parameters such as brightness, attraction coefficient, and motion decision boundary on firefly motion is further expounded. At the same time, the basic principle of selecting the firefly algorithm for transmission line condition monitoring is discussed, and its advantages in global search and convergence are emphasized. It is particularly effective for solving complex optimization problems and has been successfully applied in areas such as engineering design, machine learning, control systems, and scheduling.
The main process is as follows:
(1) Initializing firefly individuals
A certain number of firefly individuals are randomly initialized, and the brightness value of each individual is set, that is, the size of the individual’s fitness [15, 16]. Through this process, the algorithm can obtain an initial set of firefly individuals, thus providing basic support for subsequent algorithm execution. Initializing the individual firefly is the first step of the Firefly algorithm. The specific process is as follows:
The solution space of the problem is determined: First, it is necessary to determine the solution space of the problem based on the problem definition, which is the range of values for the position of individual fireflies.
The individual position of fireflies is randomly initialized: After determining the understanding space, a certain number of individual positions of fireflies are randomly generated according to certain distribution rules (such as uniform distribution, normal distribution, etc.), that is, the position vector of each firefly.
Individual brightness value is calculated: For each initialized firefly individual, its fitness value, namely individual brightness value, is calculated through the corresponding objective function. The fitness value of the individual can be calculated by the optimal solution or the minimization of the loss function.
Parameters are set: According to the algorithm design, some control parameters need to be set, such as firefly movement step length, maximum iteration number, etc.
Initialization result is returned: Finally, an initial population consisting of random initialization position and corresponding fitness value is returned as the starting point of the algorithm.
(2) Calculating the attraction between fireflies
For each firefly, its attractiveness is calculated based on its brightness and distance from other firefly individuals. The higher the brightness, the stronger the attractiveness to other individuals. Through this process, the algorithm can calculate the attractiveness between various fireflies based on factors such as brightness and distance, thus guiding the subsequent movement of fireflies. The main process is as follows:
The distance between adjacent fireflies is calculated: According to Euclidean distance and other mathematical formulas, the distance between two adjacent individual fireflies is calculated, and the distance matrix of all adjacent fireflies is obtained for subsequent calculation of attractiveness.
Attraction is calculated: For each firefly, its attractiveness is calculated based on its brightness and distance from other firefly individuals. The firefly algorithm determines attraction by brightness and adjusts below the threshold to form an attraction matrix to guide movement.
(3) Moving firefly position
The firefly algorithm determines the motion direction through the attraction matrix and control parameters, updates the firefly position, and adjusts it according to constraints to search for the global optimal solution. The updated population is returned: Ultimately, a population composed of all firefly position vectors is returned as the initial point for the next iteration.
(4) Updating firefly brightness value
The brightness value of each firefly is updated. If the brightness at the new location is higher, the brightness value will be updated. Through this step, the brightness values of individual fireflies can be effectively updated, thereby improving the performance and search efficiency of the algorithm. The detailed process is as follows:
Brightness ranking: Based on the brightness values of individual fireflies, they are sorted to rank the fireflies with higher brightness values first. The non-ascending sorting algorithm is adopted here, so that the fireflies with high brightness values are ranked first, thus facilitating subsequent comparison and update.
Brightness updated: The brightness value at the new position is compared with the original brightness value. If the brightness value at the new location is higher, the brightness value will be updated. If the brightness value at the new position is not as high as the original brightness value, the original brightness value will be retained. It should be noted that the comparison and update of brightness values can only be carried out after all fireflies have calculated the new position and brightness value.
Loop iteration: Steps 3–4 are repeated until the stop condition is reached. The stop condition can be a preset maximum number of iterations, convergence of the objective function, or other customized conditions. In each iteration, all Firefly individuals need to be sorted and updated to achieve the search for the global optimal solution.
Firefly algorithm has the following advantages: First, the algorithm has strong robustness and global search ability, which can explore large solution space and avoid falling into local optimal. Secondly, the algorithm needs to set fewer control parameters, which simplifies the implementation and application of the algorithm. Third, the firefly algorithm is easy to be understood and adapted by practitioners.
The main flow of the Firefly algorithm is shown in Fig. 2.
Main flow chart of firefly algorithm.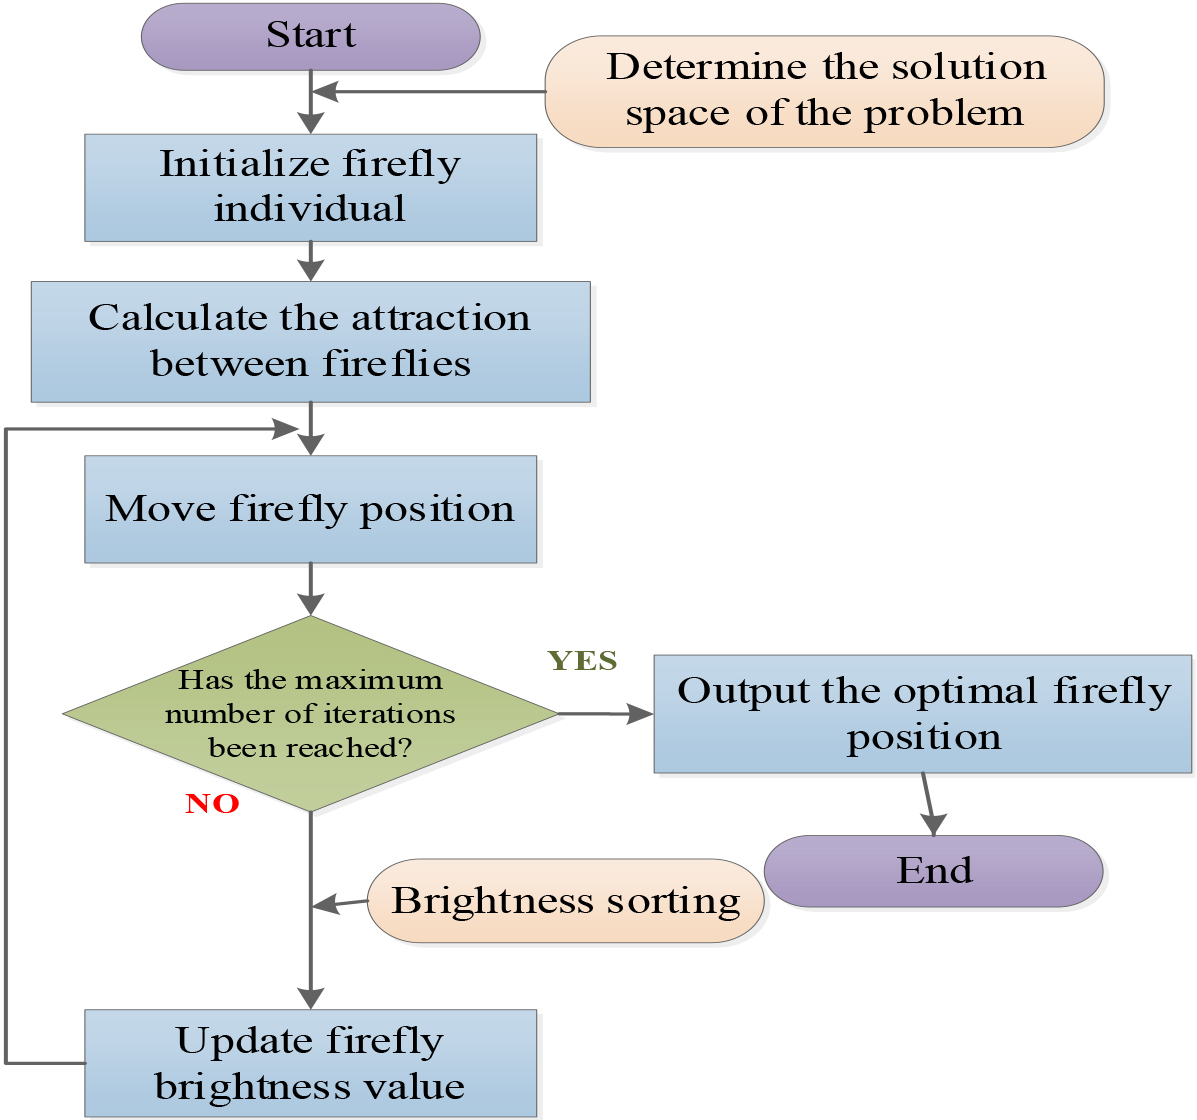
This chapter introduces the transmission line risk monitoring method based on the Firefly algorithm. The Firefly algorithm is a bionic optimization algorithm that simulates the flickering behavior of fireflies in nature to solve complex optimization problems [17]. Combined with the specific requirements of transmission line risk monitoring, the algorithm can realize real-time monitoring and risk assessment of the line, and improve the safety and reliability of the transmission system.
The application process of the Firefly algorithm in transmission line risk monitoring includes initializing the risk assessment model, calculating the risk weight, updating the risk distribution, and evaluating the overall risk. The specific steps are shown in Fig. 3.
Application steps of the algorithm.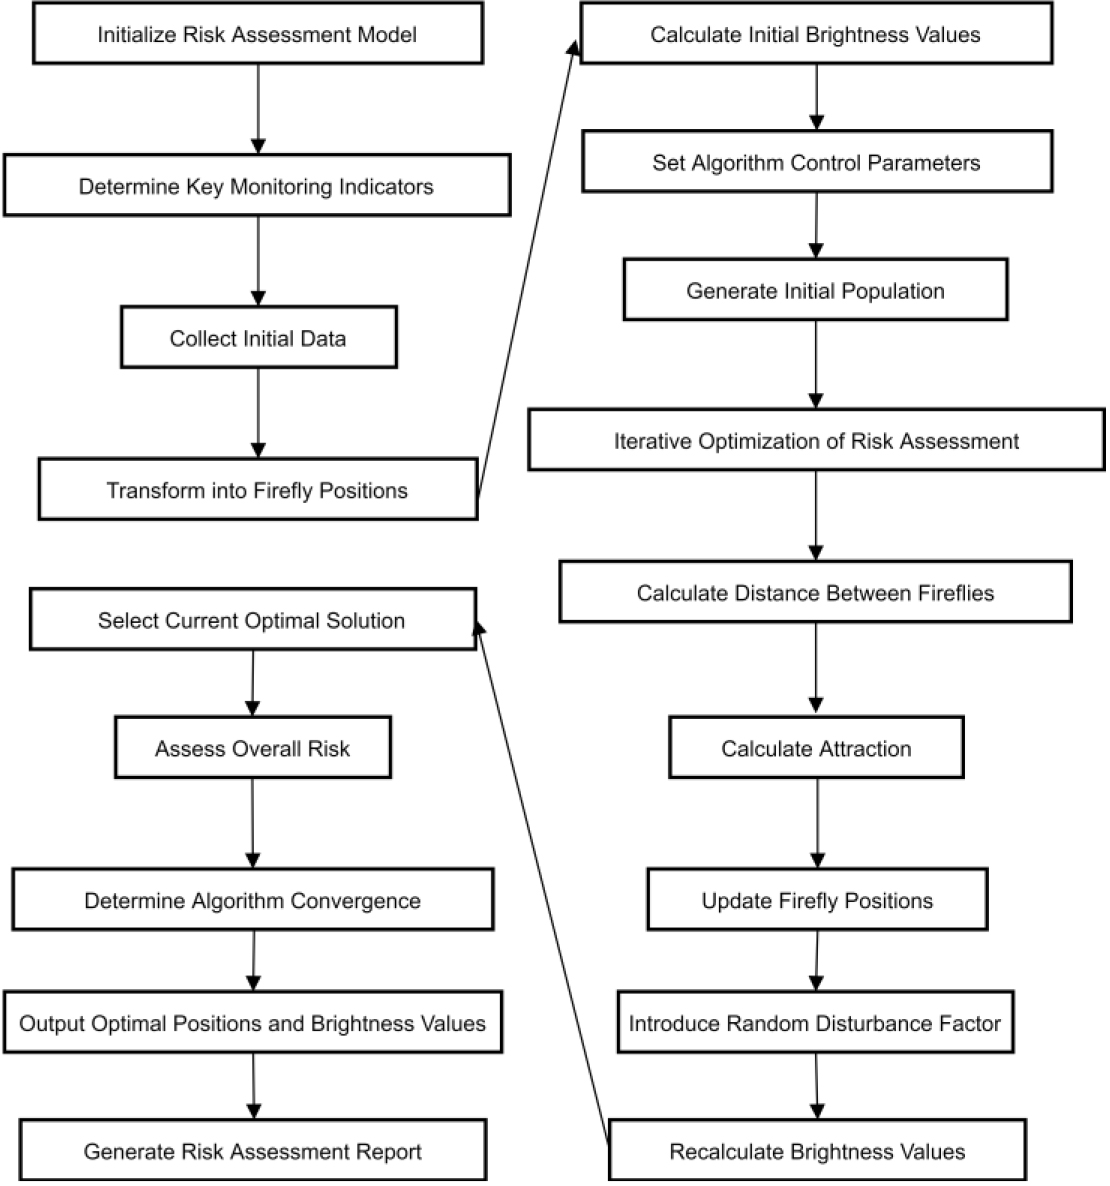
In the construction of a transmission line risk assessment model, it is necessary to determine the key monitoring indicators, including line voltage, current, temperature, and ambient humidity. Initial data on these indicators is collected through sensors and monitoring equipment. This monitoring data is translated into the location of individual fireflies, each of which represents a potential risk state. The initial brightness value of each firefly is calculated by the risk assessment function, and the brightness value is the quantitative index of the risk degree. The control parameters of the firefly algorithm are set according to the actual requirements, including the moving step size and the maximum number of iterations. Finally, an initial population composed of random positions and brightness values is generated as the starting point for algorithm execution.
In the iterative process, optimizing the risk assessment results is achieved by updating the location of the fireflies. Calculate the distance between firefly individuals according to the Euclidean distance formula. The attraction between fireflies is calculated based on their brightness value and distance. Fireflies with higher brightness values are more attractive to other fireflies, leading them to move towards better risk assessment locations.
The firefly algorithm continuously optimizes the risk distribution by updating the location of the fireflies. In each iteration, the location of the fireflies is updated based on the attraction and step size between the fireflies, and the new location represents a new assessment of the risk status. At the same time, a random disturbance factor is introduced to increase the exploration of the algorithm and ensure the diversity of the search process. The updated position is used to recalculate the brightness value of each firefly, which reflects the degree of risk and guides the optimization direction of risk assessment. In the process of iteration, the firefly with the highest brightness value is selected as the current optimal solution by comparing the brightness value, which is used as a reference for risk assessment.
After several iterations, the overall risk of the transmission line is assessed. The convergence of the algorithm is judged by the set number of iterations or the amplitude of brightness value change. Once the stop condition is met, the iteration process ends. Output the optimal firefly position and brightness values, which constitute the risk assessment results of the transmission line. Based on these assessments, a risk report is generated. The report lists the risk value and risk distribution of each monitoring index in detail and puts forward targeted risk control recommendations.
Transmission line risk monitoring process.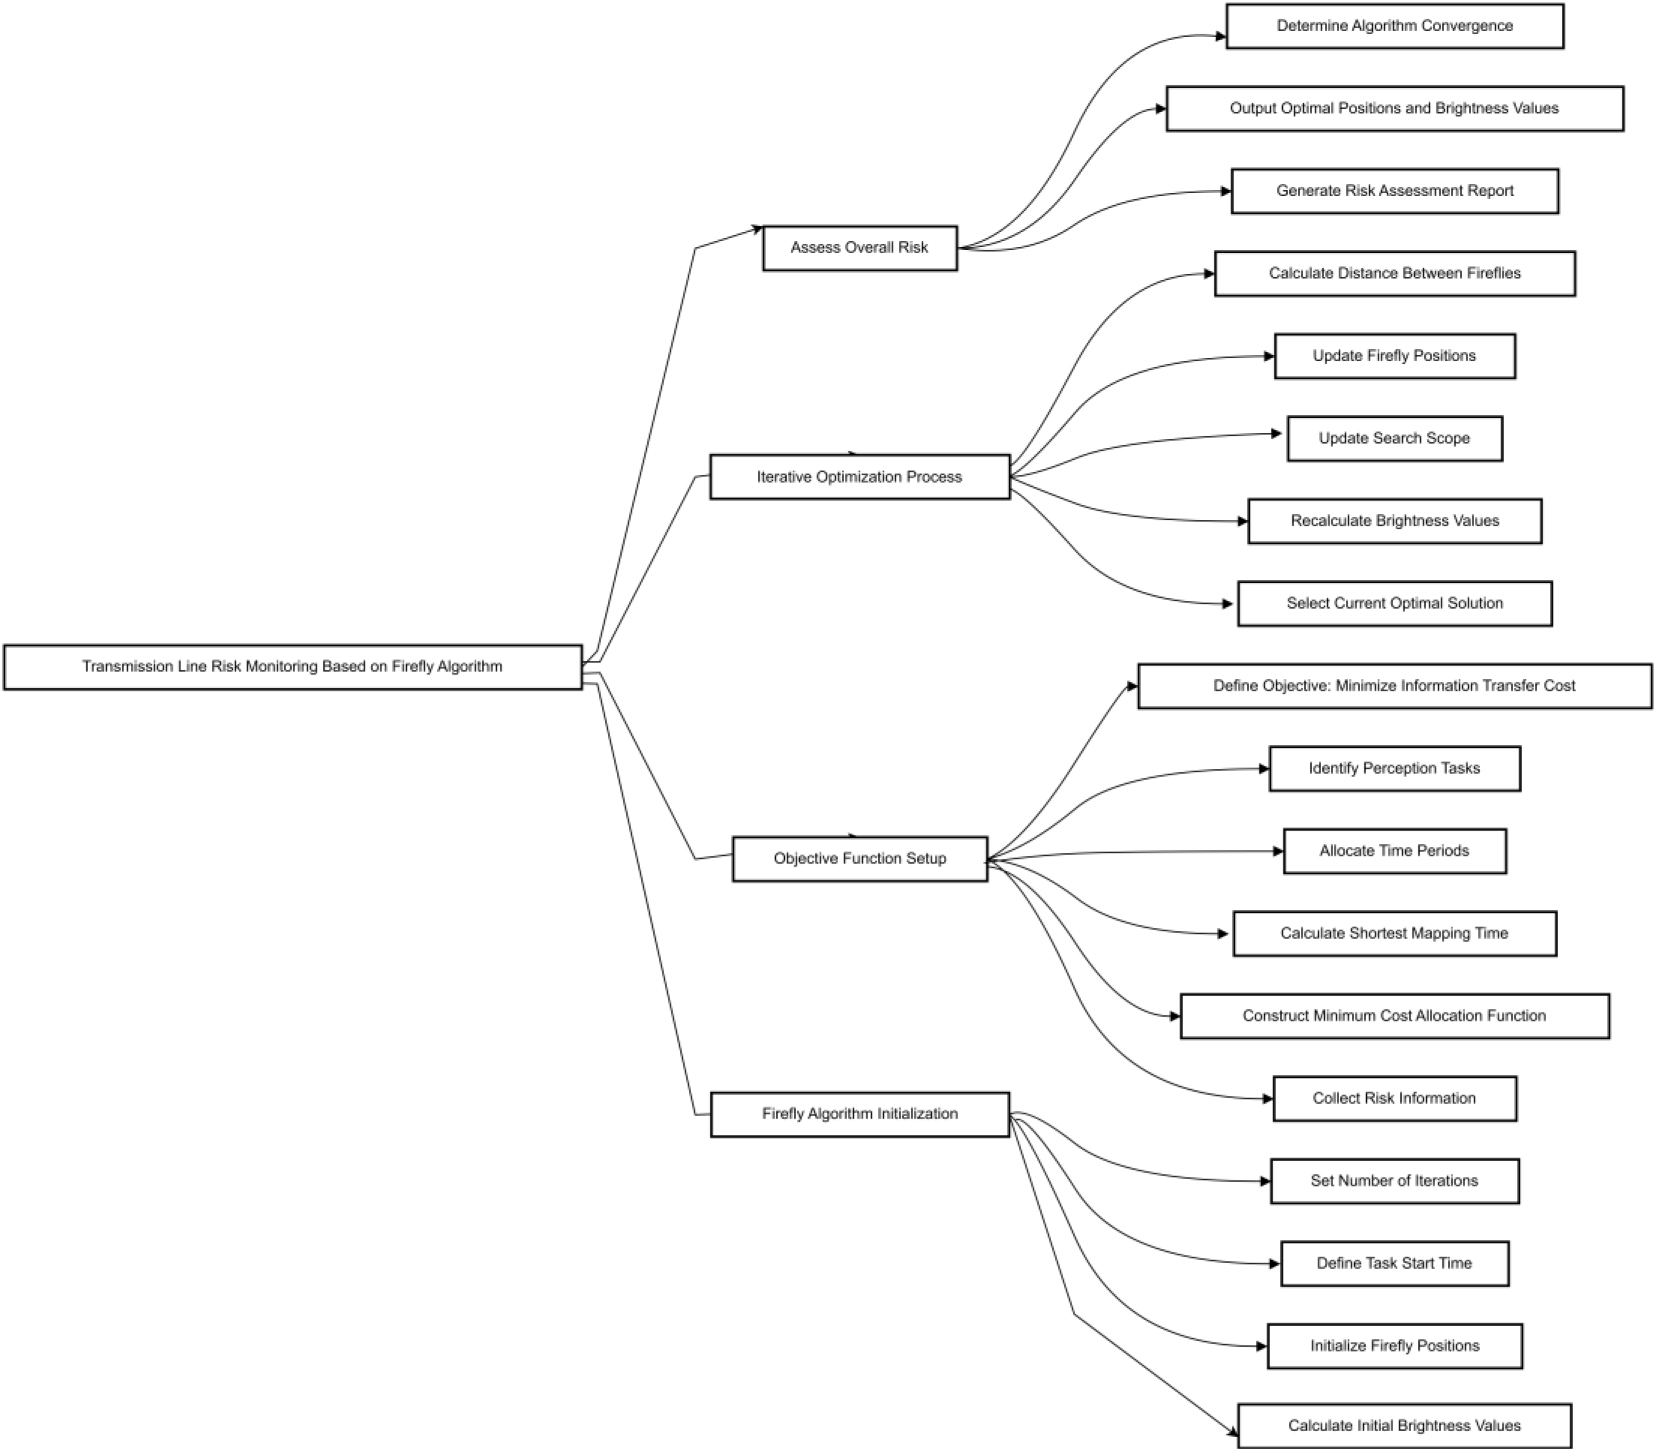
Figure 4 shows the overall monitoring flow. The lowest cost of information transfer is taken as the objective function for its allocation. The task of risk information situational awareness for transmission lines is
Among them,
The shortest time for mapping transmission line risk information within its allocated period is as follows:
Among them,
Among them,
Among them,
Among them,
Among them,
In this algorithm, each firefly represents a potential solution to the system. Their brightness is a key indicator and directly reflects the adaptability of the solution. When the brightness of the surrounding fireflies is higher than its own, the firefly will adjust its position to find a better solution. This mechanism drives the system to iterate, gradually optimize the solution, and finally reach the optimal configuration.
Through a simple and effective mechanism, the algorithm guides the fireflies to constantly search for a better solution. Fireflies adjust their position depending on the brightness of the surrounding fireflies to increase their brightness. This iterative process systematically improves the solution and gradually converges to the optimal solution.
Finally, the algorithm gives a comprehensive risk assessment of the transmission line under review. With the real-time monitoring and evaluation capabilities of the Firefly algorithm, stakeholders can accurately understand the inherent risks of transmission lines.
In the experiment, a control experiment would be carried out to synchronize the traditional particle swarm optimization algorithm and the Firefly algorithm. Firstly, the accuracy of these two algorithms in measuring voltage and current was tested. In the implementation of the two algorithms, the population size is set to 50, the maximum number of iterations is 100, and the convergence standard is less than 0.01. Different operating scenarios are set up, including different load conditions and line faults, and the data is collected at a sampling frequency of 1 kHz.The experimental data is shown in Fig. 5.
Based on the data in Fig. 5a and b, the average measurement accuracy of traditional particle swarm optimization algorithms for voltage and current was 87.62% and 87.98%, respectively. The average accuracy of the Firefly algorithm in measuring voltage and current was 93.13% and 93.66% respectively. It could be found that compared with the traditional particle swarm optimization algorithm, the Firefly algorithm had better performance in the measurement accuracy of voltage and current.
Next, it was necessary to test the detailed monitoring ability of the algorithm in actual transmission line operation status monitoring. Firstly, the monitoring indicators for power equipment operation faults in transmission line operation status monitoring were selected. The detailed indicators are shown in Table 1.
Monitoring indicators for operational faults of power equipment
Monitoring indicators for operational faults of power equipment
Accuracy of voltage and current measurement using two algorithms. a. The accuracy of voltage and current measurements using traditional particle swarm optimization algorithms. b. Accuracy of voltage and current measurement of Firefly algorithm.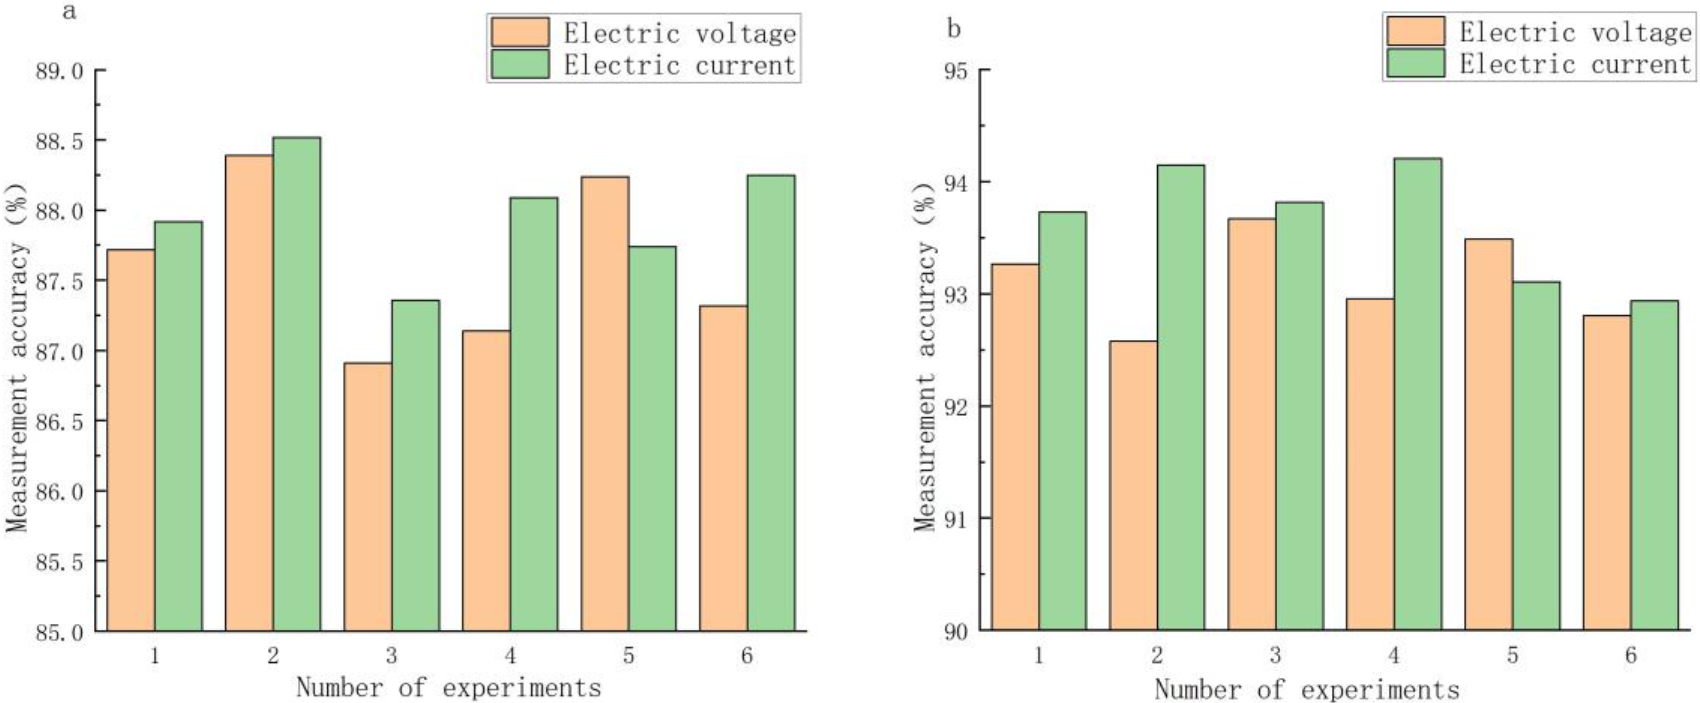
From the information in Table 1, it is known that the monitoring of the operating status of power equipment transmission lines involved three aspects: towers, insulator strings, and grounding wires. This specifically covered the issues of tilt and rust damage to the tower, surface fouling of the insulator string, and damage to the grading ring, as well as the suspension of foreign objects in the grounding wire and wire sag.
These two algorithms were used to monitor the fault indicators in the operation status monitoring of the transmission line mentioned above, and the monitoring accuracy of the algorithms was calculated. The detailed monitoring data is shown in Fig. 6.
Accuracy of power equipment monitoring using two algorithms. a. Accuracy of power equipment monitoring using traditional particle swarm optimization algorithm. b. Accuracy of Firefly algorithm for power equipment monitoring.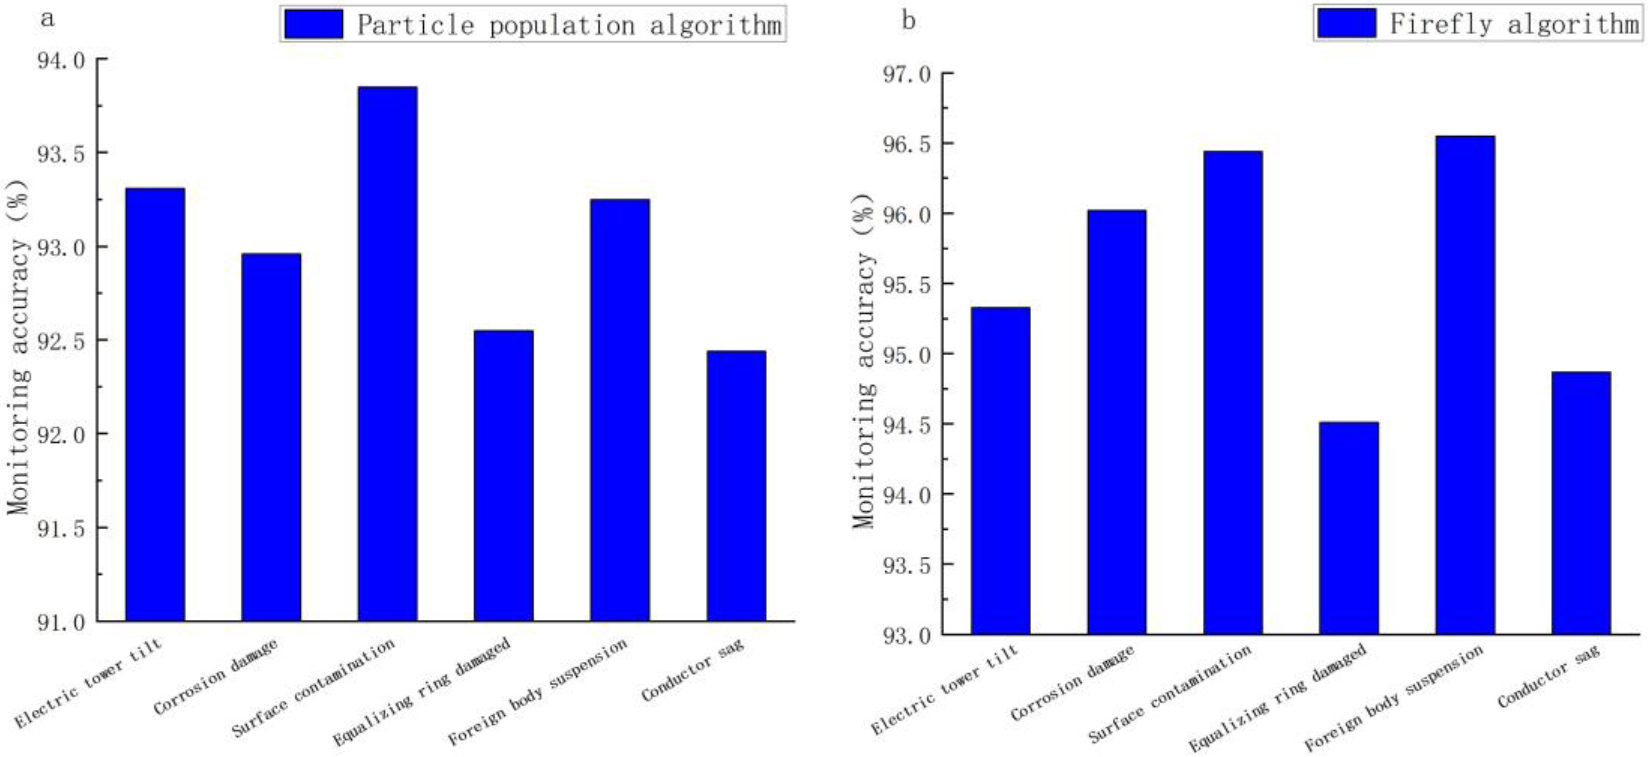
Based on the data in Fig. 6a and b, it can be seen that the Firefly algorithm has higher accuracy in monitoring various electrical devices compared to traditional particle swarm optimization algorithms. According to the calculation results, the average monitoring accuracy of PSO and firefly algorithm for various power equipment is 93.06% and 95.62% respectively. This shows that the firefly algorithm used in this paper has a more powerful power equipment monitoring ability and can deal with various power equipment problems. The reason for this improvement is that the Firefly algorithm has good robustness, so it is expected to provide support for power system operation and maintenance.
The purpose of this experiment is to evaluate the performance of the Firefly algorithm when optimizing multiple monitoring indicators at the same time. We choose voltage, current, and temperature as multiple monitoring indexes, and design a multi-objective optimization problem. By adjusting the firefly algorithm, it is adapted to deal with multi-objective optimization problems.
Firstly, we set up a multi-objective optimization problem, which takes voltage minimization, current maximization, and temperature minimization as optimization objectives. Then, the firefly algorithm is modified to introduce multiple objective functions and combine them into a comprehensive objective function. In this paper, single-objective and multi-objective optimization experiments are carried out, the number of iterations and the quality of the results are recorded, and the performance difference of the algorithm in the two cases is shown by comparative analysis. Each experiment was conducted five times, and the results are shown in Table 2.
Results of multi-objective optimization experiments
Table 2 shows the results of two sets of experiments, single objective optimization and multi-objective optimization. In the case of single-goal optimization, the number of iterations is between 110 and 151, the quality of the final result is between 0.8 and 0.88, and the execution time is between 95 and 123 seconds. In the multi-objective optimization case, the number of iterations is between 145 and 162, the quality of the final result is between 0.79 and 0.84, and the execution time is between 111 and 147 seconds. The results show that multi-objective optimization requires more iterations and execution time, and the final result quality is slightly lower than that of single-objective optimization. This is because multi-objective optimization requires trade-offs between multiple objectives, resulting in slower algorithm convergence but a more comprehensive optimization solution.
To evaluate the difference in convergence speed between the firefly algorithm and the genetic algorithm. The same initial conditions were selected in the experimental setting, and the preset accuracy was established. Run the firefly algorithm and the genetic algorithm, and record the value of the objective function or the approximation of the solution after each iteration. By recording the number of iterations, the differences in convergence speed between the firefly algorithm and the genetic algorithm were evaluated. The results obtained are shown in Table 3.
Results of convergence rate
Table 3 compares the convergence speed of the firefly algorithm and the genetic algorithm in 10 experiments. The difference between the iterations of the firefly algorithm and the genetic algorithm represents the convergence speed, which ranges from
To evaluate the generalization ability of the Firefly algorithm under different types of transmission lines and environmental conditions. The experiment selects different types of representative transmission lines and different weather and geographical conditions. The Firefly algorithm was applied to carry out risk monitoring under various transmission lines and environmental conditions, the monitoring results were recorded and their performance was analyzed, and the results under different conditions were compared to evaluate the generalization ability of the algorithm. For specific evaluation, see Table 4.
Experimental results of generalization ability
The table data reflects the monitoring ability of the firefly algorithm under different experimental conditions, and its risk assessment value is between 0.7 and 0.82. Whether it is in the high voltage transmission line on sunny days, or in the sunny environment in the mountains, the firefly algorithm has good monitoring stability and robustness. The experimental results show that the algorithm has good adaptability to different environments and can be accurately monitored in complex environments.
This paper mainly explores the application of the firefly algorithm in transmission line operating condition monitoring and develops an innovative monitoring method, which significantly improves the accuracy and reliability of state assessment. Despite the progress made, the limitations of the research were also recognized, with shortcomings in data collection efficiency and energy infrastructure. These considerations lay the foundation for future research work. It is suggested that subsequent research should focus on further perfecting the firefly algorithm to meet real-time monitoring needs and integrate it with emerging smart grid technologies. In addition, the actual deployment of the monitoring method proposed in this paper in different operating environments is critical to evaluate its scalability and economic benefits. In conclusion, this paper proposes a prospective transmission line monitoring method and advocates the use of heuristic algorithms in the field of power systems. The potential impact of the research findings goes beyond academic interest, promising to improve the stability and security of the grid, ultimately helping to enhance the resilience of modern transmission infrastructure.