






Abstract
In the face of a growing global population, optimizing agricultural practices is crucial. One major challenge is weed infestation, which significantly reduces crop yields and increases production costs. This paper presents a novel system for weed-crop classification and image detection specifically designed for sesame fields. We leverage the capabilities of Convolutional Neural Networks (CNNs) by employing and comparing different modified YOLO based object detection models, including YOLOv8, YOLO NAS, and the recently released Gold YOLO. Our investigation utilizes two datasets: a publicly available weed image collection and a custom dataset we meticulously created containing sesame plants and various weed species commonly found in sesame fields. The custom dataset boasts a significant size of 2148 images, enriching the training process. Our findings reveal that the YOLOvv8 model surpasses both YOLO NAS and Gold YOLO in terms of key evaluation metrics like precision, recall and mean average precisions. This suggests that YOLOv8 demonstrates exceptional potential for real-time, on-field weed identification in sesame cultivation, promoting informed weed management strategies and ultimately contributing to improve agricultural yield.
Introduction
Sesame, scientifically known as Sesamum Indicum, holds the esteemed title of the “queen of oilseeds” owing to its nutritious and flavorful seeds. Originating in Africa, this versatile plant has found its way into cultivation across diverse regions worldwide, including Asia, South America, and the United States. Remarkably, India has emerged as the leading global contributor to sesame production, commanding approximately 30% of the total worldwide output [1]. The Ministry of Agriculture reports impressive sesame cultivation in India, reaching 0.78 million tons [2]. India’s significance in the sesame industry is underscored by its substantial export activities, contributing significantly to the nation’s foreign exchange reserves, amounting to Rs 3761 crores. As far as in concern with farmers, sesame production serving as vital source of nutrition, used for revenue generation, sustaining farmer’s livelihood and graps overall local and global economy [3].
The presence of weed infestation causes difficulties for farmers at the time of harvesting sesame crop in the field. These unwanted plants create healthy competition with vital resources including nutrients, sunlight, space and water. Ultimately, weed degrades overall quality of crop and minimizes total agricultural produce [4]. Sometimes, weed host different types of pest and diseases and act as a major threat to proper growth of the main plants. Furthermore, overall crop quality may be tarnished due to contamination of weed seeds [5]. For effective removal of weeds, there is a need to either more invest in chemicals like herbicides or focus on additional human labor. The survey study shows that weed causes 10% to 90% loss in overall productivity of farmer. These losses depending on the types of crops and of intensity of weed infestation [6]. In the view of above-mentioned challenges, to minimize the impact of weeds on agriculture produce and to maintain sustainability in agriculture systems, there is a need to develop effective weed management [7].
The emergence of computer vision and machine learning approaches allow to develop a system capable of localizing and recognizing weeds automatically in farmlands [8]. These systems provide the exact information about the location of weeds to farmers and also help them in decision making to manage weeds effectively. The development of such systems allows us to reduce herbicide usage, to minimize the production expenses and to increase agricultural produce [9]. The automated weed management systems provide flexibility in agricultural tasks and maintains sustainability by allowing modern agricultural practices [10].
In this manuscript, we have investigated the efficacy of machine learning techniques to discriminate and localize the crop and weed images in different agricultural environment. The most widely used object detection algorithm is You Only Look Once (YOLO). The YOLO algorithm renowned for its speed, accuracy and capability of detection in real-time. Because of these capabilities, YOLO algorithms have gain significant attraction of researchers in most computer vision applications [11]. Most of the researchers widely used the YOLO algorithms to discriminate and recognize weeds automatically and thereby provided cost-effective solutions for weed management. The YOLO algorithm has the ability to identify multiple objects at once and precisely classified them [12]. This capability makes YOLO significant in precision agriculture. For accurate classification and detection of crop and weeds, our research has focused on usefulness of YOLO algorithm. In this research paper, we explored and presented the challenges faced during crop-weed identification and detection, need of automated crop-weed classification system and significance of YOLO algorithm in the agriculture field. The experimentations are carried out by providing insights into performance of algorithm, its usefulness in discriminating crop and weeds and its capability to integrate into agricultural equipment and machinery.
This research is driven by the critical need to address the common issue of weed infestation in agriculture, particularly in the growing of sesame field. Weeds adversely influenced crop quality, production, and overall agricultural yield, which underscore the need for innovative and effective weed management strategies. It is necessary to optimize agricultural practices by technology interventions due to the growing global population and increasing food demand. The objective of this study is to employ Convolutional Neural Networks (CNNs) in conjunction with cutting-edge YOLO-based object detection algorithms to develop a robust system for crop-weed classification and weed detection. This system will assist farmers to manage weeds more efficiently and to increase agricultural yields.
The main contributions of this paper are as follows:
Development of a Custom Dataset: We developed a comprehensive dataset consisting 2148 images of sesame crop and numerous weed species commonly growing in sesame farmlands, which remarkably improves the training process. Comparative Analysis of YOLO Algorithms: We utilized and compared different modified YOLO-based object detection models, including YOLOv8, YOLO NAS, and Gold YOLO, to assess their performance in weed detection. Performance Evaluation: Our results highlight that the YOLOv8 model performs significantly better than YOLO NAS and Gold YOLO in terms of performance evaluation metrics such as precision, recall, and mean average precision, demonstrating its outstanding potential for weed identification in real-time. Implementation Potential: We discussed the viability of integrating the developed weed detection system into agricultural equipments and machinery, promoting informed weed management strategies and contributing to improved agricultural produce.
The rest of the paper is structured in the following manner: An overview of research done in weed detection method is provided in Section 2. Our suggested techniques, materials and methodologies employed are detail described in Section 3, followed by experimental results and discussion of our findings in Section 4. Lastly, we concluded the paper and highlighted potential future scope of research work in Section 5.
This research paper focuses on achieving specific goals:
To design and develop a robust and accurate model for weed detection using state-of-the-art YOLO based object detection algorithms. To evaluate the effectiveness of implemented system in precisely discriminating crop-weed images in different agricultural settings. To provide the platform to deploy developed system in agriculture machinery and equipment’.
Over the years, a number of research study have been undertaken to develop efficient weed identification and detection technologies. These systems made use of a variety of conventional machine learning techniques as well as image processing techniques. A summary of some of the research on weed detection was given in this section.
In their study, Dyrmann et al. experimented by gathering six distinct datasets from several research papers and classifying 22 distinct weed species using CNNs. According to their results, the trained CNN was able to classify objects with an accuracy of 82.4% to 88.2%. This study showed how machine-learning methods utilising CNNs can improve the precision and efficiency of weed detection, which can help with the creation of weed management plans that work for the agricultural industry. These results show that CNNs can recognise and categorise different types of weeds [13].
Subeesh et al. (2022) evaluated complexity and computational needs before selecting four deep learning models (InceptionV3, Xception, AlexNet, and GoogLeNet) for their study. The purpose of these models was to detect weeds in bell peppers. Their results showed that the models’ overall accuracy varied between 94.5% and 97.7%. Notably, InceptionV3 fared better than the most complex and deep model chosen in terms of assessment metric accuracy, precision, and recall [14].
In order to recognise and categorise weeds in photos of soybean crops, the researchers dos Santos Ferreira et al. developed and applied a CNN-based method that could distinguish between monocotyledonous and dicotyledonous weeds. The study employed a set of 15,000 photos of soil, weeds, and soybeans. According to the findings, an AlexNet replication was able to analyse all of the photos with an average accuracy of 99.5%. This study showed how useful CNNs are for precisely and quickly identifying weeds in different agricultural settings, which can help with the creation of successful weed control plans [15].
A machine vision technique for weed recognition was developed by Pantazi and colleagues. It can distinguish between ten different weed kinds, including maize plants and particular species. Four hybrid classifiers were merged in this method: self-organizing feature map (SOFM), auto encoder, Gaussian classifier, and SVM. But, since it can only distinguish between four different types of weeds with an accuracy of greater than 90%, its usefulness is restricted. Moreover, the system displays significant flaws in real-world field conditions. When used, the suggested method proves to be able to correctly identify weed and crop species [16].
Taking weed density into consideration, Ashraf et al. applied two classification methods on field photos of rice. The first feature extraction technique used a Grey-Level Co-occurrence Matrix (GLCM) in conjunction with Support Vector Machines (SVM) and produced an accuracy of 73%. The second approach used a random forest classifier in conjunction with rotation moments and invariant scale to reach an accuracy of 86%. Both approaches, nonetheless, have a drawback in that they don’t particularly deal with other weed species such sedges and broadleaf weeds [17].
Materials and methods
This section covers more insights including datasets employed, materials and methodologies used, training configurations followed in this research study.
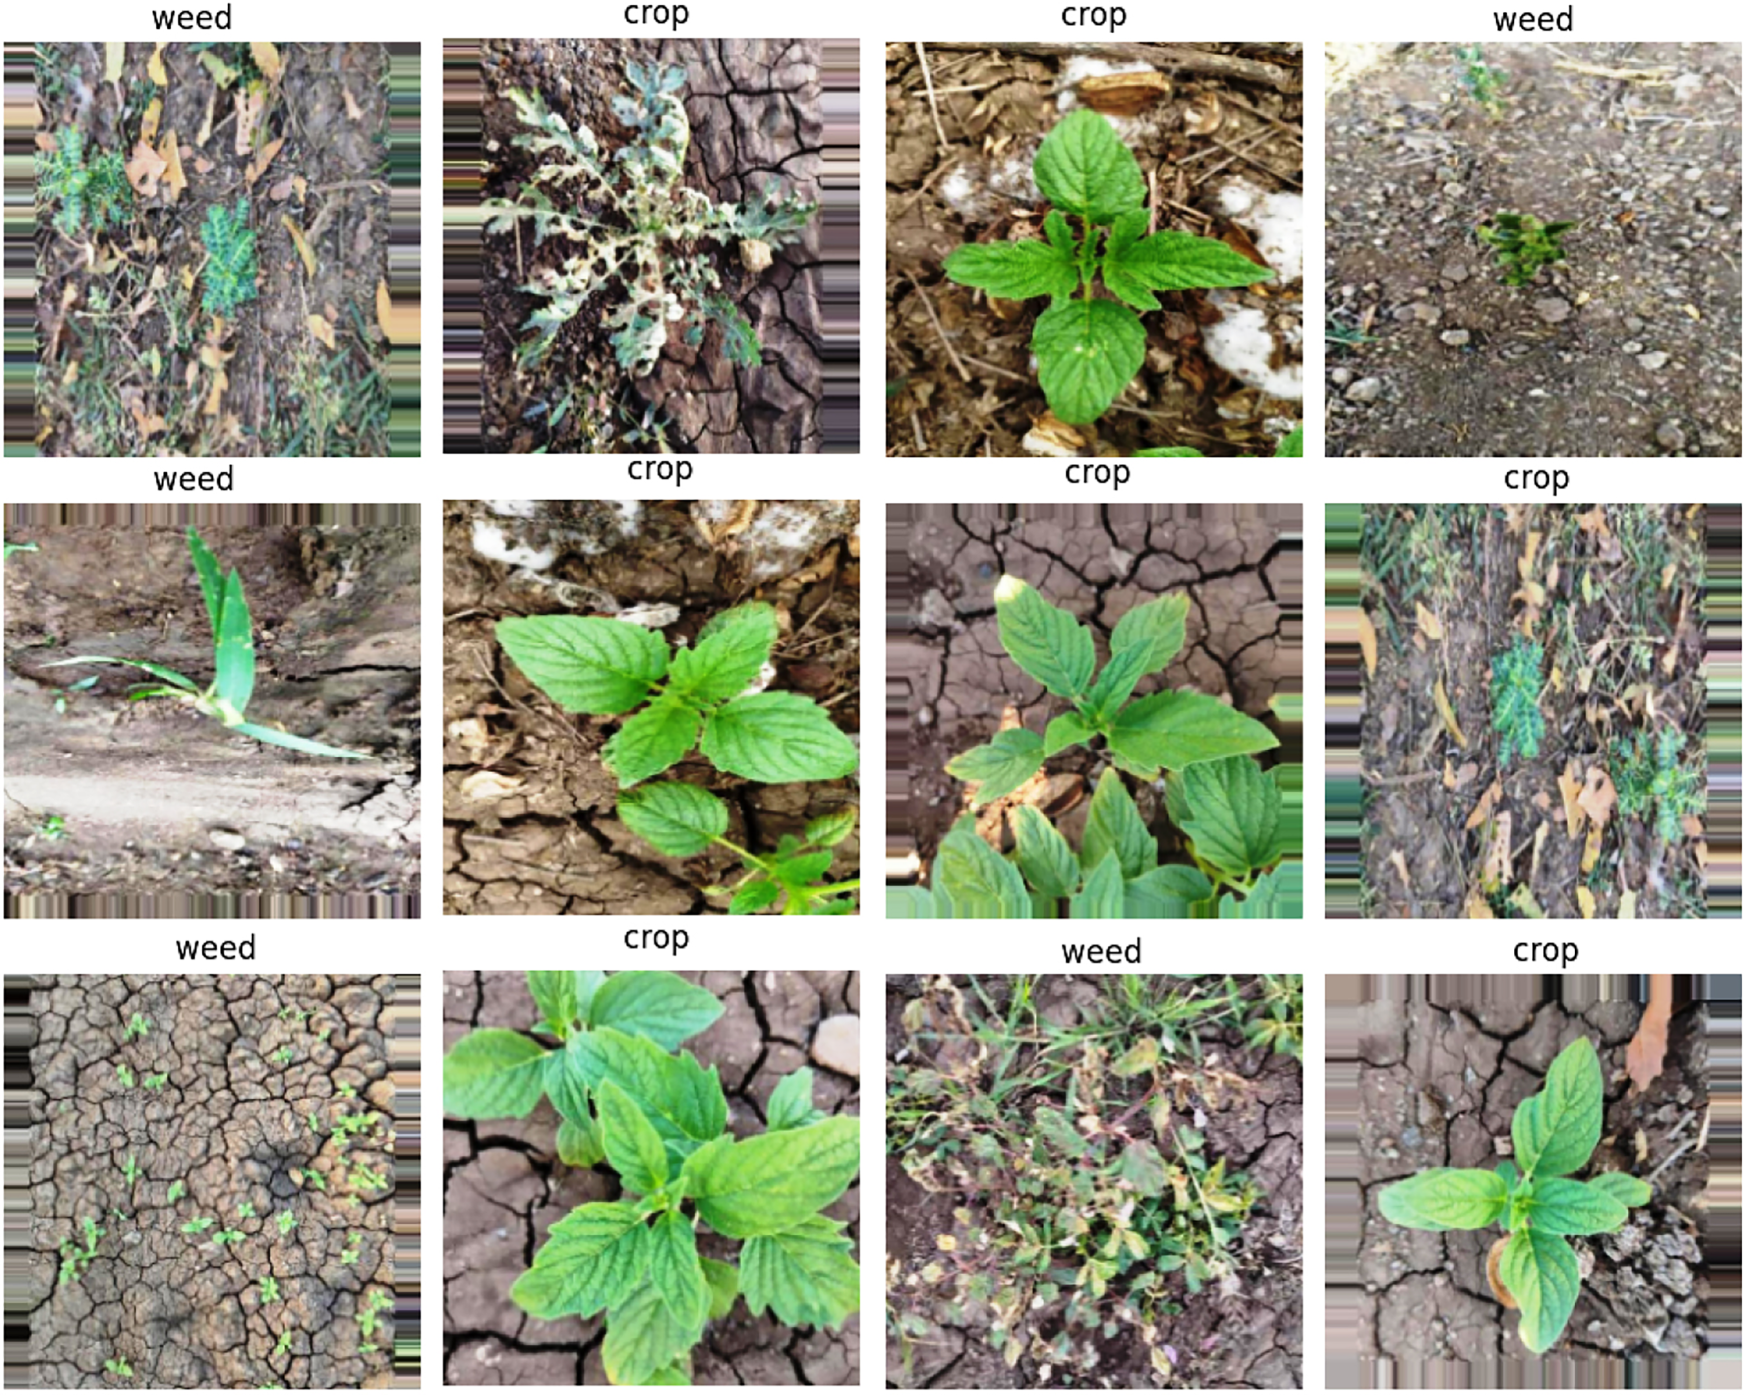
Sample images of sesame crop-weed dataset.
Detection results using YOLO v8 algorithm.
In this research work, experimentations are carried out on two datasets of sesame crops and their weeds. One public dataset is freely available on Roboflow platform [18] and in other custom dataset we acquired the real-time images in sesame farm using Redmi Note 10 (48MP) and Realme C2 (32MP) mobile phone camera.
The total number of images in public dataset are 1300. All images are in in .JPEG file format and having resolution of 4000x30000 pixels. To introduce variability, images were taken at different times, including early morning and evening. This dataset comprises 2148 images, partitioned into train (70%), test (10%), and validation (20%) sets for model evaluation and training.
Prior to model training, we applied preprocessing to enhance image quality, removing noise and adjusting contrast. The images were resized to 640x640 pixels, and the dataset was divided into train (70%), validation (20%) sets and test (10%), consisting of 900, 263 and 137 images, respectively. The dataset includes two directories – ‘images’ with .jpg files and ‘labels’ with text files containing coordinates (class, x coordinate, y coordinate, height, and width) for actual (ground truth) bounding boxes [19]. Sample images from the datasets are presented in Fig. 1.
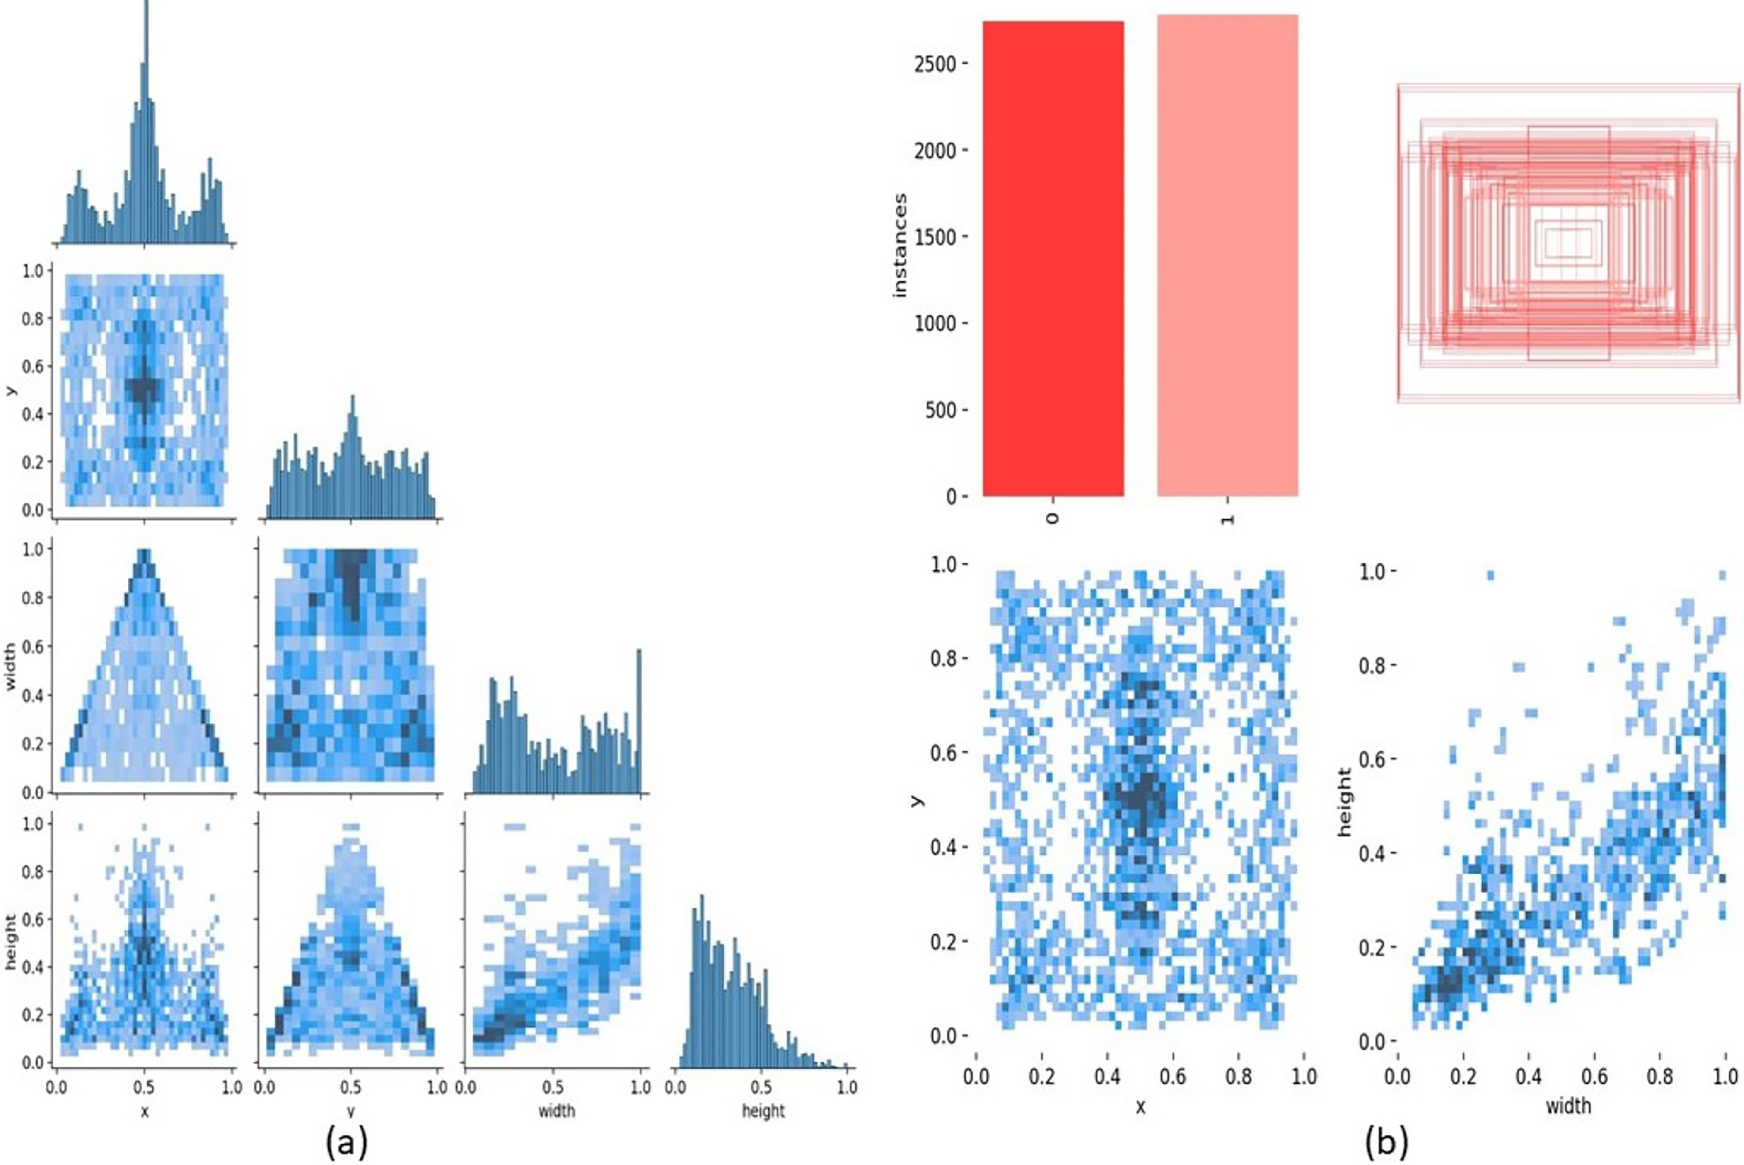
The correlogram presented in Fig. 2. serves as a visual representation, distinctly portraying the distribution of labels and the correlation among the respective classes. This visual aid is invaluable for discerning patterns or correlations in the distribution of object annotations across various classes and scales within the dataset.
Figure 2a specifically displays the label distribution of the dataset, which encompasses two classes-crop and weed. In this dataset, both classes collectively account for 800 instances. Meanwhile, Fig. 2b focuses on the label correlation, offering an illustrative correlogram of the dataset. This visual representation elucidates the x and y coordinates height and width of the actual bounding boxes corresponding to both weeds and crops within the dataset. These visual insights are instrumental in comprehending the spatial relationships and distribution patterns of labels, aiding in the optimization of the weed detection model for accurate and effective performance.
Methodology
In the context of precision agricultural practices, there is a need to focus more on crop-weed classification and detection. As shown in Fig. 3, the proposed methodology provides a systematic approach, starts with gathering of diverse dataset containing images of crops and weeds. Then further several pre-processing operations were performed to normalized the input images of dataset. As a part of pre-processing, YOLO model incorporated data augmentation technique was performed to increase number of images in dataset [15]. Then, next open-source data annotation LabelImg tools [16] was employed for precise labelling of images before applied for training. Furthermore, the appropriate model was chosen for effective crop-weed classification and detection task. Following this, model was trained for sufficient numbers of epochs. Then, next trained model was applied for real-time crop-weed classification and detection in sesame farmlands. Finally, the system was integrated into agricultural machinery and equipments for its possible uses in advancing precision agriculture.
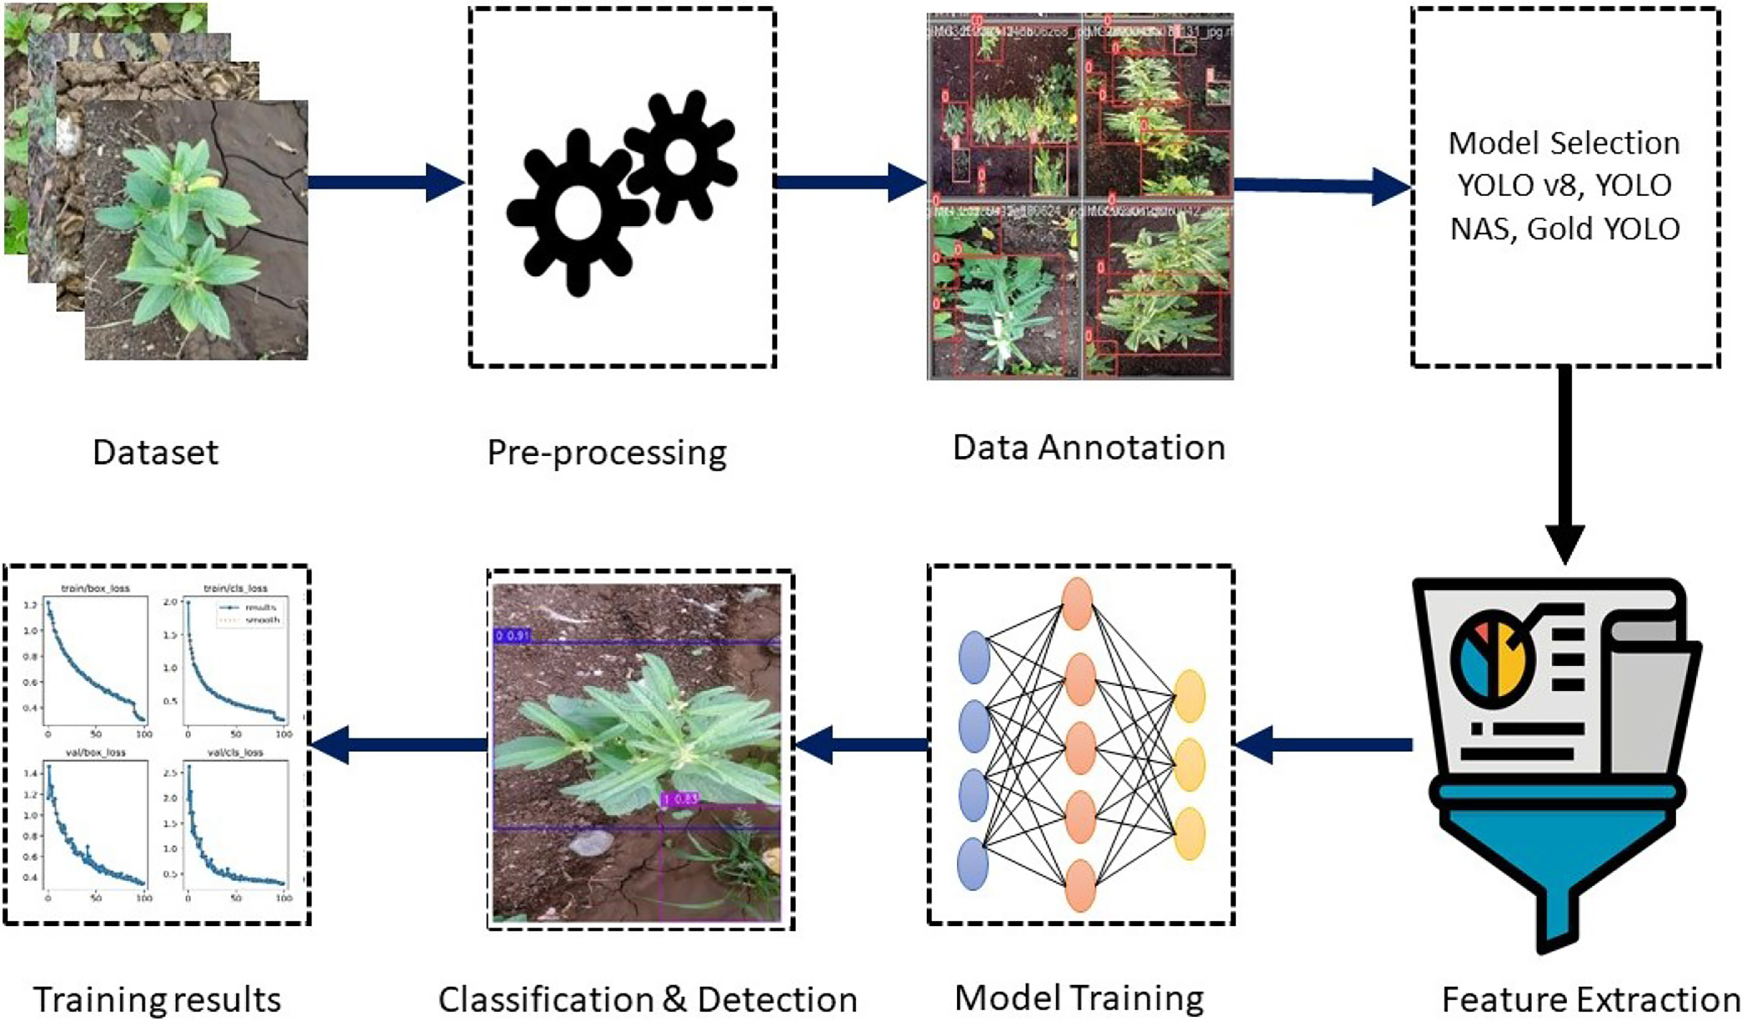
Steps of implementation of proposed system.
YOLO is object detection algorithm popularly known for its high-speed, high-accuracy and real-time detection capability. The algorithm used an only one neural network, divides images into grids and makes predictions of bounding boxes and class probabilities simultaneously within single pass. These capabilities make YOLO algorithm highly applicable for several agricultural applications.
YOLO-NAS (Neural Architectural Search) is another well-known object detection algorithm, developed by Deci. This algorithm employes NAS architecture to design its own architecture automatically. These capabilities make the algorithm unique and optimized for task specific. Comparatively, it has remarkable inference speed, higher mAP on standard datasets like-COCO and PASCAL-VOC. Moreover, YOLO-NAS is superior in handling quantization, found to be more efficient when integrating on hardware platform, thereby it contributed more effectively in real-time applications [17].
GOLD YOLO is another state-of-the-art object detection algorithm superior in terms of speed and accuracy. The algorithm employs a “Gather-and-Distribute” mechanism to address a “information fusion challenge” in object detection. This mechanism increases the ability of model to merge features from several image scales, thereby, providing a strong object identification and localization. Moreover, this algorithm first time deployed “Masked Auto encoders” (MAE) inspired pretraining technique in YOLO series. This feature allows the model to take the benefit of unlabeled data, thereby increasing their accuracy and generalizability [18].
YOLOv8 is a cutting-edge object detection approach that outperforms other algorithms by improving accuracy through deployment of novel approaches and optimization techniques. Without scarifying processing time, YOLOv8 explored significant improvements in detection speed when compare with other object detection algorithms [19]. This adaptability is exemplified by YOLOv8’s support for various backbones, including ResNet, CSPDarknet and EfficientNet depending on the balance of speed and accuracy required. To improve how well YOLOv8 handles different situations (generalization), the creators use special methods (MixUp and CutMix) to generate more training data. This also makes YOLOv8 very adjustable, letting users change its design to fit their needs [20].
YOLOv8 stands out because it eliminates the need for anchor boxes. This reduces the number of potential bounding boxes considered, speeding up the process of selecting the best ones. The utilization of mosaic augmentation enhances training efficiency, a technique disabled in the final ten iterations [21]. YOLOv8 boasts a range of improvements that make it suitable for many computer vision tasks, including object detection, segmentation, pose estimation, tracking, and classification. It even tackles labeling, training, and deployment. Notably, YOLOv8 comes nano, small, medium, large, and extra-large sizes. Demonstrating its power, the largest version (extra-large) achieves an impressive 53.9% Average Precision (AP) on the standard MS COCO dataset while processing images at 640 pixels. Even more impressive, it maintains a fast speed of 280 frames per second on a powerful NVIDIA A100 system with TensorRT optimization [22].
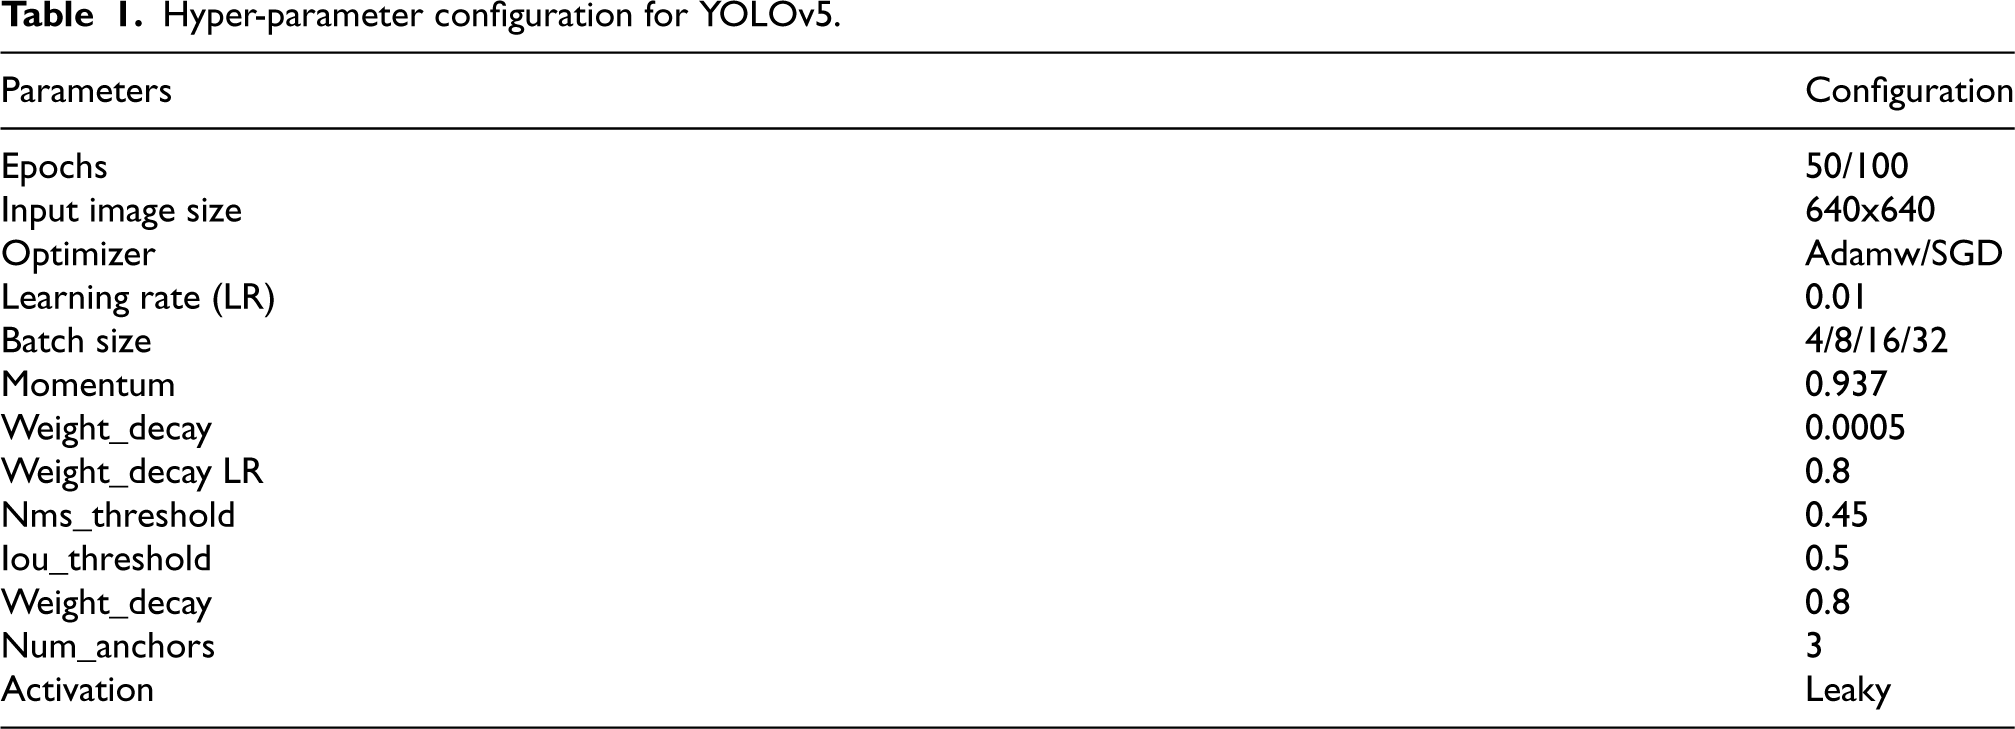
The hyper parameters [23] used in this study are given in Table 1. The effectiveness of YOLO object detectors in identifying weeds was assessed by utilizing measures like recall, precision, and mean average precision (mAP), as elaborated in the following sections [24].
Hyper-parameter configuration for YOLOv5.
Hyper-parameter configuration for YOLOv5.




To enhance YOLO’s performance on both datasets, we implemented a multi-pronged approach. First, we trained the models entirely from scratch, giving them a clean foundation for learning. Second, we customized the model by fine-tuning of various hyper-parameters like epochs, batch size, optimizer, and learning rate to optimize the training process for each dataset. Hyper-parameter tuning can help to improve the accuracy of model, speed up the training process. Finally, we incorporated Non-Maximum Suppression (NMS) method to ensure models generate most accurate object detections possible [27, 28, 29].
Performance of YOLO object detector
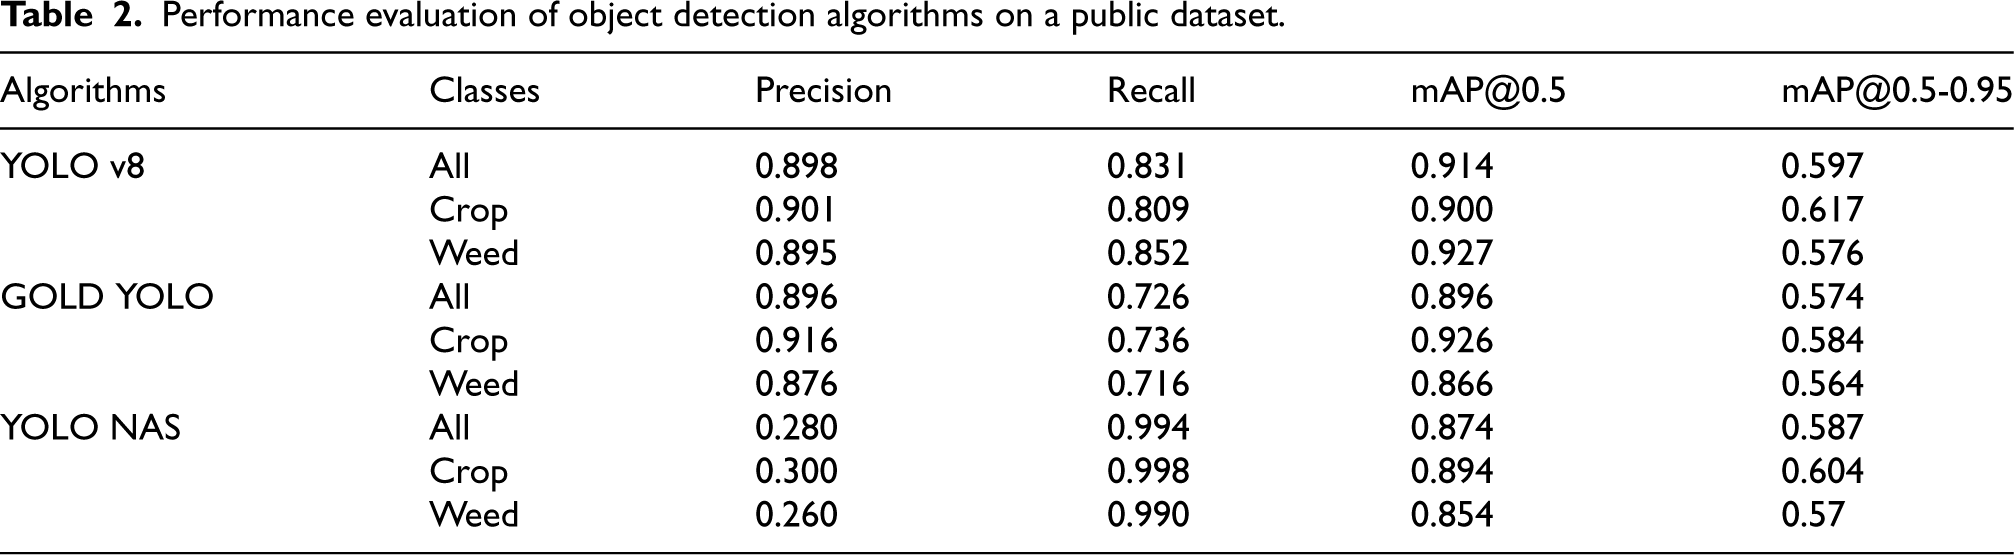
Performance evaluation of object detection algorithms on a public dataset.
Performance evaluation of object detection algorithms on a public dataset.
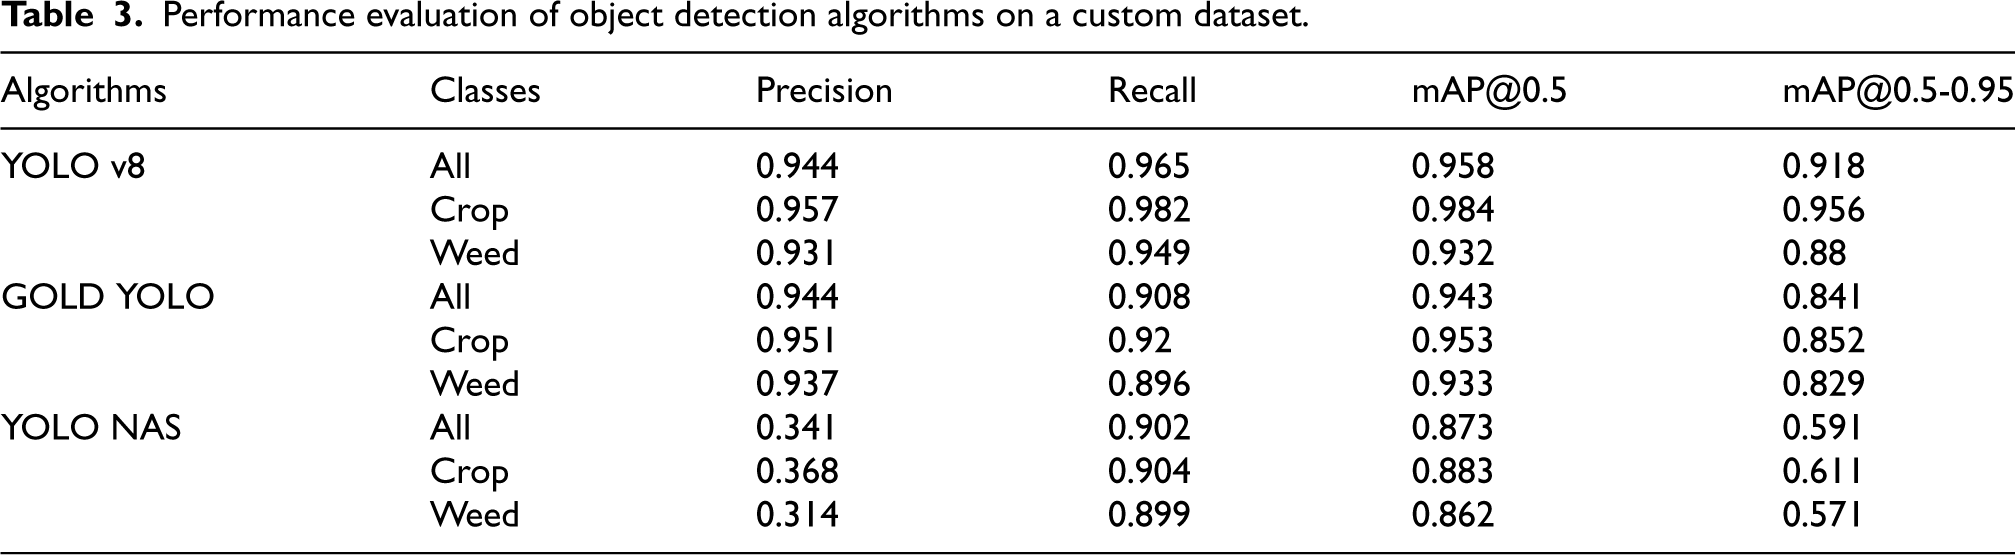
Performance evaluation of object detection algorithms on a custom dataset.
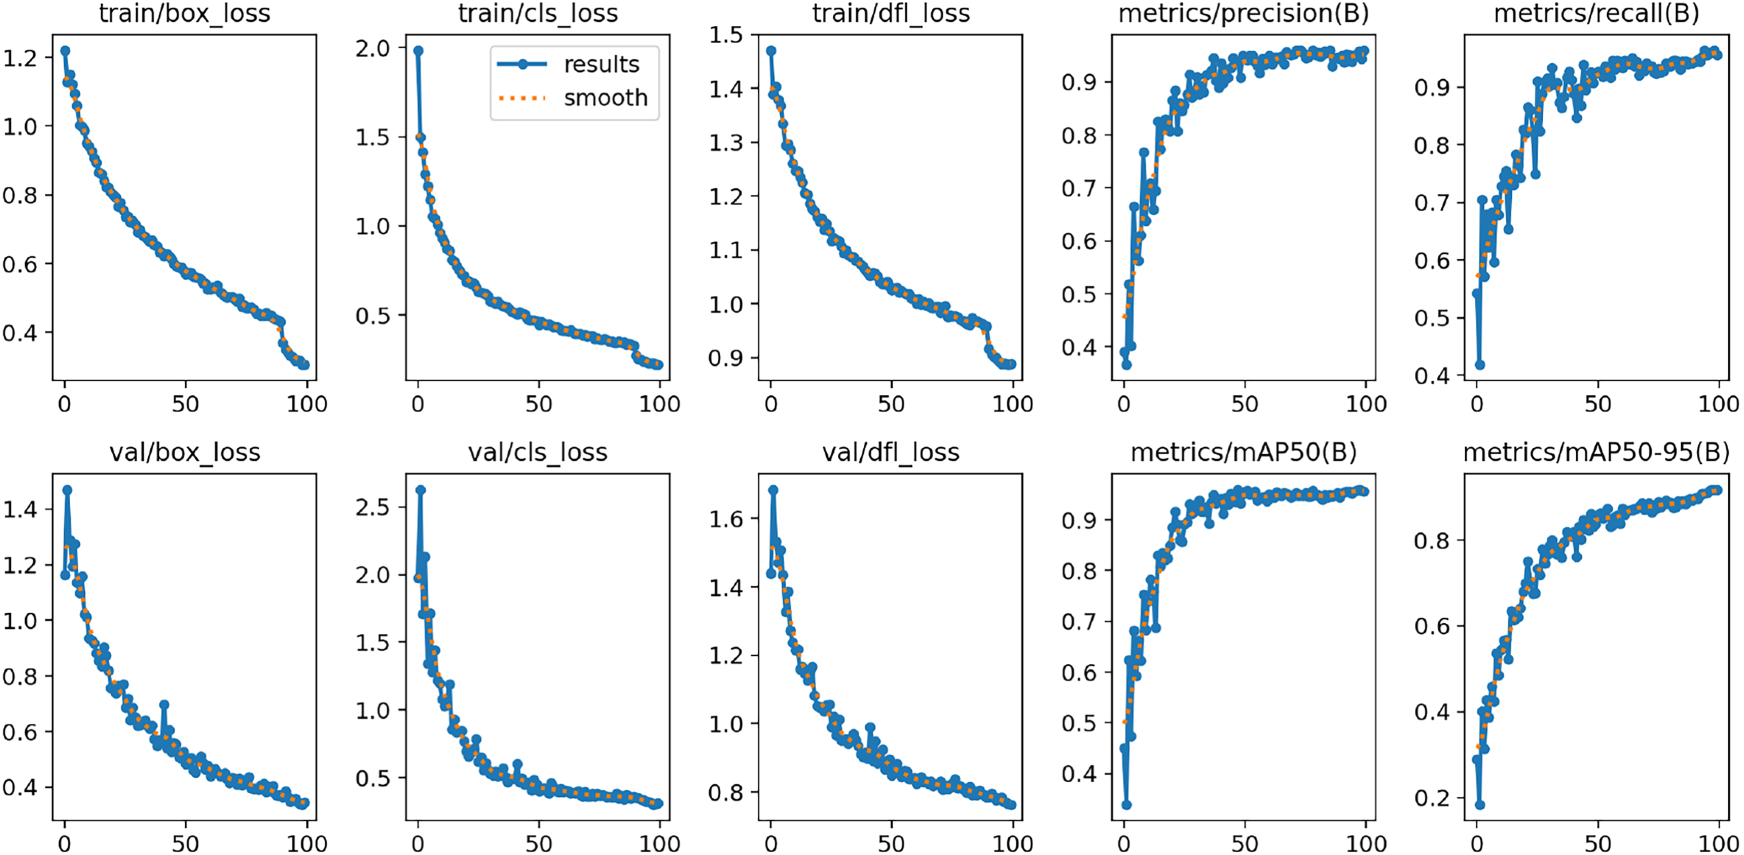
Training results on YOLO v8 algorithm.
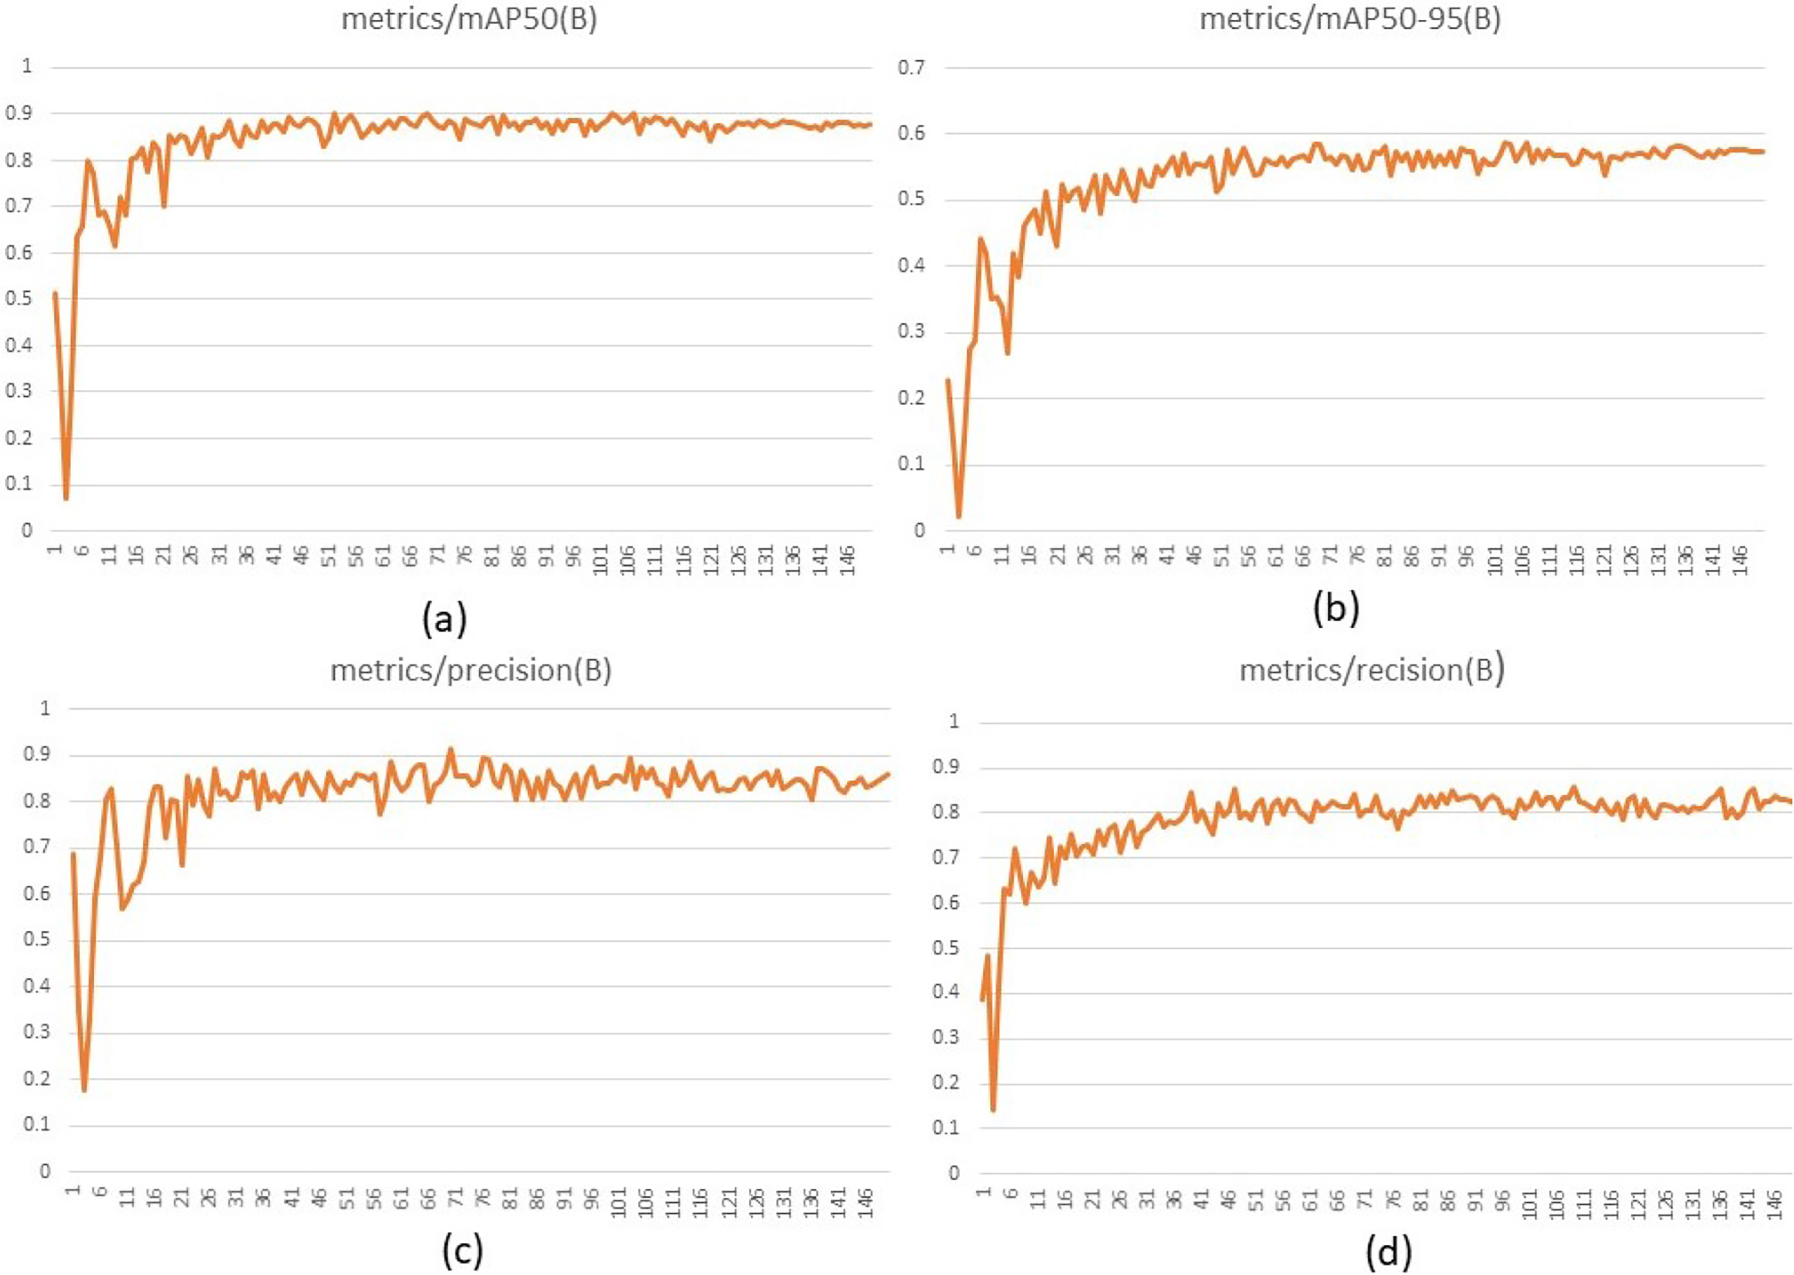
Tensorboard visualization of YOLO v8 performance.
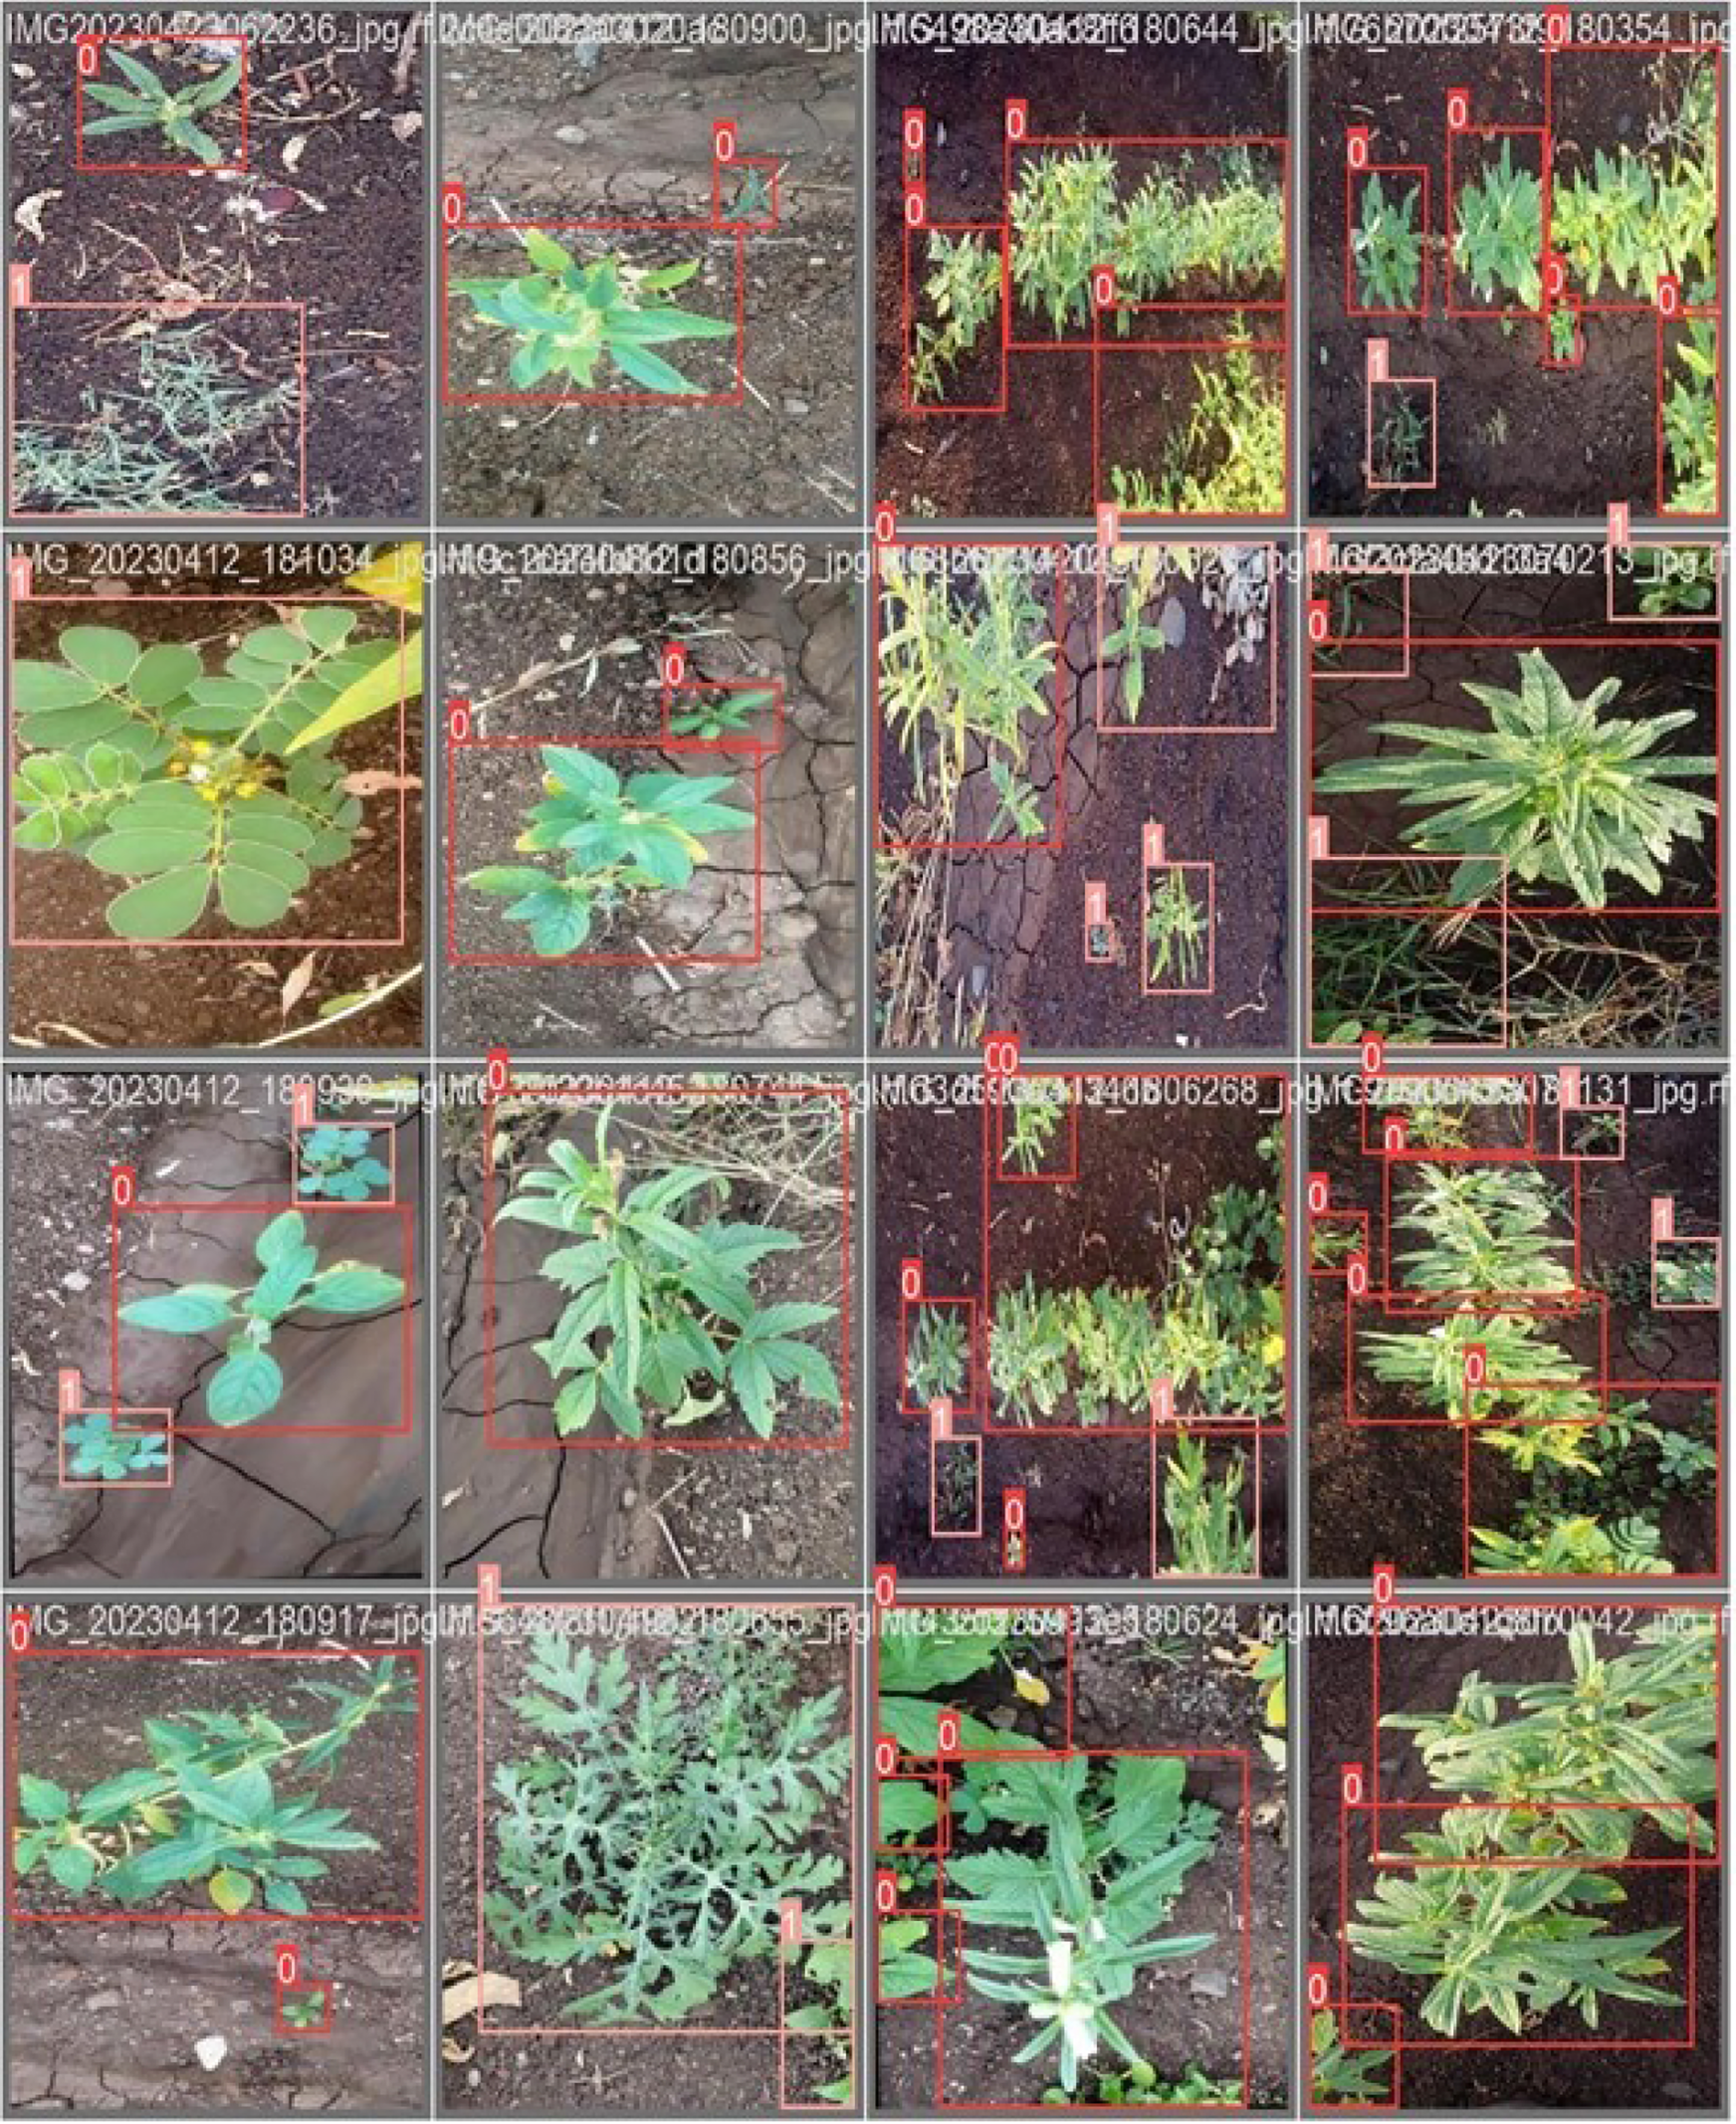
Image annotation of input images with bounding-boxes.
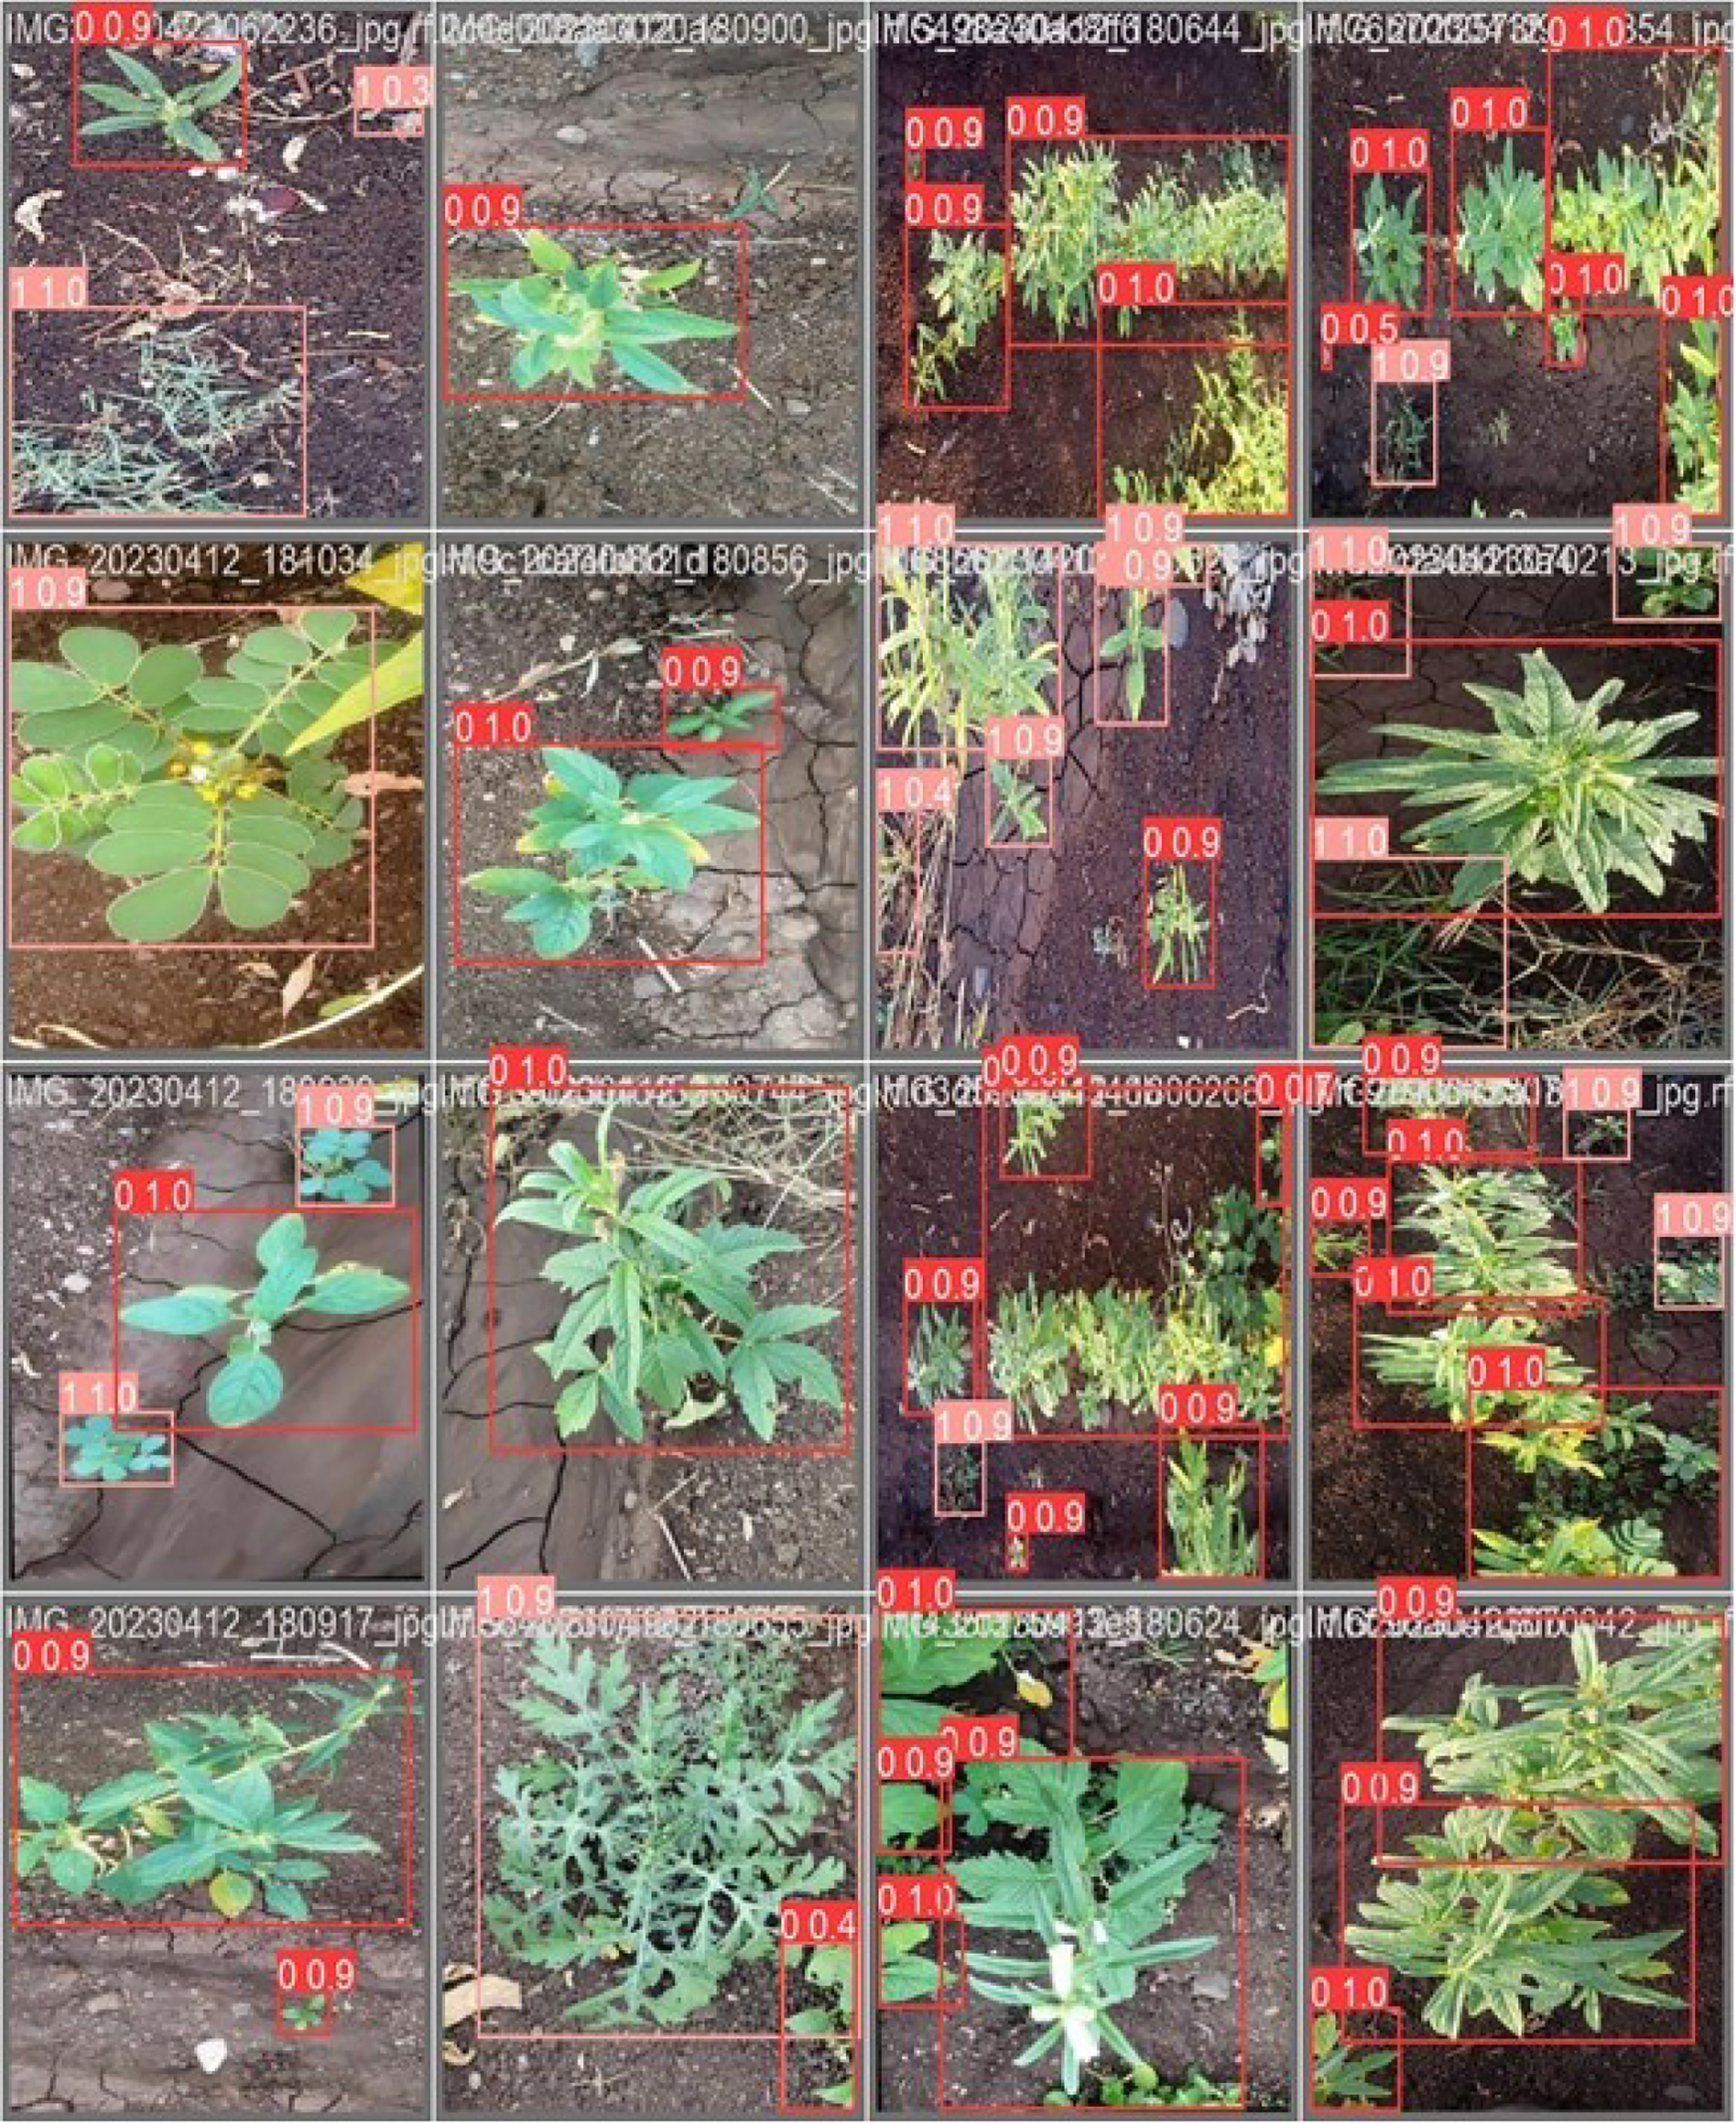
YOLOv8 detections with a confidence 0.5 interval.
Tables 2 and 3 presented a performance evaluation of three different algorithms on both datasets. The evaluation metrics include Precision, Recall, mAP@0.5 and mAP@0.5-0.95.
The Table 2 summarizes a performance evaluation of three different algorithms, namely YOLO v8, GOLD YOLO, and YOLO NAS, in the context of weed-plant classification and detection, presumably in sesame fields. The metrics utilised for assessment are Recall, Precision, and mean Average Precision at intersect over unions (mAP@0.5), and mAP across broader range of IoU thresholds (mAP@0.5-0.95).
For YOLO v8, it demonstrates a high Precision of 0.898, indicating a lower false positive rate, while achieving a Recall of 0.831, showcasing its effectiveness in identifying true positive instances. The mAP@0.5 value is 0.914, suggesting a strong overall performance at a specific IoU threshold, and the mAP@0.5-0.95 of 0.597 indicates its capability across a broader range of IoU thresholds. GOLD YOLO also exhibits commendable performance with a Precision of the 0.896, indicating a high level of accuracy. However, its Recall is slightly lower at 0.726, suggesting a higher rate of false negatives. The mAP@0.5 score is 0.896, displaying its effectiveness at a specific IoU threshold, and mAP@0.5-0.95 of 0.597 indicates its capability across a broader range of IoU thresholds. In contrast, YOLO NAS demonstrates a significantly lower Precision of 0.28, suggesting a higher false positive rate, while achieving a Recall of 0.694, indicating its capability to acquire a larger number of positive instances. The 0.874 score of mAP@0.5 suggesting efficay of algorithm at given threshold value of IoU while 0.587 result of mAP@0.5-0.95 indicating considerable performance across average range of IoU thresholds.
The Table 3 presented training performances of three different YOLO variants on custom dataset. The performance YOLO v8, GOLD YOLO, and YOLO NAS models was evaluated in terms of Precision (P), Recall (R) and mAP@(0.5 and 0.5-0.95). The precision metric indicating correctness of positive predictions, and found to be high across all the three algorithms at 0.944, demonstrating low rate of false positives. Recall another metric has consistently high score at 0.965, representing a robustness of algorithm to detect weeds in sesame farmlands. The 0.958 value was attained for mAP@0.5 metric, thereby metric provided a detailed usefulness of algorithm’s performance, considering both precision and recall. Similarly, metric mAP@0.5-0.95 achieved 0.918 score for YOLOv8. This metric represented strong performance of algorithm across a wide range of confidence thresholds, focusing their consistency in accurate detection.
The Fig. 4 presented result exhibited after training of YOLO v8 model demonstrated that YOLO v8 achieved lower values for loss in both testing and validation set and obtained maximum scores for precision, recall, and mAPs. The figure visually represents the variations in recall, precision, recall, mAP@0.5, and mAP@0.5-0.95 (on Y-axis) across each iteration (epoch) of training (on X-axis). At the end of each iteration, the change in the all the performance evaluation metrics is noted. This graphical representation offers insights into how the YOLO v8 model performed in relations of precision, loss, mAP and recall, metrics throughout training process.
The Fig. 5 demonstrated performance visualization of YOLO v8 algorithm using TensorBoard. TensorBoard provides features to keep the track of the performance of model and also suggests the area for further improvements. The visualization using TensorBoard allows to gain more insights into training performance of given algorithm.
In Fig. 6, a red bounding box surrounds an area containing both crops and weeds. The model assigns labels to these objects: ‘0’ for crops and ‘1’ for weeds. As depicted in Fig. 7, a confidence score near 1.0 (or 100%) signifies high model confidence in its classification, meaning it is highly confident in its prediction that the object is a crop. Conversely, a score around 0.6 (or 60%) indicates moderate confidence. While the model leans towards a specific classification (crop or weed in this case), the lower score suggests less certainty compared to a high-confidence detection. To enhance the precision of bounding box predictions, YOLOv8 utilizes the NMS technique. Typically, object detection algorithms around a single item generate bounding boxes with different confidence scores. The NMS method retains the most precise bounding boxes and eliminates unnecessary and unimportant ones.
In addressing the imperative to mitigate the detrimental effects of weeds, there is a need to develop a system capable of distinguishing between crops and unwanted plants. To achieve this goal, a comprehensive approach was adopted, leveraging a combination of a publicly available dataset consisting of 1300 images and a custom dataset comprising 2148 images. The proposed system utilizing three state-of-the-art object detection algorithms – YOLO v8, YOLO NAS and Gold YOLO for recognizing real-time images of crops and weeds in sesame fields. The performance of these algorithms were analyzed in term of performance evaluation metrics including precision, recall and mAP.
In view of results obtained in this research, we conclude that YOLO v8 has significantly better performance than any other algorithm used in this work. YOLO v8 attained precision score of 0.898 and 0.944, recall value of 0.831 and 0.965, mAP result of 0.914 and 0.958 and mAP@0.5-0.95 score of 0.597 and 0.918 in public and custom dataset respectively. The use of NMS approach and hyperparameter fine-tuning produces remarkable performance in this study. The outstanding performance of YOLO v8 on both datasets demonstrated the usefulness of YOLO v8 algorithm in accurate classification of both crop and weeds, thereby confirming its applicability for real-time weed management systems. Our future will focus on integration of YOLO based system in agriculture machinery for real-time detection of weeds in sesame farmlands.