
Abstract
INTRODUCTION
Alzheimer’s disease (AD) is a neurodegenerative disorder associated with a gradual and progressive decline of memory and learning [1]. The deposition of amyloid-β (Aβ) peptides, leading to the formation of senile plaques and ultimately resulting in the loss of neurons, is considered a critical event in the pathogenesis of AD [2]. Risk factors for AD include older age, presence of the apolipoprotein ɛ4 allele, head injury, low education, cerebrovascular disease, and smoking, and insufficient sleep has recently been added to this list [3].
Several recent studies have linked sleep deprivation with AD [4–9]. Clinical studies have shown that sleep loss increases the occurrence of AD [4], and further investigations have added weight by finding that levels of Aβ rise during wakefulness and decrease during sleep [6] and that sleep deprivation increases Aβ levels in the cerebrospinal fluid (CSF) of healthy adults [8]. Furthermore, animal studies have shown that the loss of sleep can increase Aβ production in both neurons [7] and astrocytes [9], and that sleep deprivation leads to an increase of extracellular Aβ levels, resulting in extracellular Aβ plaque formation [5]. These findings suggest that sleep deprivation may increase the occurrence of AD by increasing Aβ production.
The increase in Aβ levels by sleep deprivation may not only be due to increased production, but also reduced clearance. Xie and colleagues found that sleep deprivation reduces the clearance of Aβ by the “glymphatic system”, which in essence is a lymphatic system for the brain that clears interstitial proteins by convective exchange of CSF and interstitial fluid [10]. Clearance by microglia is another major mechanism that clears extracellular Aβ from the brain [11]; however, to date, no studies have focused on how sleep modulates this.
Orexin (also known as hypocretin) is a major modulator of the sleep–wake cycle, and its main actions are promoting wakefulness and consolidating sleep [12]. Discovered in 1998, orexin peptides have two subtypes (orexin-A and orexin-B), which originate from a common precursor protein (preproorexin) and two G-protein coupled receptors (orexin-1 receptor and orexin-2 receptor) [13]. Orexin-A has similar affinity for both orexin receptors, but orexin-B binds mainly to the orexin-2 receptor. Cells expressing orexin RNA originate from the lateral hypothalamus, and orexin receptors have been located in numerous areas of the brain. Studies have shown that extracellular [14] and CSF [15] levels of orexin-A increase after sleep deprivation, reflecting its role as a promoter of wakefulness. In addition, high levels of orexin have been associated with high intracranial levels of Aβ [16] and amyloid deposition in the brain [5, 17], and investigations have also shown that orexin reduces the motility [18] and cytokine production [19] of microglia.
Based on the aforementioned studies, we speculated that orexin might be involved in the clearance of extracellular Aβ fibrils by microglia. In this study, we showed for the first time that orexin suppresses the uptake and degradation of extracellular Aβ fibrils through phagocytic- and autophagic-processes, thereby affecting the clearance of extracellular Aβ fibrils by microglia.
MATERIALS AND METHODS
BV2 cell line
Microglial BV2 cells (a gift from Professor Onyou Hwang, University of Ulsan College of Medicine) were thawed from a pre-prepared stock and grown in Dulbecco’s modified Eagle’s medium (DMEM), high glucose (Life Technologies, Inc., 21013024) with 5% fetal bovine serum (FBS; Life Technologies, Inc., 10082147), and 1% PenStrep (Life Technologies, Inc., 15140122), at 37°C in a humidified 5% CO2 incubator, on 12 well plates. After the cells settled, they were treated with either fibrillary Aβ (fAβ) (1 μM) and orexin-A (OXA) (Sigma, O6012); fAβ (1 μM) and orexin-B (OXB) (Sigma, O6262); or fAβ only. Then they were cultured for 5 min, 30 min, 2 h, or 24 h. OXA and OXB were added 30 min before fAβ to assure it had enough time to be absorbed by the cells prior to treatment by fAβ. Both OXA and OXB were used to investigate differences between the orexin receptors.
Preparation of fibrillar Aβ
Aβ1 - 42 (Aβ) and FITC-Aβ1 - 42 (FITC-Aβ) (Bachem, H-1368, M-2585) were dissolved in DMSO at a concentration of 500 μM. Fibrillaryforms were maintained with the addition of a conditioning medium (DMEM-F12 with 10% FBS, 10% or DMEM with 5% FBS) and incubation at 37°C for 24 h.
Western blot analysis
Western blot analysis was done following general methods and previously published protocols. The following primary antibodies were used: anti-Aβ (6E10;1:1000; Covance, SIG-39340), anti-p-p38 (1:1000, Cell signaling, #9211), anti-p-Akt (1:1000, Cell signaling, #9271), anti-PI3K (1:1000, Sigma, GW21071), anti-LC3B (1:1000; Sigma, L7543), anti-p62 (1:1000; Cell signaling, #5114), and β–actin (1:5000; Sigma, #A5114). Anti-Aβ was used for quantitative analysis of Aβ levels [20]. Anti-p-p38, anti-p-Akt and anti-PI3K were used to examine phagocytosis [21–25]. Anti-LC3B and anti-p62 were used as indicators of autophagy [20]. After the previously defined reaction times had passed, the media were collected with care taken not to detach any cells. Afterwards, intracellular reactions were halted, cells were lysed using ice-cold Pro-prep (Intron #17081), and then the cells were scraped using a cell scraper. The sample was centrifuged at 13,200 rpm for 15 min at 4°C. The pellets were discarded and protein concentrations of the supernatant were measured using the Bradford method. Then 2.2 μL of each sample was mixed with 217.8 μL water, and 100 μL of this mixture was added to an equal amount of Bradford reagent. The concentrations were measured by spectrophotometry. The samples were set on ice whenever possible. Western blot samples were manufactured based on the results of spectrophotometry. For the detection of Aβ by 6E10, 15% tricine gels were used; to detect LC3 and p62, 10% and 12% glycine gels were used. Tricine and glycine gels were created by mixing water, sodium dodecyl sulfate (SDS), ammonium persulfate (APS), and TEMED with 40% and 30% acrylamide, respectively. Equal amounts of protein were loaded into each well, and the gel was run at 100 to 110 V for 50 to 80 min. Then proteins from the gel were transferred to a membrane for 50 min at 110 V. After transfer, the membranes were soaked in a 3% bovine serum albumin (BSA) or 5% skim milk blocking buffer for 1 h, and incubated with the primary antibody overnight. Finally, the membrane was further incubated with a secondary antibody and then a luminol agent, and it was developed in a darkroom. Membranes were washed six times after each incubation. Image J (Image Processing and Analysis in Java, National Institutes of Health) was used for band quantification andanalysis.
Phalloidin staining
Phagocytosis involves actin polymerization; thus, phagocytic processes can be observed through staining by phalloidin, a bicyclic peptide that binds F-actin with high selectivity and photostability. Furthermore, observation of “phagocytic cups”, which are formed by F-actin during macrocytic engulfment of large particles, can be used to compare levels ofphagocytosis [23].
FITC-fAβ and orexin-treated BV2 cells on coverslip were permeabilized by incubation for 30 min in phosphate buffered saline, pH 7.4, containing 0.1% Triton X-100, 2% BSA, and 2% normal horse serum. For the specific staining of F-actin, cultures on the coverslip were incubated in a solution of rhodamine conjugated phalloidin (Thermo Fisher scientific, #R415) for 20 min and stained with DAPI. Coverslips were mounted using DAKO fluorescence mounting medium and examined under a Nikon Eclipse Ti-E microscope (Nikon Instruments Inc., NY) using NIS-Elements Microscope ImagingSoftware.
Observation of FITC-fAβ uptake and degradation
The phagocytosis of extracellular fAβ by BV2 cells was assessed using FITC-fAβ. The culture conditions were the same as in the previous experiments. Afterwards, cells were stained using DAPI in a DAKO fluorescence mounting medium. A Nikon Eclipse Ti-E microscope (Nikon Instruments Inc., NY) and NIS-Elements Microscope Imaging Software were used for fluorescent image processing.
Autophagic flux assay
To verify whether changes in LC3-II levels were due to increased autophagic induction or decreased autophagic flux, we co-treated the OXA or OXB-treated BV2 cells with bafilomycin A1 (Baf.A1, 25 nM) and fAβ. Baf.A1 is an inhibitor of vacuolar v-ATPase, and inhibits the fusion of autophagosomes and lysosomes, thereby preventing the maturation of autophagic vacuoles [26]. Hence, similar levels of LC3-II in cells co-treated with Baf.A1 and orexin compared with cells treated with orexin only indicate that orexin suppresses autophagicflux.
To investigate whether orexin influences autophagic flux in fAβ-treated cells, BV2 cells on the coverslip were transfected using mCherry-GFP-LC3 (a gift from Professor Heuiran Lee, University of Ulsan College of Medicine) with Lipofectamine 2000 (Thermo Fisher Scientific, #11668) according to the manufacturer’s instructions and then treated with orexin and fAβ. After incubation for 24 h at 37°C, cells with both GFP and mCherry signals (yellow) and/or only mCherry signals (red) were observed, using a Nikon Eclipse Ti-E microscope (Nikon Instruments Inc., NY) and compared to assess autophagosome maturation using NIS-Elements Microscope Imaging Software.
Statistical analysis
Two-tailed Student’s t-tests and Mann-Whitney U tests were used to compare data. The results of statistical analysis are presented as the means±SEM of at least three independent experiments. p < 0.05 was considered significant.
RESULTS
Orexin suppresses the uptake of fAβ in BV2 microglial cells
BV2 microglial cells were treated with fAβ and incubated as described above for 30 min (Fig. 1) or 24 h (Fig. 2). Afterwards, western blot analysis of intracellular Aβ levels was conducted for quantitative analysis. In control cells, intracellular fAβ levels increased rapidly during the first 30 min (Fig. 1A). However, in cells treated with OXA or OXB, Aβ levels increased more slowly, suggesting that orexin may have affected the uptake of fAβ.
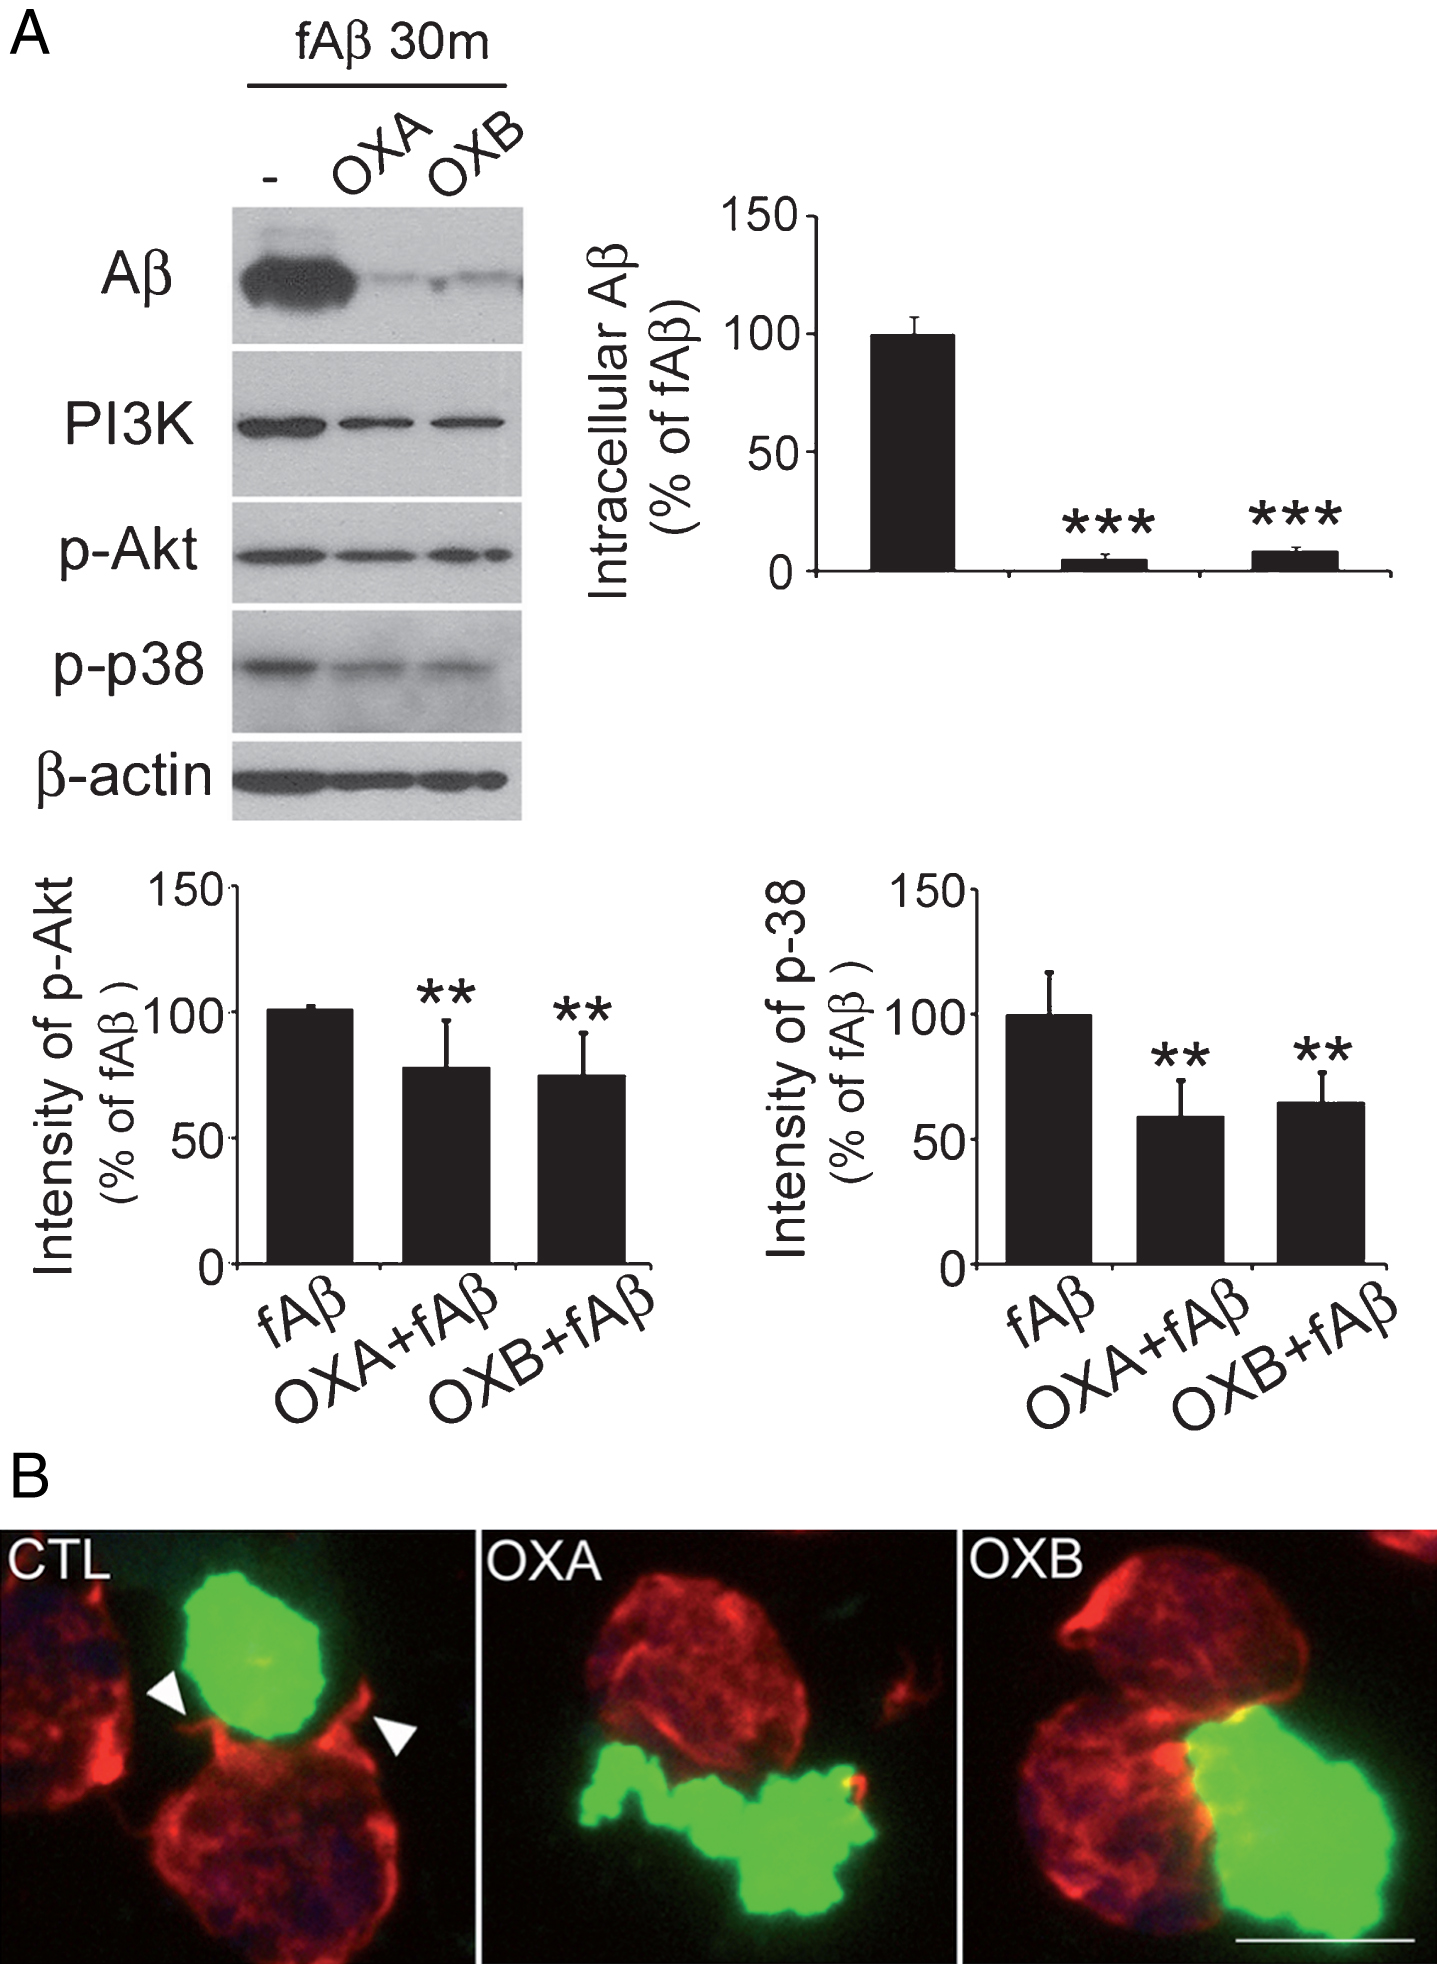
Orexin suppresses the uptake of amyloid-β (Aβ) in BV2 microglia cells. A) Western blot analysis after 30 min of treatment with fAβ showed higher levels in control cells than in cells treated with 1 μM OXA or OXB. The difference was statistically significant. Levels of PI3K, p-Akt, and p-p38 were lower in cells treated with orexin. Data are presented as the means±SEM of three independent experiments. **p < 0.01, ***p < 0.001 versus control. B) Phalloidin staining showed the characteristic “phagocytic cup” (indicated by arrows) in control cells, whereas this was absent in cells treated with 1 μM OXA or OXB. Scale bar = 20 μm.
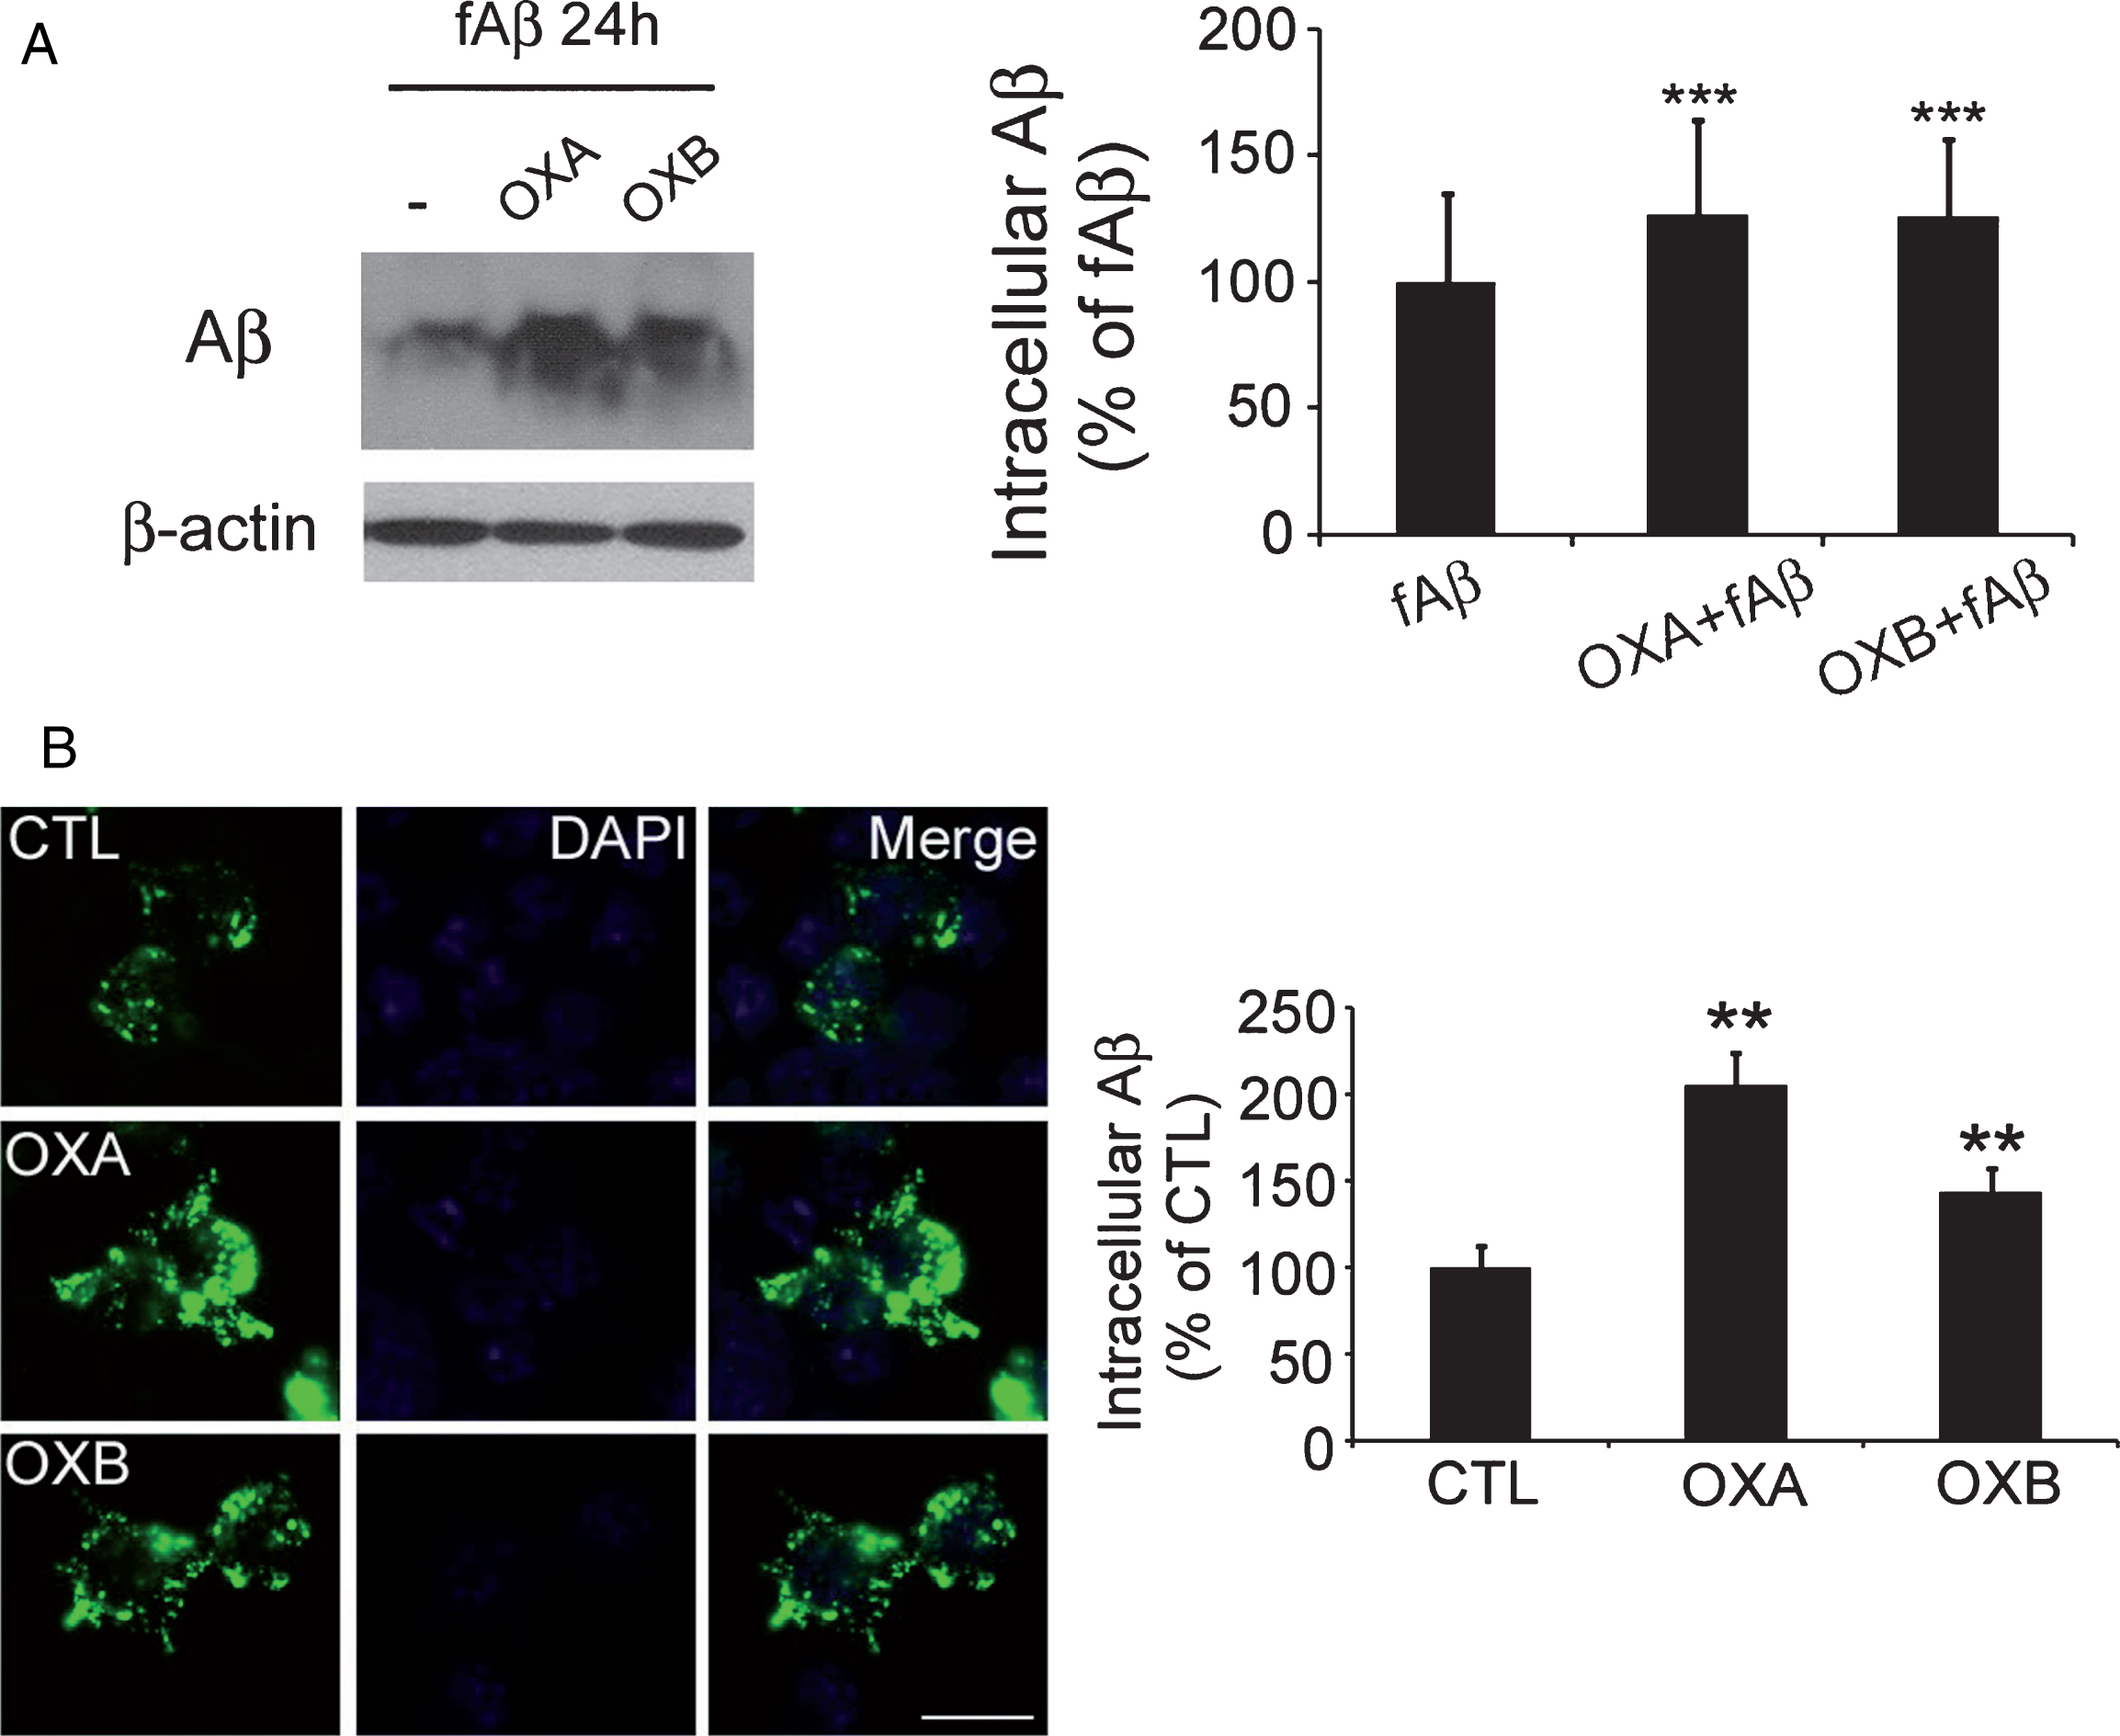
Orexin suppresses the degradation of amyloid-β (Aβ) in BV2 microglia cells. A) Western blot analysis after 24 h showed higher levels of fAβ in cells treated with orexin (1 μM) than in control cells, and the difference was significant. B) Similar treatment with FITC-fAβ showed more intracellular fAβ (fluorescent green) in cells treated with orexin than in control cells. Data are presented as the means±SEM of six independent experiments. **p < 0.01, ***p < 0.005 versus control. Scale bar = 20 μm.
Phagocytic processes are initiated soon after an external insult, and early changes (5 to 10 min) in related molecules such as p-p38 are frequently used to examine levels of phagocytosis [25, 27]. In this study, we observed reduced intracellular levels of p-p38, p-Akt, and PI3K in OXA or OXB and fAβ-cotreated cells compared with fAβ-treated cells, indicating that orexin suppresses uptake of fAβ by microglia (Fig. 1A).
Furthermore, the “phagocytic cup” was observed in fAβ-treated cells (Fig. 1B, indicated by arrows) but not in cells co-treated with orexin and fAβ, suggesting that orexin suppresses phagocytosis, possibly through the disruption of actin organization (Fig. 1B).
Orexin suppresses the degradation of Aβ in BV2 microglial cells
In the fAβ-treated cells, intracellular Aβ levels at 24 h were lower than those at 2 h, as previously reported [20] (data not shown). Surprisingly, Aβ levels at 24 h in cells co-treated with OXA or OXB and fAβ were higher than that of the fAβ-treated cells, indicating that orexin may interfere with the degradation of Aβ in microglia. (Fig. 2A).
To visually examine these results, a separate set of cells was treated using FITC-labeled fAβ instead of fAβ, as previously reported [20], and incubated for 24 h. FITC-Aβ signals decreased in a time-dependent manner and were stronger in OXA or OXB and FITC- fAβ-co-treated cells than in FITC-fAβ-treated cells, supporting the results of western blot analysis (Fig. 2B).
Orexin disrupts autophagic flow
Western blot analysis using anti-LC3 and anti-p62 specific antibodies was conducted to investigate the influence of OXA and OXB on autophagy. Increases in both LC3-II and p62 levels may indicate decreased autophagic flow [20]. In our experiment, after 24 h of treatment, levels of both LC3-II and p62 were increased in cells co-treated with orexin and fAβ, and the increases were higher than that observed in cells treated with fAβ only, demonstrating autophagosomal accumulation by orexin in fAβ-treated cells (Fig. 3).
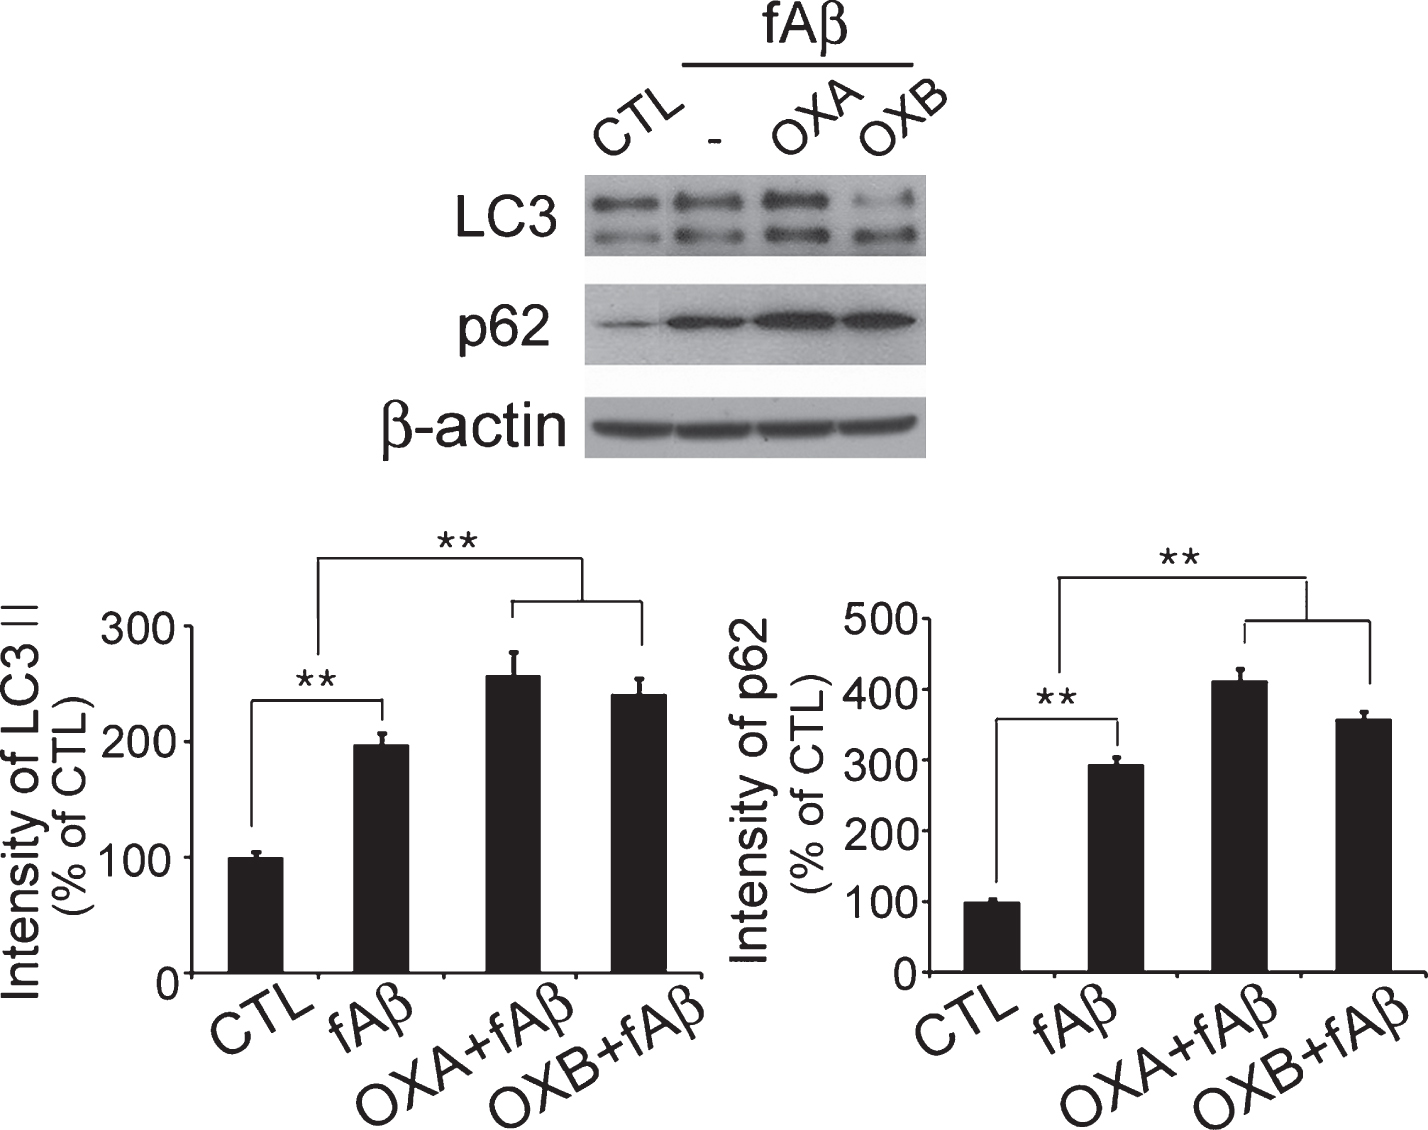
Orexin disrupts autophagic flow. Both LC3-II and p62 levels were increased in orexin treated cells compared to control cells, indicating disrupted autophagic flow. Data are presented as the means±SEM of three independent experiments. **p < 0.01 versus control.
Orexin interferes with the autophagosome-lysosome fusion process
To determine whether the increased LC3-II levels were due to arrested autophagy, further experiments were carried out using Baf.A1. Results showed no significant differences between groups, indicating that the increased LC3-II levels were due to suppression of autophagic flow by orexin (Fig. 4A).
To determine the mechanism responsible for this phenomenon, transfection with mCherry-GFP-LC3 was performed to assess autophagosome-lysosome fusion. In acidic environments, GFP is degraded by lysosomal proteases, thus weakening its signal (green) and hindering detection. On the other hand, the signal of mCherry (red) is more resistant to low-pH environments. Therefore, puncta showing red signals only indicate normal maturation of autophagolysosomes, but puncta showing both red and green signals indicate arrested autophagolysosomal maturation [28]. In our experiment, higher numbers of puncta showing both red and green signals were observed in OXA or OXB andfAβ-co-treated cells than fAβ-treated cells (Fig. 4B). When paired with the results from a separateexperiment using DQ-BSA that showed that neither OXA nor OXB influenced lysosomal acidification (data not shown), these results suggest that orexin impairs normal autophagolysosomal maturation by inhibiting the fusion of autophagosomes and lysosomes, and not by impairing the acidification of lysosomes.
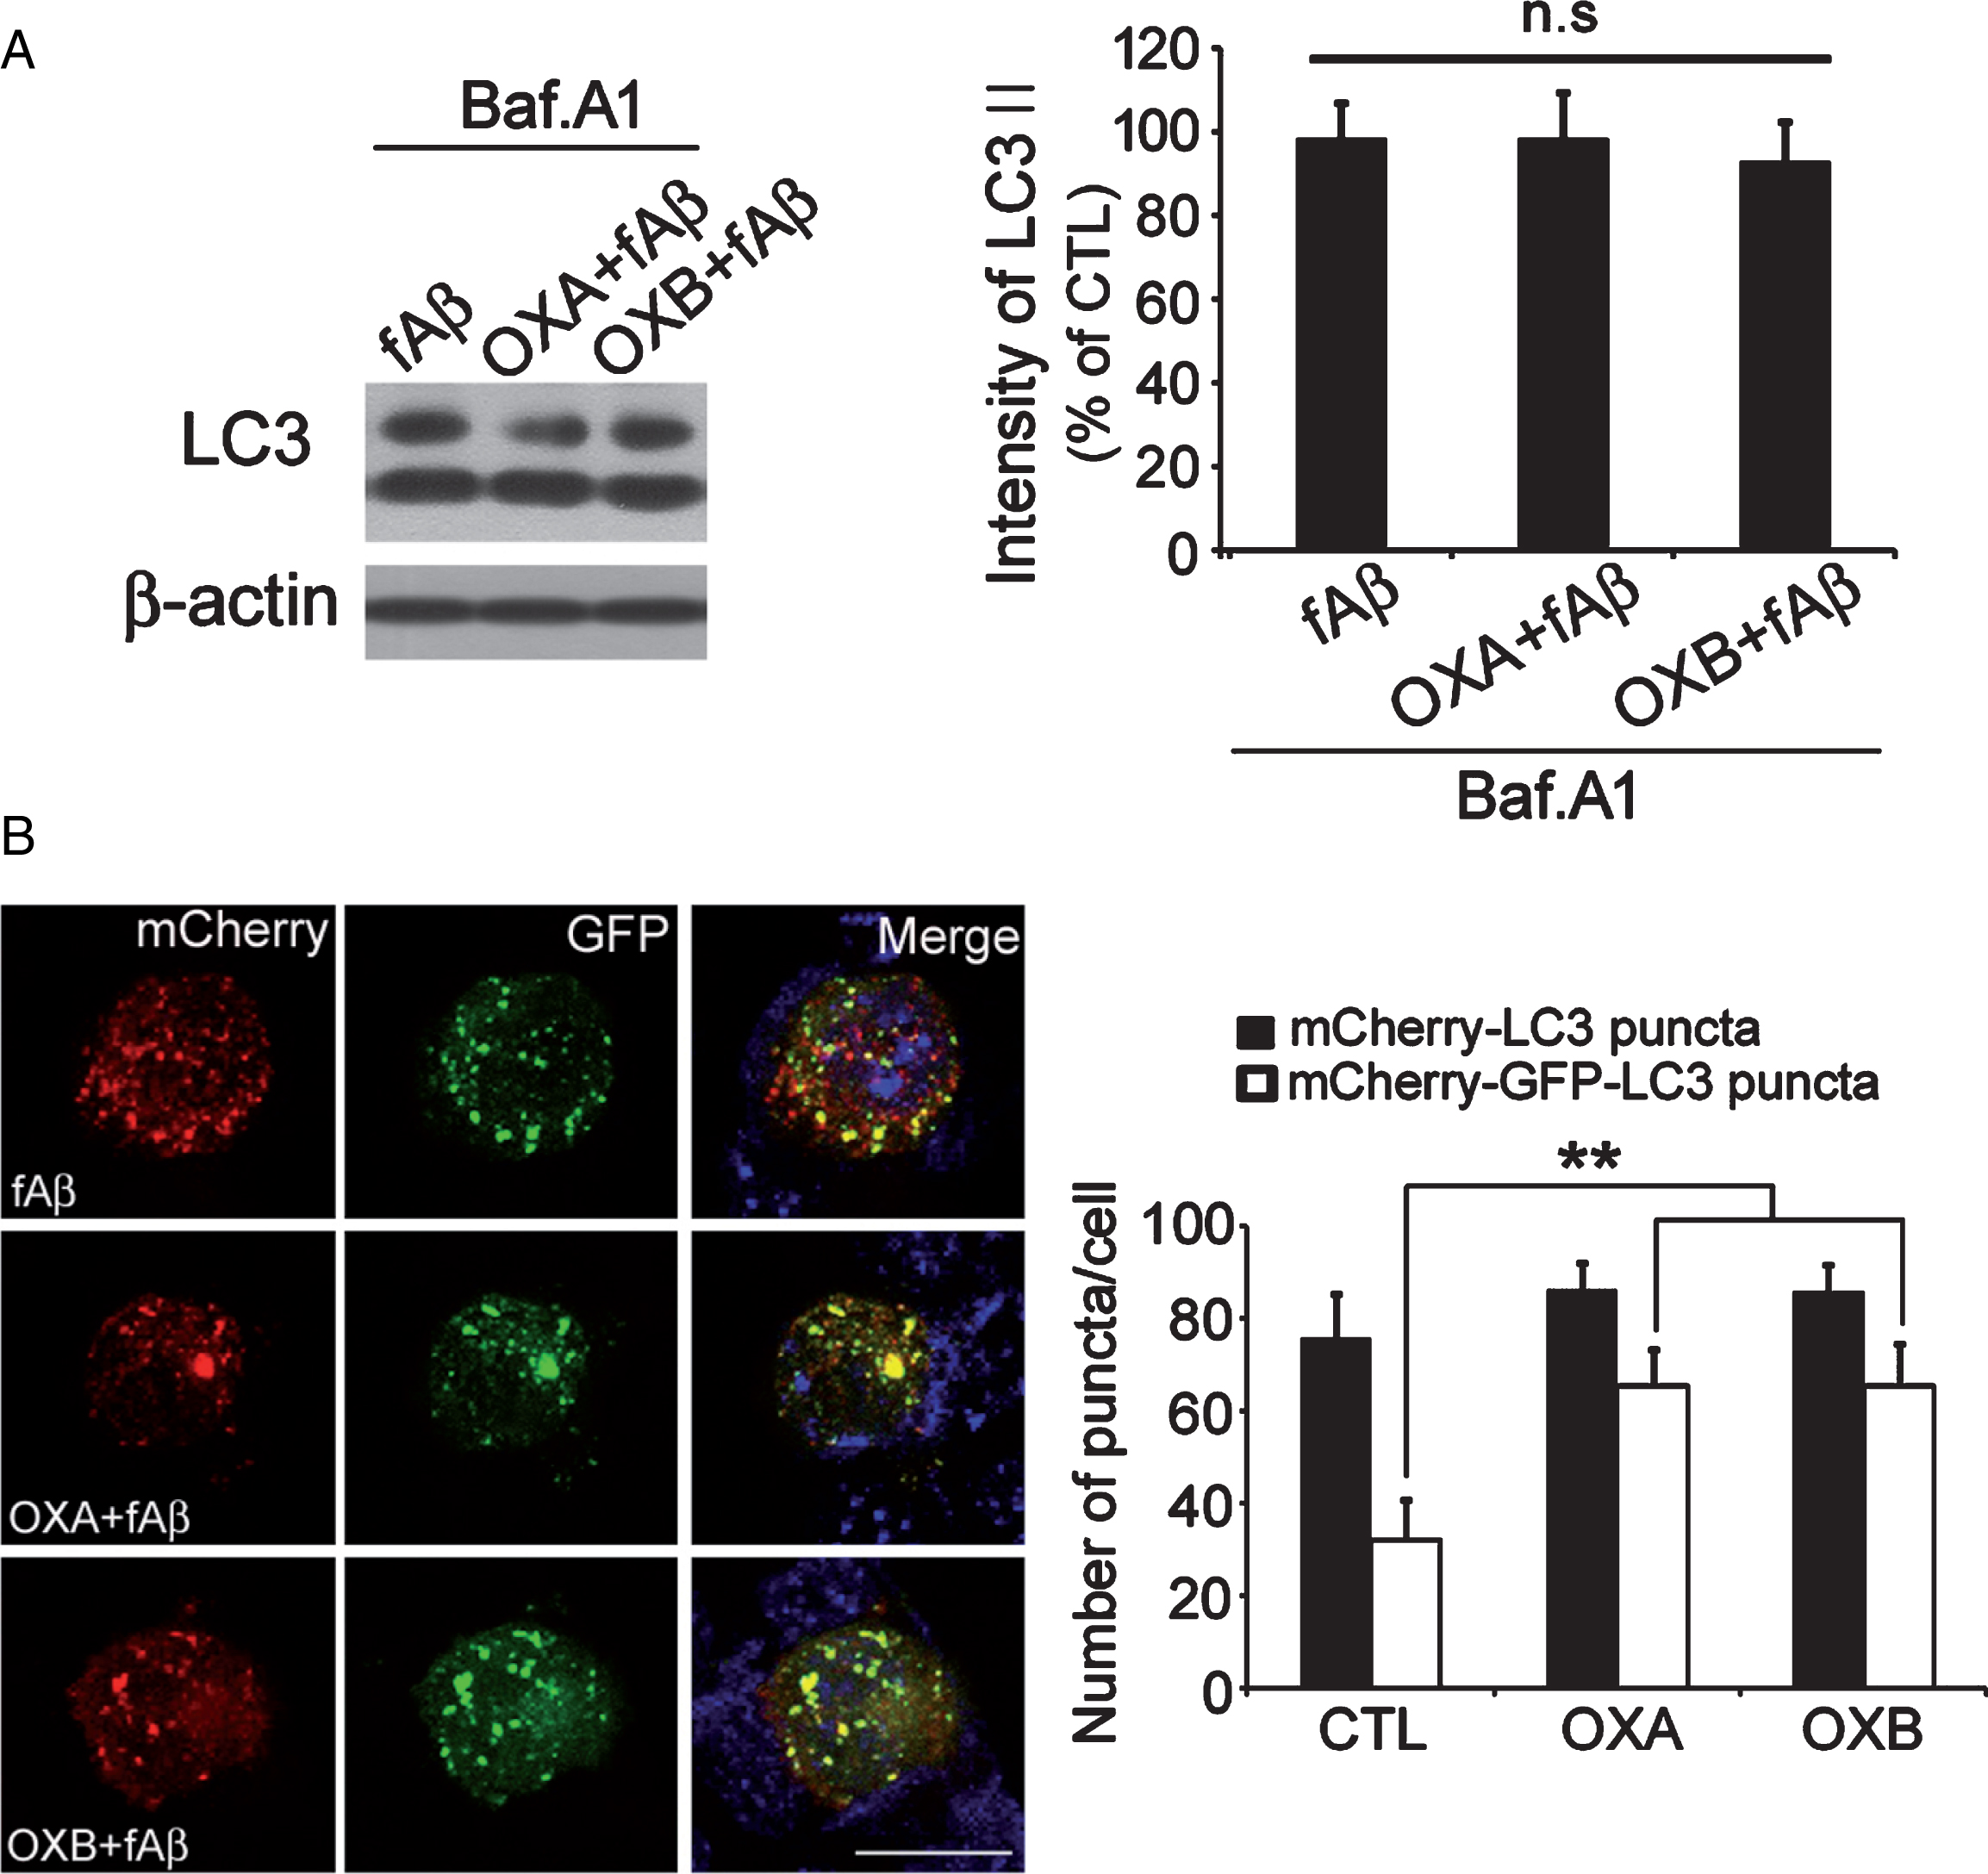
Orexin suppresses autophagy by interfering with the autophagosome-lysosome fusion process. A) After treatment with bafilomycin 1, LC3 levels did not differ between cells treated with and without orexin, indicating that the increase in LC3 observed beforehand was due to suppression of autophagic flux. B) This may be the result of orexin interfering with the autophagosome-lysosome fusion process. Red (mCherry) and yellow (green GFP-LC3 + red mCherry) signals indicate autolysosomes and autophagosomes, respectively. A mixture of both implies normal autophagosome maturation into autophagolysosomes, while an increase in yellow signals only reflects arrested maturation. Both yellow and red signals were visible in control cells, although orexin treated cells showed mainly yellow signals. Data are presented as the means±SEM of three independent experiments. **p < 0.01 versus control. Scale bar = 20 μm.
DISCUSSION
We found that orexin reduces the clearance of fAβ by suppressing its uptake and degradation by microglia. Orexin suppressed phagocytosis by interrupting actin organization, and it disrupted autophagic flow by interfering with the autophagosome-lysosome fusion process.
Our results indicate that orexin may indeed play a major role in the pathogenesis of AD. Furthermore,as long-term treatment with orexin may mimic conditions of prolonged wakefulness [5], our results suggest that sleep deprivation may increase the accumulation of amyloid plaques and result in the development of AD by suppressing microglialdisposal of Aβ. This may be a novel mechanism linking sleep and AD, and further validation by in vivo studies is needed.
Orexin inhibited the PI3K, Akt, and p38-MAPK signaling pathways (Fig. 1A) and decreased fAβ phagocytosis concomitantly (Fig. 1A). PI3K affects actin assembly and is necessary for phagocytosis [21, 23]. Akt promotes Fc gamma receptor-mediated phagocytosis in macrophages [22]. p38-MAPK mediates the stimulation of macrophage phagocytosis [24]. It is possible that these pathways are downstream of an initial common pathway, and that this common pathway is inhibited by orexin, thusinfluencing the activity of all subsequent pathways. Spleen tyrosine kinase (Syk) is a candidate for the point of action of orexin, as it is upstream of both p38 MAPK [29] and PI3K [30] in leukocytes, although this has not been confirmed in microglia. Further investigations concerning this matter will beneeded.
The degradation of fAβ by microglia was also impaired (Fig. 2) after treatment with orexin for extended periods to mimic prolonged sleep deprivation [5]. We recently found that an autophagic process in microglia is necessary for the degradation of fAβ [20]. We further found that autophagic flow in microglia is disrupted by orexin (Figs. 3, 4), due to interference with the autophagosome-lysosome fusion process, thereby reducing the degradation of fAβ.
There were no differences between OXA and OXB, suggesting that its influence on microglia may be mediated through the orexin-2 receptor only, or by both.
From a different perspective, orexin affects many bodily functions other than sleep, such as appetite, gut motility, lipid metabolism [13], and microglial motility [31] and thus sleep deprivation may be only one of many mechanisms that link orexin with increased fAβ burden and AD. For example, increased appetite and lipogenesis due to increased orexin levels may influence the pathogenesis of AD through obesity. We think this will be a fascinating area of study for future researchers, and hope our findings may be used in such studies to investigate the various functions of orexin.
Several other sleep-regulating neurotransmitters, such as adenosine, histamine, melatonin, and gamma-aminobutyric acid (GABA), may also influence microglial function regarding AD pathology. Adenosine is a regulator of sleep, and its levels increase during wakefulness and decrease during sleep. Investigators have reported that stimulation of the adenosine A2A receptor in activated microglia may suppress its phagocytic function [32], and that caffeine, a nonspecific adenosine antagonist, may reduce Aβ accumulation in the brain by reducing the inflammatory responses of microglia [33]. Thus, these results support clinical findings regarding the protective role of sleep against AD, and suggest that adenosine may also be a potential mechanism linking the two. Histamine is also a major player in the sleep–wake cycle, and high levels are found during wakefulness. Recent results have shown that it modulates motility [34] and inhibits the phagocytosis [35] of microglia, indicating that it may also be a link between sleep and AD. However, an antihistamine agent recently failed to demonstrate clinical efficacy in a trial of AD subjects, showing that its influence may be limited [36]. Melatonin is a hormone that increases during darkness and decreases with exposure to light, and it is also widely used as a sleep aid [37]. It can reduce Aβ generation and inflammatory responses of microglia and is considered to be protective against AD pathology [38]. GABA is an inhibitory neurotransmitter, and as the activation of the GABA receptor induces sleep, it is the target of several sleep-inducing drugs [39]. Its activation also attenuates the responses of microglia to inflammatory stimuli [40], suggesting that it has a protective role against AD. However, the increased release of GABA from reactive astrocytes has also been linked to memory impairment [41], indicating that it may have multiple roles.
Sleep may influence the levels of Aβ in the brain by increasing production and reducing clearance [7, 10]. Our current results add another possible mechanism, by showing that the removal of extracellular Aβ by microglia may also be affected by sleep. Further studies investigating how the development of AD may be prevented by modifying sleep are needed to apply this knowledge to clinicalsituations.
In conclusion, we report that treatment with orexin suppressed phagocytosis and the degradation of Aβ. Further investigation of the degradation process indicated that orexin suppressed autophagy, probably by interfering with the autophagosome-lysosome fusion process. More in vivo studies investigating the influence of sleep on microglial processing of Aβ are needed.
Footnotes
ACKNOWLEDGMENTS
This work was supported by the Basic Science Research Program through the National Research Foundation of Korea(NRF) funded by the Ministry of Science, ICT and future Planning(2015R1A2A1A10053683), (2015R1C1A1A01052495), and the Asan Institute for Life Sciences, Seoul, Korea (2015-488).