
Abstract
Late-life depression, even when of subsyndromal severity, has shown strong associations with mild cognitive impairment (MCI) and Alzheimer’s disease (AD). Preclinical studies have suggested that serotonin selective reuptake inhibitors (SSRIs) can attenuate amyloidogenesis. Therefore, we aimed to investigate the effect of SSRI medication on amyloidosis and grey matter volume in subsyndromal depressed subjects with MCI and AD during an interval of two years. 256 cognitively affected subjects (225 MCI/ 31 AD) undergoing [18F]-AV45-PET and MRI at baseline and 2-year follow-up were selected from the ADNI database. Subjects with a positive depression item (DEP(+); n = 73) in the Neuropsychiatric Inventory Questionnaire were subdivided to those receiving SSRI medication (SSRI(+); n = 24) and those without SSRI treatment (SSRI(−); n = 49). Longitudinal cognition (Δ-ADAS), amyloid deposition rate (standardized uptake value, using white matter as reference region (SUVRWM), and changes in grey matter volume were compared using common covariates. Analyses were performed separately in all subjects and in the subgroup of amyloid-positive subjects. Cognitive performance in DEP(+)/SSRI(+) subjects (Δ-ADAS: –5.0%) showed less deterioration with 2-year follow-up when compared to DEP(+)/SSRI(−) subjects (Δ-ADAS: +18.6%, p < 0.05), independent of amyloid SUVRWM at baseline. With SSRI treatment, the progression of grey matter atrophy was reduced (−0.9% versus –2.7%, p < 0.05), notably in fronto-temporal cortex. A slight trend towards lower amyloid deposition rate was observed in DEP(+)/SSRI(+) subjects versus DEP(+)/SSRI(−). Despite the lack of effect to amyloid PET, SSRI medication distinctly rescued the declining cognitive performance in cognitively affected patients with depressive symptoms, and likewise attenuated grey matter atrophy.
INTRODUCTION
Multiple studies have revealed that late-life depression is associated with increased risk for mild cognitive impairment (MCI) [1, 2] and Alzheimer’s disease (AD) [2, 3]. Furthermore, there is evidence that co-morbid subsyndromal depression has significant detrimental effects on disability in MCI patients assessed with the Functional Assessment Questionnaire [4], which emphasizes the need for addressing depression in geriatric health care programs, even when occurring at subsyndromal severity.
With the development of [18F]-fluorinated positron emission tomography (PET) ligands for amyloid-β (Aβ-PET), there has emerged a greater understanding of the progression of AD pathology [5, 6]. Individuals can be subdivided into Aβ positive (Aβ+) or negative (Aβ–) groups even at an early disease stage before the onset of frank clinical symptoms of dementia [7]. This innovation led to multiple investigations aiming to enlighten the link between depressive symptoms and AD pathology by measuring non-invasively the amyloid burden in brain of patients with cognitive symptoms. Wu and colleagues found that a lifetime history of major depression is associated with increased amyloid burden in the brain of healthy individuals (HC) [8], and that patients with comorbidity of major depression and MCI have greater amyloid burden when compared to age-matched major depression patients [9].
We earlier found that Aβ(+) subjects with MCI and concurrent subsyndromal depression showed a higher fronto-temporal amyloid load and a faster conversion to AD than did non-depressed MCI individuals [10]. The converse relationship may also hold; others observed a 4.5-fold increased risk in healthy controls for developing depressive symptoms during a 4-year observation period when amyloid pathology was present in the brain at baseline [11]. However, there are also findings not supporting an association between cortical amyloid burden, cognitive dysfunction, and depressive symptoms in MCI and AD patients [12].
The generally accepted link between depression, amyloid pathology, and progression of dementia raises the important question of whether dementia symptoms could potentially be ameliorated by treatment with antidepressants. A very recent meta-analysis including only the small number of relatively low-powered studies in patients with dementia indicated neither cognitive benefit nor harm from treatment with serotonin selective reuptake inhibitors (SSRIs) [13]; the authors emphasized the need for sufficiently powered studies of this intervention strategy. Given the clinical heterogeneity of geriatric depression [14], well-designed, large-scale amyloid PET imaging studies might be suitable to clarify the association between depression, amyloid pathology, and therapeutic effects of SSRI treatment [15]. Intriguingly, lower amyloid burden was observed by [11C]-PiB PET in healthy controls with a history of SSRI intake when compared to SSRI-naive control subjects [16]. Importantly, that cross-sectional investigation also found a negative correlation between amyloid burden and duration of previous SSRI intake. In support of a causal relationship, a recent preclinical study of prospective design revealed that treatment with the SSRI citalopram arrested further growth of pre-existing plaques and inhibited new plaque formation by 78% in aged transgenic AD mice [17].
Given this background, we aimed to investigate the influence of SSRIs use on longitudinal neuroimaging findings of amyloid load and brain volume in conjunction with cognitive assessment. Therefore, we analyzed longitudinal Aβ-PET data over a 2-year period in MCI or AD individuals with either presence or absence of depressive symptoms, and documentation of SSRI treatment.
MATERIAL AND METHODS
Alzheimer’s disease neuroimaging initiative
Data used in the preparation of this article were obtained from the Alzheimer’s Disease Neuroimaging Initiative (ADNI) database (http://adni.loni.usc.edu). The ADNI was launched in 2003 as a public-private partnership, led by Principal Investigator Michael W. Weiner, MD. The primary goal of ADNI has been to test whether serial magnetic resonance imaging (MRI), positron emission tomography (PET), other biological markers, and clinical and neuropsychological assessment can be combined to measure the progression of MCI and early AD. Data from ADNI-GO/-2 were included in this work as available on March 3, 2015. ADNI-GO contains 700 subjects, of whom 200 showed the mildest symptomatic phase of AD (EMCI). 500 are healthy controls, together with MCI patients from the ADNI1 collective. The ADNI-2 dataset consists of 1350 subjects, consisting of the 700 subjects of the ADNI-GO dataset with addition of 150 new normal controls, 150 new early MCI cases, and 200 late MCI and mild AD patients.
Patient selection and study design
On the database cut-off date, 409 subjects in total with either healthy cognition (HC), MCI, or AD diagnosis had received [18F]-AV45 PET and T1w MRI at baseline and 2-year follow-up (24±2.5 months) within ADNI-GO/ADNI-2. The discrimination between HC, MCI, and AD was made following the Mini-Mental State Examination (MMSE; score 0–30) as well as the Clinical Dementia Rating (CDR; score 0–3) and clinical criteria. MMSE from 24 to 30 and CDR of 0 are defined as HC, MMSE from 24 to 30 and CDR of 0.5 plus objective memory loss and preserved activities of the daily living were designated as MCI. Patients with diagnosis of AD show MMSE of 20–26, CDR of 0.5 to 1.0, and otherwise meet the NINCDS/ADRDA criteria for probable AD.
Apolipoprotein E4 (ApoE4) status was compiled together with gender and education level (years), while age, NPI-Q score, Assessment Scale (ADAS; score 0–70), and Mini Mental State Examination (MMSE; score 0–30) were recorded at the time of the PET scans.
All subjects were stratified in the following groups:
A) Dementia symptoms: According to the diagnosis at baseline, all subjects were divided into cognitively affected (MCI or AD) and unaffected subjects (HC). The group of MCI and AD was further divided according to the two following subgroups on the basis of depression symptoms.
B) Depressive symptoms: Subsyndromal depression was diagnosed in accordance with item #4 (depressive symptoms) of the NPI-Q [18] at the time of the baseline PET scan. A positive score on item #4 indicated depressive symptoms (DEP(+)), and negative indicated absence of depressive symptoms (DEP(−)).
C) SSRI medication: Longitudinal 2-year SSRI treatment was assessed from the medication file in the ADNI documentation, while individual dosage was not considered. All subjects receiving SSRI treatment at baseline and follow-up without discontinuation of the drug were considered as treated (SSRI(+)), whereas all other subjects were categorized as non-treated (SSRI(−)).
According to the categories named above, the following three subcategories were examined (in brackets there are the numbers of MCI-/AD-cases):
DEP(+)/SSRI(+) n = 24 (MCI: n = 22 (91.7%); AD: n = 2 (8.3%)) DEP(+)/SSRI(−) n = 49 (MCI: n = 42 (85.7%); AD: n = 7 (14.3%)) DEP(−) n = 183 (MCI: n = 161 (88.0%); AD: n = 22 (12.0%))
D) Brain amyloid burden: All PET analyses were performed separately in all subjects and likewise in the subgroup of Aβ(+) subjects, aiming to score the presence of significant AD-typical amyloid burden in relation to newly proposed diagnosis criteria [19]. Aβ(+) and Aβ(−) [18F]-AV45-PET status was defined in accordance with our calculated threshold of 0.77 for the standardized uptake value ratio (SUVR). For the SUVR calculation, individual gray matter VOIs of frontal, parietal, temporal and precuneal/posterior cingulate gyrus were summed to form a composite (COMP) VOI. The SUVR then was calculated by dividing the mean COMP SUV by the mean reference SUV of the white matter, as this reference region is previously shown to provide the highest discrimination between HC and AD for this tracer [20]. Figure 1 illustrates the study design.
Stratification of 409 subjects with [18F]-AV45-PET and T1w MRI at baseline- and 2-year-follow-up-PET scan. The numbers of Aβ(+) subjects for each group are indicated in brackets. All subjects were first categorized according to their diagnosis as MCI, AD and HC subjects. Subsequently, the NPI-Q was used to subdivide the MCI and AD group into subsyndromal depressed (DEP(+)) and non-depressed (DEP(−)) subgroups. The 73 MCI/AD subjects with depressive symptoms were further subdivided according to their SSRI treatment. Subjects included in the analysis are highlighted in red.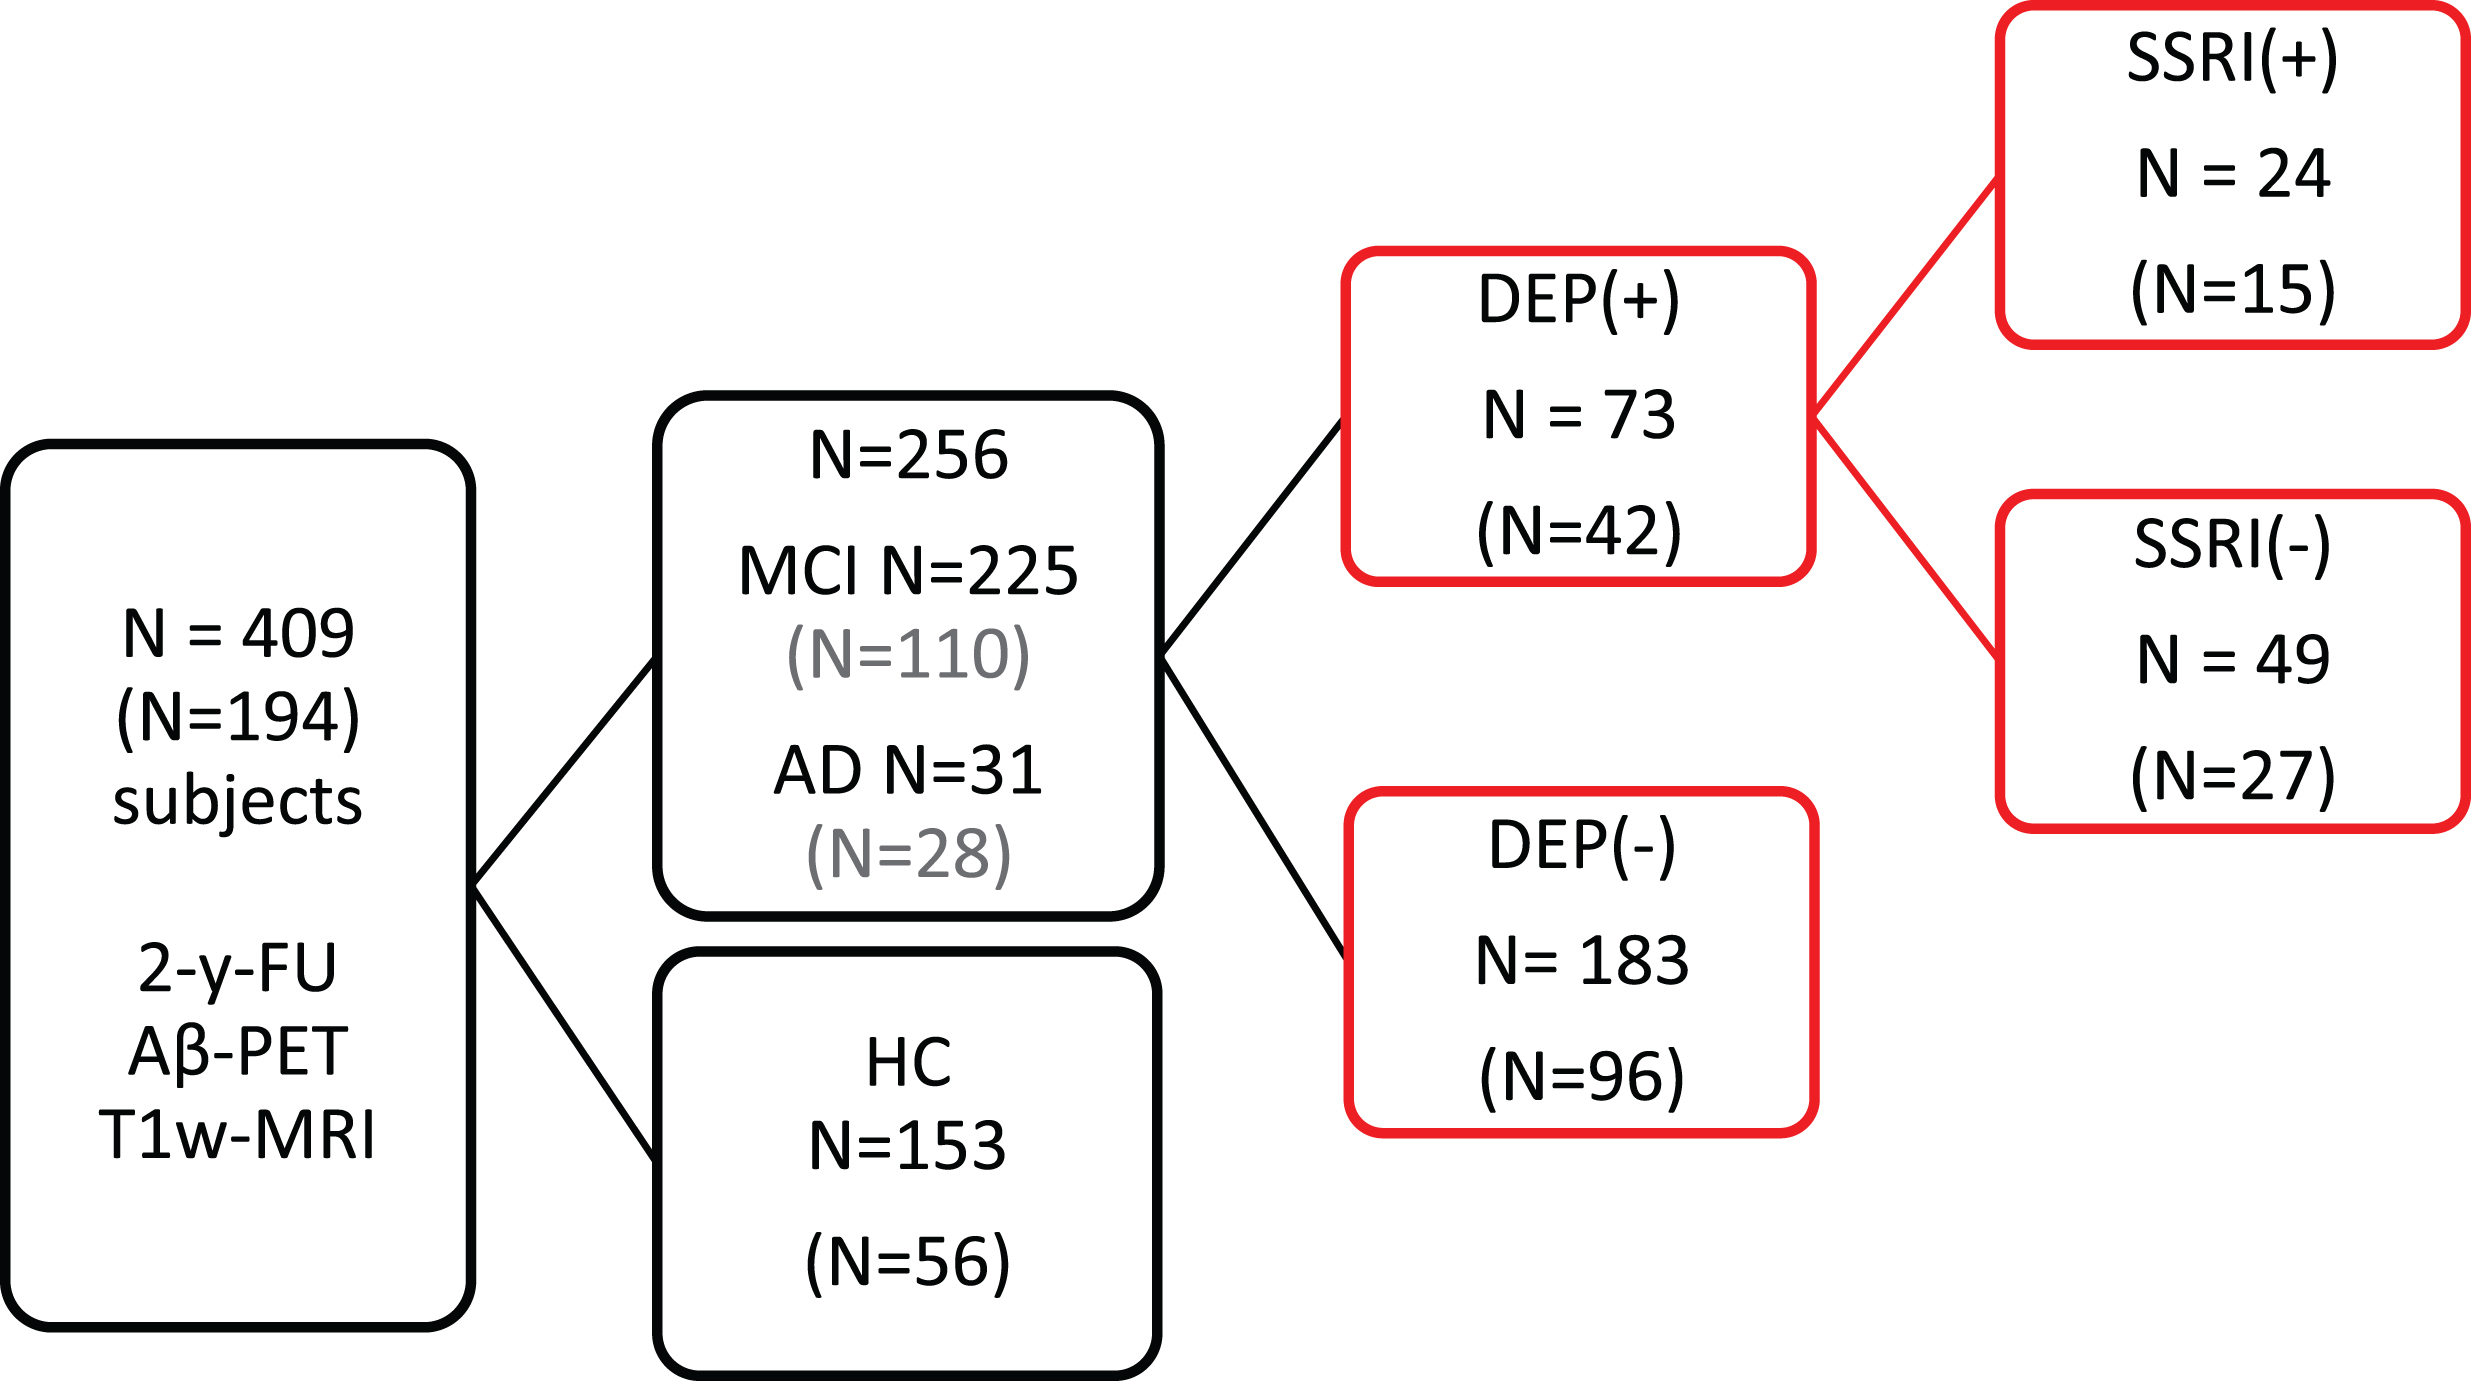
Image data
ADNI [18F]-AV45-PET acquisition and pre-processing
The [18F]-AV45-PET images had been acquired using Siemens, GE, and Philips PET scanners according to a standard dynamic 50–70 min protocol following the intravenous injection of 370±37 MBq of [18F]-AV45. Data were corrected for both scatter and measured attenuation, which was determined using the CT scan for PET/CT scanners, or a transmission scan with [68Ge] or [137Cs] rotating rod sources for PET-only scanners. Images were reconstructed using scanner-specific algorithms, and sent to the University of Michigan, where they were reviewed for artifacts and transmitted to the Laboratory of NeuroImaging (LONI) for storage.
Downloaded [18F]-AV45-PET images in DICOM format had been preprocessed in four steps: 1) motion correction by co-registration of single 5-emin frames, 2) time frame averaging (50–70 min p.i.), 3) co-registration of longitudinal data to the baseline scan and reorientation in a standardized 160×160×96 matrix with 1.5 mm cubic voxels, and 4) smoothing with a scanner-specific filter function to an isotropic resolution of 8 mm, which is the ADNI standard designed to generate comparable images from different tomographs; this resolution represents the lowest resolution among scanners used in ADNI.
ADNI MRI acquisition and pre-processing
T1-weighted MRI scans had been acquired using Siemens, GE, or Philips MRI scanners according to a standard protocol [21] involving acquisitions of two 3D MPRAGE imaging sequences per subject. Of the two images acquired per subject and time-point, the ADNI quality assurance team selected the better image for preprocessing, based on the presence and severity of commonly-occurring image artifacts. MRI preprocessing involved: 1) application of a scanner-specific correction for gradient nonlinearity distortion (Gradwarp) [22]; 2) correction for image intensity non-uniformity (B1) [21]; 3) histogram peak sharpening algorithm for bias field correction (N3) [23]; 4) application of spatial scaling factors obtained by phantom measurements. For images acquired on Philips scanners, B1 correction was already implemented, and the gradient systems with this instrument tended to be linear [21]. More details on MRI image processing can be obtained from a previous investigation deriving from the ADNI cohort [24].
Image processing and analysis
The automated processing of the ADNI MRI and PET data, including quality control procedures, was performed in PNEURO (V 3.5, PMOD technologies, Basel, Switzerland) as previously described in detail [20]. In brief, T1-weighted MRI data were transferred into the Montreal Neurological Institute (MNI) standard space and subsequently segmented into gray matter, white matter, and cerebrospinal fluid (CSF). Segmented gray matter of each subject was further subdivided into 83 individual VOIs according to the brain atlas of Hammers [25]. Individual bilateral grey-matter VOIs of frontal (FRO), parietal (PAR), and temporal (TEMP) cortices, as well as the precuneal/posterior cingulate gyrus (PCC), and a composite (COMP) VOI, were used for the calculation of white matter-scaled individual standard-uptake-value-ratios (SUVR) for each of the VOIs, which represent weighted sums of single VOIs. Results were obtained in PET native space after VOI-based partial volume effect correction (PVEC) using the method of Rousset [26] (Supplementary Figure 1), given that atrophy is especially apt to influence PET results in (cognitively-impaired) subjects with depressive symptoms [27]. Volumes (cm³) of all grey matter VOIs were determined in MNI space. Subjects with failed PET processing were excluded prior to inclusion is this study (based on the experience with the dataset), and strong artifacts were masked [20, 28].
Data analysis and statistics
PET SUVR values and grey matter volumes deriving from the VOIs (FRO, PAR, TEMP, PCC, and COMP), as well as cognition score (ADAS) were compared between the three different subject groups at baseline (BL) and calculated as absolute/percent change at the 2-year follow-up scan (absolute delta (Δ) / relative delta Δ%). Multivariate analysis of covariance (MANCOVA) with PET SUVR, grey matter volumes and cognition scores (ADAS) as dependent variables was performed with SPSS, version 23.0 (IBM, Chicago, IL). For BL analyses, subject age, ApoE-ɛ4 status, gender, and education level were used as covariates. For longitudinal analysis, BL amyloid burden (PET SUVR), and BL ADAS scores were included as additional covariates to minimize dispersion due to variable pathology burden at BL. Direct comparisons of main effects between the three groups after MANCOVA were performed using a Bonferroni correction per comparison. P values <0.05 were deemed significant after Bonferroni correction. The relationship between each subject’s global amyloid burden (COMP) at BL and longitudinal changes in PET SUVR, grey matter volume, and ADAS scores was investigated by applying linear, logarithmic, and quadratic regression analyses as implemented in SPSS. In cases giving several statistically significant fits (p < 0.05), the best fitting model was identified by applying the Akaike information criterion (AIC) [29]. P values <0.1 were defined as a trend.
Necessary sample sizes for potential clinical trials of SSRI treatment versus placebo in cognitively affected patients were computed for DEP(+) patients. Longitudinal changes in ADAS and global grey matter volume were used as outcome parameter. Calculation was based on a t-test statistic with assumptions for a type I error α= 0.05 and a power of 0.8. We note that this sample size calculation assumed a uniform mean effect on all subjects of a potential trial.
RESULTS
Demographics, cognition, and imaging values at baseline
There were no significant differences in age, gender, education, or ApoE ɛ4 status between the patient groups with and without depressive symptoms. Cognition as measured by ADAS was nearly equal between subgroups. The only significant group difference indicated less years of education in patients with SSRI-treatment compared to those with subsyndromal depression but without treatment (Table 1). 24/73 (33%) of the subjects were treated with an SSRI.
Demographics at Baseline, Aβ(+) subjects displayed separately
Significant differences between DEP(+)/SSRI(+) and DEP(+)/SSRI(−) are indicated by *p < 0.05. No significant differences were observed between DEP(+) total and DEP(−). MANCOVA with testing of main effects and Bonferroni adjustment was used for intergroup comparison.
Regarding amyloid burden and grey matter volumes at BL, there were no significant differences between patient groups. All BL imaging values are provided in Supplementary Tables 1–2.
Longitudinal analysis of cognition
Comparing the DEP(+) and DEP(−) groups, we saw no significant differences in longitudinal changes in cognition (ADAS absolute-Δ: +1.0 / relative-Δ-% : +6.5% versus ADAS absolute-Δ: +1.3 / relative-Δ-% : +8.5%). Considering only those DEP(+) subjects receiving an SSRI treatment, we saw improvement in cognition, as indicated by a decrease in ADAS (absolute-Δ: –0.8 / relative-Δ-% : –5.0%), whereas the non-treated DEP(+) group deteriorated in cognition over the span of two years (absolute-Δ: +2.9 / relative-Δ-% : +18.6% (p = 0.013; MANCOVA, Bonferroni adjusted; Fig. 2). In the subgroup analysis of only Aβ(+) subjects, the same trend of longitudinal changes in ADAS was observed, although the difference between Aβ(+)/DEP(+) patients with SSRI treatment (absolute-Δ: +2.7 / relative-Δ-% : +15.6%) and those without (absolute-Δ: +5.1 / relative-Δ-% : +29.5%) was not significant (p = 0.102; MANCOVA, Bonferroni adjusted). Cognition followed longitudinally by MMSE gave similar results in this contrast; all cognition results are presented in Table 2.
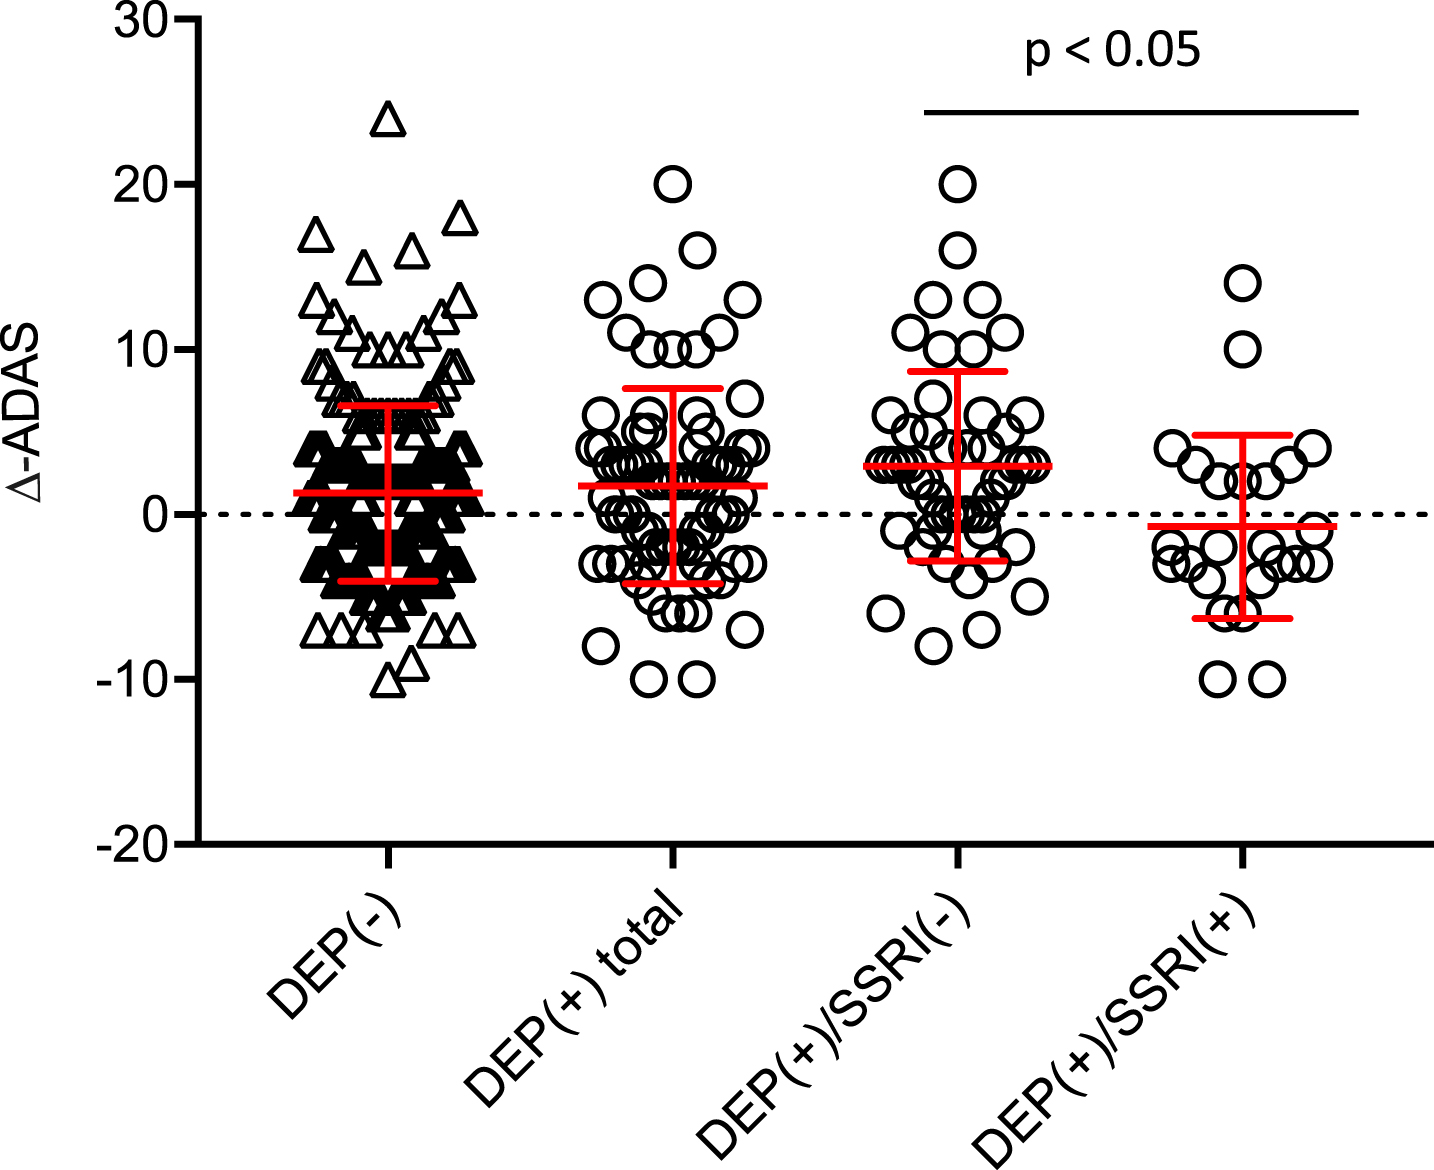
Longitudinal course of ADAS for the two main groups of DEP(+) total and DEP(−) as well as for DEP(+)/SSRI(+) and DEP(+)/SSRI(−) subgroups. MANCOVA with testing of main effects and Bonferroni adjustment was used for intergroupcomparison.
Baseline scores, follow-up scores and longitudinal changes (Δ%) of cognitive testing (ADAS, MMSE) are provided. All follow-up values and longitudinal changes are adjusted for the baseline ADAS
Significant differences between DEP(+)/SSRI(−) and DEP(−)/SSRI(−) are indicated by *p < 0.05, **p < 0.005. MANCOVA with testing of main effects and Bonferroni adjustment was used for statistical intergroup comparison. No significant differences were observed between DEP(+) total and DEP(−).
Changing diagnoses were evaluated at follow-up when compared to BL: Of 225 MCI patients at BL, 29 (12.9%) converted to AD at the follow-up (n = 17 DEP(−); n = 3 DEP(+)/SSRI(+); n = 9 DEP(+)/SSRI(−)). 10 MCI patients (4.4%) were finally reverting to HC (n = 6 DEP(−); n = 3 DEP(+)/SSRI(+); n = 1 DEP(+)/SSRI(−)). From 31 AD-cases at BL, one (3.2%) was classified as MCI at the follow-up scan (DEP(+)/SSRI(+)), whereas 30 (96.8%) remained AD.
Longitudinal analysis of amyloid burden and grey matter volume
In the next step, we investigated changes in amyloid burden and grey matter volume during the 2-year interval in relation to depressive symptom and SSRI-treatment status.
Longitudinal Aβ deposition rates
Comparing the entire groups of depressed and non-depressed individuals, we saw only a small difference in the mean longitudinal increase of Aβ burden (Δ% -COMP-SUVR: +5.0% versus +5.6% p = 0.568; MANCOVA, Bonferroni adjusted). In the analysis of subsyndromal depressed patients with and without SSRI treatment, there was only a slight trend towards lower amyloid deposition rates in SSRI(+) patients, most notably in the frontal cortex (Δ% -FRO-SUVR: +5.0% versus +6.1%; p = 0.635; MANCOVA, Bonferroni adjusted; Supplementary Table 3A); results were similar in the subanalysis of Aβ(+) subjects. Here the frontal lobe likewise showed the highest difference of amyloid deposition rate (Δ% -FRO-SUVR) as a function of SSRI treatment (DEP(+)/SSRI(+) versus DEP(+)/SSRI(−): +3.8% versus +7.0%; p = 0.261; MANCOVA, Bonferroni adjusted; Supplementary Table 3B). For the exact values, we refer the reader to the Supplementary Table 3A and B.
Longitudinal grey matter volume measurements
Subsyndromal depressed subjects and the non-depressed group revealed similar decreases of total grey matter volume to 2-year follow-up (Δ% -VOL: 1.8% versus 1.7%; p = n.s.; MANCOVA, Bonferroni adjusted); subregion analysis gave similar results. Subgroup analysis showed a loss of only 0.9% of total grey matter volume in SSRI(+) patients, whereas SSRI(−) subsyndromal depressed lost 2.7% (p = 0.031; MANCOVA, Bonferroni adjusted). To subregion analysis, the greatest volume loss was in frontal and temporal cortices (Δ% -VOL FRO: –0.8% versus 2.7%; p = 0.042; MANCOVA, Bonferroni adjusted / Δ% -VOL TEMP p = 0.016; MANCOVA, Bonferroni adjusted) (Table 3A).
2-year follow-up of grey matter volumes; significant differences between DEP(+)/SSRI(+) and DEP(+)/SSRI(−) are indicated by *p < 0.05 / **p < 0.001
No significant differences were observed between DEP(+) total and DEP(−). MANCOVA with testing of main effects and Bonferroni adjustment was used for statistical intergroup comparison.
To find more specific region-related differences we measured volumes in 64 cortical and subcortical segmented VOIs of Hammer’s atlas, of which 14 regions showed significant difference between SSRI(+) and SSRI(−) subsyndromally depressed subjects (Supplementary Table 4).
Subanalysis in Aβ(+) patients indicated similar results, with a higher mean atrophy rate in those patients with subsyndromal depression. In particular, the SSRI-treated DEP(+) group of Aβ(+) patients had significantly less progression of atrophy in the temporal lobe (Δ% -VOL: –1.1% versus –3.9%; p = 0.009; MANCOVA, Bonferroni adjusted), the PCC (Δ% -VOL: –1.2% versus –4.4%; p = 0.030; MANCOVA, Bonferroni adjusted), and also in the total grey matter volume (Δ% -VOL: –1.4% versus –3.8%; p = 0.040; MANCOVA, Bonferroni adjusted) when compared to untreated Aβ(+)/DEP(+) patients (Table 3B). Two individual examples of grey matter atrophy of a pair of Aβ(+) patients with and without SSRI treatment are shown in Fig. 3.
2-year follow-up of grey matter volumes in Aβ(+) subjects; significant differences between DEP(+)/SSRI(+) and DEP(+)/SSRI(−) are indicated by *p < 0.05 / **p < 0.001
No significant differences were observed between DEP(+) total and DEP(−). MANCOVA with testing of main effects and Bonferroni adjustment was used for statistical intergroup comparison.
Relationship between baseline Aβ-PET and longitudinal read-outs
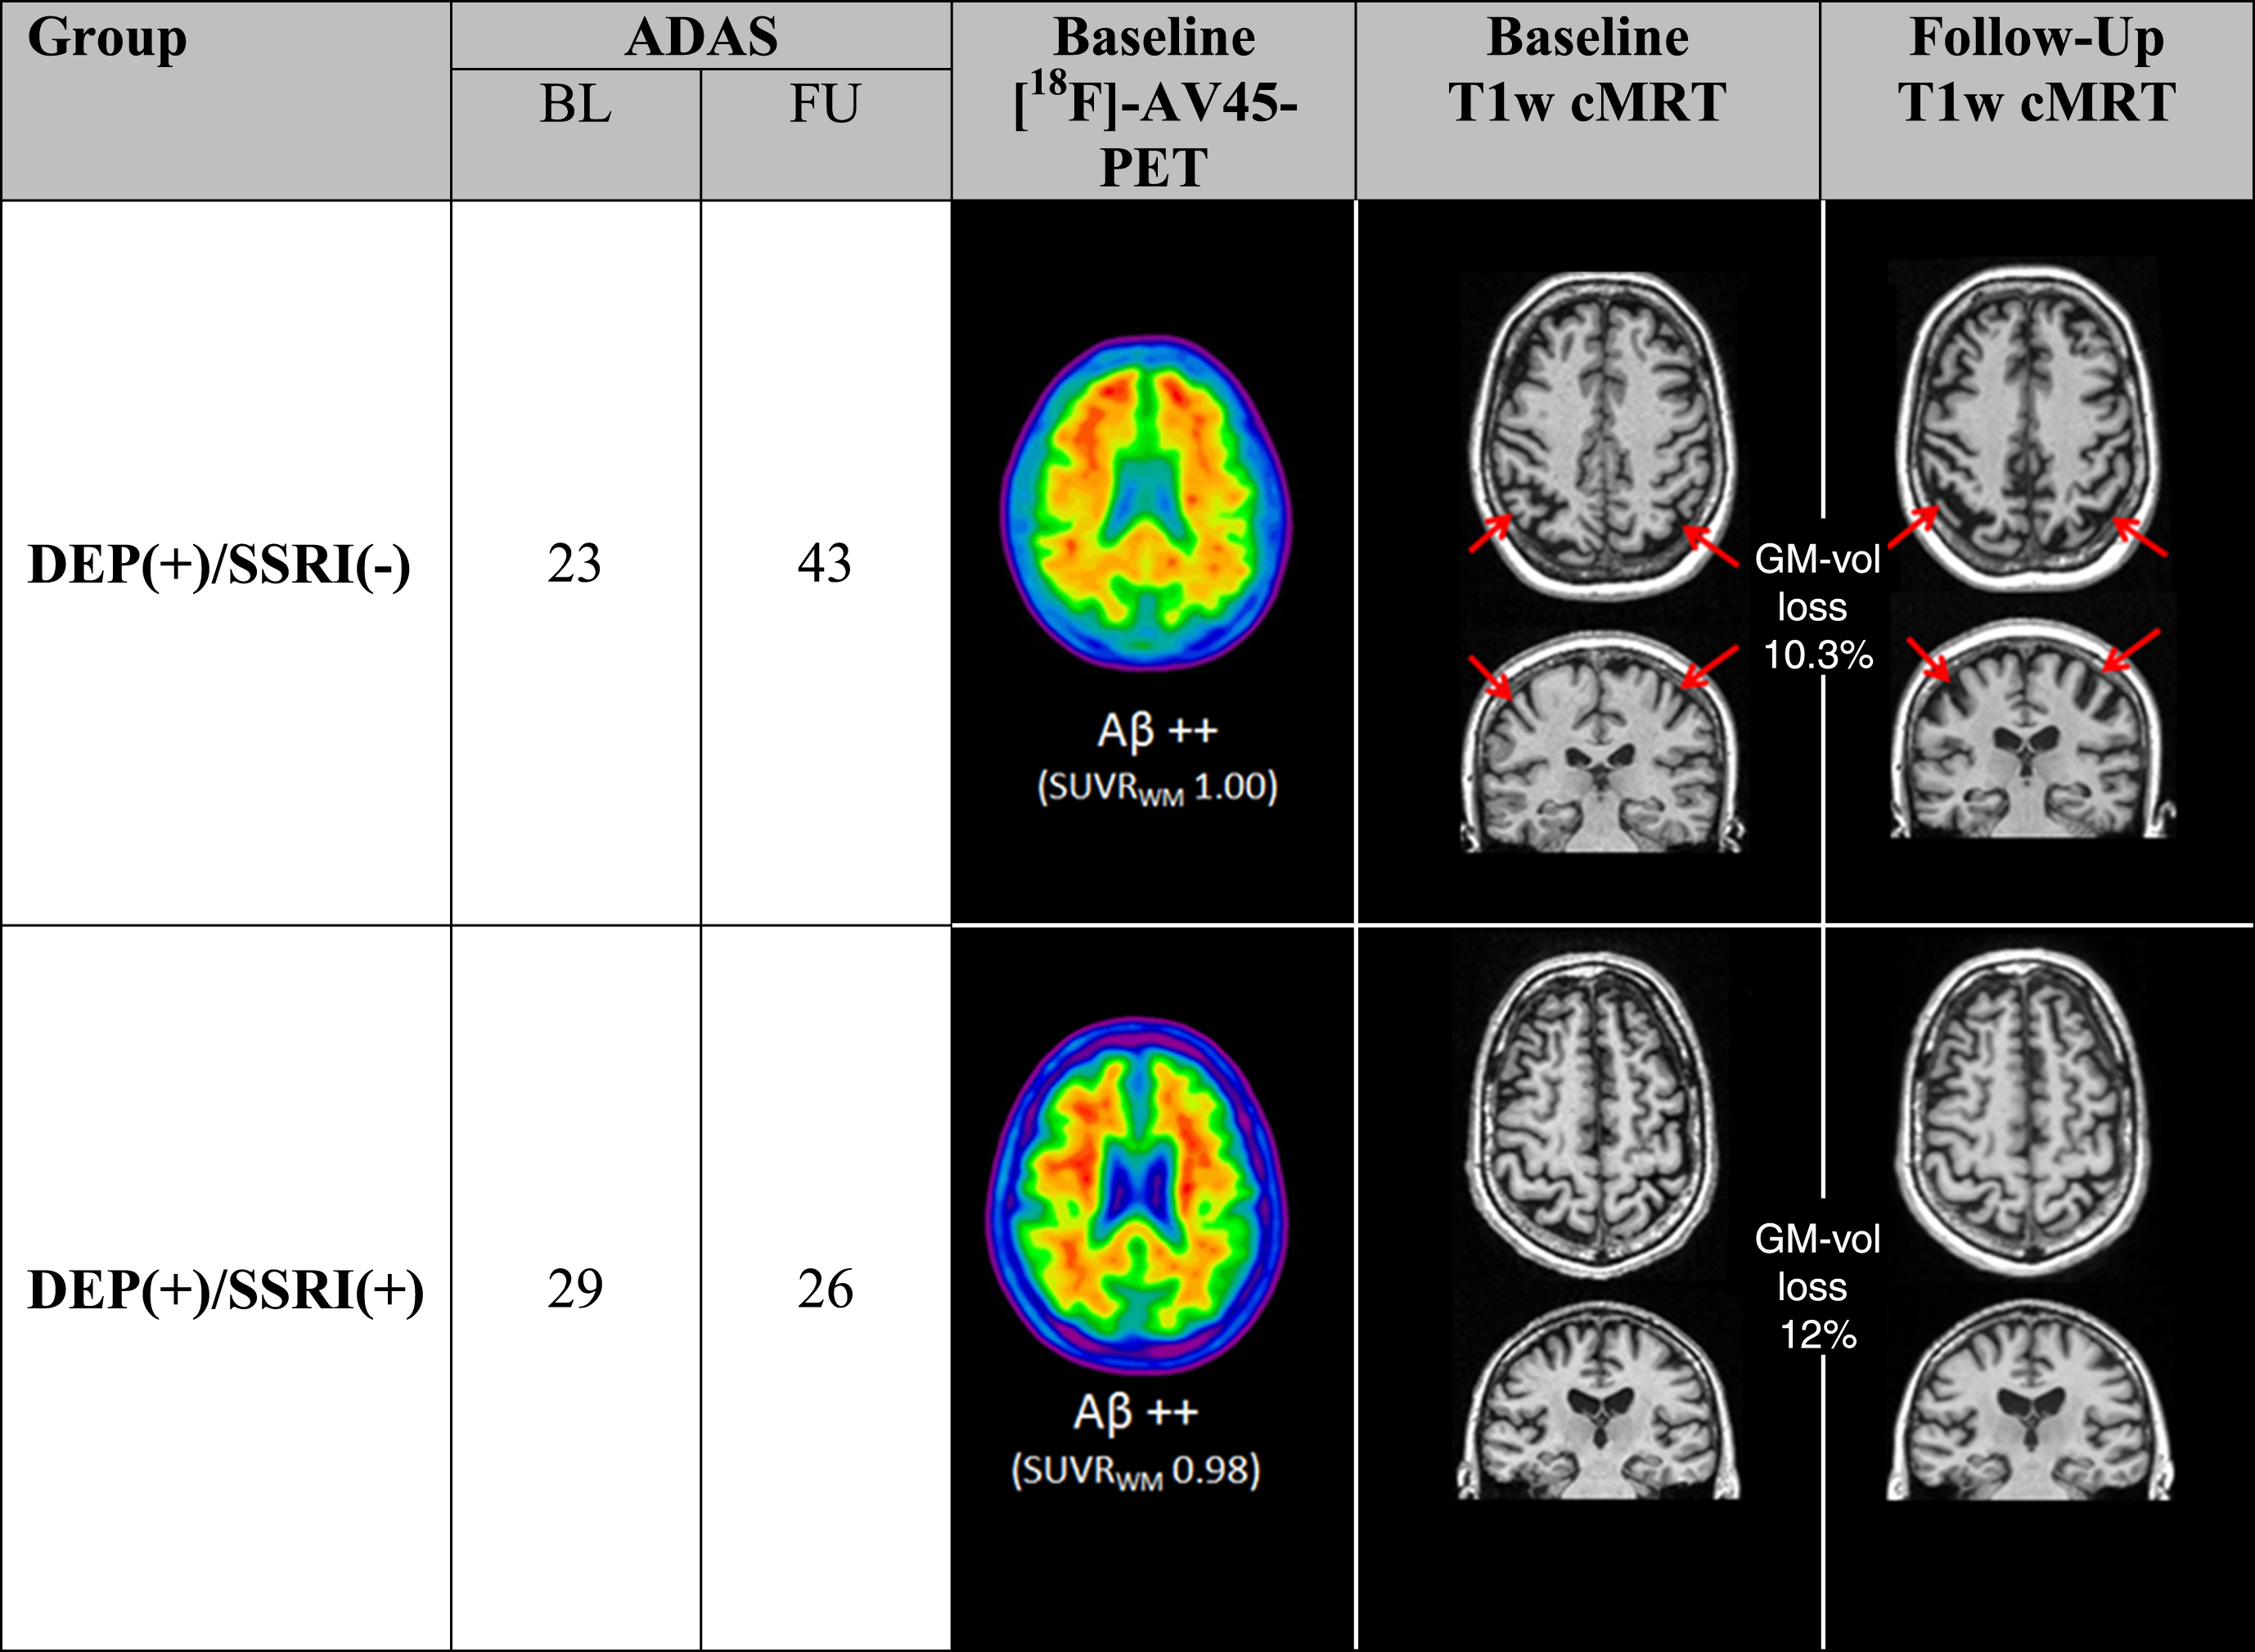
Two DEP(+), Aβ(+) subjects with similar baseline are illustrated, both indicating elevated ADAS at baseline with comparable amyloid load (cutoff of Aβ positivity: 0.77). Progression of grey matter atrophy was pronounced in the SSRI(−) case (red arrows). Two representative examples at the opposite extreme of grey matter atrophy progression depict the range of results.
Establishing a linkage between BL amyloid level and the further progression of cognition decline could help to predict outcome in single patients. Therefore, we conducted regression analyses for the three different cohorts. In this analysis, BL Aβ levels positively correlated with longitudinal cognitive decline in all study groups (at trend for DEP(+)/SSRI(+)); quadratic functions gave the best fit in all study groups (Fig. 4). Visually, the shape of the function of Δ-ADAS with higher Aβ BL levels had a slightly more pronounced increase in the group of DEP(+)/SSRI(−) subjects when compared to the DEP(−) subjects. This could indicate that patients with subsyndromal depression and high initial amyloid load decline faster compared to DEP(−) patients, as we have likewise seen in our previous investigation [10]. The degree of rescue of declining cognitive performance by SSRI medication in relation to individual BL Aβ levels was characterized by a global shift to lower Δ-ADAS when comparing DEP(+)/SSRI(+) with DEP(+)/SSRI(−), such that the function of the relationship DEP(+)/SSRI(+) clearly ranged below that of the DEP(−) group. Quantitatively, individual SSRI-treated DEP(+) patients had 5.0±2.6% (range: 2.3 –11.3%) less increase in Δ-ADAS over two years when compared to DEP(+)/SSRI(−).
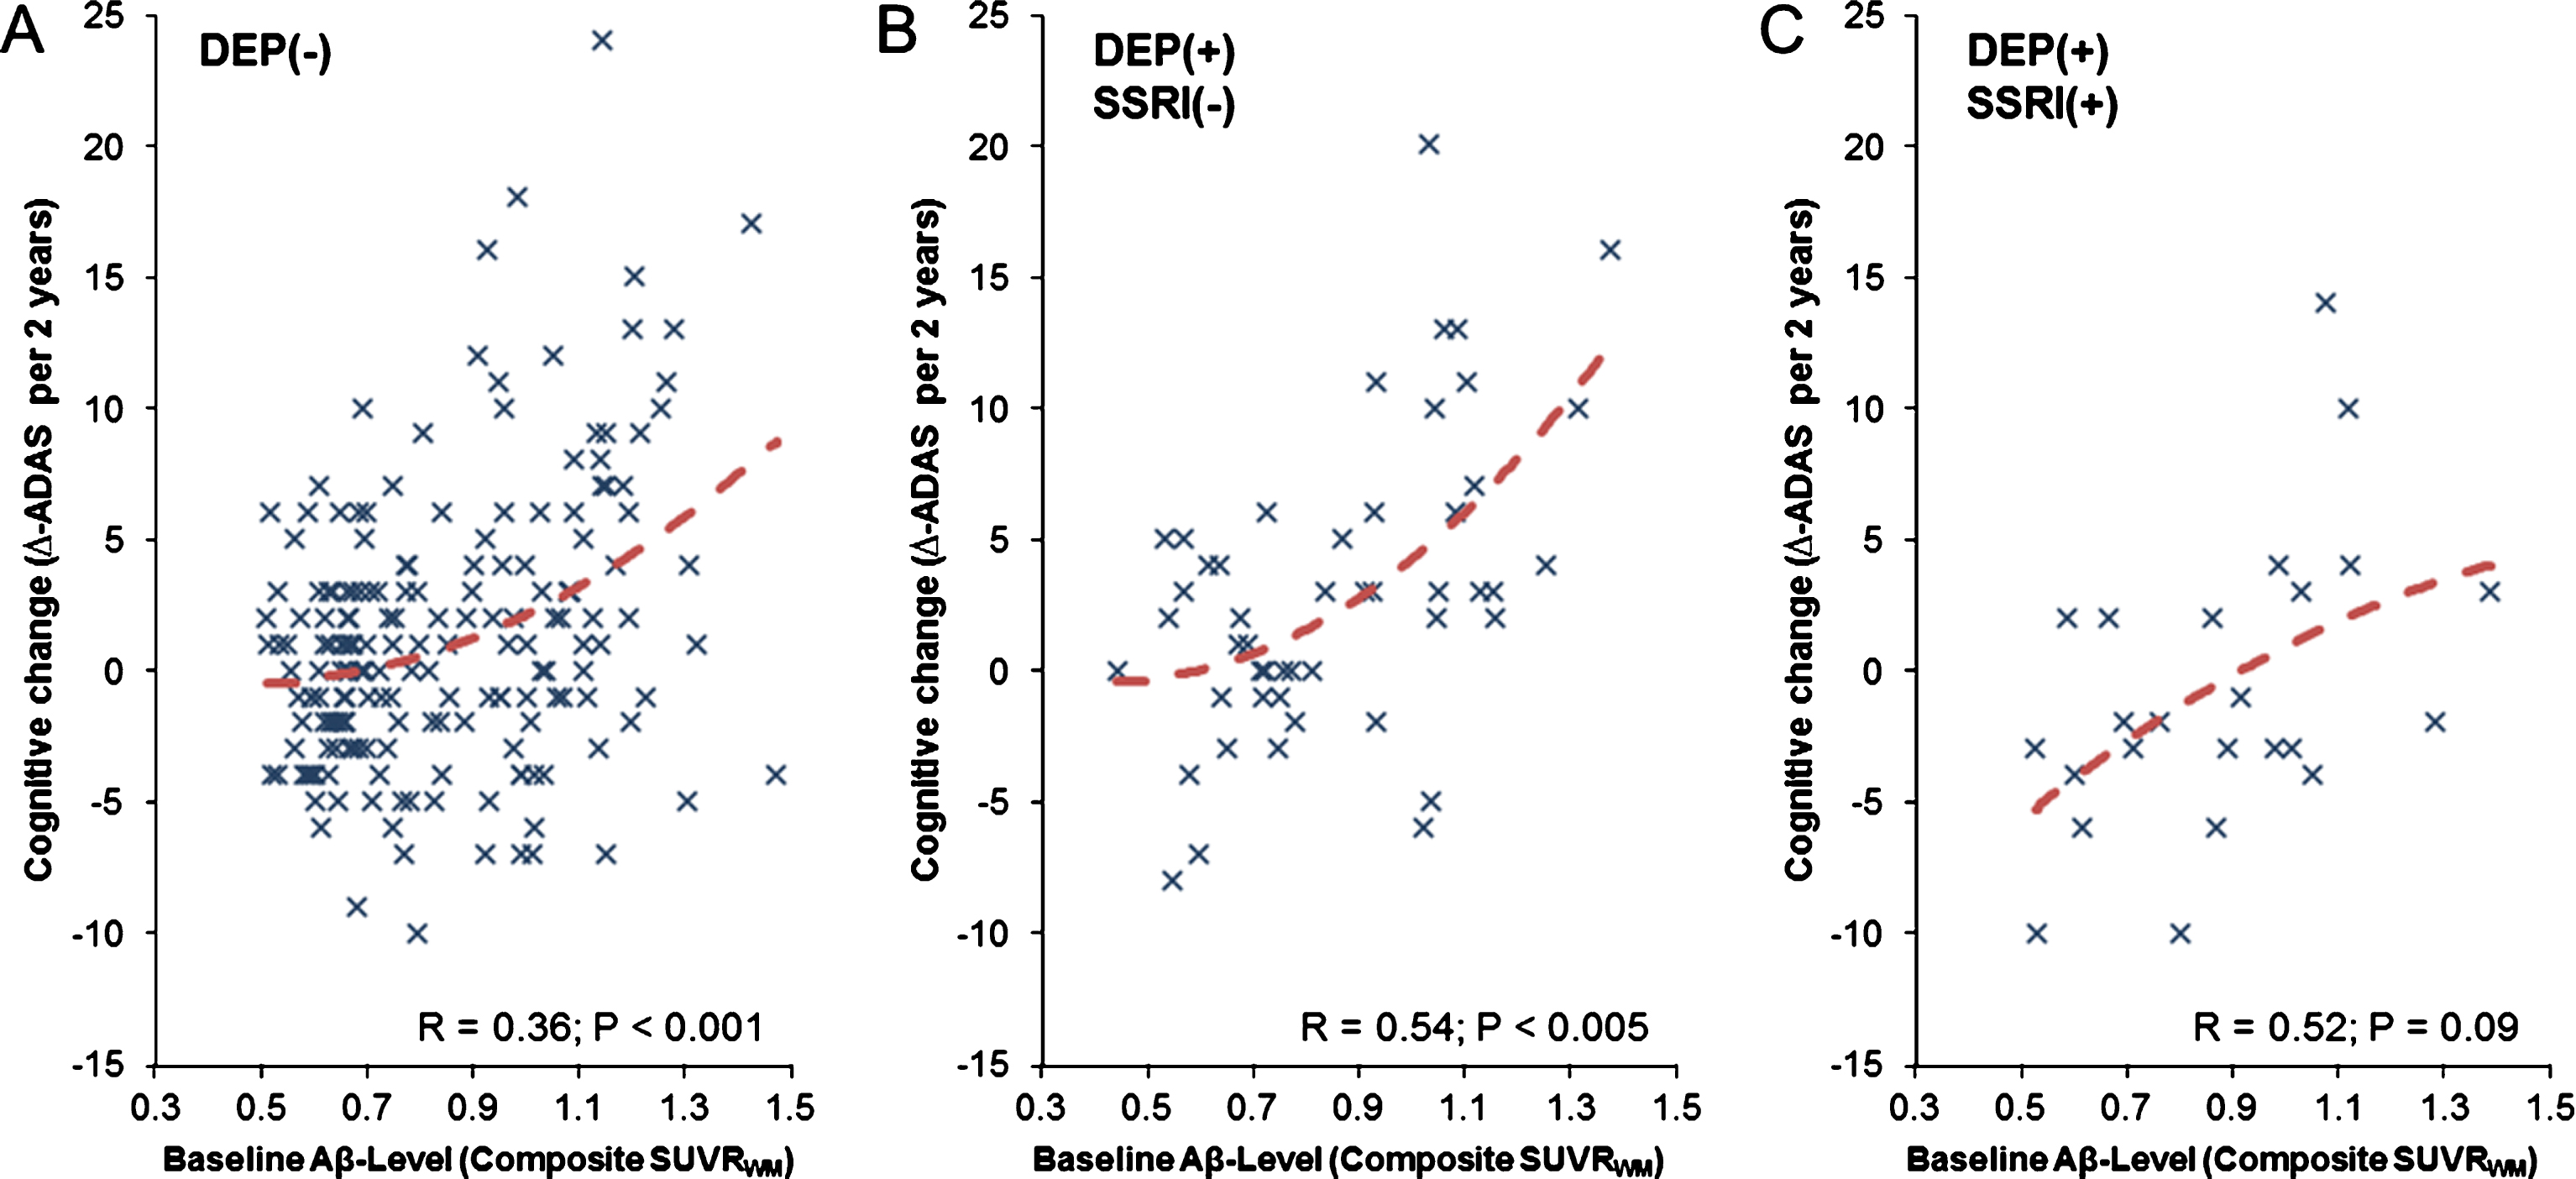
Relationship between the baseline amyloid-β (Aβ) level and cognitive change (Δ-ADAS) during two y for all three study groups (A-C). Dashed red lines represent the non-linear function between both parameters, which gave a quadratic fit as the best model for all subgroups.
There were no significant associations between BL Aβ-PET and longitudinal change of the amyloid burden or changes in grey matter atrophy, probably due to the clinical heterogeneity expected in such a cohort of subjects.
Necessary sample sizes for prospective clinical trials
Calculation of required sample sizes for prospective clinical trial of SSRI versus placebo gave n = 76 (n = 38 for each group of DEP(+)/SSRI(+) and DEP(+)/SSRI(−) patients) for absolute ADAS as the endpoint and n = 90 (n = 45 each) for relative ADAS. Corresponding sample sizes in the Aβ(+) subgroup were n = 60 (n = 30 each) for absolute ADAS and n = 124 (n = 62 each) for relative ADAS, with larger sample sizes reflecting the higher variance of cognition changes in this subgroup.
Longitudinal measures of atrophy required a sample size of n = 78 (n = 39 each) for the global grey matter volume and n = 80 (n = 40 each) for the temporal grey matter volume in the same contrast of DEP(+)/SSRI(+) versus DEP(+)/SSRI(−) patients. Corresponding sample sizes in the Aβ(+) subgroup were n = 52 (n = 26 each) for the global grey matter volume and n = 32 (n = 16 each) for the temporal grey matter volume.
DISCUSSION
We present the results of a 2-year longitudinal follow-up analysis aiming to test for effects of SSRI treatment on cognitive performance, amyloid burden and grey matter volume in cognitively affected subjects with coexisting subsyndromal depression. Multivariate analyses revealed that subjects with depressive symptoms were characterized by faster cognitive decline if not receiving SSRI treatment. Additionally, structural imaging indicated a faster progression of grey matter atrophy especially in the frontal lobe of subjects with depressive symptoms and lacking SSRI treatment. The attenuation of amyloid progression by SSRI treatment reported in a preclinical setting was not observed in the present clinical cohort. Moreover, the SSRI treatment rescued cognitive decline irrespective of the individual cerebral amyloid burden at BL. In summary, SSRI treatment imparted a beneficial effect on longitudinal cognitive performance in subjects with dementia symptoms and subsyndromal depression, accompanied by rescue of grey matter atrophy, but without significant effects on amyloid burden.
Cognition
In this investigation, we used in vivo biomarkers derived from PET and MRI imaging to characterize progression of symptoms in groups of patients with highly heterogeneous presentation of dementia and depression. By correction for differences in individual amyloid burden at BL, in addition to consideration of more standard covariates, we were in an earlier study able to account for the individual progression of amyloid burden to follow-up [30]. In this subsequent analysis of cognitive performance, there was little difference in BL ADAS and MMSE scores between the DEP(+) and DEP(−) groups at BL and in the longitudinal run. However, the stratification of DEP(+) in SSRI treatment/non-treatment subgroups revealed a significantly better outcome with respect to preservation of cognition in those patients receiving SSRI treatment during the follow-up period of two years. Others have found significantly improved MMSE scores after 3 months of SSRI treatment in AD patients [31], while a recent review including 10 randomized controlled trails and 3 meta-analyses on antidepressants in depressed AD patients reported inconsistent results, and suggested treatment by non-pharmacologic approaches and watchful waiting if depressive symptoms are not severe [32]. We note that only 24 of 73 (32.9%) MCI and AD subjects reporting depressive symptoms in NPI-Q were treated with antidepressant medication in our current ADNI sample. Others have likewise found an under-treatment, with only 45% of AD subjects with depressive symptoms receiving SSRIs in a 108-month follow up study [33]. As a Geriatric Depression Score (GDS) of higher than 5 is an exclusion criterion in ADNI, it has to be considered that the depressive symptoms of our study group were relatively low (GDS positive (3/73), mean GDS: 2.4), which possibly accounts for the low rate of SSRI treatment. Under consideration of the small sample size of subjects with depressive symptoms, present results suggest that SSRI treatment may be indicated even for minor depressive symptoms in patients with cognitive impairment, as sparing from cognitive decline was clearly evident to the present 2-year follow-up.
As Aβ-negative as well as -positive cases seem to benefit from the SSRI treatment, it must be considered whether the treatment affects the AD-specific pathology or the common course of dementia diseases. In this regard, MCI subjects show a wide range of pathological findings in autopsy, which is still subject to further studies [34]. From our data, the underlying mechanism of the SSRI-treatment may not specifically concern the AD-pathology but more likely a final common pathway of neurodegeneration. Speculatively, this could be a neuroinflammatory process, which is evidently common to nearly all neurodegenerative diseases [35], and is seemingly ameliorated by SSRI treatment [36, 37].
Amyloid burden
Based on the preclinical study of Sheline and colleagues in AD model mice [17], we predicted a lower progression rate of amyloidosis with SSRI-treatment during 2-year follow-up, as SSRIs significantly delayed amyloidogenesis in the mouse model. The same research group also found lower amyloid burden to [11C]-PiB-PET in cognitively healthy subjects with a history of SSRI intake when compared to SSRI-naive subjects, and also reported a negative correlation between amyloid burden and duration of previous SSRI intake [16]. Our hypothesis was not supported by the present longitudinal in vivo assessment of amyloid burden in a mixed group of MCI and AD patients examined with [18F]-AV45-PET. In this regard, our retrospective study design entails certain limitations, in that we were unable to assess the initiation date of the SSRI treatment, nor was the dose recorded. Thus, it may be that the main effect of SSRI treatment on amyloidosis in the individual subject had already transpired prior to the 2-year PET study period in this investigation, although we note that our BL assessments of amyloid burden do not support this speculation (Supplementary Table 1A, B). Furthermore, our subjects already had progressed towards cognitive decline at entry in the study, and many had rather high amyloid burden in the brain. In general, pharmacological effects on ongoing amyloid deposition would likely be more evident when initiated an early stage of amyloidosis [38].
Nonetheless, we contend that amyloid PET constituted an important methodological feature in this study as it enabled us to take into consideration the individual amyloidosis at BL, which was of proven benefit in an earlier preclinical investigation [38]. This correction for individual magnitude of amyloid pathology at BL increased the sensitivity for discerning changes to follow-up in a heterogenous study population. We feel that molecular imaging investigations in heterogeneous conditions like dementia and depression highly benefit from such BL scaling, as high amyloid levels at BL bring per se a tremendous risk for rapid cognitive decline [39]. Indeed, we find a significant positive relationship between BL amyloid burden and change in ADAS over two years in all subgroups of our study, albeit at trend level for the DEP(+)/SSRI(+) subgroup (Fig. 4). The benefit of SSRI treatment on rescue from longitudinal decline in cognition seems to occur irrespectively of the initial amyloid load, although the small sample size precluded strong claims to this effect.
Brain atrophy
Analysis of brain atrophy suggested higher grey matter volume loss in subsyndromal depressed subjects when compared to those without depressive symptoms, a difference that was most pronounced in the subanalysis of amyloid-positive subjects. Similar findings were reported in a recent study, wherein depressive symptoms in AD patients were associated with cortical thinning, especially in temporal and parietal regions [40]. Another study revealed that depressive symptoms in MCI subjects were linked with greater atrophy in AD-affected brain regions [41]. The frontal lobe is also reported to show grey matter atrophy in non-demented patients with major depressive disorder [42]. Therefore, there is evidently a connection between depressive symptoms and brain atrophy in patients with cognitive impairment. Importantly, we do not find differences in atrophy rates between patients with and without depressive symptoms when SSRI treatment is not considered, perhaps due to a balancing of opposing effects in treated and untreated patients. However, our analysis of SSRI treatment in subsyndromal depressed subjects indicated a clear rescue of atrophy rate in the 2-year follow up, especially in frontal and temporal regions. The most significantly spared VOIs included regions implicated in AD (temporal gyri) but were predominantly found in mood-related brain networks (e.g., orbitofrontal and anterior cingulate gyri) [43, 44]. The SSRI treatment slowed brain atrophy, probably constituting the macroscopic or anatomic correlate to the positive effects on cognitive performance. It should be considered that volumetric and cognitive changes did not correlate on the individual level, probably due to the inherent heterogeneity in such samples. However, the present structural imaging-related findings confirm that SSRI treatment brings not only a clinical improvement of subsyndromal depressive symptoms, but likewise has a beneficial structural correlate during the 2-year follow-up.
The finding of lower progression of atrophy in the SSRI treatment group was similar when investigating Aβ(+) subjects only. Therefore, we see not clear linkage between underlying amyloid pathology and the positive effect of SSRI treatment. The underlying mechanism of this beneficial effect on the grey matter volume remains to be elucidated, but we can assume that the ongoing neurodegeneration in DEP(+) patients might be modulated by SSRI treatment independently from the degree of amyloid burden.
Limitations
Subsyndromal depressed patients were stratified by NPI-Q, as there was no clinical diagnosis of depression and no gold standard structured interview data available. Hence, the low sensitivity of this single item must be considered as a limitation of our study. We considered using the geriatric depression scale, but this was rejected since any GDS >5 was defined as an exclusion criterion of ADNI; as this criterion might have led to more selection bias, we elected to the NPI-Q score. Furthermore, the documentation of SSRI-treatment begins only at the time of the BL PET scan, such that we cannot ascertain the duration of SSRI treatment, which may have some bearing on the amyloid load, cognition, and brain atrophy seen in the ADNI inclusion period. Indeed, depressive symptoms in the time before ADNI inclusion are unknown. Thus, our findings might be confounded by subsuming subjects with and without history of SSRI treatment when they had no depressive symptoms at entry into the study. Our patient group could potentially include patients with earlier depressive symptoms that resolved upon treatment. However, due to the broad medical indications for SSRI, we considered the present approach as preferable, regarding potential bias deriving from patients treated with SSRI for reasons other than depressive symptoms. Another limitation consists of the different and particularly unknown SSRI dosages, such that known SSRI dosage effects cannot be considered in our study [45]. Furthermore, the effectiveness of SSRI treatment for depressive symptoms shows great inter-individual variation [46], which might be a limitation in the comparison of treated subjects with individual response to the treatment. However, we emphasize that sufficiently powered molecularimaging studies are poised to play an important future role in compensation for such heterogeneous responses. A further limitation due to the retrospective design lies in the relatively small number (n = 24) of SSRI-treated subsyndromal depressed patients. However, our study entails relatively large comparison groups (n = 49/n = 183), and the benefits of normalization to BL covariates strengthens the conclusions to be drawn in a very specific subgroup. As more than 90% of our subjects had BL and follow-up scans on the same scanner, scanner-specific differences could conceivable interact with actual biological changes. Finally, we used pre-processed data from the ADNI set, and did not perform additional longitudinal processing of MRI scans as performed by other investigations [47]. Thus, we cannot fully exclude a bias deriving from scanner-related measurement errors between BL and follow-up MRI scans, but larger errors should have been avoided by our highly sophisticated quality control [28]. Correction for multiple comparisons was applied to adjust for more than two subgroups but not for the different outcome parameter of the study, thus the results of this exploratory study should be interpreted carefully.
Conclusions
Our results indicate that cognitively impaired subjects with MCI or AD in conjunction with depressive symptoms benefit from SSRI treatment regarding rescue from longitudinal decline in cognitive performance. As a structural correlate of the clinical cognitive benefits, lower grey matter atrophy rates were observed during the 2-year follow-up in these patients. Contrary to expectation, we saw only small trends towards a beneficial effect SSRI treatment on amyloid deposition rates. Given the low proportion of SSRI-treated patients in this sample, we contend that more attention should be placed on depressive symptoms in the field of AD research, even when these symptoms are subsyndromal. Finally, our in vivo assessment of amyloid burden by PET at BL allows individual scaling/normalization of a rather heterogeneous sample, an approach with considerable potential for improving the sensitivity of clinical antidepressant trials in AD.
Footnotes
ACKNOWLEDGMENTS
Language editing was provided by Inglewood Biomedical Editing. This paper originated from the doctoral thesis of Julia Sauerbeck.
Data collection and sharing for this project was funded by the Alzheimer’s Disease Neuroimaging Initiative (ADNI) (National Institutes of Health Grant U01 AG024904) and DOD ADNI (Department of Defense award number W81XWH-12-2-0012). ADNI is funded by the National Institute on Aging, the National Institute of Biomedical Imaging and Bioengineering, and through generous contributions from the following: AbbVie, Alzheimer’s Association; Alzheimer’s Drug Discovery Foundation; Araclon Biotech; BioClinica, Inc.; Biogen; Bristol-Myers Squibb Company; CereSpir, Inc.; Cogstate; Eisai Inc.; Elan Pharmaceuticals, Inc.; Eli Lilly and Company; EuroImmun; F. Hoffmann-La Roche Ltd and its affiliated company Genentech, Inc.; Fujirebio; GE Healthcare; IXICO Ltd.; Janssen Alzheimer Immunotherapy Research & Development, LLC.; Johnson & Johnson Pharmaceutical Research & Development LLC.; Lumosity; Lundbeck; Merck & Co., Inc.; Meso Scale Diagnostics, LLC.; NeuroRx Research; Neurotrack Technologies; Novartis Pharmaceuticals Corporation; Pfizer Inc.; Piramal Imaging; Servier; Takeda Pharmaceutical Company; and Transition Therapeutics. The Canadian Institutes of Health Research is providing funds to support ADNI clinical sites in Canada. Private sector contributions are facilitated by the Foundation for the National Institutes of Health (![]() ). The grantee organization is the Northern California Institute for Research and Education, and the study is coordinated by the Alzheimer’s Therapeutic Research Institute at the University of Southern California. ADNI data are disseminated by the Laboratory for Neuro Imaging at the University of Southern California.
). The grantee organization is the Northern California Institute for Research and Education, and the study is coordinated by the Alzheimer’s Therapeutic Research Institute at the University of Southern California. ADNI data are disseminated by the Laboratory for Neuro Imaging at the University of Southern California.