
Abstract
Background:
Amyloid-β (Aβ) and [18F]FDG PET are established as amyloid pathology and neuronal injury biomarkers. Early after administration Aβ PET images have the potential to replace [18F]FDG PET images allowing dual biomarker delivery by the administration of a single tracer. For [18F]FDG PET data, a correlation with cognitive performance is known.
Objective:
The aim of this study was to investigate whether early after administration [11C]PiB PET data also correlate with cognitive performance.
Methods:
The early after administration [11C]PiB PET data of 31 patients with cognitive impairment were evaluated. CERAD subtests were summarized to five cognitive domains. The resulting z scores were correlated with the PET data on a voxel- and VOI-based approach. Additional subgroup analyses (MCI versus dementia, Aβ-positive versus Aβ-negative subjects) were performed.
Results:
Significant correlations between cognitive performance and early after administration [11C]PiB PET data were found between left temporo-parietal SUVR and language domain, bilateral occipital as well as left temporal SUVR and executive function, left pre- and postcentral SUVRs, and visuospatial abilities. For the episodic and immediate memory domains, the analysis at the high significance level did not show any correlated cluster, however, the exploratory analysis did.
Conclusion:
Our study revealed correlations between deficits in different cognitive domains and regional early after administration [11C]PiB PET data similar to those known from [18F]FDG PET studies. Thus, our data support the assumption that early [11C]PiB PET data have a potential as neuronal injury biomarker. Head-to-head double-tracer studies of larger cohorts are needed to confirm this assumption.
INTRODUCTION
[18F]FDG PET images are established as neuronal injury biomarkers to support clinical diagnosis especially in Alzheimer’s disease (AD) [1]. In the last two decades, non-invasive imaging of amyloid-β (Aβ) plaques using different PET radiotracers has also been established. As such, Aβ PET is used as an amyloid pathology biomarker [1]. Recently, our and other groups demonstrated a strong correlation between [18F]FDG PET images and early after administration [11C]Pittsburgh Compound B (PiB) images [2 –6]. In the brain, glucose consumption and blood supply are closely coupled (“neurovascular coupling”). Consequently, brain glucose metabolism and perfusion overlap regionally [7, 8]. The potential of Aβ PET tracers to deliver cerebral blood flow estimates is based on their high extraction fraction. For [11C]PiB, an extraction fraction (K1/CBF) of 77% has been documented in a rhesus monkey [9]. A high tracer extraction fraction means that K1 images obtained by kinetic modeling or early after tracer administration images are mainly determined by regional cerebral blood flow. Hence, Meyer et al. [2] could demonstrate that [11C]PiB R1 PET data reflecting relative cerebral blood flow strongly correlate to [18F]FDG uptake in patients with dementia. Rostomian et al. [3] demonstrated that early after administration [11C]PiB PET images (1–8 min p.i.) were comparable to [18F]FDG PET images (30–60 min p.i.). Further studies supported this assumption, demonstrating a highly correlation between early after administration [11C]PiB PET standardized uptake value ratios (SUVRs) and quantitative [18F]FDG PET data (CMRglc) [4] or relative quantitative [18F]FDG PET data [5, 6]. This highly suggests that early after administration [11C]PiB PET scans might be able to substitute [18F]FDG in a way that dual-time point acquisition of [11C]PiB could provide biomarker information both on neuronal injury and amyloid pathology.
A biomarker reflecting neuronal injury should have a strong correlation to the AD phenotype as measured by cognitive tests like the Consortium to Establish a Registry for Alzheimer’s Disease (CERAD) test battery. For [18F]FDG PET, these correlations have been confirmed by several groups [10 –15]. The aim of this present study was to investigate the correlation between early after administration [11C]PiB PET and neuropsychological test data and compare them with published results of [18F]FDG PET studies.
MATERIAL AND METHODS
Participants
In the present study, we retrospectively analyzed all [11C]PiB PET data of subjects with cognitive impairment who were imaged in a dual time-window fashion in our department between July 2012 and May 2013. All patients received routine diagnostic work-up including medical history, informant-based history, neuropsychological testing (CERAD test battery), neurological examination, and MRI. Based on the results of these investigations, the ‘clinical diagnosis’ was established by consensus of a multidisciplinary team blinded to MRI, cerebrospinal fluid, and [11C]PiB PET results. Patients were referred for imaging with the clinical diagnosis (according to the NINCDS/ADRDA criteria) of probable AD (n = 6), possible AD (n = 10), or with the clinical diagnosis of mild cognitive impairment (MCI) (n = 15). According to the current clinical use criteria for Aβ imaging [16, 17], [11C]PiB PET imaging was performed to either clarify the underlying cause of the cognitive impairment or to confirm the clinical diagnosis. The Mini-Mental State Examination (MMSE) scores ranged from 10 to 29 (mv±sd = 24±4). All subjects provided written informed consent to undergo amyloid imaging and to subsequent scientific data analysis. All procedures performed in studies involving human participants were in accordance with the ethical standards of the institutional and/or national research committee [17] and with the 1964 Helsinki Declaration and its later amendments or comparable ethical standards. This study was approved by the local ethics committee.
PET data acquisition
Aβ PET images were acquired either using a stand-alone PET scanner (ECAT EXACT HR+, Siemens, Erlangen, Germany; n = 12), or a simultaneous PET/MR scanner (Biograph mMR, Siemens, Erlangen, Germany; n = 19). On the stand-alone PET scanner, a transmission scan of 10 min was performed for attenuation correction directly before the emission scan. On the PET/MR system, the attenuation correction was carried out using a μ-map which was generated with a MR Dixon sequence.
A dynamic [11C]PiB PET acquisition lasting 90 min (frames: 4×15 s, 4×60 s, 5×120 s, 5×300 s, 5×600 s) was started directly after the intravenous injection of 360±25 MBq [11C]PiB. Two PET scans were generated from the dynamic datasets: Data from 1 min to 9 min p.i. for the early after administration scans [3], and data from 40 min to 70 min p.i. for the late after administration scans [18].
Neuropsychological assessment
Cognitive state was tested employing the German Version of the CERAD test battery (http://www.memoryclinic.ch). This battery includes the following subtests: modified Boston naming test, animal category verbal fluency, letter (or phonematic) fluency, word list learning, recall and recognition, MMSE, visuoconstruction copy, recall and recognition (i.e., saving figures). The raw scores of the CERAD subtests were converted into z scores using the age-, education- and gender-specific normative values provided by the memory clinic in Basel, Switzerland (accessible at http://www.memoryclinic.ch). The z scores of the relevant subtests were then averaged to total z scores for five cognitive domains (Table 1).
Cognitive domains and included neuropsychological test z scores
CERAD, Consortium to Establish a Registry for Alzheimer’s Disease.
PET data analysis
The late after administration PET data were evaluated visually by three experienced nuclear physicians. The reader scored the tracer uptake using a 3– level-scale (0 = normal, 1 = abnormal with minor plaques, 2 = abnormal with major plaques). The scores of the 3 experts were aggregated into final regional scores based on a majority decision and summarized in a dichotomous score (0 = Aβ-negative, 1 and 2 = Aβ-positive).
The early after tracer administration PET data (standardized uptake values – SUVs) were analyzed semi-quantitatively (reference region: cerebellum) obtaining SUV ratios (SUVRs) that were further analyzed both on a voxel as well as on a volume-of-interest (VOI) level. The VOI-based analysis was carried out using PMOD software package (Version 3.5., PMOD Technologies Ltd, Zurich, Switzerland) using the VOIs of the AAL template [19, 20].
The voxel-based analysis was performed using the Statistical Parametric Mapping software (SPM8, Wellcome Department of Cognitive Neurology, London, UK) implemented in Matlab 7.3.0 (The MathWorks Inc., USA). Datasets were spatially normalized onto the integrated PET template and smoothed with an 8 mm full width at half maximum (FWHM) Gaussian filter.
The analyses were performed for the entire study cohort and for the Aβ-positive and Aβ-negative subgroup separately. Considering that deficits in the same neurocognitive domain/ test can occur in different neurocognitive diseases and should correlate with the regional early after administration [11C]PiB PET data independent from the cause of the neuronal injury or the Aβ status, we decided to use the data of the entire study cohort and to refer to the subgroup data only were meaningful. Independently, the Supplementary Material lists all subgroup data in detail.
Statistics
Statistical data analysis was carried out employing the statistical package for social science (SPSS) software for Windows (version 20.0, IBM, Armonk, NY, USA). Normal distribution was tested using the Kolmogorov-Smirnov test. T-tests for two independent samples or Mann-Whitney U tests were used to evaluate differences between the Aβ-positive and Aβ-negative subgroup. Two-tailed Pearson’s correlations and linear regressions were calculated between the z scores of the different cognitive domains and SUVRs of the early after administration [11C]PiB PET scans. Significance levels were set at p < 0.05. For the VOI-based analysis, a Bonferroni correction was additionally applied to correct for multiple comparisons. Using 10 regions for the VOI-based approach, a p < 0.005 was considered significant. One-sided t-tests were used for voxel-wise correlations with the z scores of the CERAD subsets. For the exploratory SPM analysis, correlations were accepted as significant at p < 0.001 (uncorrected) and a cluster size k > 30. To correct for multiple comparisons, family wise-error (FWE)-corrected p-values are given as well and were considered significant at p < 0.05. For region identification of relevant clusters, the AAL atlas toolbox in SPM8 was used.
RESULTS
The study population demographics and the neuropsychological test results are presented in Tables 2 and 3. The Aβ-positive and Aβ-negative subgroups did not significantly differ in any of these data (Table 2). The MMSE scores ranged from 18–28 in the Aβ-positive and from 10–29 in the Aβ-negative subgroup. As the majority of patients (28/31) had an MMSE score≥20, the mean value was 24 in both groups. The MCI and dementia subgroup did, likewise, not differ in demographic data but showed, as expected, significantly different values in most of the neuropsychological tests (Table 3).
Study population demographics and summarized cognitive test data of the study group as well as for Aβ-positive and Aβ-negative subgroups
Amyloid positivity/negativity was determined by visual analysis of the late after administration [11C]PiB images. Aβ, amyloid-β; MCI, mild cognitive impairment; MMSE, Mini-Mental State Examination; mv, mean value; n.s., non-significant; sd, standard deviation.
Study population demographics and summarized cognitive test data of the study group as well as for Aβ-positive and Aβ-negative subgroups
Amyloid positivity/negativity was determined by visual analysis of the late after administration [11C]PiB images. Aβ, amyloid-β; MCI, mild cognitive impairment; MMSE, Mini-Mental State Examination; mv, mean value; sd, standard deviation.
Association between the regional [11C]PiB uptake as obtained by VOI analysis and the Z scores of the neuropsychological subtest and cognitive domains of the entire study group (n = 31)
PET data utilized for this analysis are regional standardized uptake values taking the cerebellar cortex as reference region. The data shown here are Pearson correlation coefficients r. PiB, Pittsburgh Compound B; VOI, volume of interest; Aβ, amyloid-β; L, left; R, right; PCC, posterior cingulate cortex. #Significance due to an outlier. Significance level: *p < 0.05 **p < 0.01 **p < 0.005 (red marked).
VOI-based early after administration [11C]PiB PET data analysis
For the VOI-based early after administration [11C]PiB PET data analysis, the results for the correlation analyses between the regional SUVRs and the z scores of the neuropsychological tests are summarized in Table 5 for the entire study group and in the Supplementary Material also separated for the Aβ-positive and Aβ-negative subgroup (Supplementary Table 1) as well as patients with MCI and dementia (Supplementary Table 2).
Association between the z scores of the different cognitive domains and the regional early after administration [11C]PiB PET uptake as obtained by SPM analysis
For each cognitive domain, only the clusters with the highest statistical significance are presented. R, right; L, left.
Significant correlations corrected for multiple comparisons were found between the deficits in the language domain and SUVRs of the left precuneus/posterior cingulate cortex (p = 0.004) as well as in the left temporal cortex (p < 0.001). At subtest level, the Boston naming test was significantly correlated with the SUVRs of the left temporal cortex (p = 0.001) and in the Aβ-negative subgroup additionally strongly with the SUVRs of the left parietal cortex (p = 0.003).
The executive function measured by the letter fluency was highly correlated with the SUVRs in the occipital cortex bilateral (left-sided: p = 0.002; right-sided: p = 0.004). Figure 2 shows the scatter plots to these significant correlations for the entire study cohort and Supplementary Figure 1 separated for the Aβ-positive/negative subgroups.
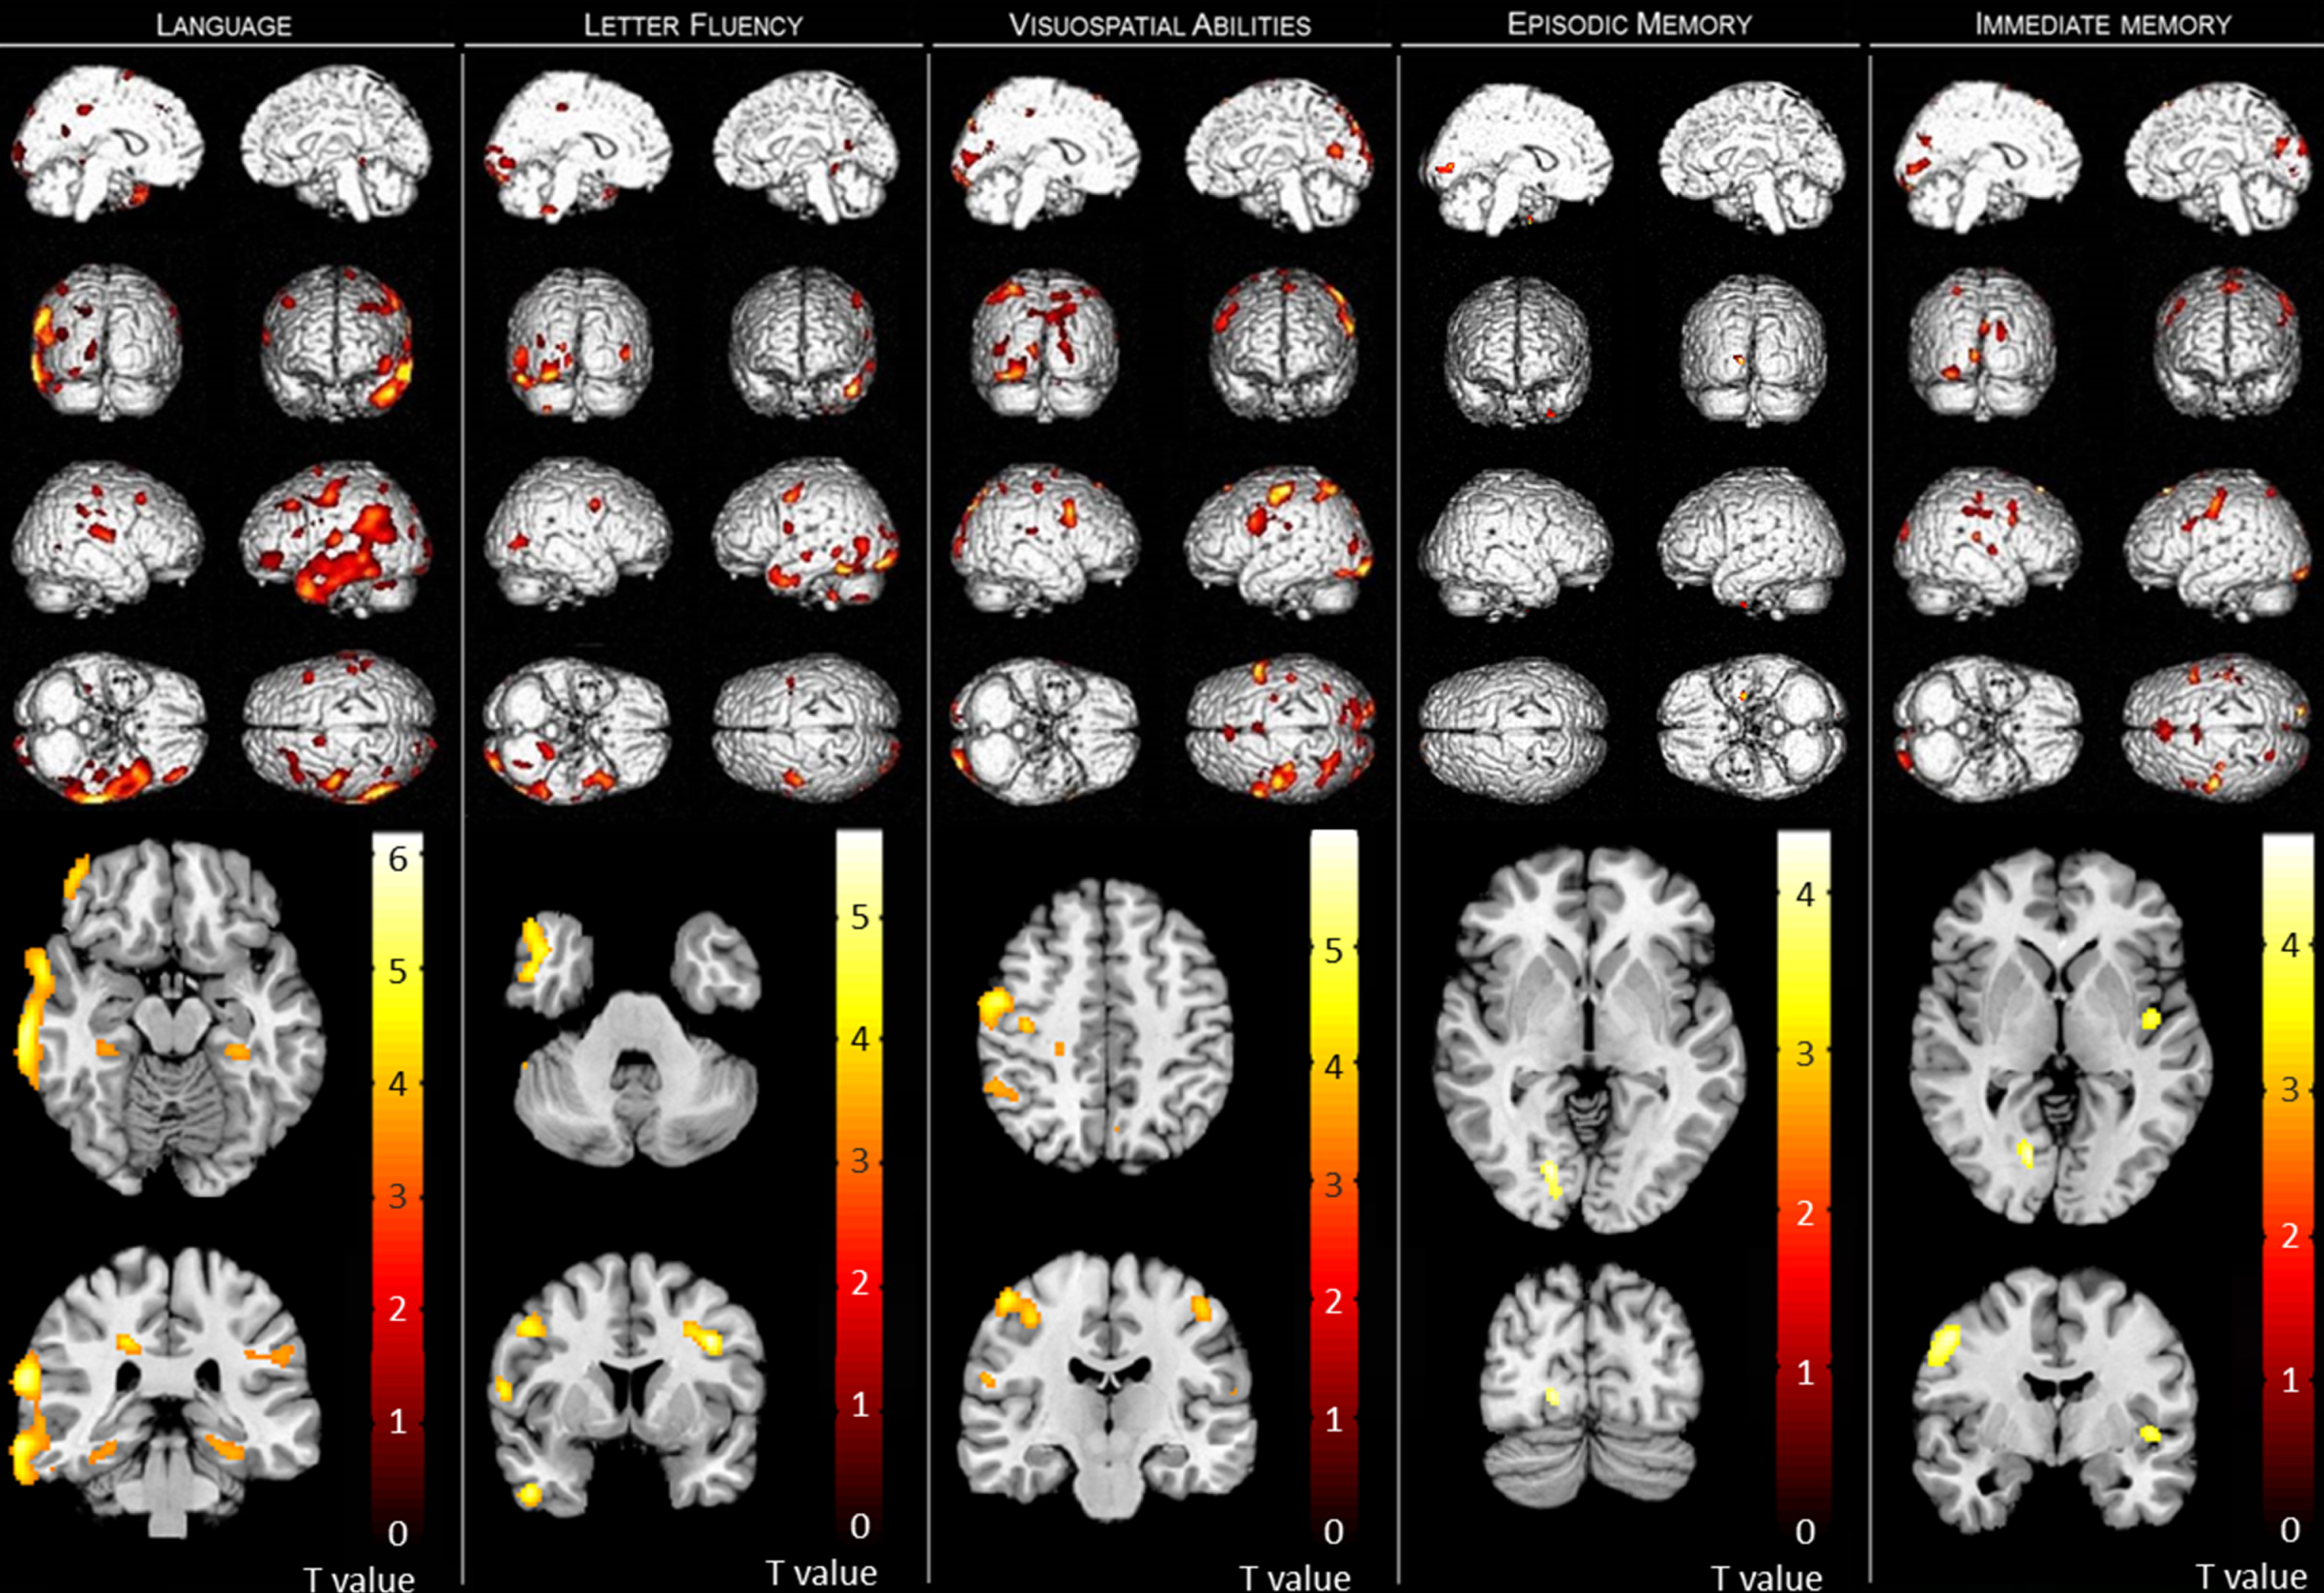
SPM maps depicting positive correlations between standardized uptake value ratios of the early after tracer administration [11C]PiB scans and the performance z scores of the five main cognitive domains investigated. Shown are clusters with a size k > 30, contiguous voxels passing the significance threshold of p < 0.001.
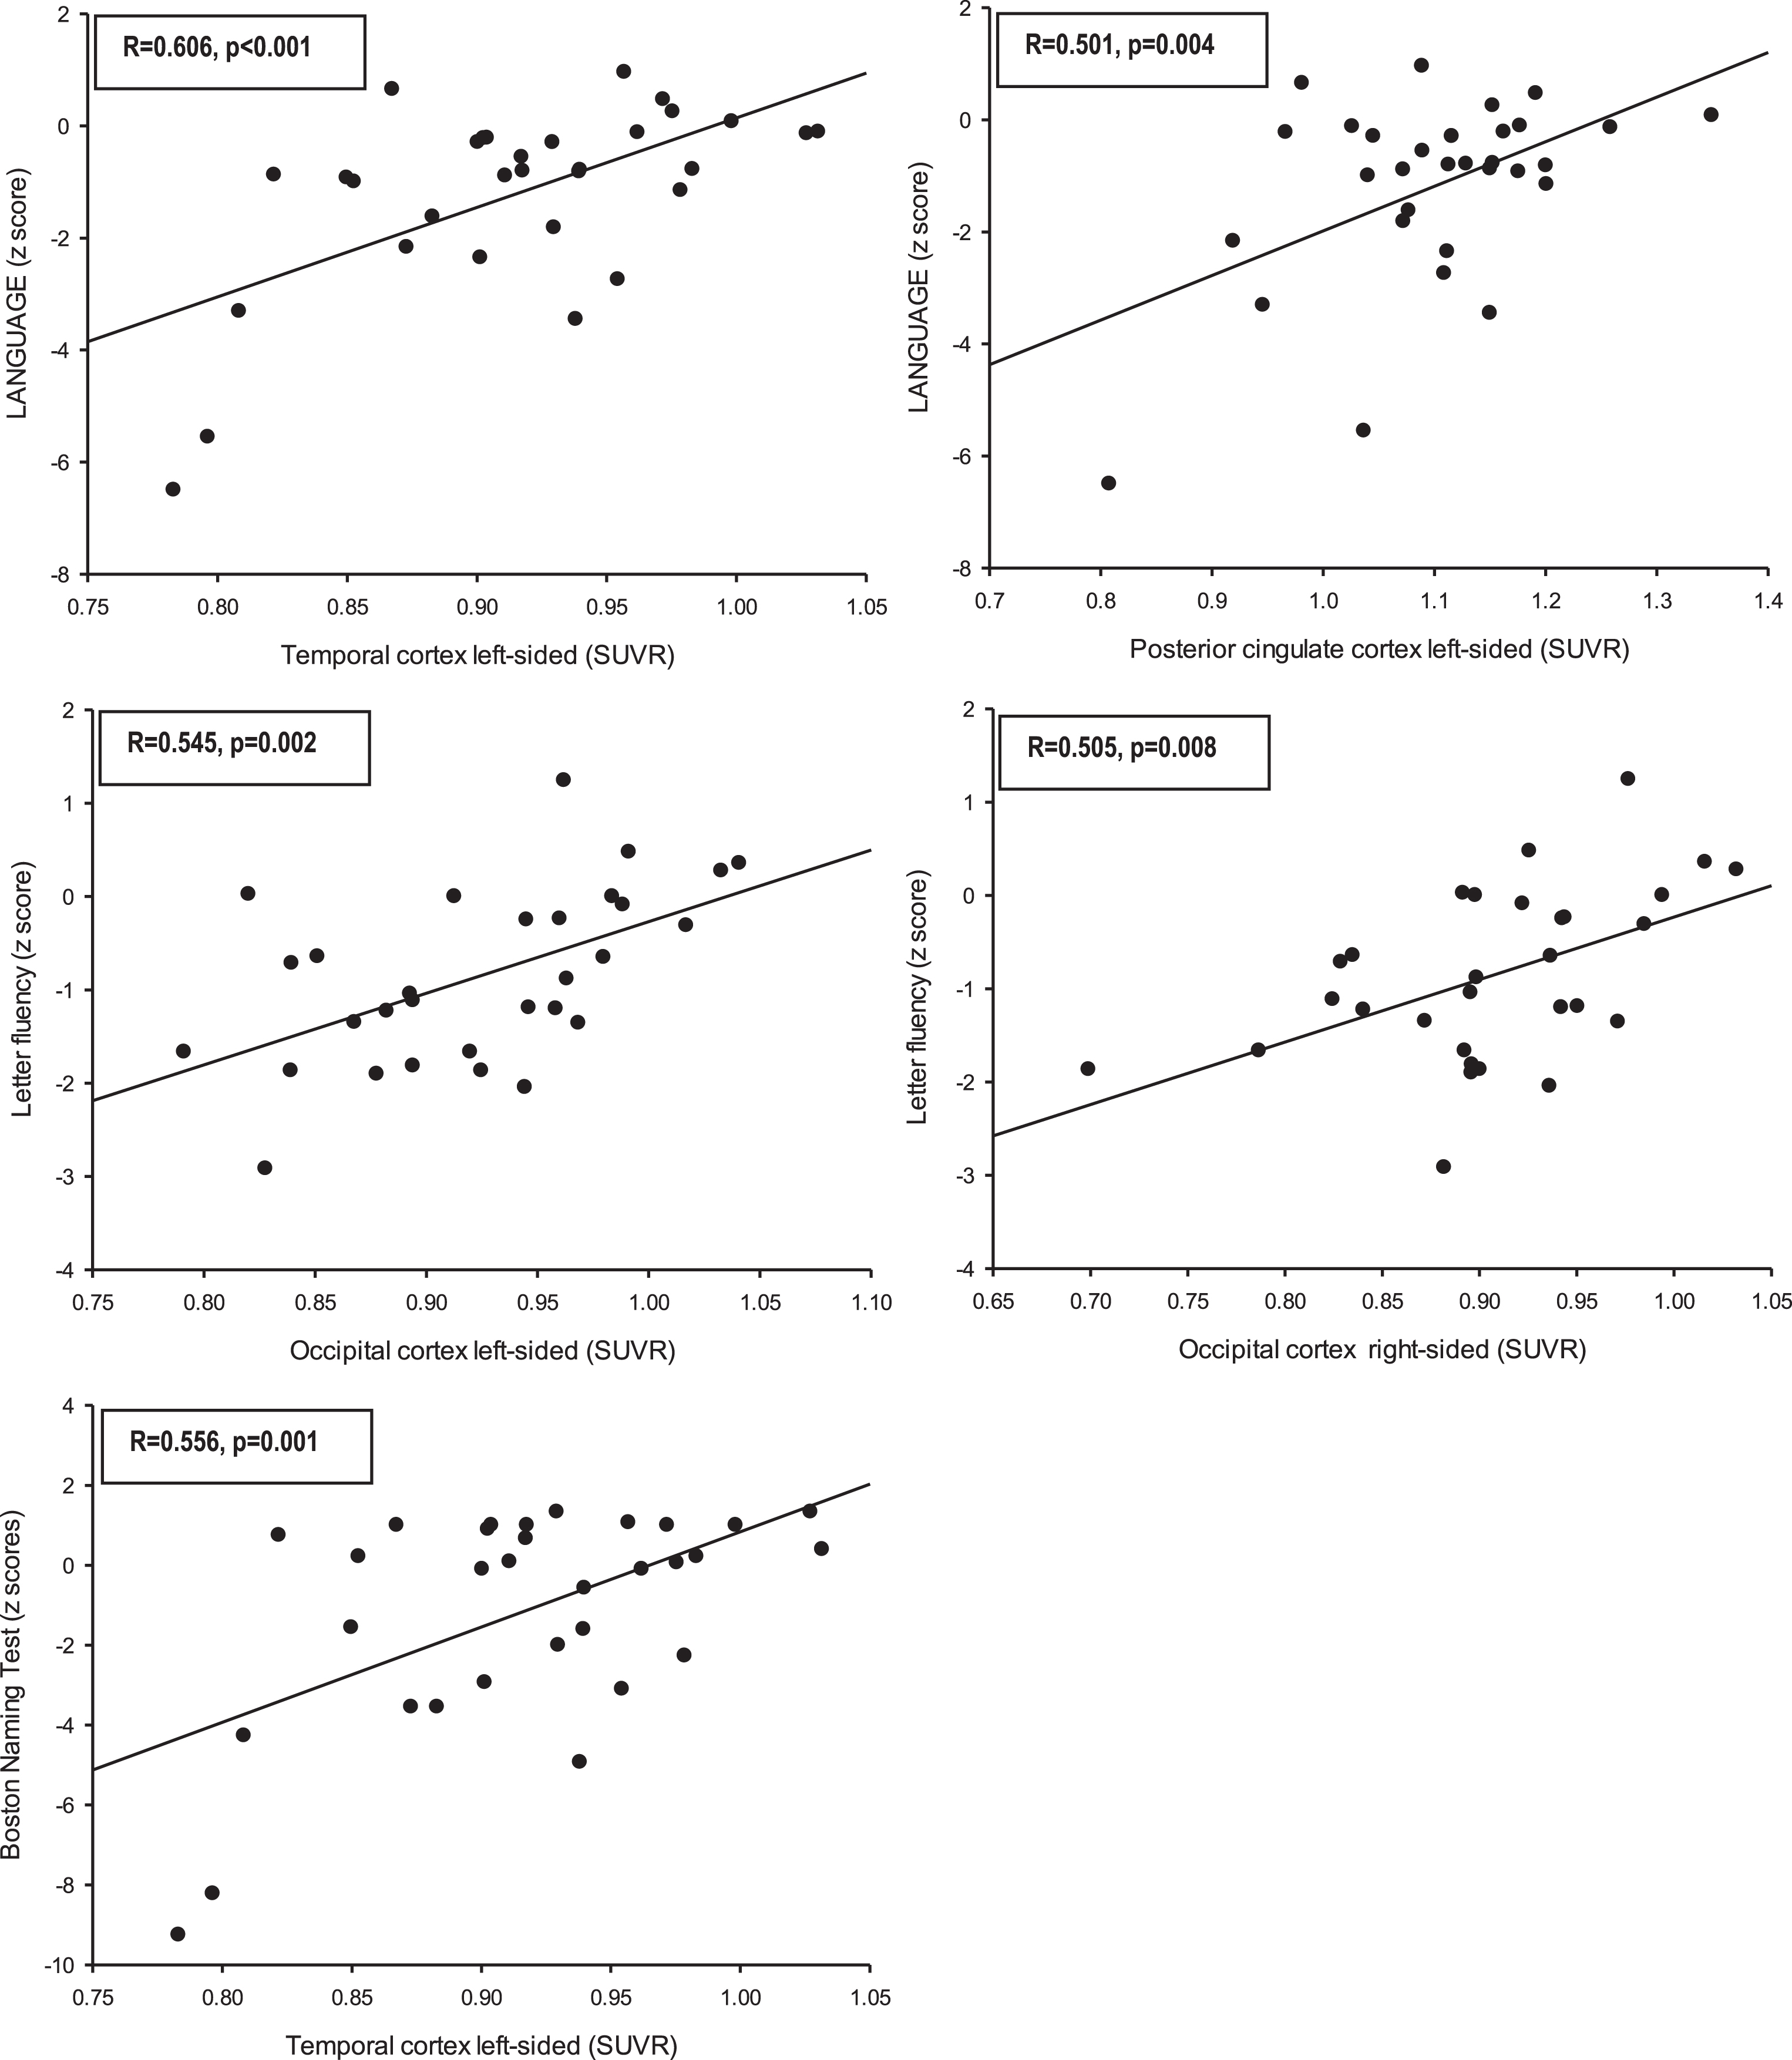
Scatter plots and regression lines showing the significant correlations (after correction for multiple testing) between regional standardized uptake value ratios (SUVRs) of the early after tracer administration [11C]PiB scans and the neurocognitive test z scores in the entire study group.
In the entire study group, the regional SUVRs did not reveal any significant correlation with deficits in the visuospatial ability, immediate memory, or episodic memory domain. However, in the MCI subgroup, visuospatial ability z scores were correlated with the SUVRs of the right temporal (p = 0.003) and parietal cortex (p = 0.004). At a subtest level, these correlations in the MCI subgroup were reproducible for the z scores of the visuoconstruction copy test but not for the visuoconstruction recall test.
The exploratory analysis without correction for multiple comparisons of the VOI-based early after administration [11C]PiB PET showed that the correlations of the entire study group between z scores of the language domain and regional SUVRs were mainly evident in the Aβ-negative subgroup. In the Aβ-positive subgroup, language z scores and regional SUVRs were only correlated in the left temporal cortex (p = 0.011). In the MCI subjects, language z scores were correlated with SUVRs of the right temporal and parietal cortex (p = 0.031 and p = 0.047), while in the dementia patients, the language z scores were correlated with SUVRs of the posterior cingulate (left: p = 0.009, right: p = 0.032) and left temporal cortices (p = 0.028). At subtest level, that the Boston naming test was also strongly correlated with the SUVRs of the left frontal cortex (p = 0.006) which was reproducible in the Aβ-negative subgroup (p = 0.012).
The executive function measured by the letter fluency was additionally highly correlated with the SUVRs in the left temporal cortex (p = 0.008). The subgroup analysis showed that these correlations between executive function and regional (i.e., bilateral occipital and left temporal) SUVRs were reproducible in the Aβ-positive subgroup as well as in the dementia subgroup. In the latter, additional correlations between executive function z scores and SUVRs of the posterior cingulate cortices were observed (left: p = 0.033, right: p = 0.005).
In the subgroup analysis, the visuospatial ability scores of the MCI subjects showed, in addition to the SUVRs of the right temporal and parietal cortex, a significant correlation to the SUVRs of the left temporal cortex (p = 0.008).
The immediate memory measured by the word list memory z scores were correlated with the SUVRs in the bilateral parietal cortex (right-sided: p = 0.08, left-sided: p = 0.010). These results were reproducible in the Aβ-negative subgroup (left parietal: p = 0.001, right parietal: p = 0.011). At subtest level, the word list recall scores as part of the episodic memory domain showed a weak correlation with the SUVR of the left parietal cortex (p = 0.045).
Voxel-based early after administration [11C]PiB PET data analysis
The results of the voxel-based analysis of the early after administration [11C]PiB PET data were summarized in Table 5 and Fig. 1 The z scores of the language domain deficits were positively correlated with the SUVRs in a large left-sided parietotemporal cortex cluster which included the supramarginal and angular gyrus as well as the temporal pol (pFWE - corr < 0.001). A further correlation cluster was detected left frontal in the precentral and middle frontal gyrus (pFWE - corr = 0.044).
Letter fluency scores were positively correlated with the SUVRs of the left middle and inferior temporal gyrus (pFWE - corr = 0.040).
The z scores of the visuospatial abilities domain were positively correlated with the SUVRs of the left pre- and postcentral gyrus (pFWE - corr = 0.015).
For the episodic memory and immediate memory domains, the SPM analysis did not show any significantly correlated cluster at this high significance level in the entire study group.
The exploratory analysis of the voxel-based early after administration [11C]PiB PET data of the entire study group detected further correlations at a lower, i.e., uncorrected significance level. The z scores of the language domain deficits were positively correlated with the SUVRs in the right postcentral region (puncorr = 0.019) and left inferior frontal region (puncorr = 0.028). The subgroup analysis revealed that most of the correlating clusters of the entire study group (i.e., clusters in the left-sided parietotemporal and frontal areas) were retrievable in the dementia as well as Aβ-negative subgroup, whereby the clusters in the dementia subgroup were mainly located in the left parietotemporal region (pFWE - corr≤0.01, each) and in the Aβ-negative subgroup mainly in the left frontal and bilateral parietal lobe (pFWE - corr < 0.05, each). Further clusters in right precuneus (pFWE - corr = 0.030) and the right superior occipital gyrus (puncorr = 0.031) were detectable in this subgroup. In the Aβ-positive subgroup, one cluster in the left superior temporal gyrus were correlated to the language domain z scores (pFWE - corr = 0.023) and, in the MCI subjects, a cluster in the left inferior temporal gyrus (puncorr = 0.006).
Letter fluency scores were next to the left middle and inferior temporal gyrus positively correlated with the SUVRs of additional clusters in left inferior occipital gyrus and left temporal pol (puncorr = 0.016, each). The subgroup analysis revealed that most of these correlating clusters were reproducible in the dementia subgroup which showed further clusters in left rolandic operculum (pFWE - corr < 0.001) and right middle frontal gyrus (pFWE - corr = 0.002) as well as smaller clusters in right inferior parietal gyrus, left superior frontal gyrus and left cerebellum (puncorr < 0.05, each).
The z scores of the visuospatial abilities domain were additionally correlated with the SUVRs of the left inferior occipital (puncorr = 0.010), left superior parietal gyrus (puncorr = 0.005) as well as with the right precentral (puncorr = 0.015) and right cuneus region (puncorr = 0.009). Most of these clusters were also detectable in the Aβ-negative subgroup (left superior parietal gyrus (pFWE - corr = 0.011), left and right precentral region (puncorr < 0.010, each). In the Aβ-positive subgroup, only one cluster in the left cerebellum showed a correlation to the z scores of the visuospatial abilities domain (puncorr = 0.019). Furthermore, in the MCI subgroup, the z scores of the visuospatial abilities domain were positively correlated with the SUVRs of right temporal lobe (superior gyrus: pFWE - corr = 0.040, middle gyrus: puncorr = 0.012).
Correlations between z scores of the word list memory test (immediate memory) and SUVRs were detected in the left precentral region (puncorr = 0.037) which was reproducible in the Aβ-negative subgroup (pFWE - corr = 0.002). In this subgroup, a further cluster in the right inferior parietal gyrus was correlated with the z scores of the word list memory test (puncorr = 0.029). In the dementia subgroup, a cluster in in the left inferior occipital gyrus was correlated with immediate memory scores (puncorr = 0.016).
For the episodic memory domain, the exploratory SPM analysis did, likewise, not show any significantly correlated clusters in the entire study cohort. Only at peak level, a small correlating cluster in the left calcarine region and left fusiform gyrus was detected (Fig. 1D, Table 5). In the Aβ-negative subgroup, a small cluster in the left precentral gyrus was correlated in its early after tracer administration SUVRs with the episodic memory domain (puncorr = 0.016).
DISCUSSION
As far as we know, our study is the first study which investigated the association between early after amyloid tracer administration PET data and performance in neurocognitive tests assessed by the CERAD battery. We compared our data with published results of [18F]FDG PET studies to provide evidence for a similar association which would support the concept of early Aβ PET images as potential surrogate for [18F]FDG PET images as neuronal injury biomarker. In our study cohort, z scores of the language domain were significantly correlated with early after administration [11C]PiB PET deficits in the left-sided parieto-temporal and precentral cortex. In 1985, Haxby et al. [21] reported a positive association between left hemisphere cerebral glucose metabolism rate and language function. Welsh et al. [14] reported a strong relationship between verbal fluency test scores and left frontal as well as parietal glucose consumption. Teipel et al. [13] found a correlation between language subtest z scores and left temporo-parietal as well as left prefrontal glucose metabolism, just as Schönknecht et al. [12] who reported additionally smaller clusters in the right middle and medial frontal as well as the anterior cingulate gyrus. The reduction patterns of the early after administration [11C]PiB PET scans as identified for this cognitive domain in this present study were very similar to what has been reported in the literature for [18F]FDG PET.
In our cohort, executive function was determined by the letter fluency test. Early after administration [11C]PiB PET deficits in the bilateral occipital and left temporal cortices were correlated with the test scores and in the Aβ-positive subgroup also the posterior cingulate cortices. In the literature we only found one report that investigated the correlation between glucose metabolism and letter fluency scores in AD. This study demonstrated correlating clusters in the middle frontal gyrus as well as the temporo-parietal-occipital areas, suggesting that verbal fluency relies on a large distributed network [22]. This assumption is supported by Woo et al. [15] who did not test letter fluency, but verbal similarities using Wechsler Adult Intelligence Scale Similarities subtest and Conceptualization subscale of the Mattis Dementia Rating Scale. The test data of these subtests were mainly correlated with glucose metabolism in clusters in the frontal, parietal, and left temporal lobe but after correction for global cognitive impairment also with clusters in the occipital lobe bilateral. Comparing our SPM results with those of Bracco et al. [22] and Woo et al. [15], similarities of the correlation patterns are evident.
In our study, the visuospatial ability scores were correlated with the early after administration [11C]PiB PET uptake in the parietal cortex bilateral (right pronounced) and precentral gyrus bilateral as well as with the left inferior occipital gyrus. In two [18F]FDG PET studies, CERAD drawing test scores were correlated with glucose consumption in clusters of parietal and temporal cortex bilateral, right precentral and left middle frontal gyrus [10, 11]. In another study, this was the case with clusters in the left inferior parietal lobule and left inferior frontal gyrus [13]. Studies of patients with focal cerebral lesions suggest an association between visuospatial abilities and right parietal [23], to a lesser extent also with the left parietal function [24], thus the reduction pattern of the [18F]FDG PET studies and our findings overlap.
Surprisingly, for the episodic memory scores, the voxel-based analysis did not show any significantly correlated clusters in our study. However, at peak level a small cluster in the left calcarine region and left fusiform gyrus were detected and, at subtest level, further clusters were detected in the left superior and middle temporal gyrus. The VOI-based analysis revealed only at subtest level a weak correlation between Word list recall performance and left parietal cortex. Teipel et al. [13] demonstrated correlations between Word list recall scores and left temporal and left prefrontal metabolism in a voxel-based analysis, while associations in the region-of-interest (ROI) based analysis did not reach significance, and while recognition scores were correlated with left temporal FDG uptake [13]. Thus, the correlation clusters published in the above-cited literature show a slight overlap with our detected clusters. In the visual evaluation performed by Welsh et al. [14], saving figures test scores and FDG uptake in the left temporal gyrus revealed a correlation coefficient of r = 0.35 with a significance level of p = 0.02. In contrast, Schönknecht et al. [12] reported correlations between word list recall or recognition test scores and right frontal lobe, right fusiform gyrus, and right striatum metabolism. Explanations for the missing correlation between episodic memory domain scores and regional early after tracer administration PiB uptake might be that the test performance especially in the word list recognition subtest (z score = –0.310±1.138) was only slightly impaired in our as compared to other study groups (e.g., Schönknecht et al. [12] z score = –3.4±4.0; Schönknecht et al. [11] z score = –2.4±3.0). According to the appropriate use criteria [16, 17] in our routine clinical setting Aβ PET imaging is mainly performed in cases with clinical atypical AD courses. This might (partially) explain why the test data of our study cohort in some subtests were less impaired than expected for AD and in other subtests vice-versa. Another explanation might be that even a mild reduction of perfusion/metabolism in the prefrontal regions lead to impaired test scores, thus, smaller sample sizes might not be able to detect the correlation. Furthermore, Aβ plaques might interfere with the early after administration [11C]PiB uptake. The highest concentration of AD-related Aβ plaques is usually found in the prefrontal regions. An early after administration plaque-binding of the radiotracer might decrease the sensitivity of the perfusion image in these regions. However, also in our Aβ-negative subgroup episodic memory scores were not correlated with early after administration [11C]PiB uptake in (pre-) frontal regions. More work in larger cohorts is necessary to clarify this issue.
The voxel-based analysis revealed a correlation between total score of word list memory and deficits in the early after administration [11C]PiB data in the left mesial superior frontal gyrus and left precentral region. Similar to these results, Teipel et al. [13] reported a correlation between total score of word list memory and brain glucose consumption in the left medial frontal lobe. They found additional correlations with the left temporal cortex in the ROI-based analysis [13]. Schönknecht et al. [12] reported correlations between the total scores of word list memory and bilateral middle temporal gyrus as well as bilateral precuneus and right cingulate gyrus glucose metabolism. Our VOI-based analysis and the voxel-based analysis at lower significance level revealed similar additionally correlations in the bilateral parietal cortex, and clusters in the right superior temporal gyrus, the bilateral frontal cortices as well as in the bilateral occipital cortices.
As limitations of this study, the retrospective and exploratory character and the limited sample size, needs to be mentioned. Also, the PET data were acquired at two different PET systems. For the hybrid PET/MRI system used, the standard vendor-provided MR-based attenuation correction using the DIXON-based approach was applied. As this approach ignores bone, it leads— on a quantitative scale— to a non-uniform underestimation of brain tracer uptake especially in cortical areas [25]. For clinical purposes in Aβ and [18F]FDG PET imaging, however, it was recently shown that standard diagnosis is not affected by this shortcoming [26, 27]. Regardless, it is certainly desirable to optimize MR-based attenuation correction for instance by combined atlas- and segmentation-based approaches [28].
Taking together, brain region-specific correlations between cognitive performance and early after administration [11C]PiB PET data were demonstrated for all cognitive domains. Convincingly, the cognitive domain integrity-related early after administration [11C]PiB uptake deficits resembled, it their brain distribution and severity, to a major degree what is known for [18F]FDG. Acquisition of [11C]PiB PET in a dual-time point manner should increase the diagnostic accuracy by providing information on Aβ pathology as well as neuronal injury and thus act as state and trait marker.
Conclusion
Our study revealed correlations between deficits in different cognitive domains and early after administration [11C]PiB uptake deficits in specific brain regions. These regional correlations were similar to those known for [18F]FDG PET. Thus, our data support the assumption that early after administration [11C]PiB PET data have a potential to serve as neuronal injury biomarker of AD, potentially substituting [18F]FDG. Head-to-head double-tracer studies of larger cohorts are needed to confirm this assumption.
Footnotes
ACKNOWLEDGMENTS
We would like to thank all patients who took part in this trial. Further, we are grateful to the cyclotron, radiochemistry, and PET teams of the University of Leipzig, Department of Nuclear Medicine for their excellent support. The acquisition of the Leipzig PET/MRI system was funded by the German Research Foundation (grant code SA 669/9-1) and co-funded by the German Max Planck Society.