
Abstract
Background:
Cross-sectional studies of quality of life (QOL) of people with young-onset dementia show diverging results.
Objective:
To identify factors associated with QOL in people with young-onset Alzheimer’s (AD) and frontotemporal dementia (FTD) and explore development in QOL over a two-year period, including differences between the two subtypes.
Methods:
A two-year cohort study of 88 community-dwelling people with young-onset AD and FTD recruited from Nordic memory clinics. QOL was assessed using the proxy version of the Quality of Life – Alzheimer’s Disease questionnaire, dementia severity was rated with the Clinical Dementia Rating scale, depressive symptoms by the Cornell Scale for Depression in Dementia, awareness with the Reed anosognosia scale, and needs using the Camberwell Assessment of Needs in the Elderly questionnaire. Factors associated with QOL and development in QOL over time were explored with growth mixture model trajectories and mixed model analyses.
Results:
We identified two groups of people following trajectories with better (n = 35) versus poorer (n = 53) QOL. People with more depressive symptoms at baseline had higher odds of belonging to poorer QOL group, OR 1.2 (CI 1.1; 1.5, p = 0.011). Having Alzheimer’s disease was associated with significantly better QOL (p = 0.047 at baseline, p = 0.009 at T1 and p = 0.033 at T2). Increasing number of unmet needs was significantly associated with poorer QOL at baseline (p = 0.007), but not later in follow-up.
Conclusion:
Early assessment and treatment based on dementia subtype, depression, and individual needs may enhance quality of life in young-onset dementia.
INTRODUCTION
Young-onset dementia (YOD) is a term for dementia with symptom debut before the age of 65. Being diagnosed with dementia at an earlier stage in life compared to late-onset dementia accentuates challenges related to partnership and parenthood, shifting roles and care responsibilities, work and social commitments, financial issues, and future aspirations and planning [1–3]. As there is still no cure for dementia, knowledge of the determinants of quality of life (QOL) becomes an important prerequisite in promoting a good life when living with dementia. Commonly, the families provide substantial support and care for prolonged periods of time [4–6]. Therefore, their health and wellbeing must also be preserved, as the quality of life of the person with dementia and their informal caregivers appear to be inter-related [7–10].
Dementia-related functional impairments may be reflected in poorer quality of life through reduced self-efficacy, self-esteem, independence, and sense of autonomy [11]. However, the comprehensive and highly subjective concept of quality of life encompasses dimensions of physical, emotional, psychosocial, and environmental well-being, posing challenges to objective measurement. Several models and questionnaires have been constructed since Lawton introduced the four-dimension model in 1983 consisting of psychological well-being, perceived quality of life, behavioral competence, and objective environment [12, 13]. Still, no consensus on how to define quality of life has been achieved. People weight various aspects of life differently, and preferences and values may be modified with age, life stage, and diseases [14, 15]. Obtaining a reliable measure of quality of life is further complicated when cognitive impairments affect individuals’ ability to reason or convey their own perception. The frequent use of proxy reports introduces new biases, as studies have shown proxy reports of quality of life to be associated with informant specific factors, such as caregiver burden and depression, and that proxy reports are consistently rated lower than self-reports [16–18].
The diversity of etiologies of young-onset dementia, and the atypical and overlapping symptom presentation between dementia subtypes, complicates the diagnostic work-up [19, 20]. About one-third of individuals with young-onset Alzheimer’s disease (AD) have an atypical symptom presentation suggesting a distinct neuropsychological profile compared to the predominant memory problems in late-onset AD [21, 22]. Such characteristics could affect specific functional abilities important to quality of life. Individuals with frontotemporal dementia (FTD), another major subtype of young-onset dementia, are more likely to have initial presentation of language problems, neuropsychological and behavioral symptoms, leading to prolonged time-to-diagnosis [19], and potentially affecting quality of life differently compared to AD.
Depressive symptoms are prevalent in any stage of dementia [23]. A Norwegian study detected depressive symptoms in almost two-thirds of participants with young-onset dementia [24]. Depression interferes with the symptom presentation of dementia and contributes to prolonged time-to-diagnosis as symptoms are unrecognized or misdiagnosed [20]. Previous studies have found that depressive symptoms are associated with increased functional impairment and healthcare utilization [25], early institutionalization [5], higher morbidity and mortality [26], and may even contribute to faster progression of dementia [27]. Depressive symptoms have consistently been associated with poorer quality of life in people with dementia, but the magnitude of the associations observed is moderate and the proportion of variance explained is low, indicating that depression and quality of life are two different constructs [28].
A 2016 review article on psychosocial measures in young-onset dementia pointed out that quality of life was the psychosocial domain least often measured in dementia [29]. Two recent studies showed that people with young-onset dementia had equally as good or better quality of life compared to people with late-onset dementia [16, 30]. However, the published findings on quality of life have been cross-sectional and no studies have examined predictors of quality of life in people with young-onset dementia in a longitudinal perspective. Thus, the aims of the present two-year follow-up study were to identify groups of people with young-onset dementia following similar trajectories of quality of life and explore factors associated to group belonging, and to assess the overall development in quality of life and factors related to it, as well as differences in quality of life and explanatory factors between participants with young-onset AD and FTD.
MATERIALS AND METHODS
Participants
This was a two-year prospective Nordic cohort study of people with young-onset dementia recruited from memory clinics in Norway, Denmark, and Iceland [31]. All participants were community-dwelling at the time of inclusion. They had a diagnosis of AD defined by the International Classification of Diseases-10th revision criteria [32], or FTD according to the Neary et al. criteria [33], the International consensus criteria for behavioral variant-FTD [34], or the Mesulam criteria [35] for the language variant. The participants were diagnosed at the memory clinics according to regular diagnostic work-up prior to study inclusion. The diagnostic assessment and procedures have previously been shown to be similar among the memory clinics in an international cooperation in the Nordic Network in Dementia Diagnostics [36]. Study participation required informed written consent. A total of 88 participants were recruited, 50 with AD and 38 with FTD, see Fig. 1. They were included in dyads with a family member who provided the informant data.
Data collection
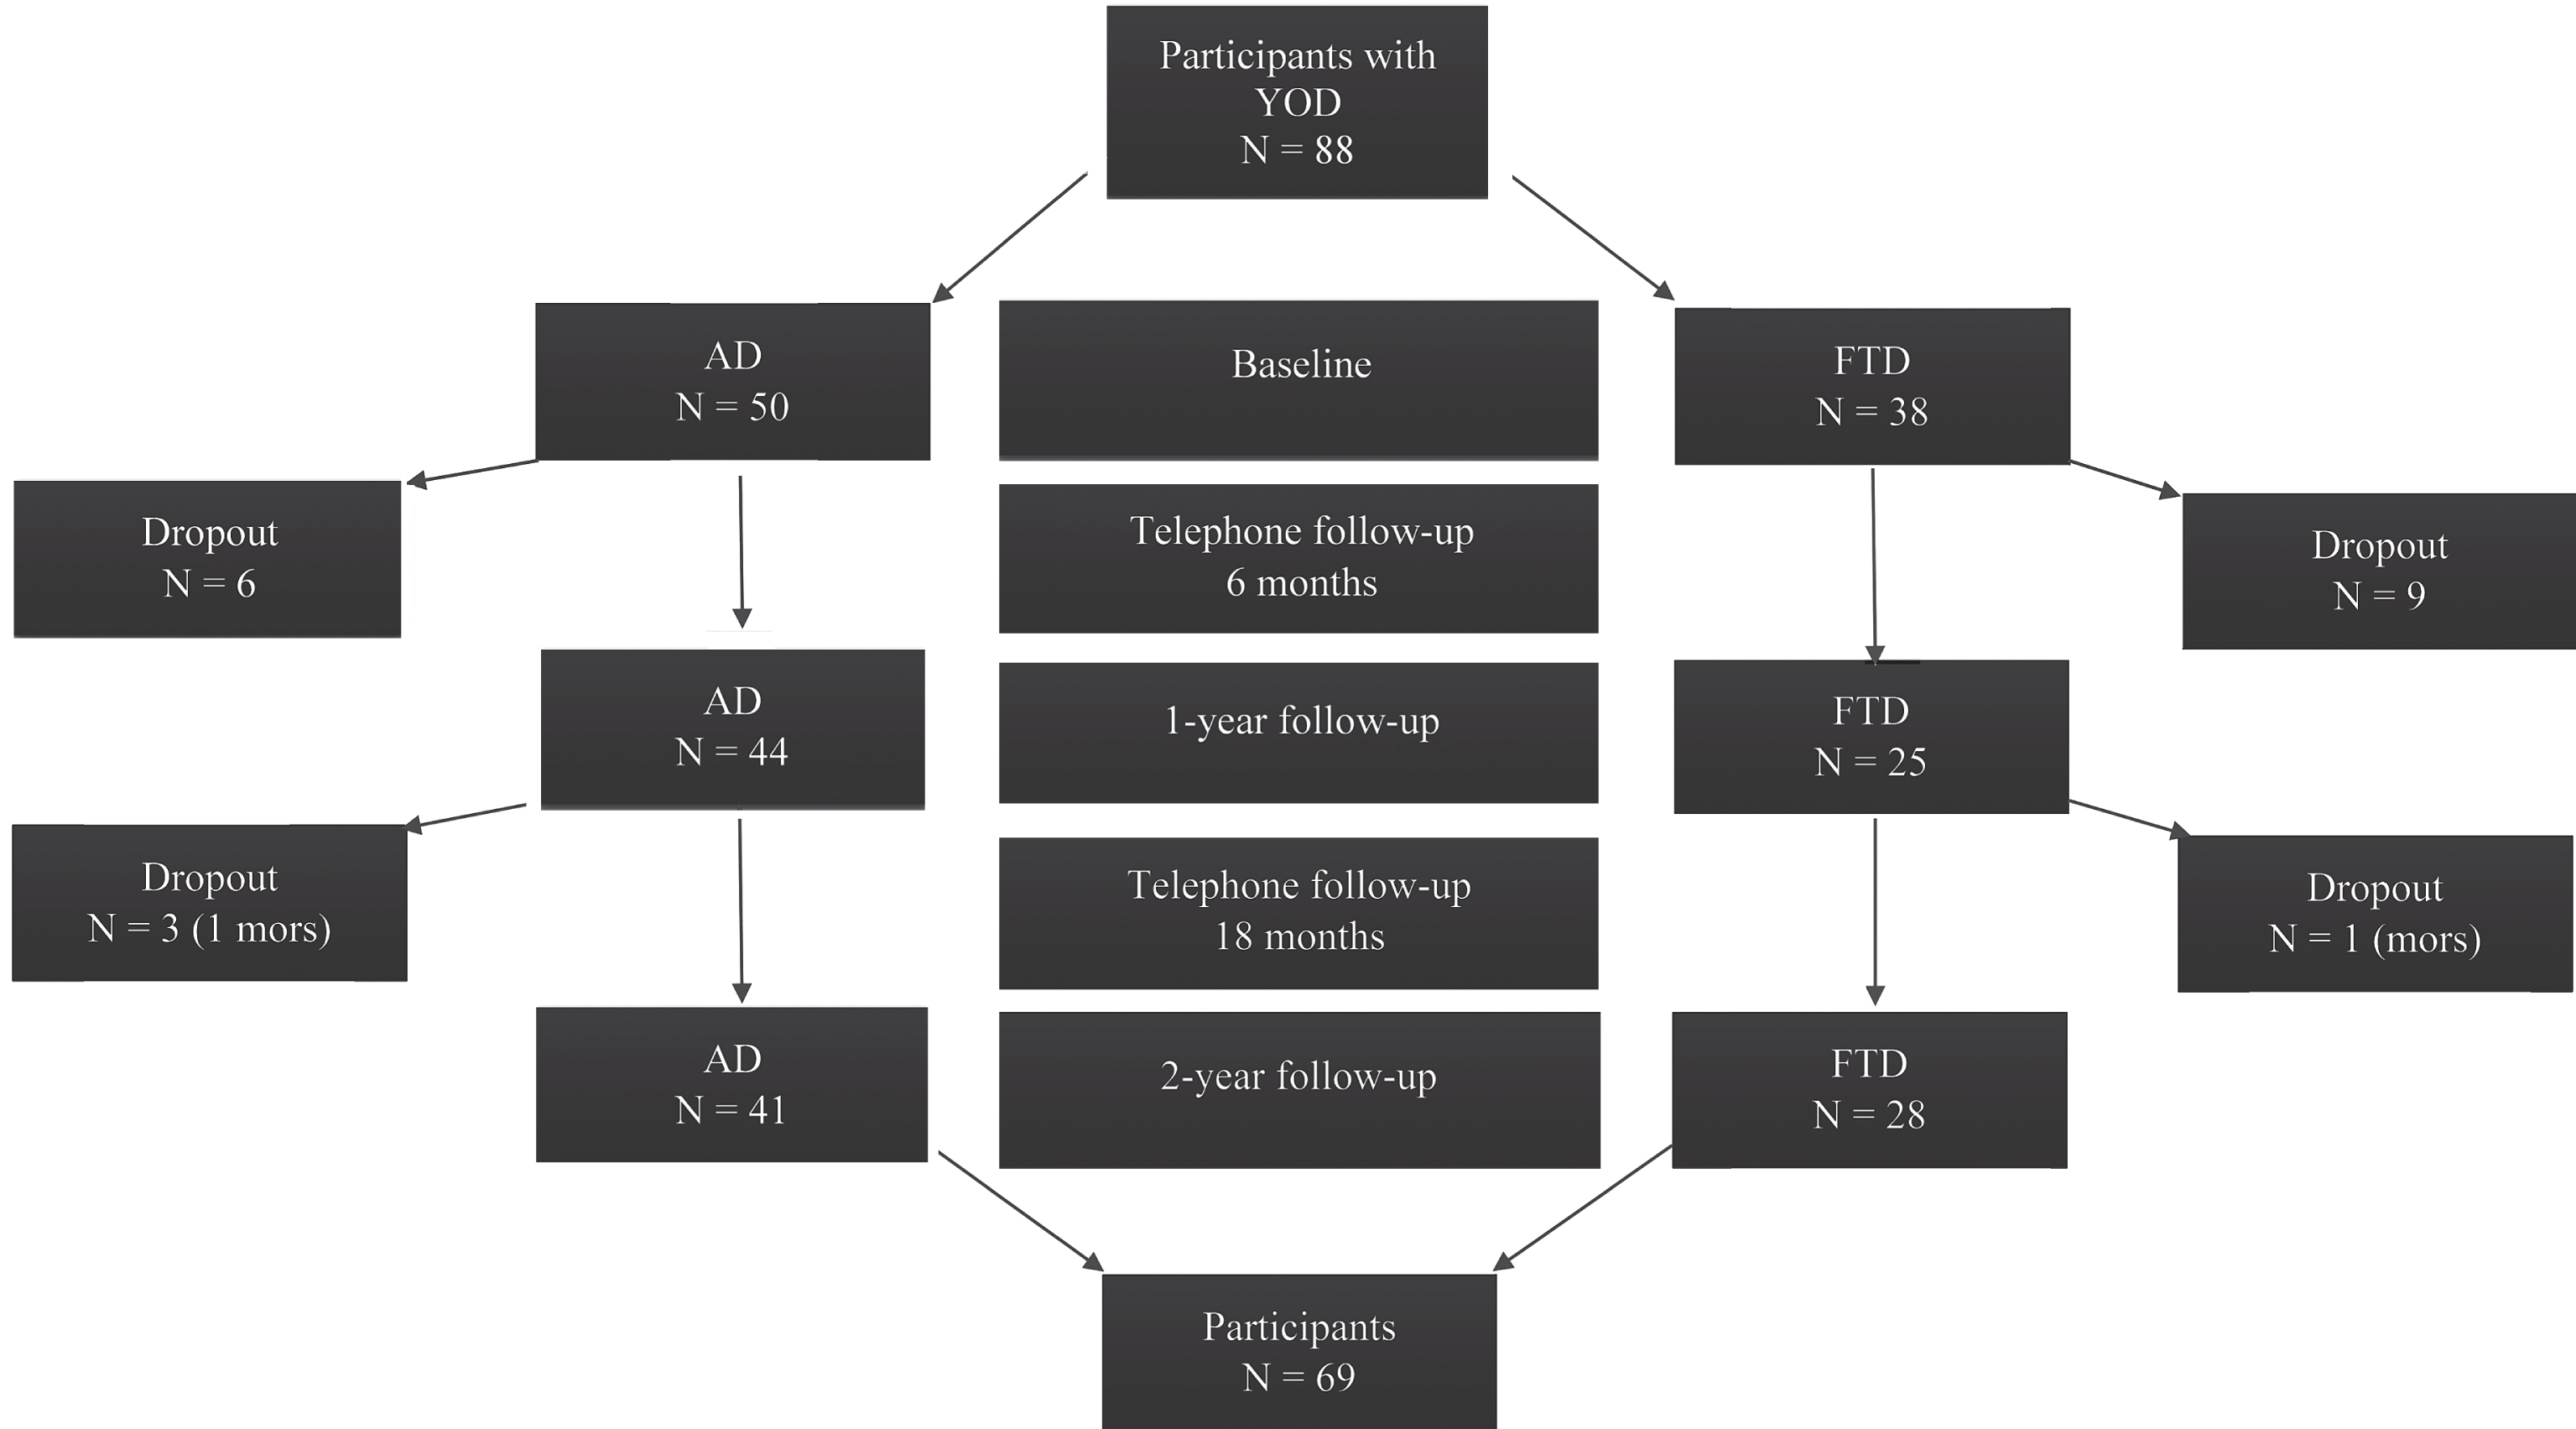
Flow chart of the study participants and assessment time points. N = 88. YOD, young-onset dementia; AD, Alzheimer’s disease; FTD, frontotemporal dementia.
The data were collected from 2014 to 2017 in semi-structured interviews at baseline, and after one and two years, conducted in parallel with the person with dementia and the family member. Telephone follow-ups were made at six and 18 months. Sociodemographic information, medical history and medications were recorded. Comprehensive assessments were made based on the manual of the Norwegian register for persons with cognitive symptoms [37], a collection of standardized and validated questionnaires and scales commonly used in dementia assessment. This standardized manual is incorporated into the diagnostic work-up of all the included memory clinics in Norway.
Assessment scales and questionnaires
Dementia severity was rated with the Clinical Dementia Rating scale (CDR) sum of boxes score for the six scale items, ranging from zero (= no dementia) to 18 (= severe dementia) [38]. The Mini-Mental State Examination [39] was used for cognitive screening, sum score ranging from zero to 30 with higher score indicating better cognitive function. Each Nordic country used their respective translated versions. Depressive symptoms were rated with the Cornell Scale for Depression in Dementia (CSDD) [40], sum score ranging from zero to 38 with higher scores indicating more depressive symptoms. The Reed anosognosia rating scale [41] for awareness deficits graded awareness into four categories; 1 = full awareness, 2 = shallow awareness, 3 = no awareness, and 4 = denies impairment.
The twelve item Neuropsychiatric Inventory Questionnaire (NPI-Q) [42] was used for rating of neuropsychiatric symptoms; the screening of symptoms in each domain was followed by a 3-point rating for severity; 1 = mild, 2 = moderate and 3 = severe. A severity score for each domain was summarized into a total NPI score, ranging from zero to 36 with increasing symptom severity. Activities of daily living (ADL) were assessed using the Lawton and Brody’s Instrumental Activities of Daily Living scale, comprising eight items with a sum score ranging from eight to 31 with increasing impairment [43], and the Physical Self-Maintenance Scale, comprising six items with a sum score ranging from 6 (no impairment) to 30 (total impairment). A total ADL score was summarized from these sum scores, ranging from 14 to 61 points with higher scores indicating greater functional impairment.
Needs were explored using the Camberwell Assessment of Needs in the Elderly [44]. This 24-item questionnaire covers possible problem areas in everyday life, psychosocial functioning, informal/formal help needed and received, and met and unmet needs. The need for help was scored 0 = no need, 1 = met need, and 2 = unmet need, and the total number of needs was summarized. The participants and the family members rated these items independently.
The proxy version of the Quality of Life – Alzheimer’s Disease scale (QOL–AD) [45] was used to assess quality of life by the family member applying the “proxy-participant perspective” [46]; i.e, report how the person with dementia would rate their own quality of life on 13 items; physical health, energy, mood, living situation, memory, family, marriage, friends, self as a whole, ability to do chores around the house, ability to do things for fun, money, and life as a whole. The items were rated on a 4-point scale from poor to excellent, with a total score ranging from 13 to 52, higher score indicating better quality of life.
All measurements were performed at baseline and at one- and two-year follow-up.
Statistical analyses
The analyses were performed using the SPSS v 24, SAS v 9.4 and STATA v 14. Distribution of variables was examined using histograms. Categorical variables are described by their counts and proportions. Continuous variables are represented by their mean values and standard deviations (SD). Two-sided independent samples t-test was used for comparison of continuous variables, and χ2-test for categorical variables. Significance level was set at 5%.
Missing values were imputed using the Replace-Missing-Values method if less than 15% of items on a scale were missing and replaced with each participant’s own total scale median. Missing values in the Cornell Scale for Depression in Dementia due to “not possible to evaluate”, which was ticked off by almost one in five informants (19%), were set to zero under the assumption that symptoms/signs that were not obvious to the family member were most likely absent. In cases where symptoms in the Neuropsychiatric Inventory Questionnaire were ticked off as “present” but the severity level was not denoted, the severity was graded as moderate. Some variables with many missing values had to be excluded from the regression analyses due to sample size considerations.
Linear mixed model with time as fixed effect and random effects for people nested within study center was estimated to assess the development in clinical characteristics. p-values for change from baseline to one- and two-year follow-up were presented along with descriptive statistics.
Growth mixture model was estimated to assess groups of people each following distinct trajectories of QOL–AD throughout the study period. The Akaike Information Criterion (AIC) was used to determine the optimal number of groups. In addition, average within-group probabilities were expected to be larger than 0.7, and 95% confidence intervals (CI) for each trajectory non-overlapping. The identified groups were then described by bivariate and multiple regression models with group membership as dependent variable and selected baseline covariates as explanatory variables.
Linear mixed model was estimated to explore overall time trend in QOL–AD throughout the study period. The model included random effects for study center and people nested within center. Random effects for time were considered in the analysis, but not included, as the model fit did not improve. Fixed effects for selected covariates were included into bivariate and multiple analyses. Interactions between each covariate and diagnosis (AD or FTD) were entered in to the model to assess differences between the diagnostic groups. Also, interactions between each covariate and time were included.
Both multiple models were reduced by applying the Akaike Information Criterion. The covariates were selected based on previous research and inter-covariate correlation analysis. The same set of covariates was entered in to both regression models. Due to strong correlations between several of the variables explored for the regression analyses, a selection was made based on correlation analyses. The initial 26 socio-demographic and clinical covariates assessed were reduced to nine covariates correlating weakly or moderately with an inter-correlation coefficient below r = 0.5 (diagnosis, sex, age, education, Clinical Dementia Rating scale, awareness, Cornell Scale for Depression in Dementia, number of medications, and self-reported unmet needs).
RESULTS
Of the 88 participants included, 69 (78%) completed the two-year follow-up, (see Fig. 1). Two dropouts were due to deceased participants, sixteen were lost to follow-up due to the total strain on the families, the family member reporting the participant too cognitively impaired for any structured assessments, or other non-specified reasons. Only four female participants (10% of all included women) were lost to follow-up whereas fifteen males (30% of all included men) discontinued. There were no significant differences at baseline between the participants who completed the follow-up and those who dropped out in age (participant mean age 63 (SD 4.6) versus dropout 63 (SD 5.3), p = 0.67) education (mean years 13 (SD 3.3) versus 12 (SD 3.3), p = 0.13), diagnosis (dropout ratio with AD 9/41 versus FTD 10/28, Fisher’s Exact p = 0.44), dementia severity (CDR-SB mean 5 (SD 3.6) versus 4 (SD 2.5, p = 0.29), depressive symptoms (CSDD mean 7 (SD 4.8) versus 8 (SD 7.8), p = 0.35) or QOL–AD scale scores (mean 37 (SD 6.1) versus 35 (SD 8.3), p = 0.57).
During the two-year follow-up there was progression in dementia severity, functional impairments, awareness deficits, and cognitive decline, as well as an increased number of met needs, see Table 1. The main changes all occurred within the first year of follow-up.
Descriptive data at baseline, one- and two-year follow-up. Means (standard deviations) are given for all continuous variables. p-values were calculated by estimating the linear mixed model and reported for change from baseline to one-year and from baseline to two-year follow-up (latter not denoted if identical) for YOD combined
AD, Alzheimer’s disease; FTD, frontotemporal dementia; MMSE, Mini Mental State Examination; CDR, Clinical Dementia Rating scale; CSDD, Cornell Scale for Depression in Dementia; NPI, Neuropsychiatric Inventory Questionnaire; ADL, The Physical Self-Maintenance Scale and Lawton Activities of Daily Living scale total score; QOL–AD, Quality of Life – Alzheimer’s Disease scale. aSelf-reported needs assessed for participants living at home.
The trajectories of QOL–AD
The results from the growth mixture analysis are shown in (Fig. 2). Two groups following distinct trajectories in QOL–AD, were identified. The average probabilities were high in both groups (0.92 and 0.95, respectively) with non-overlapping confidence intervals clearly indicating two distinct, homogeneous groups of participants. The “better QOL” group (35 participants) displayed a linear slope and the “poorer QOL” group (53 participants) a non-linear slope. The better QOL group had significantly higher QOL–AD scores at baseline compared to the poorer QOL group, and this trend persisted throughout the follow-up period, with both groups showing significant decline in QOL–AD scores with time. The parameter estimates for two trajectories with corresponding standard errors and p-values and descriptive statistics in the QOL groups are shown in Table 2.
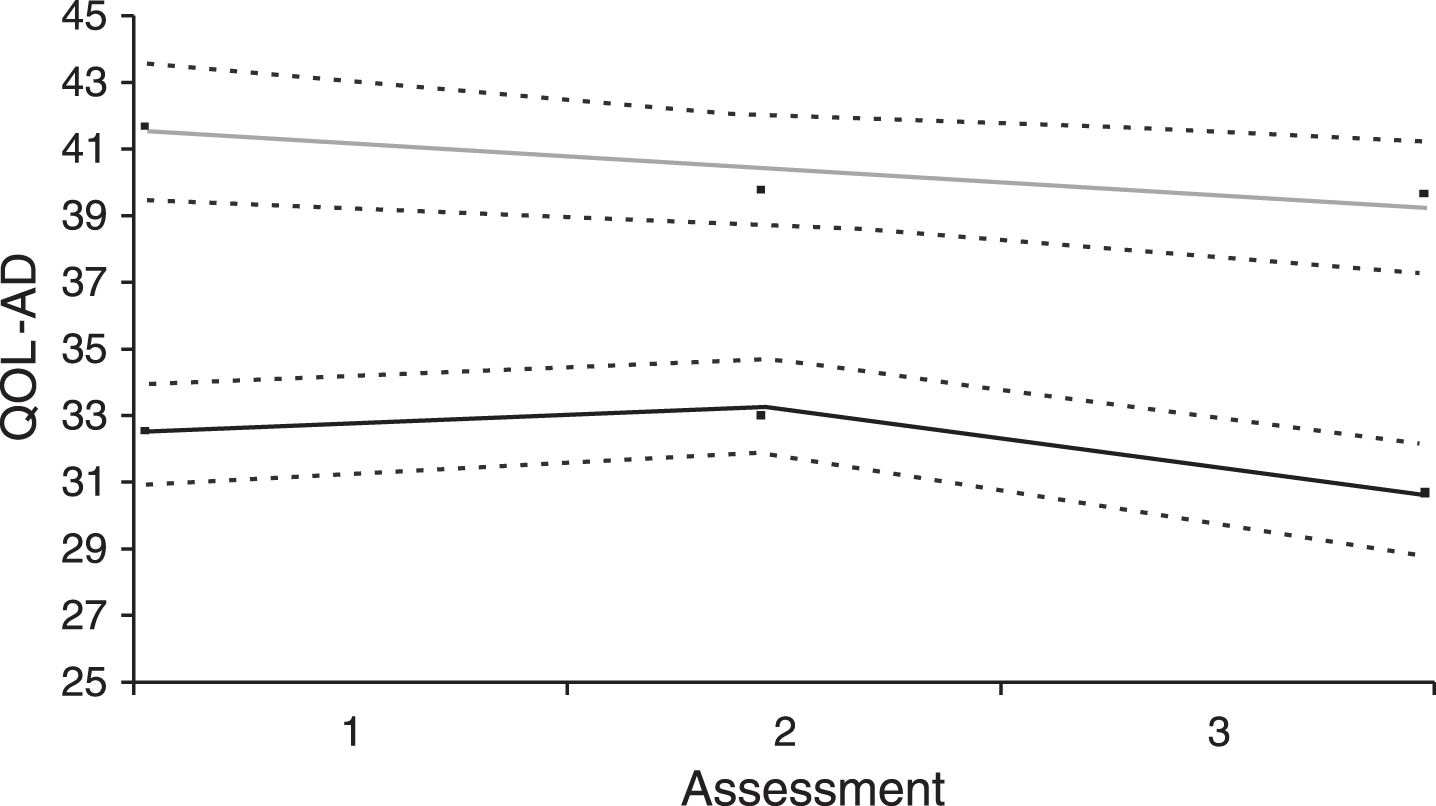
Two groups of participants with “poorer QOL” (lower line) versus “better QOL” (upper line) identified from the growth mixture model. QOL–AD, Quality of Life – Alzheimer’s Disease. Assessment 1, baseline; assessment 2, One year; and assessment 3, Two years.
Baseline characteristics of the two groups of people with “poorer” and “better” QOL, n = 88. Means (standard deviations) are given for all continuous variables
CDR, Clinical Dementia Rating scale; CSDD, Cornell Scale for Depression in Dementia; QOL, Quality of Life; AD, Alzheimer’s disease; FTD, frontotemporal dementia.
The results from the logistic regression analysis with QOL–AD group membership as the dependent variable are described in Table 3. According to bivariate analyses, the odds of belonging to the poorer QOL group were greater among participants with higher scores on the Clinical Dementia Rating scale (p = 0.009) and the Cornell Scale for Depression in Dementia (p = 0.002), and more self-reported unmet needs (p = 0.037). The same three independent variables were retained in the multiple model reduced by Akaike’s Information Criterion; however, the Cornell Scale for Depression in Dementia was the only significant predictor for belonging to the poorer QOL group, OR 1.2 (CI 1.1; 1.5, p = 0.011).
Variables associated with poorer QOL group in a logistic regression model (the better QOL group as reference), n = 69
CDR, Clinical Dementia Rating scale; CSDD, Cornell Scale for Depression in Dementia; QOL, Quality of Life; AD, Alzheimer’s disease. Reference categories set to frontotemporal dementia, female and impaired awareness.
Overall time trend in QOL–AD and covariates associated with trend
The results of the linear mixed model are shown in Table 4. A total of 118 observations were included across three time points after exclusion of dropouts and participants with missing data on at least one covariate. In the combined data from all participants we found no significant changes in overall QOL–AD scores during the two-year period.
Variables associated with QOL–AD time trend, results of the linear mixed model, n = 118
AD, Alzheimer’s disease; CDR, Clinical Dementia Rating scale; CSDD, Cornell Scale for Depression in Dementia. Reference categories set to frontotemporal dementia, female and impaired awareness.
In bivariate analyses, higher scores on the Cornell Scale for Depression in Dementia were significantly associated with lower QOL–AD scores at baseline (p = 0.004) but not at later time points, and the association remained stable over time. More unmet needs were also significantly associated with lower QOL–AD scores at baseline (p = 0.011). However, this association was unstable over time showing significantly different trend from baseline to two years (p = 0.025) where QOL increased more with increasing number of unmet needs while remaining nearly stable among those with no unmet needs. There was no significant difference between males and females regarding QOL–AD in the bivariate model, but males had significantly greater reduction in QOL–AD scores compared to females at two-year follow-up (p = 0.009).
In the multiple AIC-reduced model, increasing number of unmet needs was associated with lower QOL–AD, with association being significant only at baseline (p = 0.007). As in the bivariate model, there was no significant difference in overall QOL–AD time trend between sexes; however, females had greater increase in QOL–AD scores from baseline to two-year follow-up compared to males (p = 0.006). Reduction in QOL-AD from baseline to one year was significantly greater with increasing age (p = 0.018), but the overall effect of age on QOL–AD time trend was non-significant. Participants with AD had significantly higher QOL–AD scores at all time points compared to FTD (p = 0.047 at baseline, p = 0.009 at one year and p = 0.033 at two years) with significant differences between diagnoses in change from baseline to 1 year (p = 0.034), but not two years. Although not significant, most interactions with diagnosis were retained in the AIC-reduced model.
DISCUSSION
To the best of our knowledge, this is the first study to assess quality of life in people with young-onset dementia in a longitudinal perspective.
The trajectories of QOL–AD
We identified two groups of people following distinctly different, homogeneous trajectories of quality of life in a two-year follow-up study. When adjusting for group differences at baseline, including dementia severity and unmet needs, the only significant predictor separating these two groups was severity of depressive symptoms. For each unit increase in depressive symptoms on the Cornell Scale for Depression in Dementia, the odds of belonging to the poorer QOL group increased by 20%. More depressive symptoms at baseline predicted poorer quality of life both at baseline and throughout the two-year follow-up. Our results regarding the significance of depression to quality of life are in line with the existing knowledge of predictors of quality of life in dementia in general and studies of young-onset dementia [7, 47–49].
To optimize quality of life for people with young-onset dementia, routine assessment to diagnose dementia subtype and co-existing depression is important for appropriate choices in pharmacological and psychosocial interventions, including support services and psychoeducation for people with dementia and their families. Although the efficacy of pharmacological treatment of depression in dementia is uncertain [50, 51], a multidisciplinary approach combining appropriate pharmacological treatment with psychosocial intervention including the opportunity to engage in meaningful daytime activities, may have positive impact on mood and several domains important to quality of life [52, 53]. As depression in persons with dementia may also be associated with poorer quality of life in their family members, the main providers of informal care, ameliorating depressive symptoms may benefit the whole family. Optimizing quality of life within the family may therefore prolong the opportunity to live at home— the residency of personal preference, and the most cost-effective placement in a socio-economic perspective [54–56].
Overall time trend in QOL–AD and covariates associated with trend
The longitudinal study design allowed exploration of QOL–AD trend and associated covariates measured simultaneously over the two-year period. We found no significant change in overall quality of life from baseline to one- and two-year follow-up, which contradicts the results of significant change within two groups of people described above. The likely explanation for this discrepancy is a high degree of homogeneity within each of the two groups and a large difference between the groups of people following the two distinct trajectories. Due to a markedly increased heterogeneity in the data set assessed as a whole, no detectable overall trend was found. Considerable variation in QOL–AD scores has also been reported in a recent study assessing carers’ perspectives on quality of life in people with young- and late-onset AD [16]. Family members usually tend to report poorer quality of life as dementia progresses while self-reports of QoL are more stable, as people with dementia seem to put less emphasis on deterioration of cognitive and functional impairments when evaluating their own quality of life [28, 57–61]. Assuming the result of the time trend analyses showing no significant change was correct, our results could indicate that family members in the present study did adhere to the principle of adopting the individual’s own perspective, and/or that the dyads shared rather similar perceptions. Another explanation could be loss to follow-up of those with greatest deterioration in quality of life over time, although there were no significant differences at baseline.
An additionally contrasting result from the linear mixed model for overall time trend compared to the logistic regression analysis of the two QOL groups was the identification of diagnosis as a predictor of quality of life. Persons with FTD had significantly poorer quality of life at all time points compared to persons with AD, but diagnosis was not identified as a significant predictor of belonging to the poorer QOL group. The most plausible explanation to this divergence is the use of different statistical methods and groupings of data. In the linear mixed model, diagnosis and QOL–AD were measured simultaneously at three time points; whereas in the logistic regression model the association between group belonging (better or poorer QOL), and the diagnosis measured at baseline was assessed. Since different statistical methods produced diverging results, the association between diagnosis and quality of life should be interpreted with caution, as also suggested by borderline significance for diagnosis in the linear mixed model. Nevertheless, the retaining of non-significant interactions between diagnosis and several other variables in the multiple model (except for age and depressive symptoms) indicates several possible pathways by which diagnosis may affect quality of life. The inclusion of interaction terms with diagnosis and time were required to determine the effects of diagnosis and variables associated with time trend. However, the total number of variables related to sample size may have caused type II errors, e.g., failure to identify significant interactions differentiating between the people with FTD and AD.
Few studies have assessed predictors of quality of life in people with young-onset dementia, and they have shown diverging results. Research on older people with dementia has not identified diagnostic subtype as a significant determinant to quality of life [62], which is supported by a recent Dutch study of nursing home residents with young-onset dementia [47], but differences in, e.g., etiology, disease severity, and prevalence of neuropsychiatric symptoms between nursing home residents and community-dwelling people with young-onset dementia make interpretations across study populations difficult [63]. In a larger European multicenter study in which the baseline data from the present study was included no significant difference in quality of life between community-dwelling people with AD and FTD was found, but diagnosis was retained in the final predictive model for contributing explanatory power [48]. However, the Dutch and the Nordic study populations differed in their characteristics’ profiles in several aspects, such as dementia severity, severity of neuropsychiatric symptoms, drug use, and unmet needs, which might contribute to different impact on quality of life (unpublished data). As most of the participants in the present study had mild to moderate degree of dementia at study inclusion, a possible explanation for poorer quality of life in people with FTD in this Nordic study population could be related to problems adapting to change, and greater uncertainty and distress within the families in the pre-diagnostic phase [19, 64]. Still, the time-stable observation of poorer quality of life in this subpopulation throughout follow-up indicates that additional factors are involved. Again, the use of proxy QOL–AD may have biased the results as research has shown that behavioral symptoms are more strongly associated with poorer quality of life in informant reports than self-reports [65]. In our analyses, the Neuropsychiatric Inventory scores were omitted due to high correlations with the Cornell Scale for Depression in Dementia in the absence of predominant symptom clusters [30]. Proxy assessments may have skewed the results further in favor of poorer quality of life for people with FTD, as it is conceivable that they would have rated their own quality of life better compared to people with AD due to reduced awareness of their condition. This was the case in the Need-YD study were participants with FTD scored highest on self-reported QOL–AD of all dementia subtypes, with greatest discrepancy compared to proxy reports [7]. Apart from a handful of studies the perceived quality of life of people with FTD remains unexplored.
Depressive symptoms were significantly associated with poorer quality of life in bivariate analysis in the linear mixed model. In the multiple model, depression still showed a negative and time-stable association with quality of life, however non-significant. The lack of significance might be explained by underestimating depression when scoring the alternative “not possible to evaluate” in the Cornell scale for Depression in Dementia to zero, and too low statistical power in the final model.
Previous research in late-onset dementia has consistently shown unmet needs to be associated with poorer quality of life [61, 67]. The Need-YD study did not reach the same conclusion, possibly for using proxy reports for unmet needs due to discrepancies between informant and self-reports on prevalence and distribution of (un)met needs. The present study, based on self-reported needs, found increasing unmet needs to be associated with poorer quality of life. Additionally, unmet needs were found to have negative impact on quality of life throughout the two-year period for people with AD and FTD alike. Bakker et al. found that although the dyads reported lower proportions of unmet to met needs during follow-up, there was a strong association between unmet needs and the level of neuropsychiatric symptoms over time, suggesting that unmet care needs and physical and psychological distress were expressed in adverse behavioral symptoms, and that unmet needs had negative influence on the course of symptoms [68]. As neuropsychiatric symptoms are particularly distressful for the carer, a vicious circle could easily develop with greater burden experienced by the family member, use of less appropriate coping strategies, communication failure, dyadic relational strain, and less tolerance for adverse behavior affecting the quality of care provided, possibly resulting in more unmet needs within the dyads and escalation of behavioral problems [69–71]. This underscores the importance of assessing specific needs in providing optimal, individualized care in young-onset dementia [7, 47]. The neuropsychiatric and behavioral disturbances characteristic of FTD can make available services, such as daytime activities and psychosocial intervention, ineffective or inappropriate. Premature institutionalization may result due to chronic distress and fatigue in the families in lack of respite.
Strengths and limitations
The present study contributes new knowledge in an emerging research field in young-onset dementia. Participants were recruited from three Nordic countries, representing slightly different healthcare service models and organizations, but applying the same diagnostic work-up. The study population was relatively homogenous and representative of community-dwelling people with young-onset AD and FTD. However, the exclusion of other dementias with additional problems, e.g., alcohol related dementia, HIV, and Huntington’s disease, could bias the results in favor of overestimating quality of life, hence limiting the generalizability of our results. Individuals who declined participation or were lost to follow-up likely represent a subgroup with poorer quality of life, as individuals who partake in studies are often resourceful, and the total strain on the participant/families was a frequent reason for dropout.
Although the present study instructed family members to apply the perspectives of the individual with dementia, it is not possible to eliminate proxy biases due to informant and relationship-related characteristics. These are important sources of bias likely to have contributed to underestimation of the subjective quality of life and overestimation of deterioration over time. Requiring a family member as informant may have excluded a vulnerable group of individuals without a supportive network. Also, non-native minority groups with need for an interpreter were excluded, limiting the knowledge about additional cultural barriers.
Conclusion
In this Nordic two-year follow-up study, we identified two groups of people following trajectories of better versus poorer quality of life, with more depressive symptoms at baseline predicting poorer quality of life. In the longitudinal perspective, being diagnosed with FTD and/or having unmet needs negatively impacted on development in quality of life. Timely diagnosis, treatment for depressive symptoms, and early and comprehensive needs assessments may enhance people’s opportunities in living well with young-onset dementia.
Footnotes
ACKNOWLEDGMENTS
Special thanks to all the study participants and their family members for their time and effort. This work was supported by the Norwegian Research Council (2913/2141/REK nord), the Old Age Psychiatry Research Network, Telemark Hospital Trust and Vestfold Trust, and the Norwegian National Advisory Unit on Ageing and Health, Vestfold Hospital Trust.