
Abstract
Measures of amyloid-β (Aβ) and phosphorylated tau (p-tau) concentrations in cerebrospinal fluid are extensively used for diagnostic and research purposes in Alzheimer’s disease (AD) as correlates of cortical thinning and cognitive outcomes. The present study investigated the relationship of Aβ and p-tau with hippocampal subfield volumes Cornu Ammonis (CA) 1–4, dentate gyrus (DG), and subiculum. Subfields were segmented from T1-weighted images from the ADNI-population using FreeSurfer v6. Linear and polynomial regression models revealed distinct associations of Aβ and p-tau with subfield volumes. Aβ had a quadratic relationship with all hippocampal subfield volumes and the inflection point was higher than the validated cut-off for Aβ. For p-tau the relationships were linear, except for CA3, in which it was quadratic. For the CA1 and CA3, these quadratic relationships with Aβ were only observed when p-tau was low. Amyloid and p-tau contributed equally to the explained variance in CA4 and DG volume. Subicular volume was best explained by Aβ alone. These biomarker relationships with hippocampal subfield volumes seem to mirror the hippocampal-specific topography of Aβ and tau reported in neuropathological staging models. In addition, using continuous values of Aβ reveals positive patterns with imaging markers for individuals around the positivity threshold that would be masked when using dichotomized biomarker groups, which can be important for early detection and accurate inclusion of potential participants at risk for AD in clinical trials.
INTRODUCTION
Alzheimer’s disease (AD), the most prevalent form of dementia [1], is characterized by two neuropathological hallmarks, the accumulation of amyloid-β (Aβ) deposits and neurofibrillary tau tangles [2], which ultimately lead to neuronal atrophy and cognitive decline.
Accumulation of Aβ has been associated with cortical thinning in healthy older adults and patients with mild cognitive impairment (MCI) and dementia of AD-type [3–5], although other studies reported higher levels of cortical thickness with greater Aβ deposition [6, 7]. These inconsistencies may be resulting from potential nonlinear relationships between Aβ and cortical thickness. In line with this notion, Fortea and colleagues observed a non-linear association between Aβ and thickness in various regions across the cortical mantle, especially for Aβ values surrounding the cut-off values for Aβ-positivity [8]. This suggests that dichotomizing Aβ when investigating associations with brain structure may conceal important patterns, especially in individuals surrounding the threshold and who are thus more likely to convert to prodromal AD over time [9]. Interestingly, in a follow-up study, Fortea and colleagues [10] showed that cortical thickening in relation to Aβ was observed when cerebrospinal fluid (CSF) p-tau levels were normal, suggesting that increases in Aβ-related cortical thickness reflect ongoing aberrant processes that may be below our detection level. When p-tau levels increase in the presence of Aβ deposits, atrophy sets in, suggesting that both pathologies act independently on the same biological pathological processes. Interestingly, these patterns may be regionally distinct and recent work by d’Oleire Uquillas and colleagues showed negative effects of Aβ PET-deposition on several frontal and tempoparietal regions, but no associations were observed in the medial temporal lobe (MTL) [11].
The MTL is an interesting region as it is the first region accumulating tau pathology [12, 13]. Autopsy studies have shown that low levels of Braak stage I-II tau pathology can occur in the MTL without presence of Aβ deposits [12, 14]. However, around Braak stage III, when tau pathology has progressed to the hippocampus, Aβ is widespread in the brain in the majority of the individuals [15]. These individuals without any cognitive deficits, are considered to be in the preclinical phase of AD. Notably, pathology in the hippocampus has a very specific topography, with tau pathology affecting the Cornu Ammonis 1 (CA1) and dentate gyrus (DG) and Aβ affecting the CA1, subiculum and presubiculum prior to the other subfields [2, 16].
In vivo MRI studies have shown that higher CSF p-tau levels or elevated Aβ–PET binding correlated with lower overall hippocampal volume in patients along the AD continuum [17, 18]. With respect to hippocampal subfield volumes, patients with mild cognitive impairment (MCI) showed lower CA1 volume compared to healthy controls, but this volume difference did not correlate with Aβ, suggesting that CA1 volume is affected by non-specific ageing-related neurodegeneration [19]. In preclinical and prodromal AD, reduced subiculum volume has been linked to abnormal Aβ [20, 21], but there is evidence suggesting that Aβ is not sufficient and that abnormal tau is also necessary for subfield atrophy [21]. Additive effects of Aβ and tau have also been shown for total hippocampus volume in a sample consisting of cognitively normal individuals, MCI and AD patients [22].
Given the previous findings of curvilinear associations between Aβ and thickness in cortical regions as well as the distinct temporal and spatial biomarker patterns in the hippocampal subfields, we set out to investigate whether the relationship between Aβ or p-tau can be described in a linear or curvilinear manner for specific hippocampal subfield volumes. In addition, we aimed to investigate whether Aβ and tau contribute additively or synergistically to distinct hippocampal subfield volumes.
Understanding the relationship between hippocampal subfield volume and AD biomarkers is important, as the hippocampus is considered to be a vital structure for the transition to prodromal AD. In addition, studies investigating pharmacological interventions for AD often base inclusion criteria on biomarker information including hippocampal volume. Therefore, more detailed information on how biomarkers relate to the hippocampus may improve selection of target groups.
METHODS
Data used in this article were obtained from the ADNI database (http://adni.loni.usc.edu). ADNI was launched in 2003, led by Principal Investigator Michael W. Weiner, MD. The main goal of ADNI has been to test whether magnetic resonance imaging, positron emission tomography, other biological markers, and clinical and neuropsychological assessment can be combined to measure the progression of MCI and AD. For up-to-date information, see http://www.adni-info.org.
Participants
Diagnostic procedure, clinical characterization, CSF biomarker and imaging acquisition, and cognitive testing procedures for ADNI are described extensively elsewhere [23]. This study is part of a larger project within the ADNI-database, where we are investigating longitudinal trajectories of biomarkers. For the current study, we report on the cross-sectional data. Inclusion-criteria for this study were presence of CSF-Aβ, CSF-p-tau measures, and structural T1-weighted MR-images.
A subset of the ADNI1-population was chosen for this study, with CSF at baseline and 3T T1-weighted MRI-scans, being the main selection criteria. Only participants with CSF-measures of both Aβ and p-tau were included in the selection. This resulted in a total of 45 cognitively normal (CN), 70 patients with MCI, and 13 patients with AD, following the criteria described in Petersen et al. [23].
Ethics approval and informed consent
ADNI is a multi-site investigation. All ADNI sites obtained Institutional Review Board approval for the use of humans for research from their respective Institutional Review Board within 5 months of receiving the final protocol and all participants provided written informed consent.
CSF analyses
The ADNI procedures and methods for acquisition of CSF and biomarker measurement have been previously reported [24]. Multiplex xMAP Luminex platform (Luminex Corporation, Austin, TX) with INNO-BIA AlzBio3 (Innogenetics, Ghent, Belgium) immunoassay kit–based reagents were used to measure Aβ and p-tau. P-tau was chosen as measure of neurodegeneration as it has previously been shown to be more specific to AD-pathology than total tau, which more likely is a measure of overall neurodegeneration [25]. P-tau is highly correlated with total tau (in our sample: r = 0.8, p≤0.001).
Hippocampal subfield segmentation
Segmentation of hippocampal subfields was carried out automatically from the T1-weighted images with FreeSurfer version 6.0, using the built-in automated reconstruction process [26–29]. Technical details of these procedures are described extensively in prior publications [30–32]. To summarize, intensity normalization of the T1-weighted images, skull-stripping, segregation of left and right hemispheres, removal of brainstem and cerebellum, correction for topology defects, definition of the borders of grey and white matter, and of grey matter and CSF, and parcellation of cortical and subcortical regions are part of the process.
The current version of FreeSurfer uses a Bayesian inference approach combined with a novel atlas algorithm of the hippocampal formations, based on an ultra-high resolution (voxel size 0.12 mm isotropic) ex vivo MRI atlas created from autopsy brains. This technique was validated in an independent in vivo 1 mm MRI resolution data-set of 39 individuals and was shown to be superior to its predecessor (FreeSurfer v.5.0.3) that was based on in vivo data only. Using FreeSurfer’s native visualization toolbox, we visually inspected and, if necessary, edited each image for over- or under-estimation of the gray/white matter boundaries and to identify brain areas erroneously excluded during skull stripping (JMR). In addition, we checked if the hippocampal subregion mask was well positioned. Finally, we checked the ranking of the subregion volumes. For the subregions of interests, CA1 volume was expected to be the largest and CA3 the smallest.
Subfields considered in the analyses are CA1, CA3, CA4, DG, and subiculum, as they have previously been associated with volumetric changes in the disease progression of AD [33]. Subfield volume was expressed as actual volume divided by intracranial volume, multiplied by 100000, consistent with other studies [34]. Left and right hemispheres were summed together. A graphical visualization of the hippocampal subfields segmentations for one participant can be found in Fig. 1.
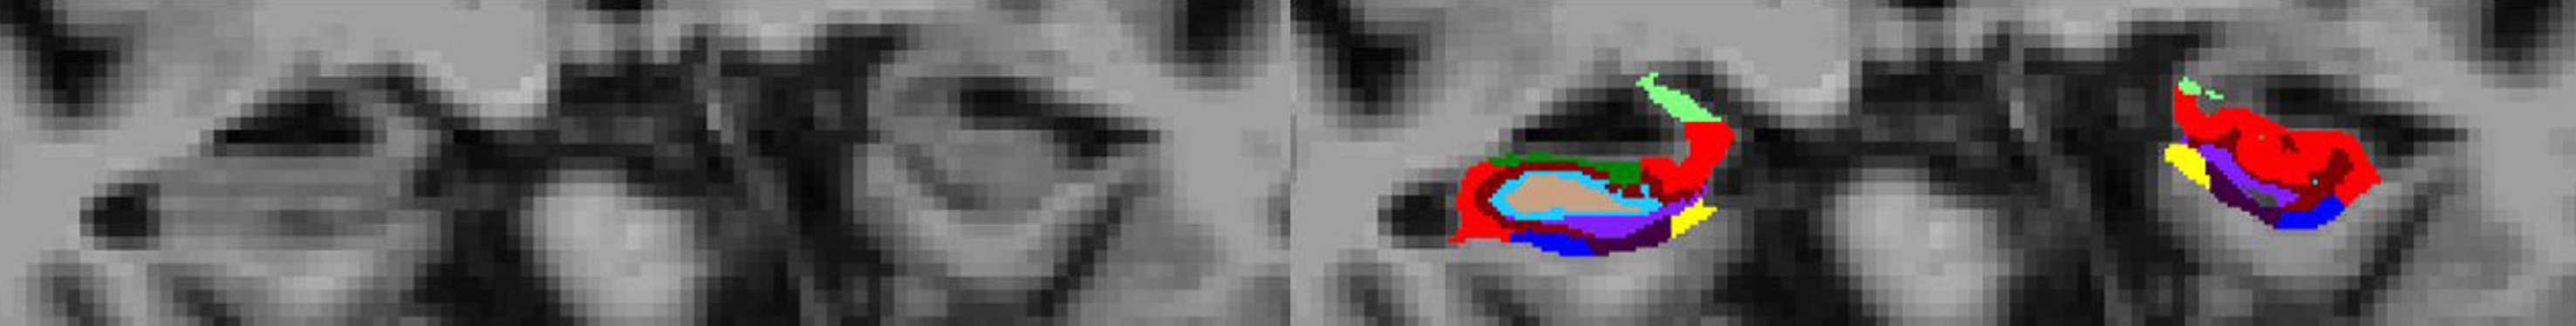
Visualization of the hippocampal subfields segmentation obtained from FreeSurfer v6, coronal view. The right side contains the color-coded segmentation of subfields parasubiculum (yellow), presubiculum (dark purple), subiculum (dark blue), CA1 (red), CA3 (green), CA4 (beige), DG (light blue), and molecular layer (burgundy). The left side shows the same view without overlaid segmentations.
Statistical analyses
All statistical analyses were performed with R software version 3.5.0 (http://www.r-project.org). Descriptive information on the total sample was assessed with mean and standard deviation. Differences between the clinical groups concatenated in the current work are assessed with ANOVA (and post hoc comparisons) for continuous variables and Chi-square for dichotomous variables. Linear and polynomial regression models were fitted to assess the relationship between Aβ and hippocampal subfield volumes, and p-tau and hippocampal subfield volumes, respectively. Linear and quadratic fits were compared with the F-statistic for nested models. Models were corrected for age, sex, and Mini-Mental State Examination score (MMSE). MMSE score was added to the model as an indicator of disease severity, to ensure that our effects were not driven by diagnostic or clinical differences across the individuals. Aβ and p-tau were treated as continuous variables. For comparability to previous work of Fortea and colleagues [10], we also ran models with p-tau as dichotomous variable based on published cut-off values [24]. Education did not contribute significantly, thus it was not added to the models. The validity of testing polynomial relationships is currently under debate and therefore, we also performed the two-lines test [35]. The two-lines test searches the data for quadratic effects (e.g., an increase in slope followed by a decrease), and we will consider these results to be a validation of potential quadratic effects. To ensure that these effects were not driven by the AD cases, we repeated our analyses excluding the AD patients. Finally, additive and interactive effects were investigated by adding dichotomous p-tau to the polynomial models with Aβ, and also the interaction between Aβ and p-tau. An alpha-level of significance of 0.05 was chosen. Multiple comparison correction was done using the false discovery rate (FDR) approach [36].
RESULTS
A total of 128 (72 female) participants were included in the analysis (CN = 45, MCI = 70, and AD = 13). A full description of the demographic data for the entire group and for the respective patient groups can be found in Table 1. Briefly, the total group had a mean age of 75.6 years (sd = 6.1, range: 61 to 89.6), 16.1 years of education (sd = 2.9, range: 6 to 20), a mean MMSE score of 27.49 (sd = 2.1, range: 21 to 30), a mean Clinical dementia rating sum of boxes (CDR-SB) score of 1.23 (sd = 1.39, range: 0 to 7), mean CSF-Aβ values of 173.34 mg/pl (sd = 57.5, range: 76 to 300), and mean CSF-p-tau values of 30.64 mg/pl (sd = 14.9, range: 9 to 69).
Demographic description of sample
CN, cognitively normal; MCI, mild cognitive impairment; AD, Alzheimer’s disease; MMSE, Mini-Mental State Examination; CDR, Clinical Dementia Rating Scale; Subfield volume was expressed as actual volume divided by intracranial volume, multiplied by 100000; Group comparisons are corrected with the Bonferroni correction method for multiple comparisons; Δ Group differences for Sex were tested with a Chi-square test, *significant difference.
Relationships between hippocampal subfield volumes Aβ
Table 2 shows the results for linear and quadratic relationships between Aβ and subfield volume. The F-test comparing the models indicated that quadratic models described the data best for all subfields. Scatterplots visualizing the polynomial relationship between Aβ and hippocampal subfield volumes can be found in Supplementary Fig. 1.
Non-linear association between Aβ and hippocampal subfield volume
Note: Regression models to determine the effect of Aβ on hippocampal subfield volume. Models tested were linear models and quadratic models. Covariates in all models were age, sex and MMSE score. Estimates are the unstandardized beta-coefficients.
To test the robustness of these polynomial effects, we performed the two-lines test, which confirmed that there were u-shaped effects of Aβ on all subfields (Table 3 and Fig. 2). It should be noted, that in this sample the observed inflection-point in the two-lines test results, was detected above the cut-off of 192 pg/ml for Aβ defined in ADNI (range 210.58–217.8 depending on the subfield).
Aβ has a u-shaped relationship with hippocampal subfield volumes
Note: The two-lines test was used to test whether Aβ has a u-shaped effect on hippocampal subfield volumes. Covariates added to these models are age, sex, and MMSE score.
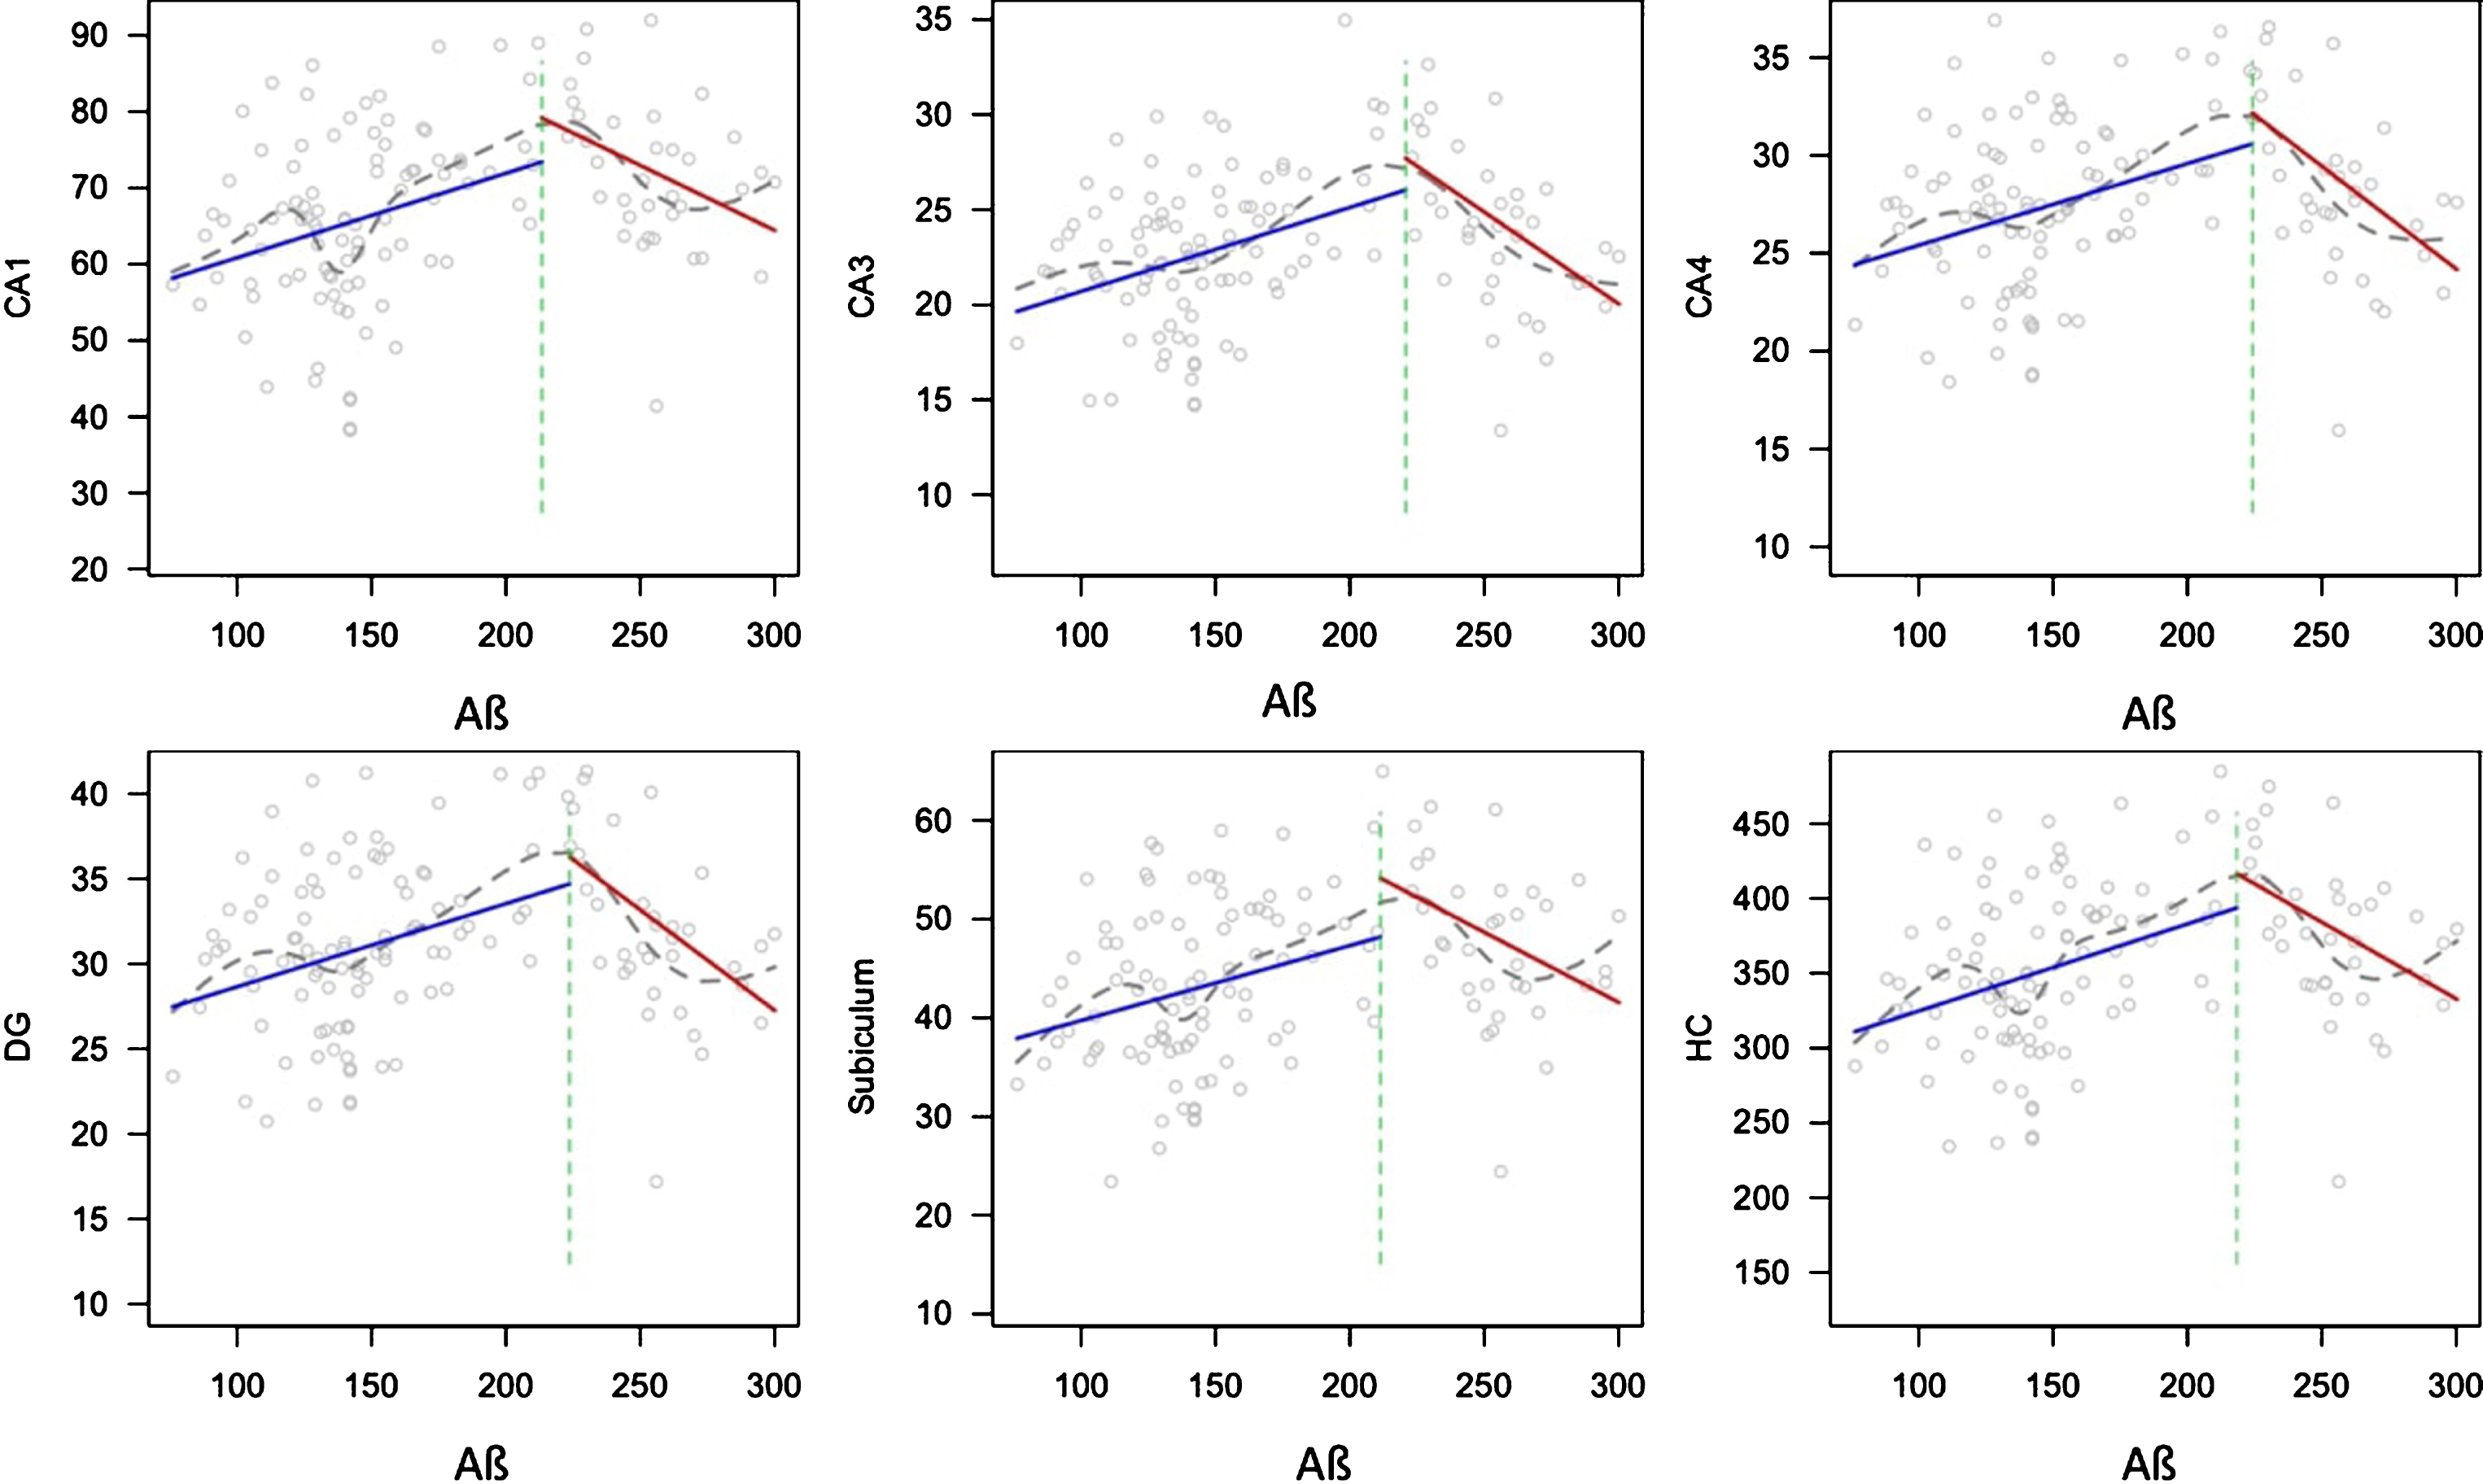
Two-lines test plots showing the u-shaped association between Aβ and all hippocampal subfield volumes. Volumes are corrected for intracranial volume. The blue line shows the first, ascending line, which is followed by the red, descending line. The green dotted line shows the inflection-point of the curve. The grey line shows a loess function.
Excluding the AD cases from our data did not alter the above results. The statistics of the polynomial regression models and two-lines test without the AD cases is provided in Supplementary Table 1 and Table 4.
Association between p-tau and hippocampal subfield volume
Note: Regression models to determine the effect of p-tau on hippocampal subfield volume. Models tested were linear models and quadratic models. Covariates in all models were age, sex, and MMSE score. Estimates are the unstandardized beta-coefficients.
Relationships between hippocampal subfield volumes and p-tau
Model comparisons of the polynomial regressions indicated that in all subfields the linear model described the data better than the quadratic model with the exception of CA3, in which a quadratic model fitted the data best: (F = 4.64, p = 0.033), (see Table 4 and Fig. 3). The results from the two-lines test confirmed that there was no u-shaped association between p-tau and any hippocampal subfield volumes (see Supplementary Table 4).
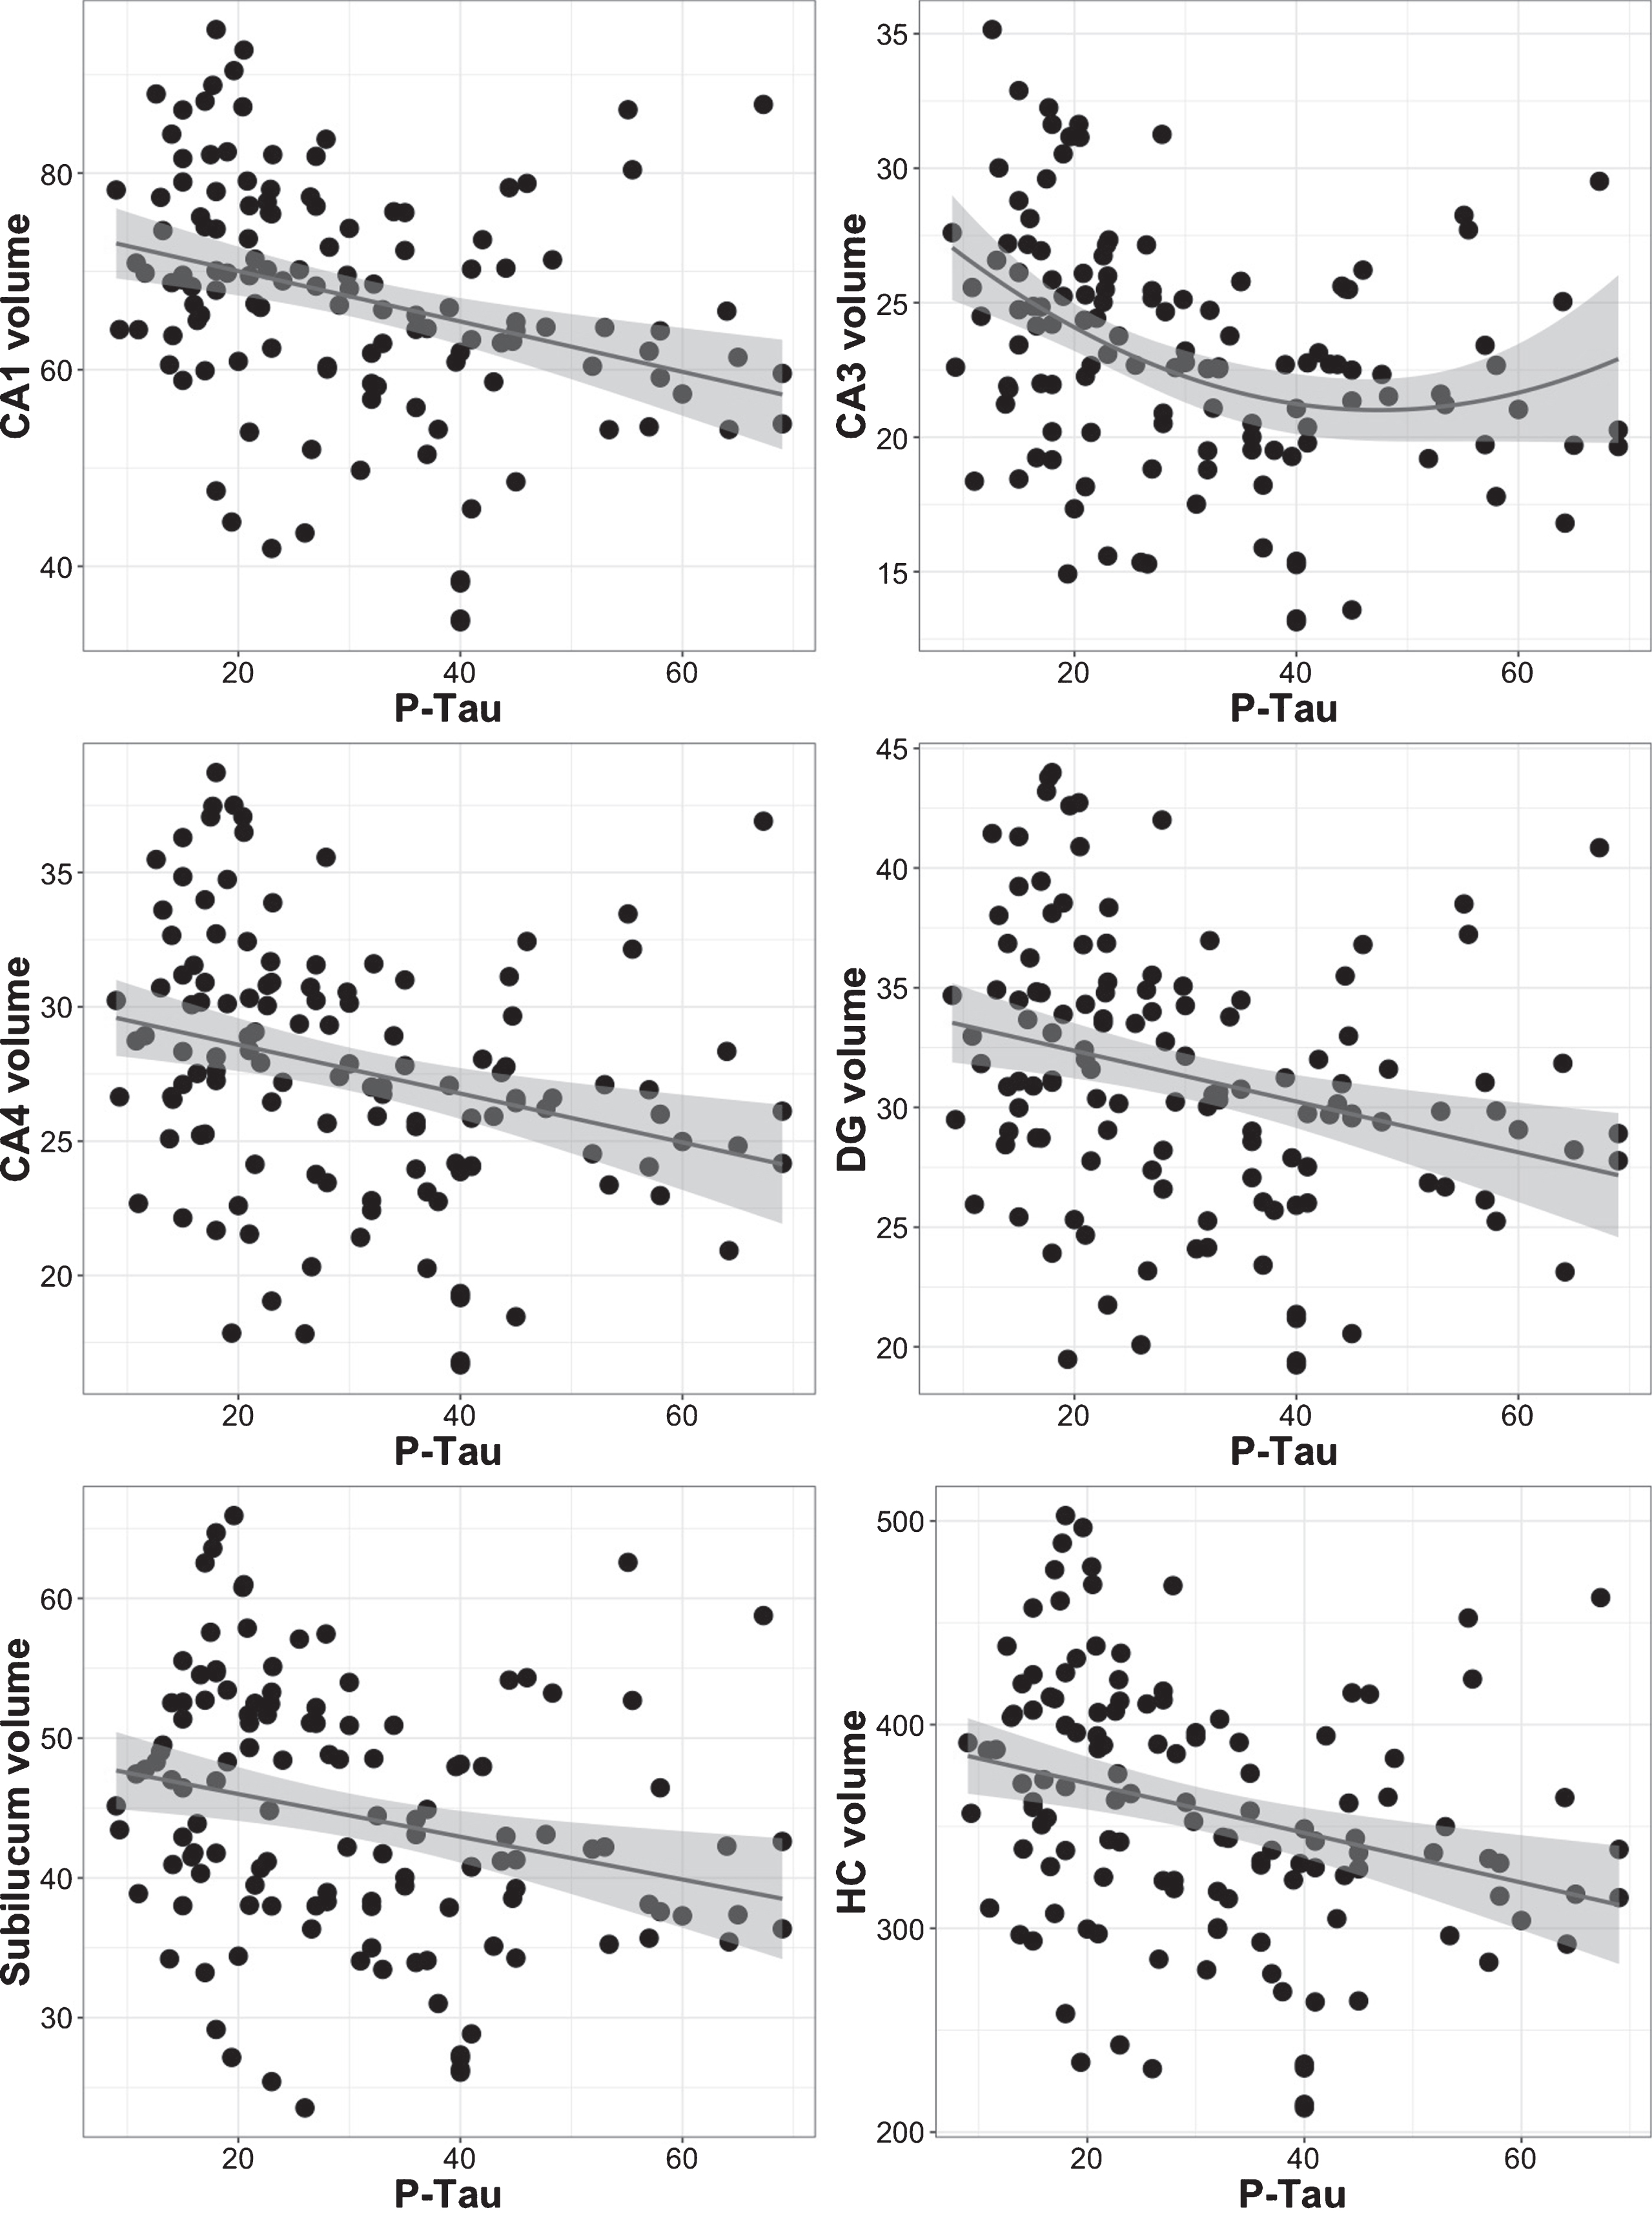
Scatterplots showing the relationship between p-tau and hippocampal subfield volume using polynomial regression analyses. Volumes are corrected for intracranial volume. CA3 has a quadratic relationship with p-tau, while the relationship is linear for the remaining subfields (see also Table 4).
Excluding the AD cases from our data showed similar relationships as in the full sample described above (see Supplementary Table 3).
Additive versus interactive effects of Aβ and p-tau on hippocampal subfield volumes
In an attempt to replicate the work from Fortea [10], we included p-tau as a dichotomous variable in the same model as polynomial Aβ. Aβ and p-tau both contributed significantly to the associations with subfield volumes CA4 and DG. In the subiculum and total HC Aβ was the strongest predictor of subfield volume (see Table 5 for detailed results).
Additive and interactive effects of Aβ and dichotomous p-tau on subfield volume
Note: Reported main effects do not include the interaction in the model. Covariates in all models were p-tau as dichotomous variable, age, sex, and MMSE score. Estimates are the unstandardized beta-coefficients. Interaction models (linear or quadratic Aβ) were independently tested for best model fit and only the best fitting model is reported here.
We observed significant interactions between quadratic Aβ and dichotomous p-tau in subfields CA1 and CA3, but not for the other subfields (see Table 5 for an overview, and Fig. 4). In both CA1 and CA3, only participants with low p-tau levels had a significant quadratic association between Aβ and subfield volume. Polynomial Aβ models including the interaction term were superior to linear models.
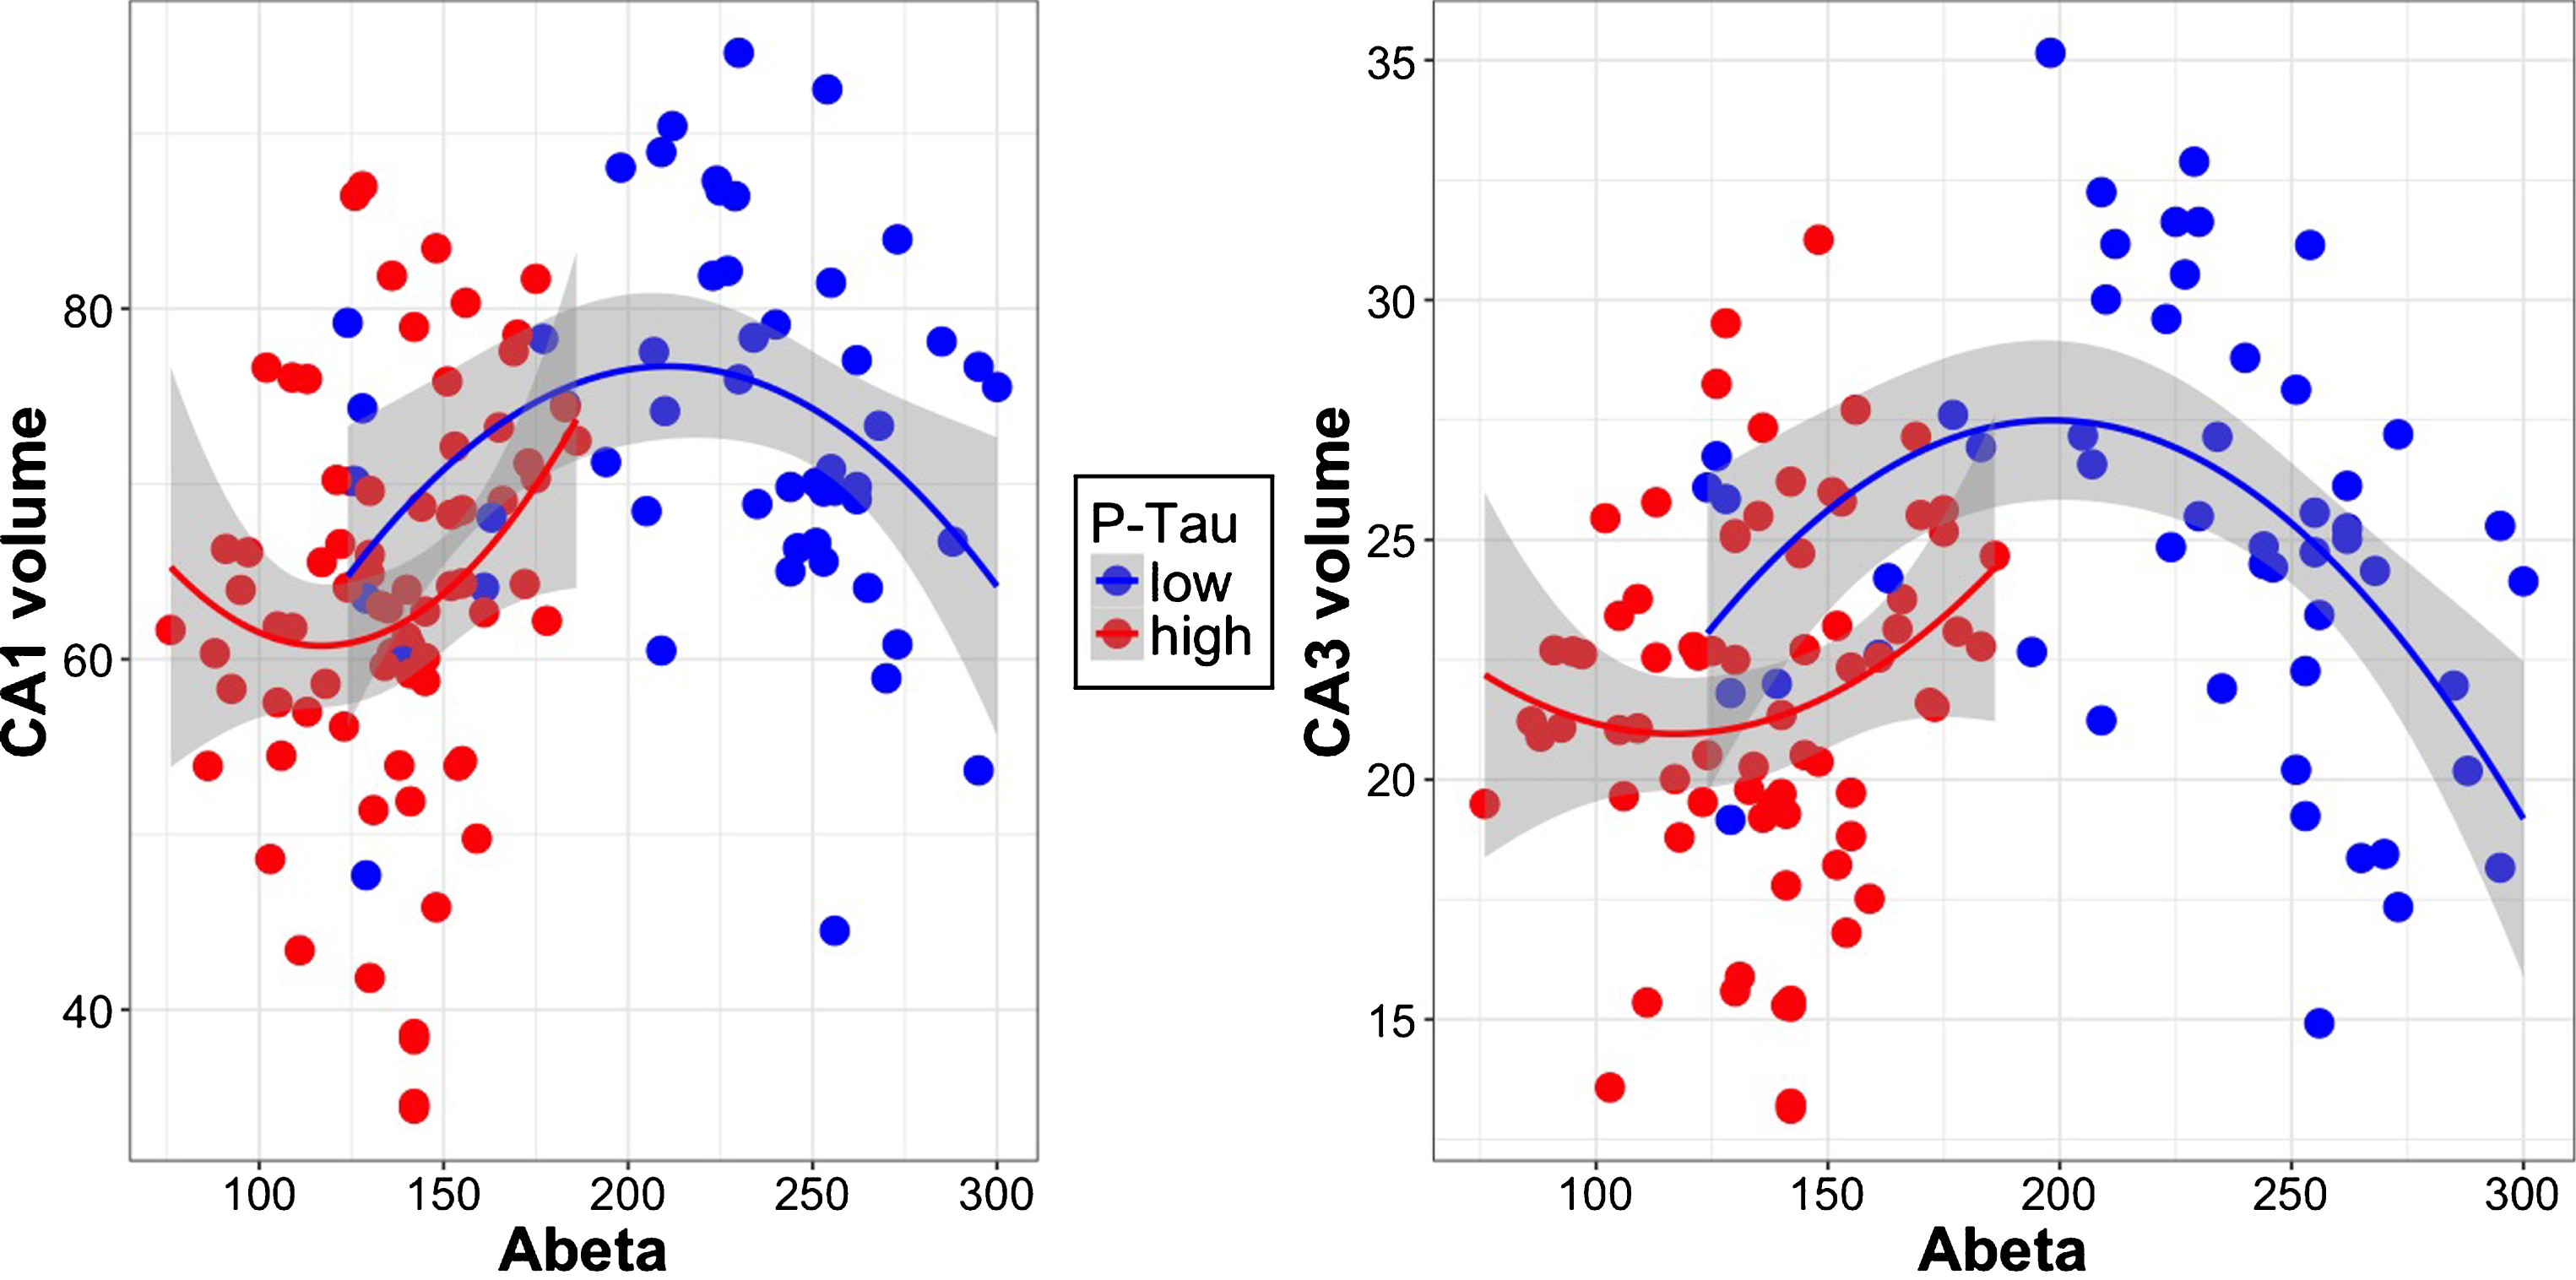
Scatterplots showing the interaction between Aβ and p-tau on subfield volumes CA1 and CA3. Volumes are corrected for intracranial volume. Participants with low p-tau (blue) have an inverted u-shaped relationship of Aβ with subfield volume.
Excluding the AD cases from our data did not change the relationships observed with AD cases included (data not shown).
Post-hoc analyses: Sample differences between the validated Aβ cut-off and the data-driven cut-off
As the two-lines function calculated the inflection point for Aβ above the validated threshold for Aβ positivity in ADNI, we investigated the characteristics of individuals between these two cut-points post-hoc. Non-parametric Wilcox Rank tests revealed that the participants with MCI (n = 4) that would be considered to be in the normal range for Aβ negative according to the predefined cut-off (192 mg/pl) but were below the calculated inflection point (218 mg/pl) from the two-lines test differed significantly from the rest of the MCI population in having lower cognitive scores on the Rey Auditory Verbal Learning test immediate recall (W = 44.5, p = 0.022) and lower p-tau levels (W = 32.5, p = 0.011). There were no differences between cognitively normal participants between these cut-points and the rest of the cognitively normal sample (see Supplementary Table 4).
DISCUSSION
The aim of the current study was to investigate the nature of the relationship between Aβ and/or p-tau and specific hippocampal subfield volumes, in a sample consisting of a broad range of pathology and cognitive functioning. Prior work showed non-linear associations between Aβ and cortical thinning, especially when tau levels are low [10]. Our study now extends these findings by showing distinct associations of Aβ and p-tau on hippocampal subfield volumes. We observed additive associations of Aβ and p-tau on CA4 and DG, suggesting that both biomarkers may have parallel influences on the structure of these subfields. The subiculum was mainly associated with Aβ levels, which is consistent with the topography of Aβ in AD [2, 16]. In addition, non-linear associations between Aβ and CA1 or CA3 volume were observed in individuals with low levels of tau pathology, which is in line with previously reported findings on cortical thinning [10]. These findings contribute to a myriad of work indicating that brain regions may show distinct vulnerabilities to AD pathology, which in turn has a progressive, non-linear impact on brain structure and function [37]. Such observations are crucial for the understanding of AD pathophysiological mechanisms, but also for detection of individuals at risk for disease progression, as we will discuss below.
Previous studies showed synergistic effects of Aβ and tau on hippocampal atrophy [22] and cortical thinning, with elevated levels of tau accelerating the accumulation of Aβ in AD specific regions [38] and abnormal levels of Aβ influencing tau propagation and tau-induced neuronal loss [39, 40], indicating that abnormalities in both biomarkers amplify aberrant neuronal processes. In the context of memory and AD-related memory deficits, the hippocampus is a crucial and interesting structure, as its subfields are involved in distinct memory processes [41, 42]. It is therefore intriguing that the subfield volumes show distinct associations with CSF biomarkers. Combining both Aβ and p-tau in the same model revealed that in CA1 and CA3, areas crucially involved in episodic memory processes such as pattern separation and completion [41, 43], the relationship between Aβ and subfield volumes behaved non-linearly and is modified by p-tau. Pattern separation and completion are two core processes of episodic memory and rely heavily on the integrity of the CA1-CA3 circuitry, and disruptions of this circuit directly correlate with decreased performance on pattern separation tasks [44, 45]. While this would be an interesting avenue to explore, ADNI unfortunately does not administer a memory discrimination task, and therefore, we are currently not able to directly investigate the link between pattern separation and biomarkers. Given the non-linear association, it would be interesting to assess at what level of Aβ pathology, pattern separation, and CA1-CA3 volume are related. It is important to note though, that these deleterious effects by Aβ on CA1 and CA3 volume were most prominent when p-tau levels were low. The CA1 is among the first subfields to accumulate Aβ depositions [46, 47] and Aβ accumulation in the CA3 has been associated with disrupted hippocampal functioning [48]. Thus, possibly AD-related memory impairments may in part be due to early Aβ accumulating in crucial subfields, in individuals whose tau pathology has not yet widely spread outside of the entorhinal cortex. This subfield-specific finding could be of potential benefit for improving early detection of persons at risk for developing AD-type dementia.
Our data suggests that the subiculum volume is mainly associated with Aβ levels, independent of tau. Possibly, a closer inspection of the subiculum subregions at higher spatial resolution could provide a more elaborate view, as it has previously been reported that abnormal values of both Aβ and p-tau influence posterior subicular atrophy in patients with cognitive complaints [49] and postmortem studies have indicated that the subiculum also accumulates tau in early stages [50].
The fact that we observed independent effect of Aβ and p-tau on DG and CA4 volume may fit with the neuropathological notions of later involvement of these subfields. The DG and CA4 are affected by Aβ from Thal-stage III and higher [51] and p-tau depositions from NFT-stage IV/V [2]. Independent pathways of Aβ and tau on structural neuroimaging markers, total hippocampal volume, ventricular volume, and FDG-PET have previously been described [52]. Possibly, the interaction between Aβ and p-tau in DG and CA4 becomes less prominent with disease progression. Disease models suggest that with disease progression Aβ reaches a plateau, whereas tau keeps increasing [37].
Overall, it is interesting that the associations between in vivo CSF biomarkers and specific hippocampal subfield volumes reflect, to some degree, the topography reported in the autopsy literature. It is important to note that we reported on cross-sectional associations and hence, any inferences on disease-stage specific associations between biomarkers and hippocampal subfield volumes remain speculative. In addition to Aβ and tau, hippocampal volume is also affected by other pathologies, such as vascular pathology, TDP-43, or hippocampal sclerosis. The fact that individuals around the validated cut-off point have higher subfield volumes than those further away from the cut-point may indicate a potential ongoing aberrant process, such as, for example, inflammatory responses [6, 53]. If this hypothesis is true, then inflammation markers may signal increasing amyloid accumulation. It would be interesting for future studies to longitudinally track hippocampal volume along with biomarker data and inflammatory markers.
Finally, our results further spark the discussion on using Aβ values continuously rather than dichotomously [9]. We observed that the inflection point for the u-shaped effect of Aβ was overall higher than the validated cut-off for Aβ. Several recent studies using Aβ-PET and Aβ-CSF have also indicated that individuals whose Aβ values are close to the cut-off but still normal show evidence of Aβ accumulation, cognitive decline, and tau pathology [9, 55]. These results indicate that rates of accumulation of Aβ may better identify individuals at risk for AD than baseline levels or the use of a binary cut-off. This potentially may hold implications for clinicians, for whom patients within a specified range of Aβ pathology (including individuals still considered normal) may be followed up more closely over time, as their clinical and biomarker trajectories can reveal critical prognostic information. Our results were performed at the cross-section, but it will be informative to investigate in larger and longitudinal studies if individuals around the inflection point accumulate Aβ at a faster pace than those further away from the inflection point.
Interestingly, post-hoc inspection of the individuals in between the cut-off of 192 pg/ml to the calculated inflection point of 217.8 pg/ml (n = 9, CN = 5, MCI = 4), revealed that the 4 individuals with MCI had lower scores on all parts of the Rey Auditory learning Test and also lower p-tau-values as compared to the total MCI sample. The lower cognitive scores most likely contributed to their clinical diagnosis and it may well be that the biomarkers in these individuals are less abnormal because of the additive presence of comorbidities. This data is on par with other studies suggesting that pathologies or comorbidities can lower the threshold for cognitive decline associated with AD pathology. It may also indicate that the interpretation of accumulation rates of Aβ should be done within the context of other risk factors.
As current clinical preventive trials are focusing on treating individuals as early as possible, dichotomizing biomarkers may lead to failed inclusions of individuals at risk for AD in clinical trials. A multimodal biomarker, combining MR-imaging such as detailed hippocampal subfield volumes, in combination with longitudinal Aβ measures and possibly other markers, e.g., inflammation markers, may increase sensitivity to identify at-risk individuals in the asymptomatic phase.
Limitations and future directions
Because the hippocampal subfields processing pipeline, involving several checks and manual edits, is time consuming, and our selection criteria were based on the presence of longitudinal CSF data, we investigated a subsample of ADNI. The results may therefore not be generalizable to the entire sample or other cohorts. While our results are consistent with reports on cortical thickness, the specificity of hippocampal subfield regions should be replicated in larger samples, with more AD cases. In addition, longitudinal data will be necessary to understand the evolution of the positive association between Aβ and volume in the individuals around the threshold and to determine whether this information does contain added value for diagnostic or predictive purposes.
The new development of tau PET tracers in combination with the Aβ tracers will allow investigating regional differences of the associations between neurodegeneration and Aβ and/or tau in vivo. However, the current spatial resolution constraints of PET will make it challenging to examine specific hippocampal subfields.
A complicating factor in the comparison of results of studies investigating hippocampal subfields are the methodological differences, which differ widely between protocols, ranging from manual segmentation [20, 57] to half-automated [58] and fully automated [59] segmentation procedures and using different software packages. The advantages and disadvantages of different tools and techniques are discussed elsewhere [60] and a dedicated working group is currently active in harmonizing the various protocols to segment the hippocampal subfields to improve comparisons across different laboratories and software packages (http://www.hippocampalsubfields.com).
CONCLUSION
CSF biomarkers Aβ and p-tau both have distinct associations with hippocampal subfield-volumes. These biomarker relationships with hippocampal subfield volumes seem to reflect the hippocampal-specific topography of Aβ and tau reported in neuropathological staging models. Aβ and p-tau contribute independently to DG, CA4, subiculum, and total hippocampus volume. All subfields have a non-linear relationship with Aβ, and for the CA3 and CA1 this is observed in the context of low p-tau levels. Our results suggest that using continuous values of Aβ reveals patterns with imaging markers that are not clear from dichotomization and can be important for early detection of individuals at risk for AD and for accurate inclusion of potential participants in clinical trials targeting Aβ.
Footnotes
ACKNOWLEDGMENTS
This work was supported by a DFG individual grant JA 2336/1-1 (HILJ).
Freesurfer analyses were carried out on the Dutch national e-infrastructure with the support of SURF Cooperative and NWO Exact Sciences grant MP-310-15 (HILJ & JMR).
Data collection and sharing for this project was funded by the Alzheimer’s Disease Neuroimaging Initiative (ADNI) (National Institutes of Health Grant U01 AG024904 ADNI is funded by the National Institute on Aging, the National Institute of Biomedical Imaging and Bioengineering, and through generous contributions from the following: AbbVie, Alzheimer’s Association; Alzheimer’s Drug Discovery Foundation; Araclon Biotech; BioClinica, Inc.; Biogen; Bristol-Myers Squibb Company; CereSpir, Inc.; Cogstate; Eisai Inc.; Elan Pharmaceuticals, Inc.; Eli Lilly and Company; EuroImmun; F. Hoffmann-La Roche Ltd and its affiliated company Genentech, Inc.; Fujirebio; GE Healthcare; IXICO Ltd.; Janssen Alzheimer Immunotherapy Research & Development, LLC.; Johnson & Johnson Pharmaceutical Research & Development LLC.; Lumosity; Lundbeck; Merck & Co., Inc.; Meso Scale Diagnostics, LLC.; NeuroRx Research; Neurotrack Technologies; Novartis Pharmaceuticals Corporation; Pfizer Inc.; Piramal Imaging; Servier; Takeda Pharmaceutical Company; and Transition Therapeutics. The Canadian Institutes of Health Research is providing funds to support ADNI clinical sites in Canada. Private sector contributions are facilitated by the Foundation for the National Institutes of Health (![]() ). The grantee organization is the Northern California Institute for Research and Education, and the study is coordinated by the Alzheimer’s Therapeutic Research Institute at the University of Southern California. ADNI data are disseminated by the Laboratory for Neuro Imaging at the University of Southern California.
). The grantee organization is the Northern California Institute for Research and Education, and the study is coordinated by the Alzheimer’s Therapeutic Research Institute at the University of Southern California. ADNI data are disseminated by the Laboratory for Neuro Imaging at the University of Southern California.