
Abstract
Background:
Apathy is present in several psychiatric and neurological conditions and has been found to have a severe negative effect on disease progression. In older people, it can be a predictor of increased dementia risk. Current assessment methods lack objectivity and sensitivity, thus new diagnostic tools and broad-scale screening technologies are needed.
Objective:
This study is the first of its kind aiming to investigate whether automatic speech analysis could be used for characterization and detection of apathy.
Methods:
A group of apathetic and non-apathetic patients (n = 60) with mild to moderate neurocognitive disorder were recorded while performing two short narrative speech tasks. Paralinguistic markers relating to prosodic, formant, source, and temporal qualities of speech were automatically extracted, examined between the groups and compared to baseline assessments. Machine learning experiments were carried out to validate the diagnostic power of extracted markers.
Results:
Correlations between apathy sub-scales and features revealed a relation between temporal aspects of speech and the subdomains of reduction in interest and initiative, as well as between prosody features and the affective domain. Group differences were found to vary for males and females, depending on the task. Differences in temporal aspects of speech were found to be the most consistent difference between apathetic and non-apathetic patients. Machine learning models trained on speech features achieved top performances of AUC = 0.88 for males and AUC = 0.77 for females.
Conclusions:
These findings reinforce the usability of speech as a reliable biomarker in the detection and assessment of apathy.
INTRODUCTION
Apathy can be described generally as a syndrome comprising a reduction in goal-directed behaviors, reduction of interests, and emotional blunting [1]. Study findings suggest that a disruption of mechanisms underlying the way in which reward is processed to motivate behavior could be the potential cause [2]. Consequently, it can be seen primarily as a motivational disorder present in several psychiatric and neurological conditions such as traumatic brain injury [3], major depression [4], or schizophrenia [5], as well as in neurodegenerative diseases including Alzheimer’s disease (AD) [6] or Parkinson’s disease [7]. Although there seems to be a lack of consensus in the definition across different pathologies, with different terms employed interchangeably according to patient groups, Cathomas et al. [8] proposed that for research purposes it may be helpful to regard it as one concept to a large extent, applicable across traditional nosological categories, to be considered a “trans-diagnostic clinical phenotype”.
The presence of apathy visibly and significantly affects the patient’s and caregiver’s quality of life [9]. In neurodegenerative disorders, apathy is associated with faster cognitive and functional decline [10] representing a risk factor for the conversion from early stages to AD. Thus, identifying apathy timely in disease progression is considered a clinical and research priority.
Current assessment methods for apathy rely mostly on scales or interview-based self-reports such as the Apathy Inventory [11] or the Neuropsychiatric Inventory [12], which might not always capture the actual state of a person’s level of motivation and activity since it is limited to the moment the patient is being evaluated. Furthermore, their application for early detection is rather limited because of their dependency on human observers as well as frequently impaired capacity for self-observation [13]. Thus, broad apathy measures may not sufficiently detect subtle variations in the presentation of apathy pointing to a need for additional more sensitive and objective assessment tools. Recently, a task force revised the apathy diagnostic criteria for better operationalization in clinical and research practice, stipulating the presence of quantitative reduction of goal-directed activity either in the behavioral, cognitive, emotional, or social dimension in comparison to the patient’s previous level of functioning [14]. With this, it was suggested that, information and communications technologies (ICT) might supplement these classical tools with additional objective measures, potentially providing more continuous endpoints in clinical trials. Several attempts have been made to investigate the use of ICT for apathy assessment over the past years. König et al. [15] performed a review of ICT for the assessment of apathy and concluded that no one had previously used ICT specifically in this context, but that techniques seemed promising. Since apathy seems to affect emotion-based decision-making, attempts to measure it through video games were made such as the Philadelphia Apathy Computerized Task (PACT) [16], detecting impairments in goal-directed behavior including initiation, planning, and motivation. Reward and effort mechanisms have been explored along with physical effort discounting through paradigms such as the one developed by Pessiglione et al. [17]. Studies in schizophrenia have shown that actigraphy and the measurement of motor activity provide a promising readout for quantifying apathy [18]. Actigraphy has been used as well to measure physical changes in dementia patients with apathy [19]. Apathy has also been explored using eye-tracking in AD patients with the result that apathetic patients tend to fixate less on social images than non-apathetic patients [20]. Despite these efforts to find alternative objective measurements of apathy, an easy to implement, cheap and fast method, which could help with early, non-intrusive and potentially remote screening, is still urgently needed.
Recent advances in computational linguistics and language processing have led to the use of automatic speech analysis in the assessment of various clinical manifestations [21]. Semantic and acoustic features automatically extracted from speech tasks seemed highly sensitive to cognitive decline and potential conversion risk to dementia [22].
Significant associations were found between negative symptoms in schizophrenic patients and variability in pitch and speech proportion, even in different languages [23]. Strong correlations were obtained between negative symptom severity and phonetically measured reductions in tongue movements during speech [24].
Apathy belongs to the negative symptomatology of schizophrenia [25]. Recent factor analysis-based studies show the distinction of two underlying subdomains of negative symptoms, namely amotivation and diminished expression [26, 27]. Both domains may be characterized by aprosody (flattened speech intonation) and poor speech production (similar to the ‘emotional blunting’ domain in apathy) which seem to be easily detectable by this technology thus, making it a promising tool for measuring and tracking severity of symptoms, even across different types of population [28].
In depression, it is notable by ear that patients show a reduced prosody spectrum and sound rather monotonous which could serve as an indicator, if objective measurements can quantify these observations. Until now, several groups investigated the use of automatic analysis of speech as an additional assessment tool with an extensive review published by Cummins et al. [29] outlining the interest of using speech as a key objective marker for disease progression. Prosodic, articulatory, and acoustic features of speech seem affected by depression severity and thus can easily be identified and used for continuously monitoring patients. With a considerable overlap of symptoms between depression and apathy, namely the lack of interest and goal-oriented behavior, we anticipate similar results when applying speech technology methods to apathy with a slightly different pattern in regards to emotionally triggered speech. To the best of our knowledge, at present, no other study aims to detect apathy by the means of automatic speech analysis. Therefore, the current study intends to investigate the feasibility of automatic analysis utilizing paralinguistic speech features extracted during a short free speech task as a potential candidate for clinical apathy assessment (characterization) and broad screening (detection) in elderly patients with cognitive impairment.
METHODS
Participants
60 patients aged 65 or older with neurocognitive disorder according to the Diagnostic Statistical Manual 5 (DSM-5) [30] were included in this study. For this, the presence of cognitive decline in memory and/or executive function with or without interference with independence was required based on previously performed evaluations. Participants underwent a clinical assessment including, among others, the Mini-Mental State Examination (MMSE) [31], the Apathy Inventory (AI) [11], and the Neuropsychiatric Inventory (NPI) [12]. Apathy was diagnosed based on the AI total score (≥4). According to this assessment, participants were categorized into either non-apathy (N = 30) or apathy (N = 30) groups and matched for age and MMSE per gender group. In this study, we only look at patients with neurocognitive impairments, to prevent confounding of group differences by cognitive state. Thus, patients were selected from a larger existing cohort to build two comparable groups.
Speech features vary naturally between males and females. These differences have been leveraged in gender classification through speech analysis based on pitch and formant frequencies [32], Harmonic-to-Noise ratio [33], and linear predictive components and mel frequency cepstral coefficients (MFCC) [34]. Previous work found differences in speech depending on gender in the effects of apathy [35], as well as depression and the effectiveness of classifiers for its detection [36]. This is why this study considers males and females separately. All participants were recruited through the Memory Clinic located at the Institute Claude Pompidou in the Nice University Hospital. Participants were all native speakers of French and excluded if they had any major auditory or language problems, history of head trauma, loss of consciousness, psychotic or aberrant motor behavior, or history of drug abuse. Written informed consent was obtained from all subjects prior to the experiments. The study was approved by Nice Ethics Committee (ELEMENT ID RCB 2017-A01896-45, MoTap ID RCB 2017-A01366-47) and was conducted according to the Declaration of Helsinki.
Speech protocol
Free and natural speech tasks require low cognitive effort and are capable of eliciting emotional reactions (or a lack thereof) by asking to describe events that triggered recent affective arousal [37]. To this end, people were asked to perform two tasks: 1) talk about a positive event in their life and 2) to talk about a negative event in their life. Instructions (“Can you tell me in one minute about a positive/negative event?/Pouvez-vous me raconter en une minute d’un événement positif/négatif?”) for the vocal tasks were pre-recorded by one of the psychologists and played from a tablet computer ensuring standardized instruction over both experiments. The vocal tasks were recorded with the tablet computer’s internal microphone. Administration and recording were controlled by the application and facilitated the assessment procedure. To increase comparability, all recordings were sampled at 22.050 kHz and encoded with 16 Bit in the wav format.
Features
Audio features were extracted directly and automatically from the audio signal. This form of speech analysis does not consider the semantic content of what a participant said, thus increasing the applicability of results in a clinical scenario, as no prior processing, such as transcription of what has been said, is required.
For each speech task (positive and negative story), features were extracted separately. The selection of vocal markers included standard acoustic measures and were guided by previous research on depression [29]. Overall, features were extracted from four different main areas: prosodic, relating to long-time variations in perceived stress and rhythm in speech. Prosodic features also measure alterations in personal speaking style (e.g., perceived pitch, intonation of speech); formant features represent the dominant components of the speech spectrum and carry information about the acoustic resonance of the vocal tract and its use. These markers are often indicative of problems with articulatory coordination in speech motor control disorders (ref Sapir); source features relate to the source of voice production, the airflow through the glottal speech production system. These features operationalize irregularities in vocal fold movement (e.g., measures of voice quality); and temporal features include measures of speech proportion (e.g., length of pauses, length of speaking segments), the connectivity of speech segments and general speaking rate.
Table 1 gives a detailed overview, definition, and explanation of all extracted acoustic features. All features from the temporal category as well as F0 features were extracted using the Praat software (http://www.fon.hum.uva.nl/praat/). Jitter, Shimmer were determined using openSmile (https://www.audeering.com/opensmile/), a software for the extraction of vocal features. A Matlab script was used to extract HNR and statistics over the first three formants.
Feature definition of acoustic markers. Name, definition, and intuition of features sorted by category is presented
Statistical analysis
All statistical analyses were run using R software version 3.4.0 (https://www.r-project.org). Because of the small sample size non-parametric tests were chosen. This study computed the Wilcoxon signed-rank and ranked-sum tests for dependent and independent sample testing respectively and Spearman’s ρ for correlations. For the characterization of apathy, differences in acoustic measures are examined between the apathy and non-apathy group inside a gender. The goal being to find correlations between acoustic markers and the AI apathy sub-scales, as well as between acoustic markers, ultimately deriving properties of apathetic speech.
Classification
Machine learning experiments were carried out to validate the diagnostic power of extracted markers. For this, classifiers were always trained within a gender (one classifier for males, one for females), to differentiate people with and without apathy.
As classifiers, simple Logistic Regression (LR) models implemented in the scikit-learn (https://scikit-learn.org/stable/) framework were used. Linear models assign directly interpretable weights to each feature. Models using the L1 penalty (also referred to as lasso) are capable of performing implicit feature selection by reducing weights of unimportant features to zero. This was especially useful, since the number of used features is larger than the number of samples (see [47, p. 145] for more detail).
Because of the small data set, models were trained and evaluated in a leave-one-out cross-validation (LOO-CV) scenario. Here, all but one sample was used in training of the classifier and its performance is evaluated on the held out sample. This was repeated for all samples and performances were averaged.
Features were normalized using z-standardization based on the training set in each fold, excluding the held out sample. As a performance metric we report Area under the Curve (AUC) to be able to reason about possible specificity and sensitivity trade-offs.
RESULTS
Demographics
Demographic data is provided in (Table 2). After matching for MMSE and age, 24 male subjects and 36 female subjects were included in the final analysis and divided into equal groups of apathy and non-apathy subjects. No significant differences were present between the groups except for the results on the apathy scales.
Demographic data for population by gender and apathy
Mean (standard deviation); Significant difference from the control population in a Wilcoxon-Mann-Whitney test are marked with *p < 0.05, **p < 0.01, ***p < 0.001. N, No Apathy; A, Apathy; MMSE, Mini-Mental State Examination; AI, Apathy Inventory; AI-Intr, AI domain Interest; AI-Init, AI domain Initiative; AI-Affect, AI domain affective; NPI, Neuropsychiatric Inventory; NPI-Apathy, NPI domain apathy; NPI-Depression, NPI domain depression; NPI-Anxiety, NPI domain anxiety.
Correlation
Figure 1 presents Spearman correlation coefficients between extracted features and the AI sub-scales (i.e., affective, interest, initiative), split by gender. Only significant correlations are presented. The male population shows overall comparable correlations between the positive and the negative story. Generally, more significant correlations are observed for temporal features. In the positive story, correlations between these markers and all AI subdomains are present. Only a small negative correlation between F0.
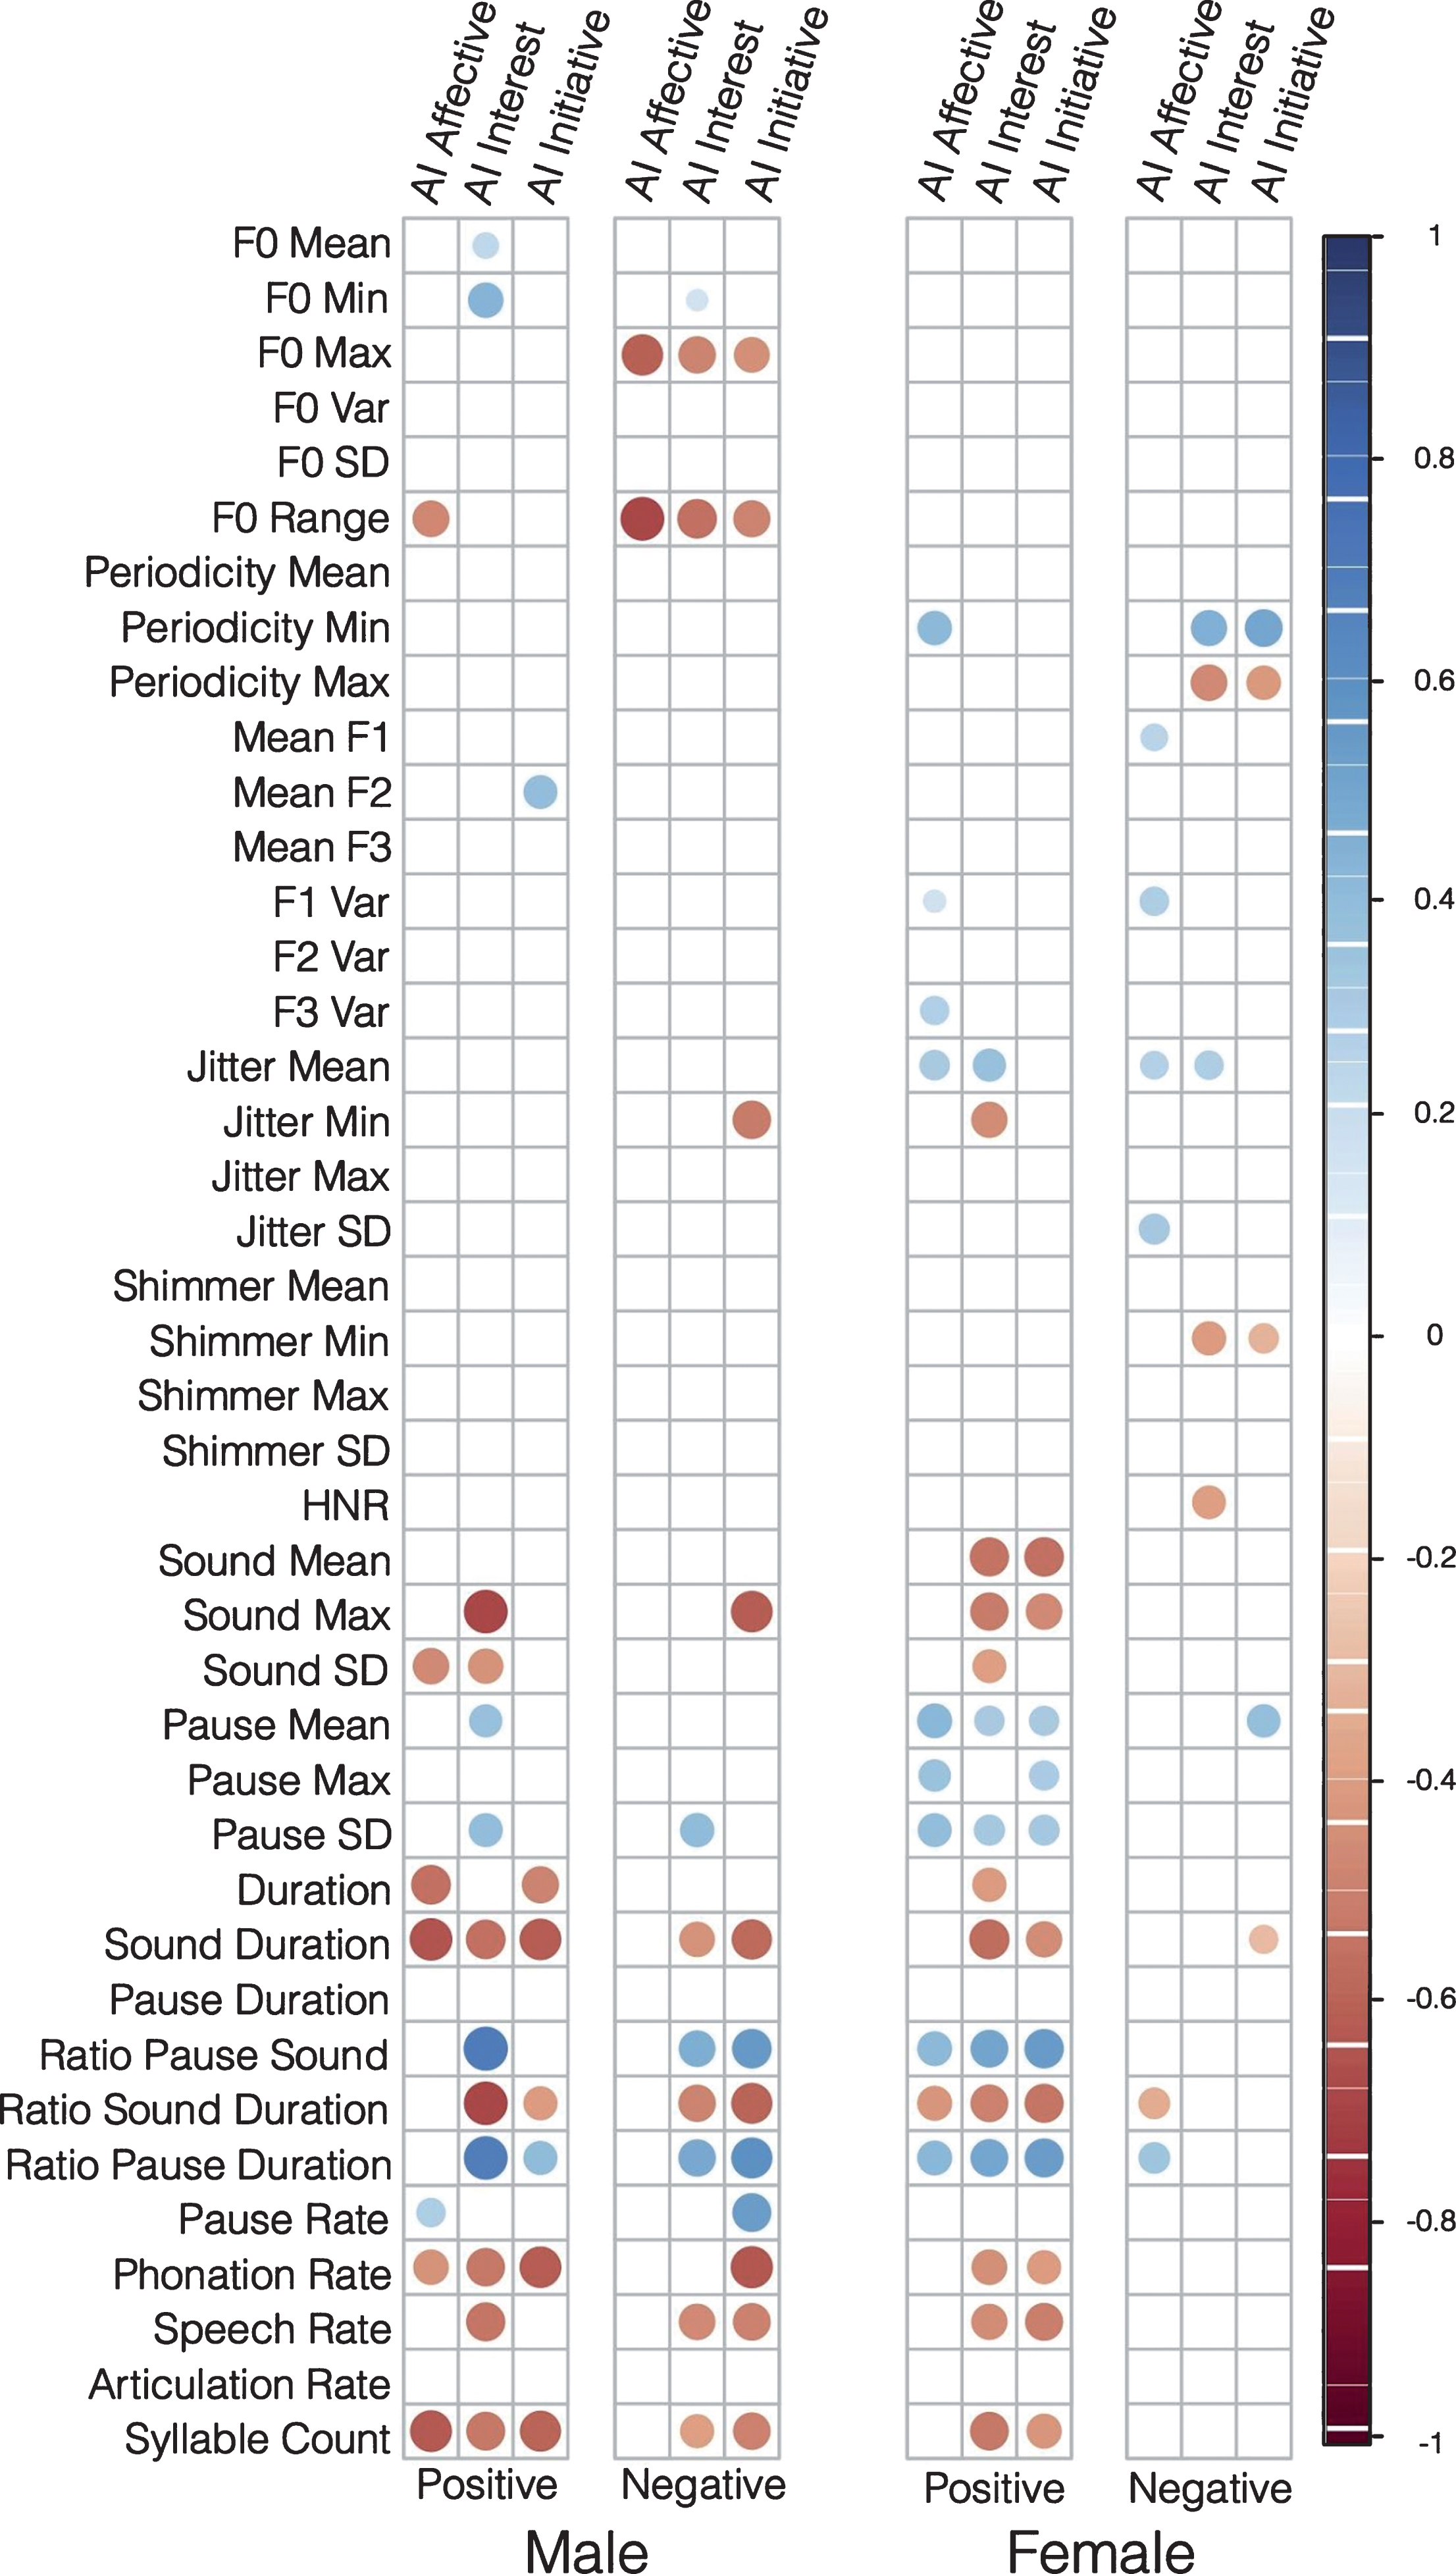
Spearman correlation coefficient between features extracted from vocal tasks and AI subdomains. One correlation matrix is presented per speech task and gender. Only significant correlations (p < 0.01) are displayed.
Range and the affective domain is observable (ρ= –0.47). For the negative story, temporal features again dominate, while only showing correlations with the interest and initiative subdomains. Correlations with the affective domain are observed for both F0 Max (ρ= –0.61) and F0 Range (ρ= –0.69).
The female population shows more correlations in the positive story. Strong correlations are observed between all three subdomains and features relating to pause lengths. Features relating to sound length and speech tempo correlate significantly with the interest and initiative domain. In the negative story, nearly no correlations between temporal variables and any subdomain are present. Weak correlations are present between variables relating to mean Jitter (affective: ρ= 0.28; interest: ρ= 0.29), which is consistent with correlations in the positive story; minimum Shimmer (interest: ρ= –0.40; initiative: ρ= –0.31); and minimum (interest: ρ= 0.46; initiative: ρ= 0.50) and maximum Periodicity (interest: ρ= –0.47; initiative: ρ= –0.41).
Group comparison
Statistical comparisons between the apathetic and non-apathetic groups are presented in (Table 3A) for the male population and in (Table 3B) for the female population. Only significant values are reported.
Statistical group comparisons between non-apathetic and apathetic group using Kruskal-Wallis tests. Features with p < 0.05 are reported. Vocal task of origin, p-value, test statistic (χ2), effect size (ρ) and direction of effect in the apathetic group in comparison to the non-apathetic group are reported. *p < 0.05, **p < 0.01, ***p < 0.001
Overall, features relating to temporal aspects of speech dominate. Some features show significant differences regardless of gender (i.e., Speech Rate, Ratio Pause Duration, Ratio Sound Duration, Ratio Pause Sound, Sound, Max, Sound Duration), but for the female population only in the positive story. Males show significant differences in F0 Range and F0 Maximum in the negative story. Females show significant differences in HNR across both tasks. Females show differences in the negative story only in voice quality markers (Periodicity, Jitter. and HNR). For the male population, the largest effect in the positive story is the Sound Duration (ρ= 0.61) and for the F0 Range in the negative story (ρ= 0.52). For the females, the largest effects are in the Ratio Sound Duration for the positive story (ρ= 0.54) and the HNR for the negative story (ρ= 0.51). A table of the feature weights from the L1 regularized Logistic Regression models as well as spectrograms of non-apathy and apathy subjects during the positive and negative story telling task can be found in the Supplementary Material.
Classification
Classification results are reported in (Fig. 2). AUC are far over the chance baseline of 0.5 for both male and female populations. Both AUC results are significantly better than the random chance baseline of 0.5.
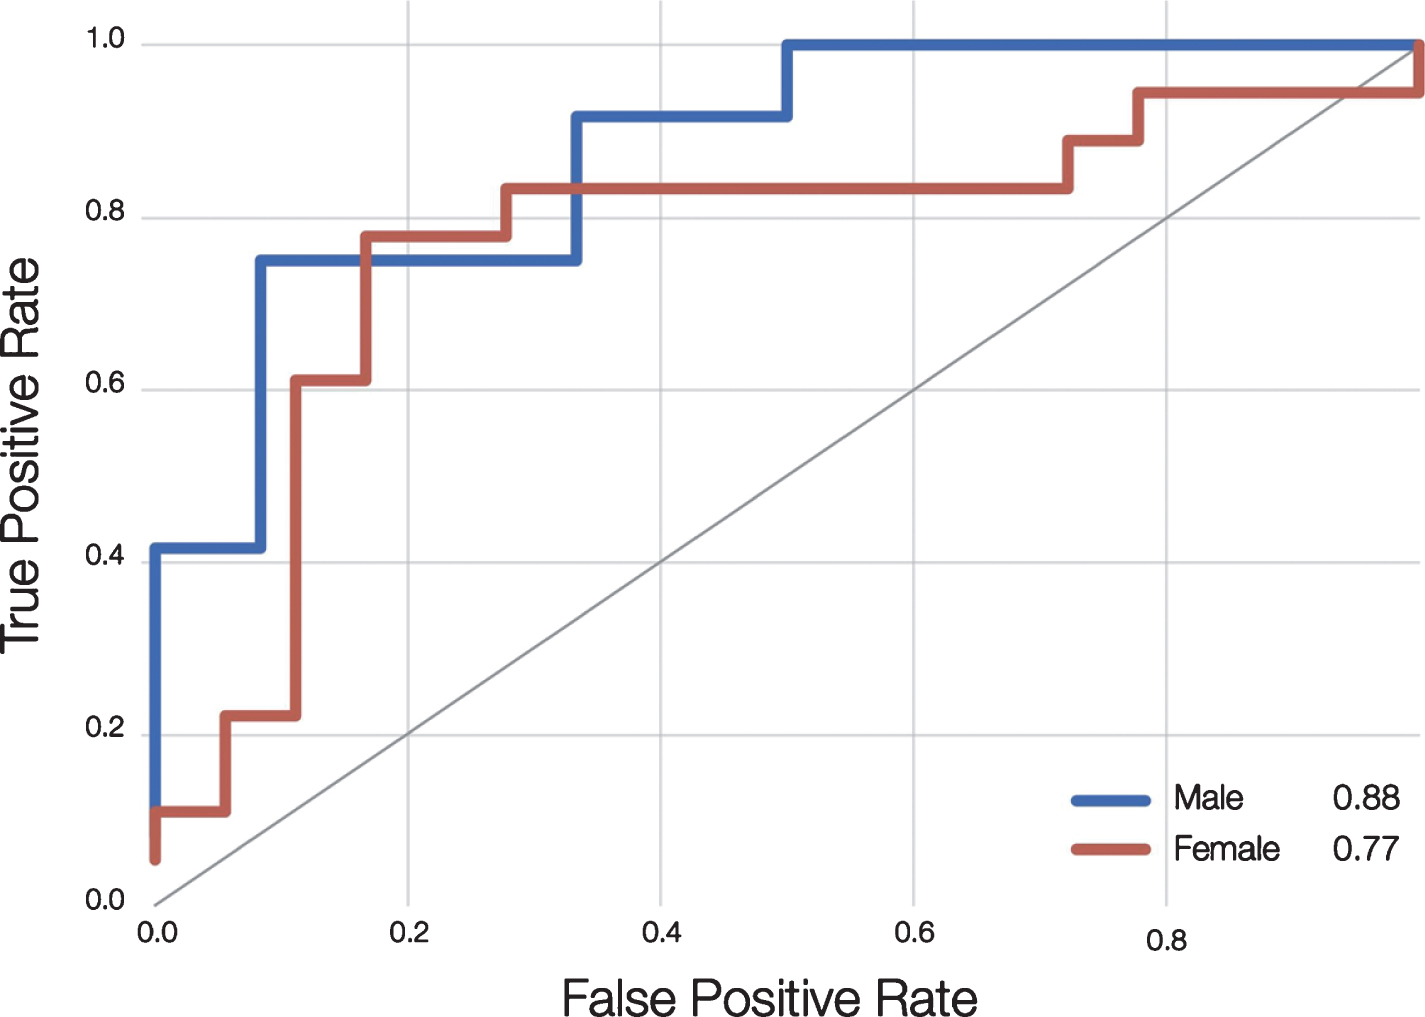
Receiver Operator Curve (ROC) of classifiers trained to detect apathy from speech. The blue and red lines represent classifiers trained and evaluated on the male and female populations respectively. Area under the curve (AUC) is reported in the legend.
The classifier trained on the male population achieves an AUC of 0.88 and the one trained on the female population an AUC of 0.77. The ROC visualizes a trade-off between sensitivity and (1 - specificity). For the male population, the classifier could be configured to achieve a good sensitivity of 0.91 and a reasonable specificity of 0.68. For the female population, a sensitivity of 0.85 and specificity of 0.72 can be configured.
DISCUSSION
Early detection of apathy in older adults has reached high clinical relevance because of an increased risk of incidence of dementia and the danger to be easily overlooked by clinicians, which could lead to premature withdrawal from care [39]. The current study is the first one of its kind demonstrating clearly that certain paralinguistic features correlate significantly with levels of apathy severity. Thus, automatic speech analysis could be a promising new tool for its assessment.
Overall, the strongest correlations were found between the subdomains interest and initiative of the AI and temporal speech features. The affective subdomain, which represents the emotional blunting in apathy, was found to be more associated with prosodic speech features which is in line with previous findings on depressed speech with mainly prosodic speech abnormalities such as reduced pitch resulting often in a dull and ‘lifeless’ tone [29]. Similar observations were made in patients of this study with presence of emotional blunting. Thus, it seems that through speech features, distinct profiles can be characterized confirming what previous neuroimaging analyses revealed, namely that apathy is multidimensional and different subdomains are associated with different brain regions and circuits; the affective one with the ventral prefrontal cortex; the behavioral one with the basal ganglia; and the cognitive with the dorsomedial prefrontal cortex [40].
Overall, both males and females showed reduced reaction to the stimuli. Answers to the posed questions can be generally characterized by drastically shorter (lower sound duration) and slower (lower Speech Rate) speech. For the female population, a difference in voice quality (lower HNR) was obvious in both questions. Males suffering from apathy react less emotionally to the negative question as indicated by a lower variance of prosody (lower F0 Range). Interestingly, male and female subjects with apathy show different patterns in their speech features according to the type of free speech task. For males, significant differences between apathy and non-apathy subjects can be seen in temporal features for both the negative and positive story. Females show similar patterns in the positive story, but not in the negative one. Until today, no work on gender dependent symptoms of apathy has been found that could explain this pattern. Parts of this effect could be caused by the fact that men from this generation are in general less likely to talk enthusiastically about a positive event and show greater responses to threatening cues [41]. Gender differences in emotional processing and expressivity [42] as well as in emotional memory retrieval [43] could be another reason and should be further investigated, since current literature mostly focuses on exploring age as a variable. Gender differences have been observed in brain activity during emotional tasks with primarily females recalling more autobiographical memories when it is of emotional content and cues are given verbally. It is possible that females in this study were more likely to be triggered to an emotional reaction when asked about a positive event and vice versa for males. Apathy might have an effect on this biased emotional memory retrieval. Hence, it can be assumed that the type of affective stimulus with which speech is being provoked might play a major role and might have to be adapted depending on a patient’s gender.
Generally, when classifying between apathy and non-apathy subjects, features related to sound and pause segments seem to dominate with higher AUC results obtained for the male group. These features might have been particularly affected by the cognitive and behavioral aspects of apathy, which seem to be reflected in the general amount of speech produced. Recent findings suggesting that apathetic patients have decreased visual attentional bias for social stimuli compared with non-apathetic patients [20] might apply as well for speech production since it implies engagement in social interaction. Several reasons could explain these findings drawn from related studies on depression and negative symptoms in schizophrenia. This may be attributed to reduced muscle tension as well as impaired neuromuscular motor or articulatory coordination [24] caused potentially by alterations in the neurotransmitter system namely low norepinephrine and/or dopamine levels [43]. Changes in affective states can impact the phonation and articulation muscular systems via the somatic and autonomic nervous systems [44]. Commonly observed psychomotor retardation in apathy can lead to small disturbances in muscle tension which in turn can affect the speaker’s speech pattern and, for instance, reduce pitch variability [45].
This study has some limitations. Instead of a standardized speech task (e.g., reading a text), this study relied on emotional questions for patients to elicit free speech. Although limiting the generalization to universal speech production, these tasks have proven effective in provoking speech that includes discriminative markers and are directly comparable to research about speech in depression [37]. Since patient data is always hard to acquire, the here presented sample is relatively small and future studies should strive to draw more conclusive evidence from larger datasets. Furthermore, this study considered three different statistical viewpoints of a single dataset (i.e., group comparisons, correlations, and machine learning). Although these uni- and multivariate analysis are not independent, we ensured that results from one experiment did not directly influence another one (e.g., using the results of group comparisons in the classification experiment). Finally, due to the high number of correlated features and low sample size, no correction was applied to most significance tests, including the correlations with diagnostic scores.
Further work should examine what features in particular are predictive for apathy, how they relate to depression and how the two could be better discriminated. One potential solution could be to perform a semantic analysis of the content of speech to better differentiate apathy from depression and anxiety. Adding other additional measurements, for instance, of facial, head, or body movement dynamics, by the means of video might further improve accuracy. In the field of depression, research has demonstrated more powerful detection when applying a multi-modal audio-visual data fusion approach [46].
Nevertheless, it can be concluded that automatic speech analysis could become a promising new screening and assessment tool for follow-up measurements (’digital endpoints’) in clinical trials of pharmacological and other interventions that aim to monitor apathy in patients.
Footnotes
ACKNOWLEDGMENTS
The authors would like to thank all participants of this study. This research is part of the MNC3 program of the University Cote d’Azur IDEX Jedi. It was partially funded by the EIT Digital Well- being Activity 17074, ELEMENT, the University Cøote d’Azur, and by the IA association and supported by the Edmond & Lily Safra Foundation and Institute Claude Pompidou.