
Abstract
Cardiovascular disorders, e.g., atherosclerosis and hypertension, increase susceptibility to neurodegenerative diseases, like dementia and Alzheimer’s disease (AD), with undetermined mechanisms. Moreover, whether myocardial infarction (MI) may similarly increases occurrence of AD is unknown. In the current study, we performed a MI model in wild-type and AD-prone APP/PS1 mice and assessed the development of AD in these mice. We found that MI-treated mice of both wild-type and APP/PS1 behaved poorer in a social recognition test, the Morris water maze, and the plus-maze discriminative avoidance task, compared to sham-treated controls. Mechanistically, MI significantly increased the levels of reactive oxygen species, as well as increased deposition of amyloid-β peptide aggregates and phosphorylation of tau protein in mouse brain, two signature pathological features for AD. Moreover, the microglia in the MI-mice appeared to alter polarization to a more proinflammatory phenotype. Together, our data suggest that MI may be a predisposing factor for AD development.
Keywords
INTRODUCTION
A continuously increased prevalence of age-related diseases has been witnessed in recent years. Among these diseases, myocardial infarction (MI), dementia, and Alzheimer’s disease (AD) have been the critical ones and exhibited some internal correlation in occurrence [1]. Specially, therapeutic advances in treatment of MI have significantly improved survival rates of patients, and thus increase the importance of studying the effects of MI on future development of dementia and AD [2]. The affected brains in dementia and AD exhibit accelerated deposit of extracellular amyloid-β peptide aggregate (Aβ) plaques and intraneuronal neurofibrillary tangles by hyperphosphorylated tau proteins [3, 4]. These typical pathological changes in the diseased brain are the basic display of signature symptoms of dementia and AD, namely loss of learning potential and memory [5]. Indeed, some recent studies have addressed this association of MI with dementia in patients with MI by matched comparison to consistently conclude that MI was associated with higher risk of vascular dementia and this association was stronger in patients with stroke [6–8].
On the other hand, studies of the mechanisms underlying MI to increased risk of dementia and AD are limited. Theoretically, MI causes chronic brain hypoperfusion due to impaired left ventricular ejection fraction and low blood pressure [9]. Moreover, atrial fibrillation and hypokinesia of the left ventricle associated with MI can facilitate formation of intracardiac thrombi, the release of which to the brain could induce dementia [10]. On the other hand, brain hypoperfusion causes hypoxia in brain tissue, which may also contribute to late development of dementia and AD [11]. However, although there is a general consensus for the increased risk of post-MI development of dementia and AD, the experimental demonstration is lacking. Moreover, mechanistic investigations are greatly needed.
Here, we addressed this unsolved question by applying an MI model in wild-type and AD-prone APP/PS1 mice to assess the development of AD. We found that MI-treated mice of both wild-type and APP/PS1 behaved poorer in a social recognition test, the Morris water maze, and the plus-maze discriminative avoidance task, compared to sham-treated controls. Mechanistically, MI significantly increased the levels of reactive oxygen species (ROS), as well as increased deposition of Aβ and phosphorylation of tau protein in mouse brain. Moreover, the microglia in the MI-mice appeared to alter polarization to a more proinflammatory phenotype.
MATERIALS AND METHODS
Experimental and animal protocols
All experiments were performed in strict accordance with Guideline for Laboratory Animal Management, issued by Sichuan Academy of Medical Sciences. Male C57BL/6 mice and APPswe/PS1dE9 (APP/PS1) transgenic mice were both purchased from Liaoning Changsheng Biotechnology Co., Ltd (Shenyang, China). The mice were individually housed under a 12 h light-dark cycle (temperature: 25±1°C; humidity: 45±5%) with ad libitum access to water and food. Mice at 20 weeks of age were subjected to MI treatment.
MI model
MI was induced in male C57/BL6 mice and APP/PS1 mice at 20 weeks of age by ligation of the left anterior descending artery with 8–0 nylon sutures in the middle. The coronary occlusion was confirmed by the blanching of the apex. The sham-operated group received left thoracotomy only. The chest was closed with 4–0 sutures. Hemodynamic assessment was performed to validate the MI model. After anesthetization, a volume catheter of 1.2F pressure was connected to an Advantage PV-loop system, and then inserted into the left ventricle via right carotid artery. The hemodynamic parameters, LV pressure, and positive maximal pressure derivative (+dP/dt) were measured. The end systolic pressure-volume relationship was obtained after and before inferior vena cava occlusion. After MI, mice were kept for 1 month before analysis for AD development.
Immunostaining and ELISA
Infarction area in hearts was measured by Masson’s trichrome staining, using a Masson’s trichrome staining kit (HT15; Sigma-Aldrich, Billerica, MA, USA). The infarction size was calculated by the percentage of infarcted area to the left ventricle area. Primary antibodies for immunostainings were rabbit anti-ROS (Sigma-Aldrich), rabbit anti-Aβ antibody (EMD Millipore, Billerica, MA, USA), and goat anti-phosphorylated Tau (p-Tau) (Santa Cruz Biotechnology, Dallas, Texas, USA). Quantification was done based on 5 slides with a 150μm away from each other. Key factors/cytokines associated with inflammation, including iNOS, CD86, TNFα, IL-6, and IFNγ, were evaluated by ELISA using specific kits (R&D System, Los Angeles, CA, USA) in microglia from 4 groups.
DHE assays for ROS
ROS levels in brain tissue were measured using a dihydroethidium (DHE) assay. Briefly, brain tissue was preincubated with 20μmol/l DHE for 1 h, treated with alkylating agents, after which the red fluorescence was monitored at Ex/Em 520/610 nm by Fluorometer (Thermo Fisher, Waltham, MA, USA). Delta fluorescence over a 12 h period was calculated, normalized to cellular DNA content, and then expressed as % fluorescence compared with controls.
Flow cytometry
For isolation of microglia from the mouse brain, flow cytometry was performed, using the strategy of CD11b+CD45-low to determine microglia (versus CD11b+CD45-high for brain macrophages). The antibodies are FITC-conjugated anti-CD11b and PE-cy7-conjugated anti-CD45 (Becton-Dickinson Biosciences, San Jose, CA, USA). Data were analyzed and presented using FlowJo v11 (Flowjo LLC, Ashland, OR, USA).
Social recognition test
At 24 weeks of age or 4 weeks after MI, the mice were subjected to a social recognition test for evaluation of social recognition and memory. The experimental male mice at home cage were challenged 4 times with the same ovariectomized female mouse, and subsequently challenged in the 5th time with a novel ovariectomized female mouse. Each challenge lasted 5 min, followed by a 15 min break between two challenges. The time for an examined mouse to spend sniffing in the procedure was regarded as the social investigation time.
Morris water maze
At 24 weeks of age or 4 weeks after MI, the experimental mice were trained for locating the visible escape platform in 3 trials with an interval of 30 min in the first 2 days. From the 3rd to the 7th day, the platform was placed under the water surface for each examined mouse to explore 3 times per day at an interval of 1 min. The time latency for the mouse to locate the hidden platform in each trial was recorded.
Plus-Maze discriminative avoidance task
At 24 weeks of age or 4 weeks after MI, the experimental mice were placed at the center of the apparatus with exposure to both illuminating light and cold air blowing, to allow them to enter the enclosed arm in the training trials. One day later, mice were placed in the same position for 3 min without aversive stimuli. The relative time for the mice to stay in the aversive enclosed arm during training and testing was recorded.
Statistics
Statistical analysis was performed using GraphPad Prism 8.2 (GraphPad Software, San Diego, CA, USA). Analysis was done by one-way ANOVA with a Bonferroni correction, followed by Fisher’s Exact Test upon necessity. All values are depicted as mean±standard deviation (SD) and are considered significant if p < 0.05. Non-significance is presented as NS.
RESULTS
Induction of MI in mice
MI was performed in 20-week-old male mice from 4 groups of 10 each. Group 1: C57/BL6 (wild-type, WT), sham-operated; Group 2: C57/BL6, MI; Group 3: APP/PS1, sham-operated; Group 4: APP/PS1, MI (Fig. 1A). The heart function of these mice from 4 groups was then assessed using ventricular catheterization. We found that MI caused a significant reduction in the slope of end systolic pressure-volume relationship (Fig. 1B), a significant reduction in left ventricular end systolic pressure (Fig. 1C), and a significant reduction in positive maximal pressure derivative (+dP/dt) (Fig. 1D), in either strain of the mice. Moreover, no difference in these 3 values was detected between C57/BL6 and APP/PS1 mice, with or without MI induction (Fig. 1B–D). In order to assess the severity of MI, we used Masson’s trichrome staining to determine the collagen deposition in the heart tissue of each group. We found that MI significantly increased the infraction size in either strain and did not detect cross-strain difference in infraction size, shown by quantification (Fig. 1E), and by gross images (Fig. 1F). Together, these data suggest successful and equivalent establishment of heart injury by MI in C57/BL6 and APP/PS1 mice.
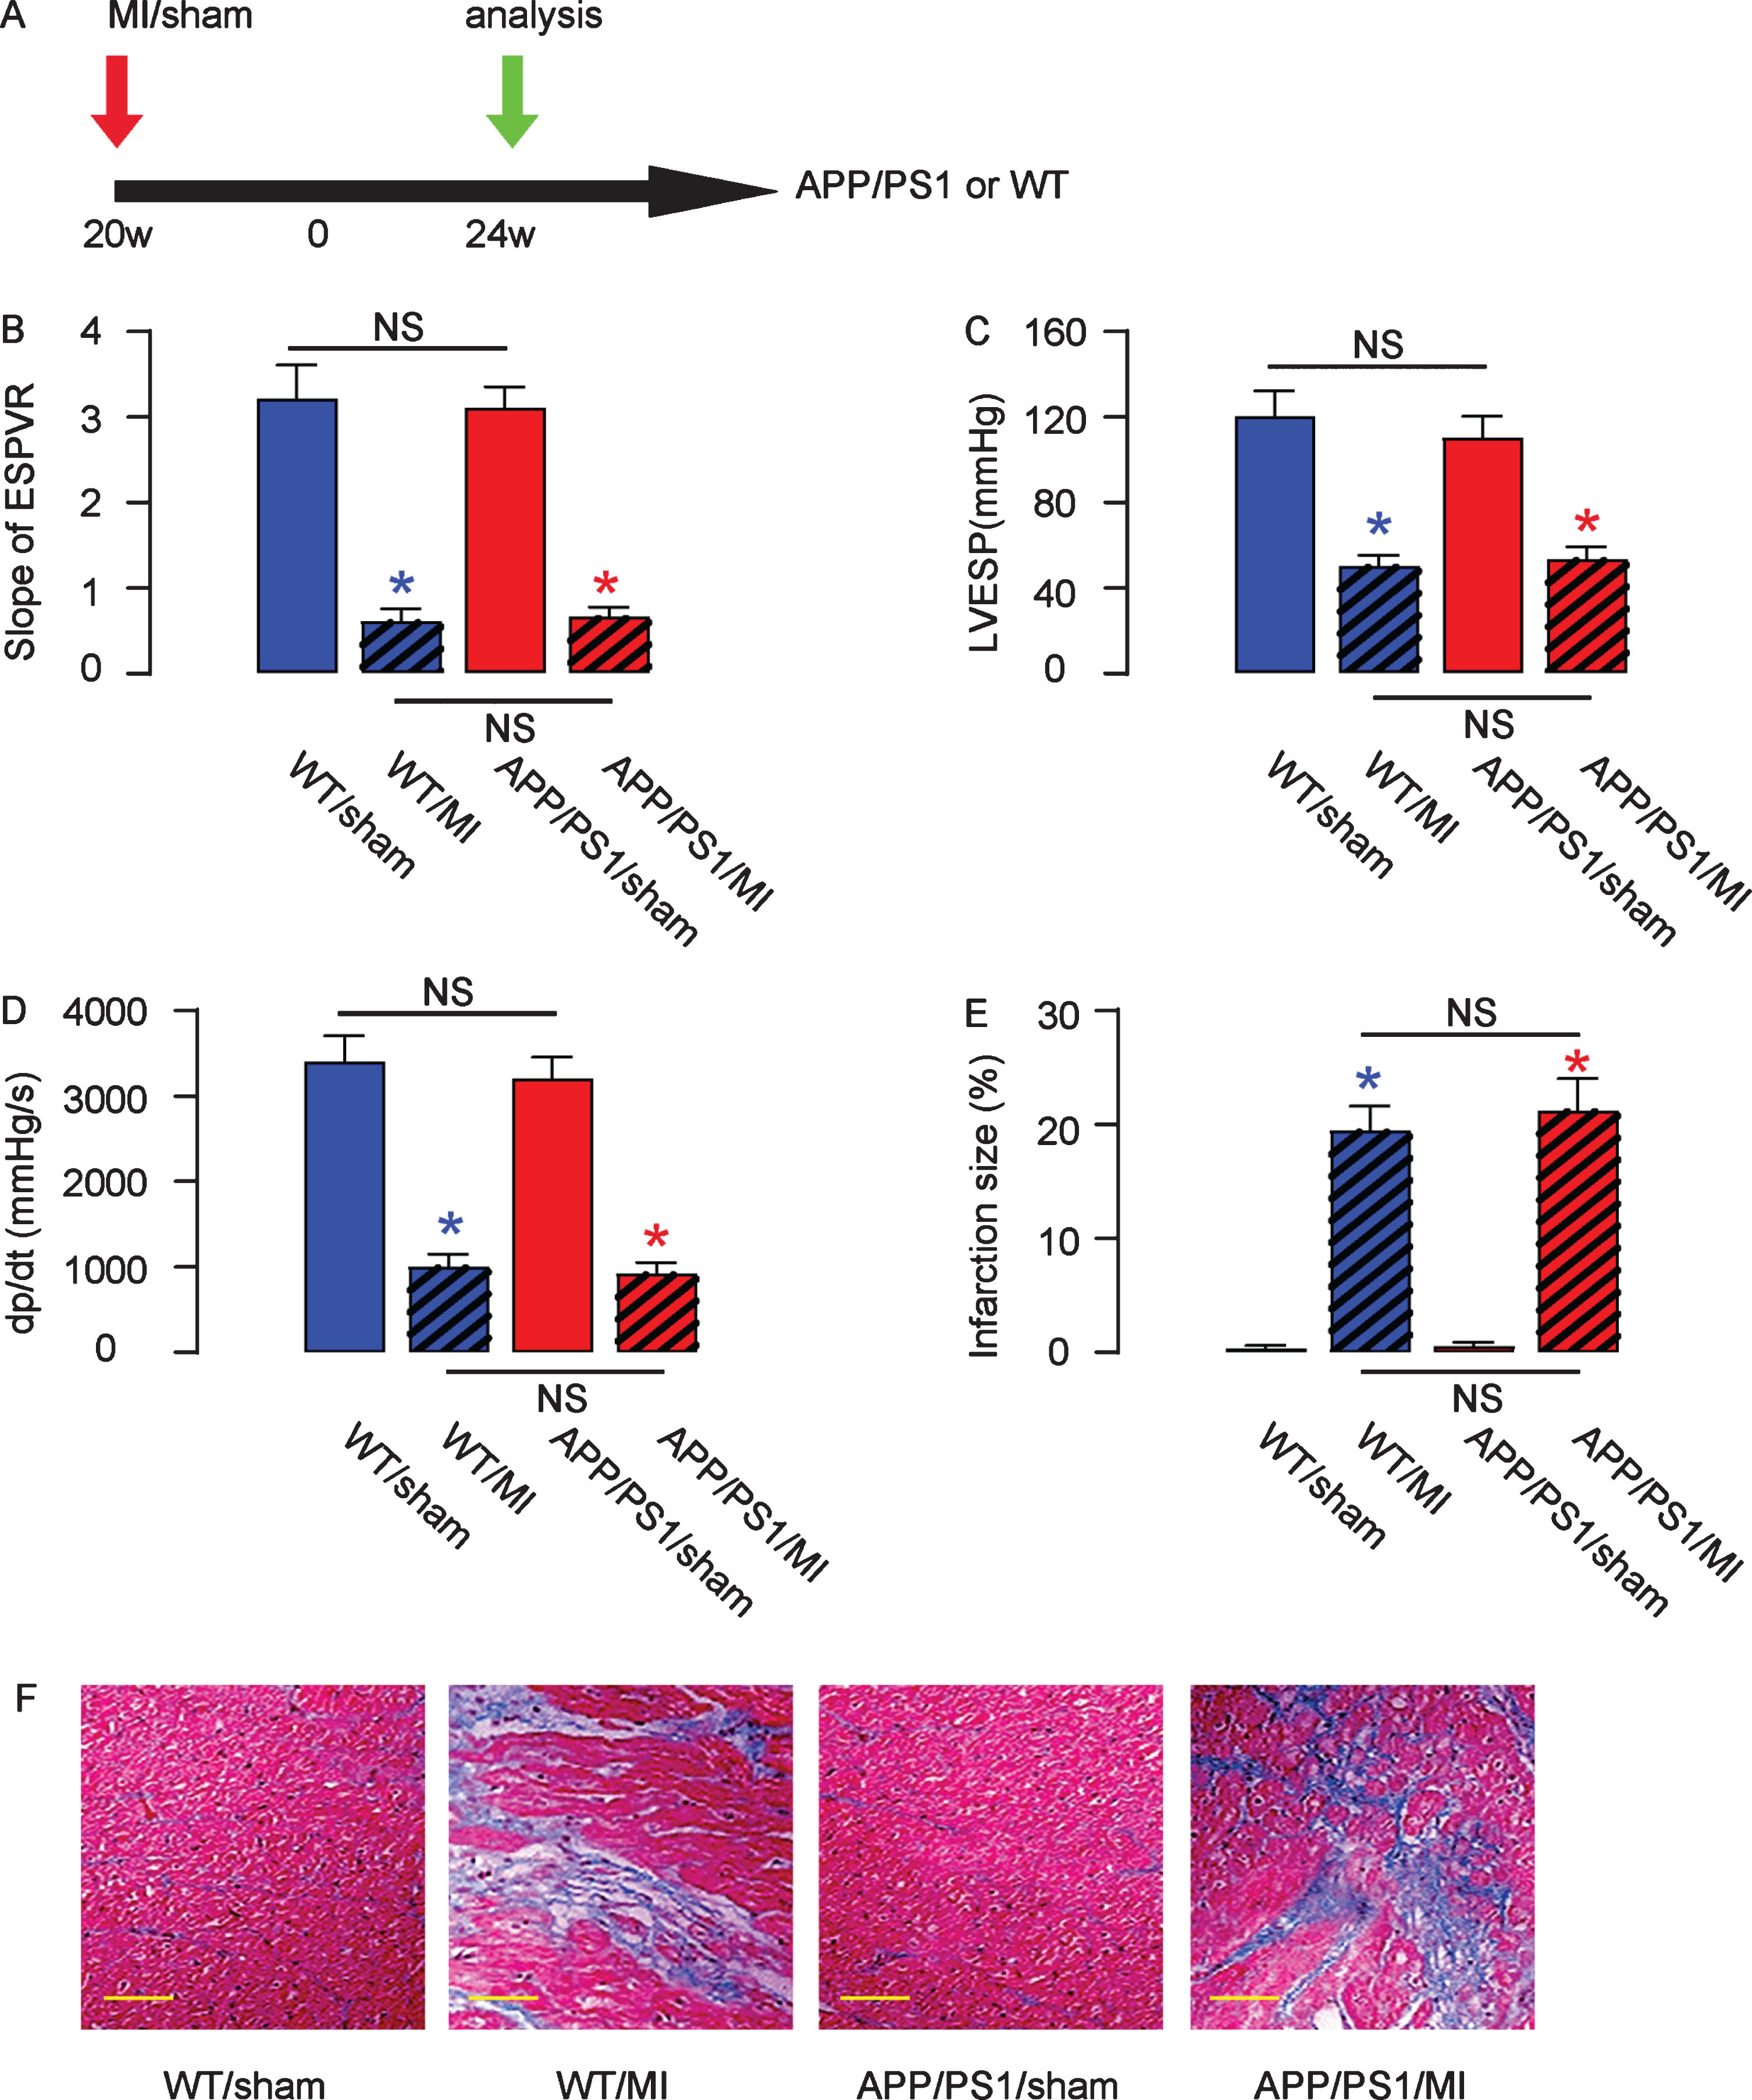
Induction of MI in mice. A) Experimental schematic: MI was performed in 20-week-old male mice from 4 groups of 10 each. Group 1: C57/BL6 (wild-type, WT), sham-operated; Group 2: C57/BL6, MI; Group 3: APP/PS1, sham-operated; Group 4: APP/PS1, MI. Four weeks after MI, the development of AD was assessed. B–D) The heart function of these mice from 4 groups was then assessed using ventricular catheterization. B) End systolic pressure-volume relationship (ESPVR), (C) left ventricular end systolic pressure (LVESP), and (D) positive maximal pressure derivative (+dP/dt). E, F) Masson’s trichrome staining to determine the collagen deposition in the heart tissue of each group, shown by quantification (E) and by gross images (F). *p < 0.05 (blue: C57/BL6; red: APP/PS1). NS, non-significant. N = 10. Scale bars are 50μm.
MI impaired mouse performance in late behavioral tests
Four weeks after MI, mice from the 4 groups underwent behavioral tests. In the social recognition test, the APP/PS1 behaved worse than C57/BL6 mice due to presence of the AD-prone transgene in both sham-group and MI-group (Fig. 2A). In either strain, compared to the sham-operated mice, MI-treated mice exhibited significantly poorer habituation responses to the repeatedly introduced stimulus mouse and significantly poorer dishabituation responses to the novel stimulus mouse (Fig. 2A). The Morris Water Maze test (Fig. 2B) and Plus-Maze Discriminative avoidance Task (Fig. 2C-D) showed similar results. These data suggest that both recognition and learning capacity are impaired in MI-treated mice.
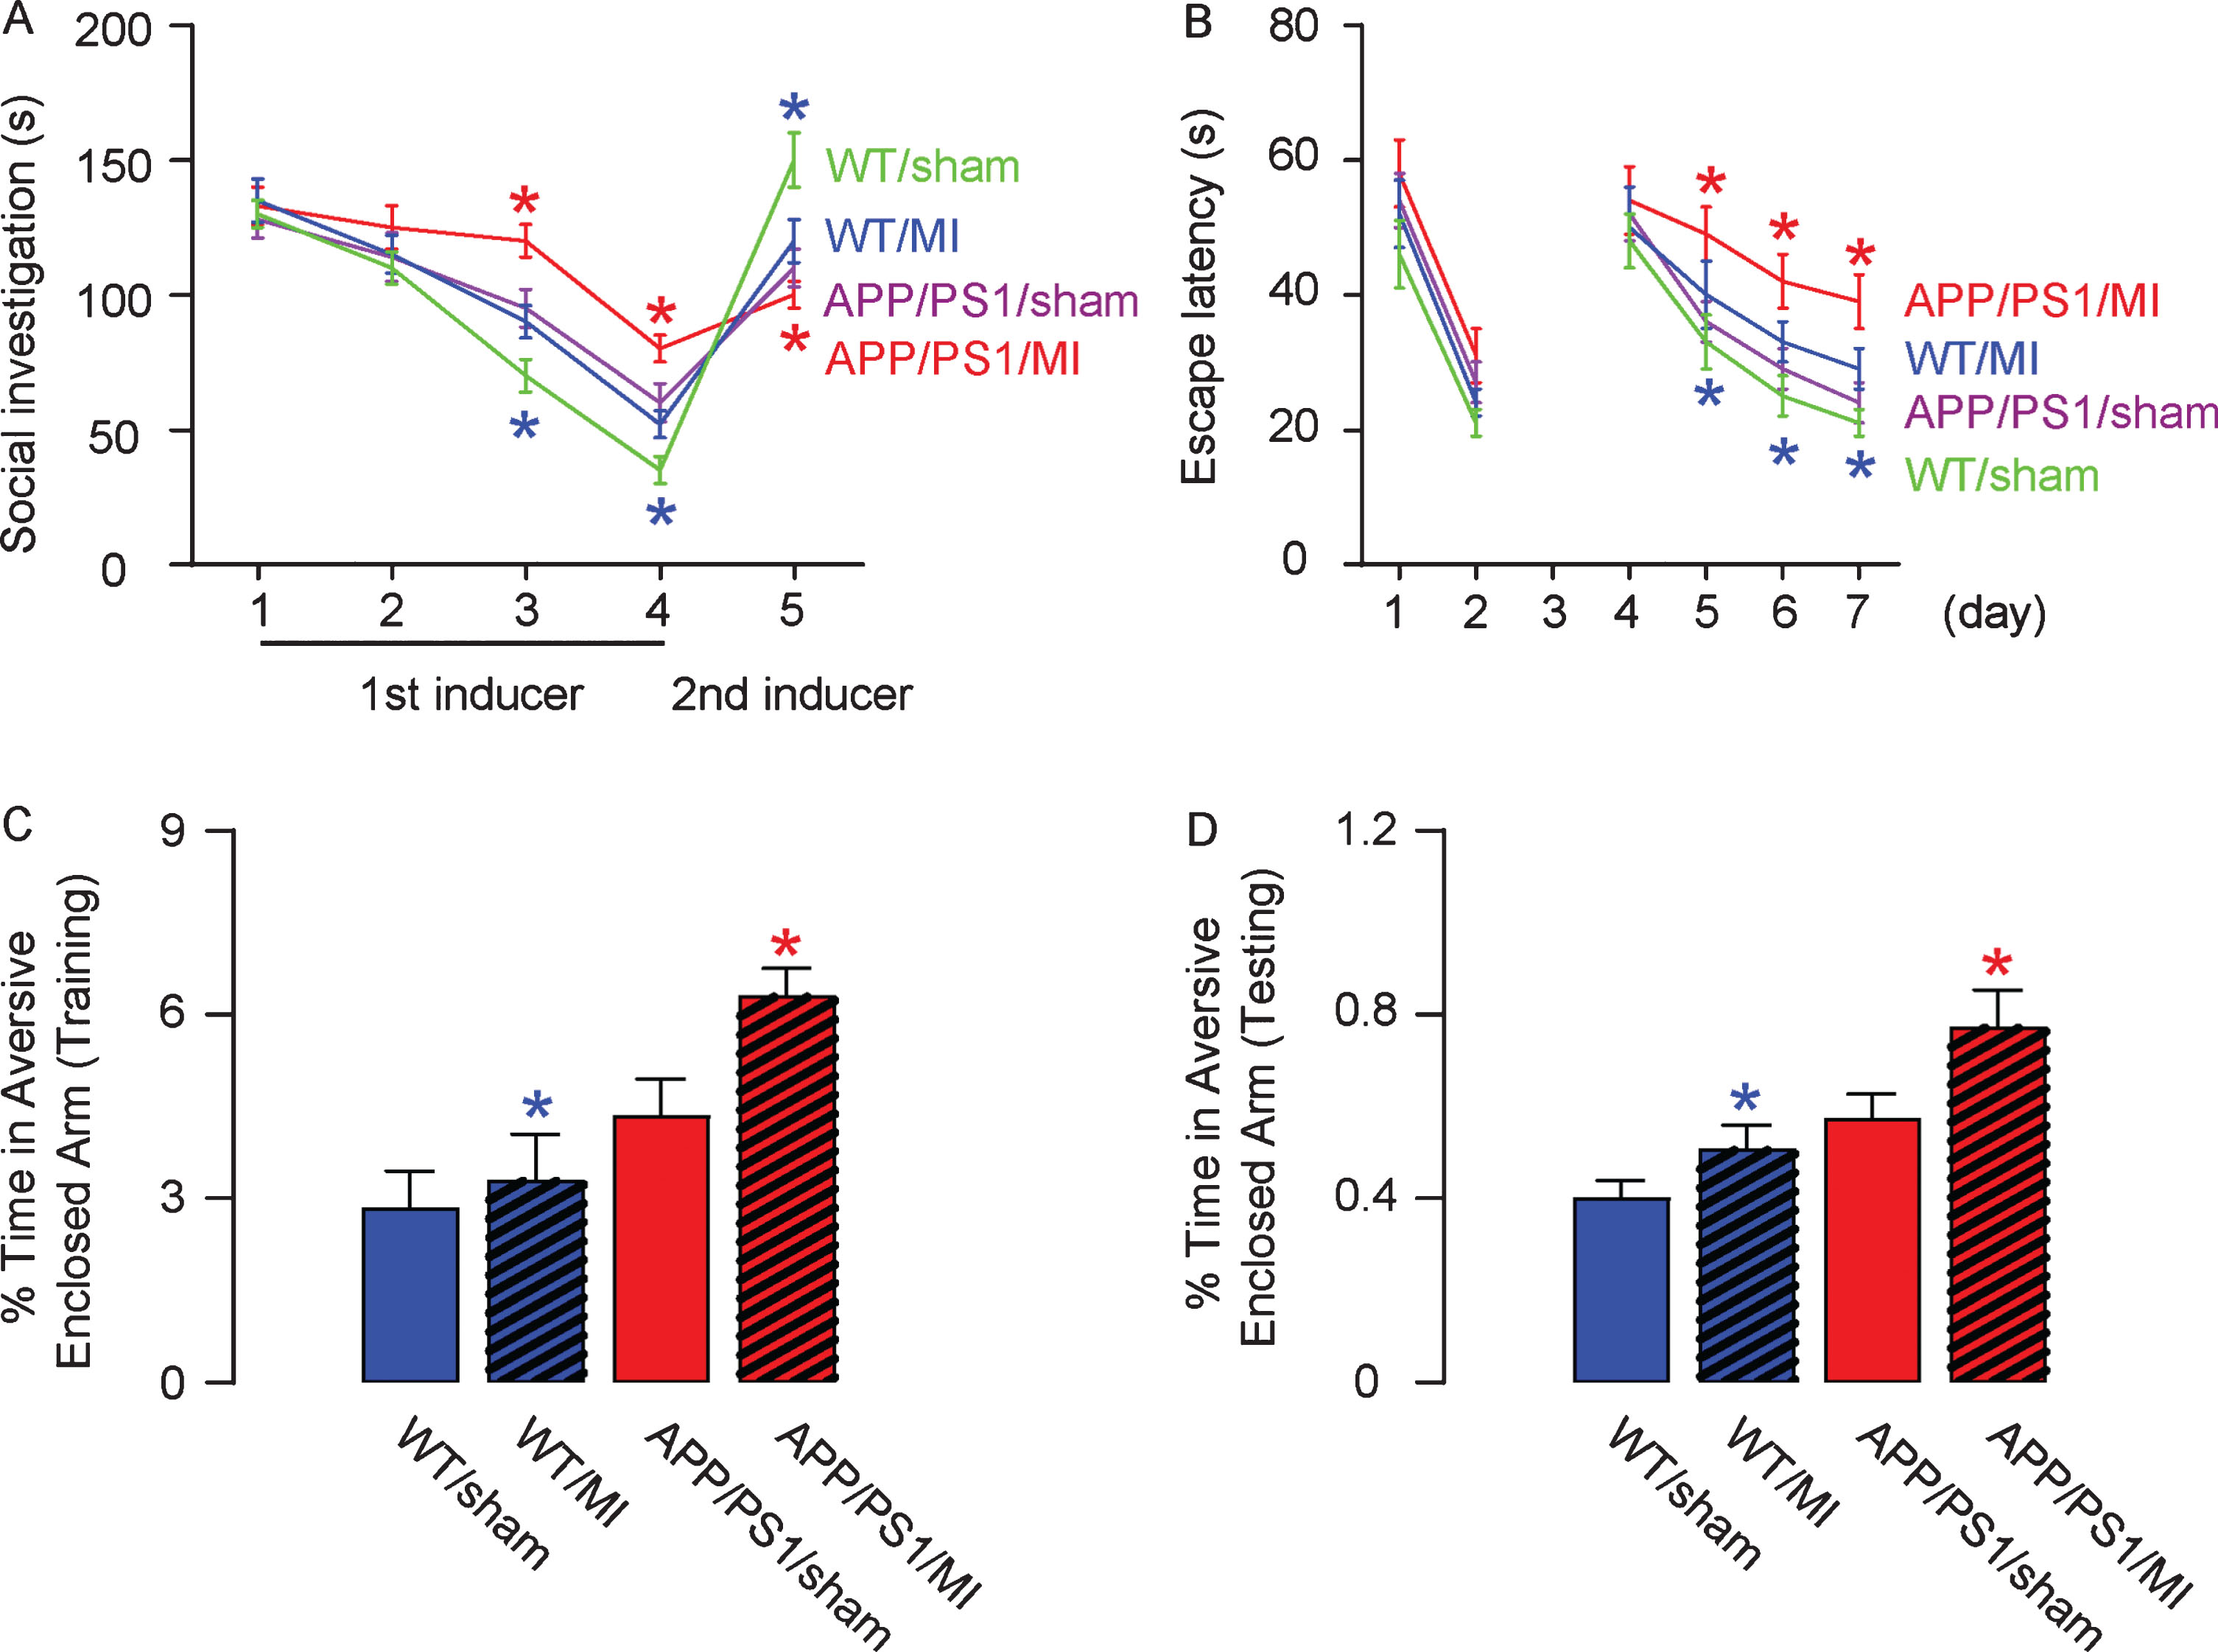
MI impaired mouse performance in late behavioral tests. Four weeks after MI, mice underwent a social recognition test (A), Morris Water Maze test (B), and Plus-Maze Discriminative avoidance Task (C, D). *p < 0.05 (blue: C57/BL6; red: APP/PS1). N = 10.
MI increases ROS production in mouse brain
To investigate the mechanisms underlying impaired recognition and learning capacity of the MI-treated mice, we analyzed the levels of ROS, since it is the major factor that mediates the hypoxia- and hypoperfusion-induced neuronal cell injury. By immunostaining (Fig. 3A, B) and by ROS assay (Fig. 3C), we detected significant increases in ROS levels in mouse hippocampus by MI in either strain. Thus, MI increases ROS production in mouse brain.
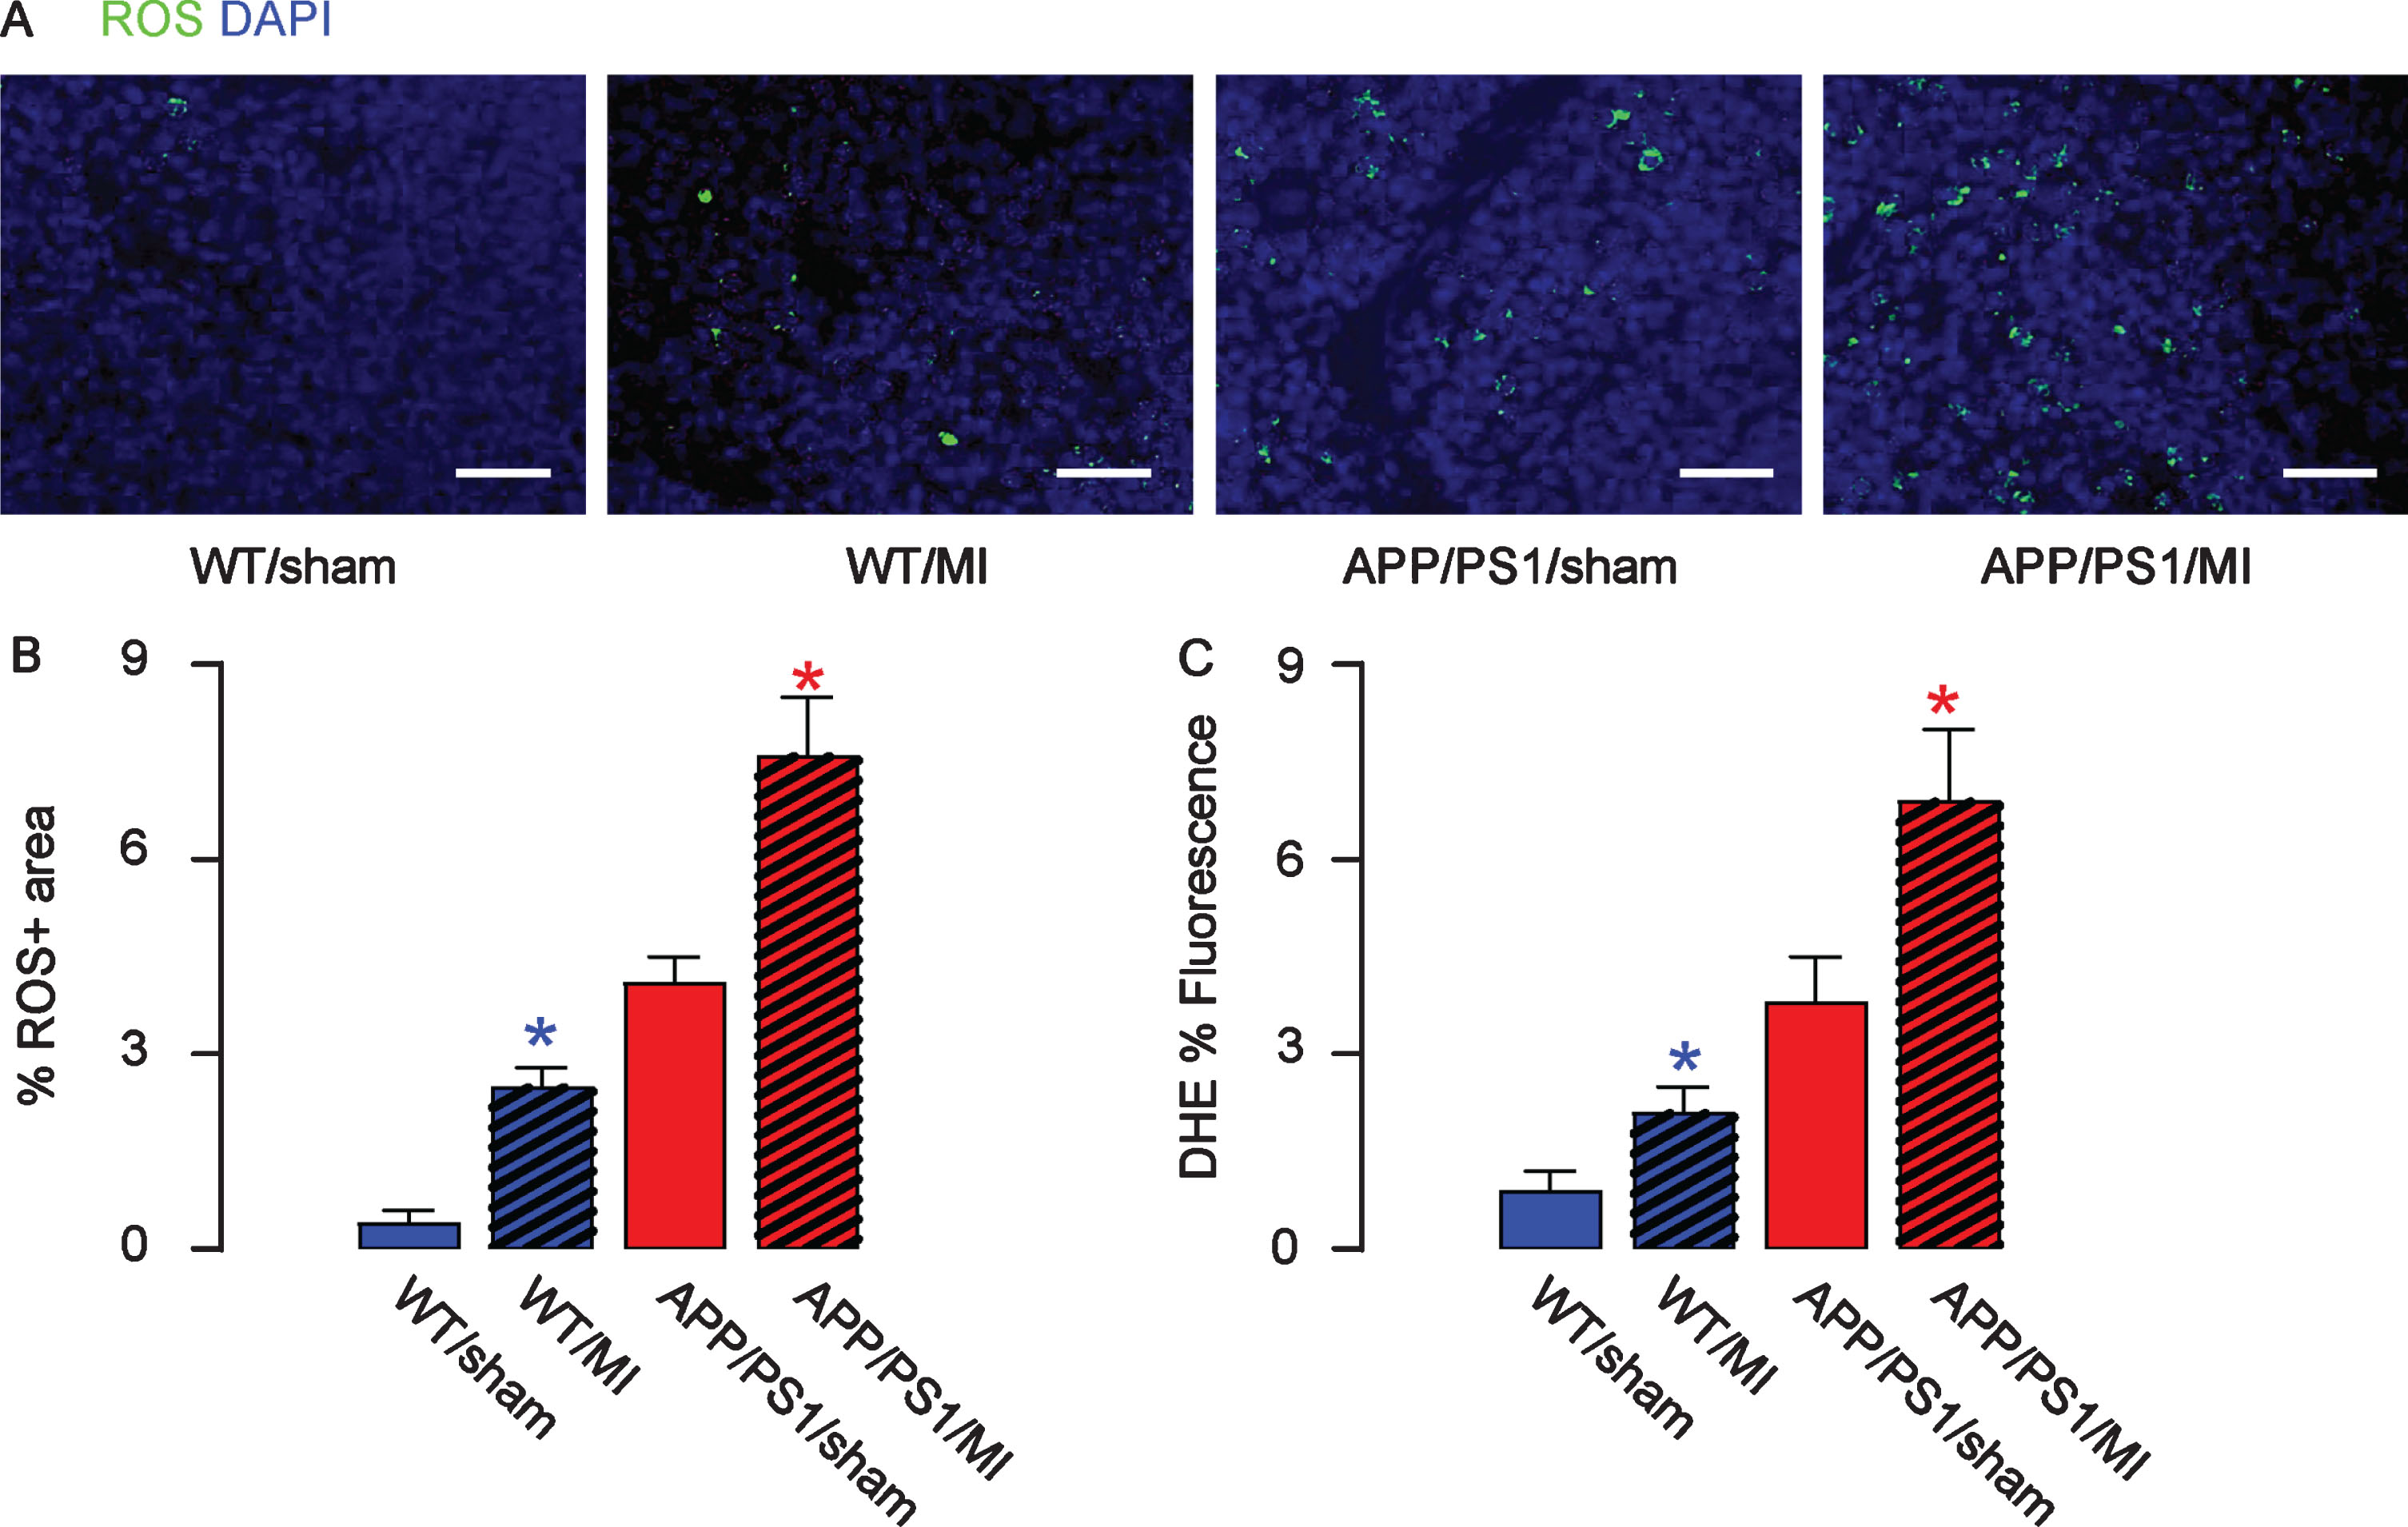
MI increases ROS production in mouse brain. The levels of ROS were assessed by immunostaining, shown by representative images (A), and by quantification (B) and by ROS assay (C), in mouse hippocampus. Thus, MI increases ROS production in mouse brain. *p < 0.05 (blue: C57/BL6; red: APP/PS1). N = 10. Scale bars are 50μm.
MI induces deposit of Aβ deposition in mouse brain
Deposit of Aβ plaques and phosphorylated tau (p-Tau) is a signature for AD-associated pathological changes in mouse brain, and could be a direct cause of underlying impaired recognition and learning capacity of the MI-treated mice. Hence, we analyzed the Aβ plaques and p-Tau in the mouse hippocampus. We detected significantly higher number of Aβ plaques in the hippocampus region in MI-treated mice, compared to sham-treated mice in either strain, shown by representative images (Fig. 4A), and by quantification (Fig. 4B). ELISA for Aβ was performed on mouse hippocampal tissue, showing similar results (Fig. 4C). Thus, MI induces deposit of Aβ deposition in mouse brain.
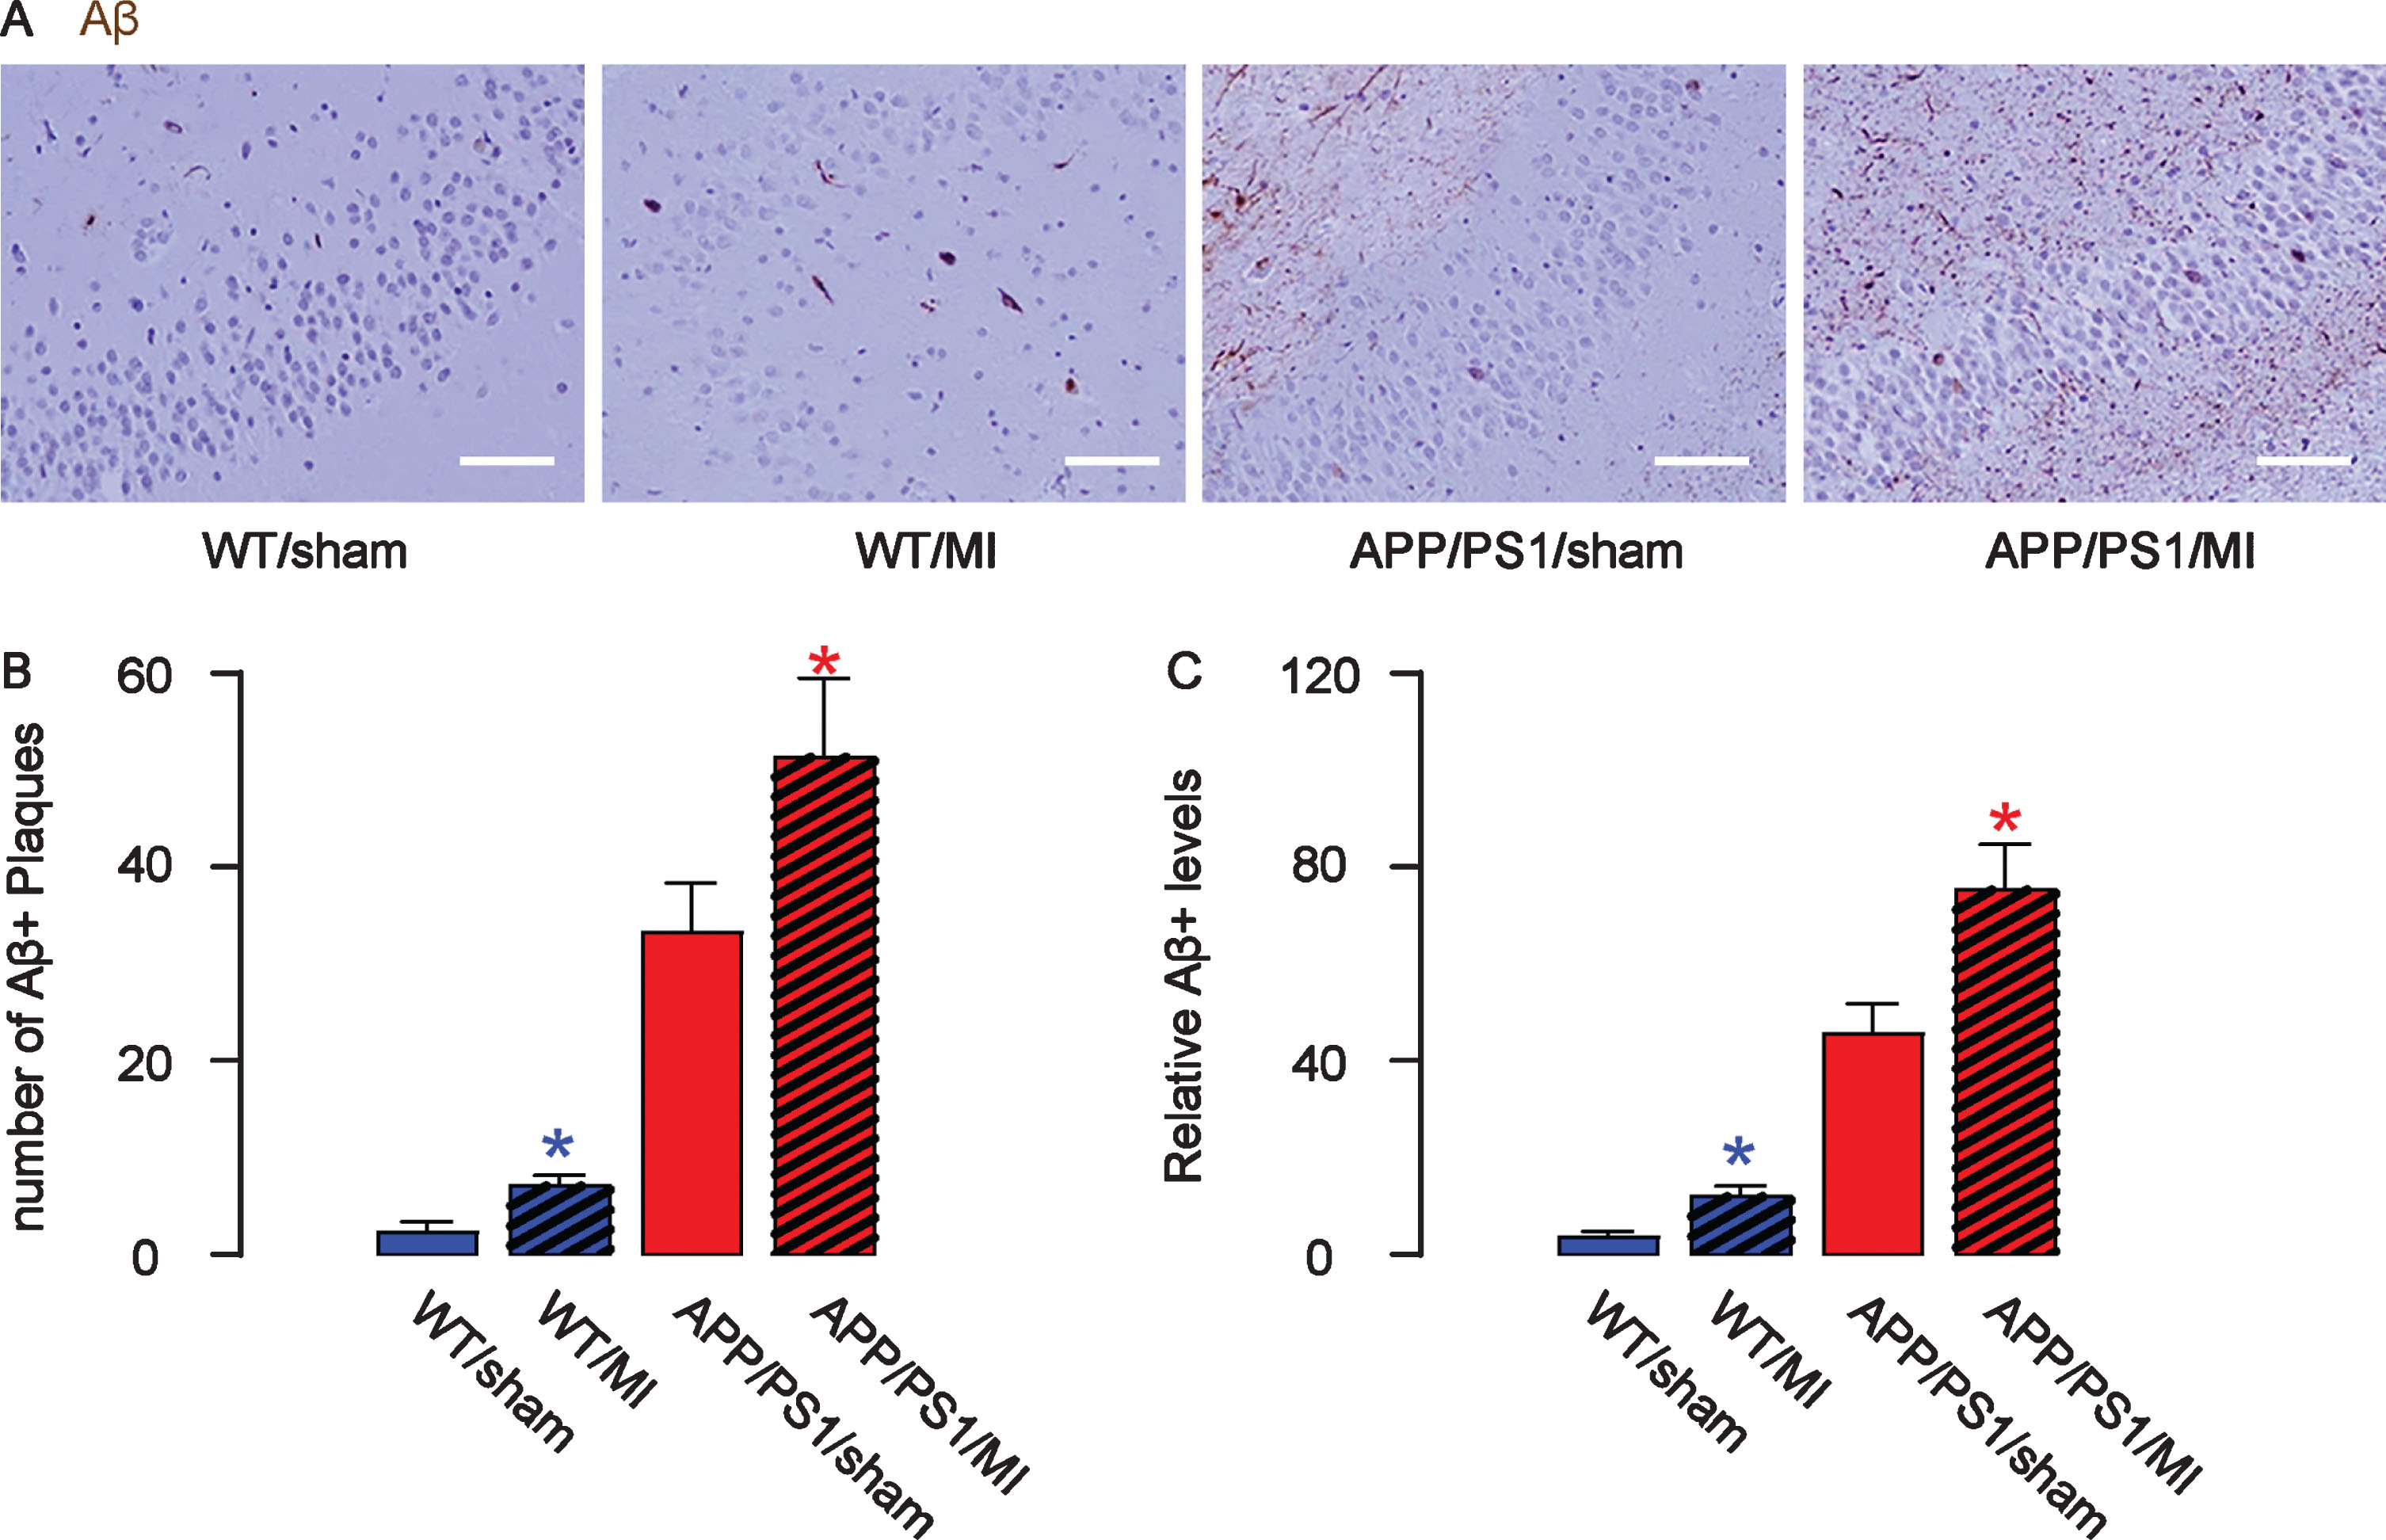
MI increases Aβ deposition in mouse brain. The number of Aβ plaques in the mouse hippocampus was quantified, shown by representative images (A) and by quantification (B). C) ELISA for Aβ levels in mouse hippocampus. *p < 0.05 (blue: C57/BL6; red: APP/PS1). N = 10. Scale bars are 50μm.
MI induces formation of p-Tau in mouse brain
Similarly, we detected significantly greater p-Tau area in the hippocampus region in MI-treated mice, compared to sham-treated mice in either strain, shown by representative images (Fig. 5A) and by quantification (Fig. 5B). ELISA for p-Tau was performed on mouse hippocampal tissue, showing similar results (Fig. 5C). Thus, MI induces formation of p-Tau in mouse brain.
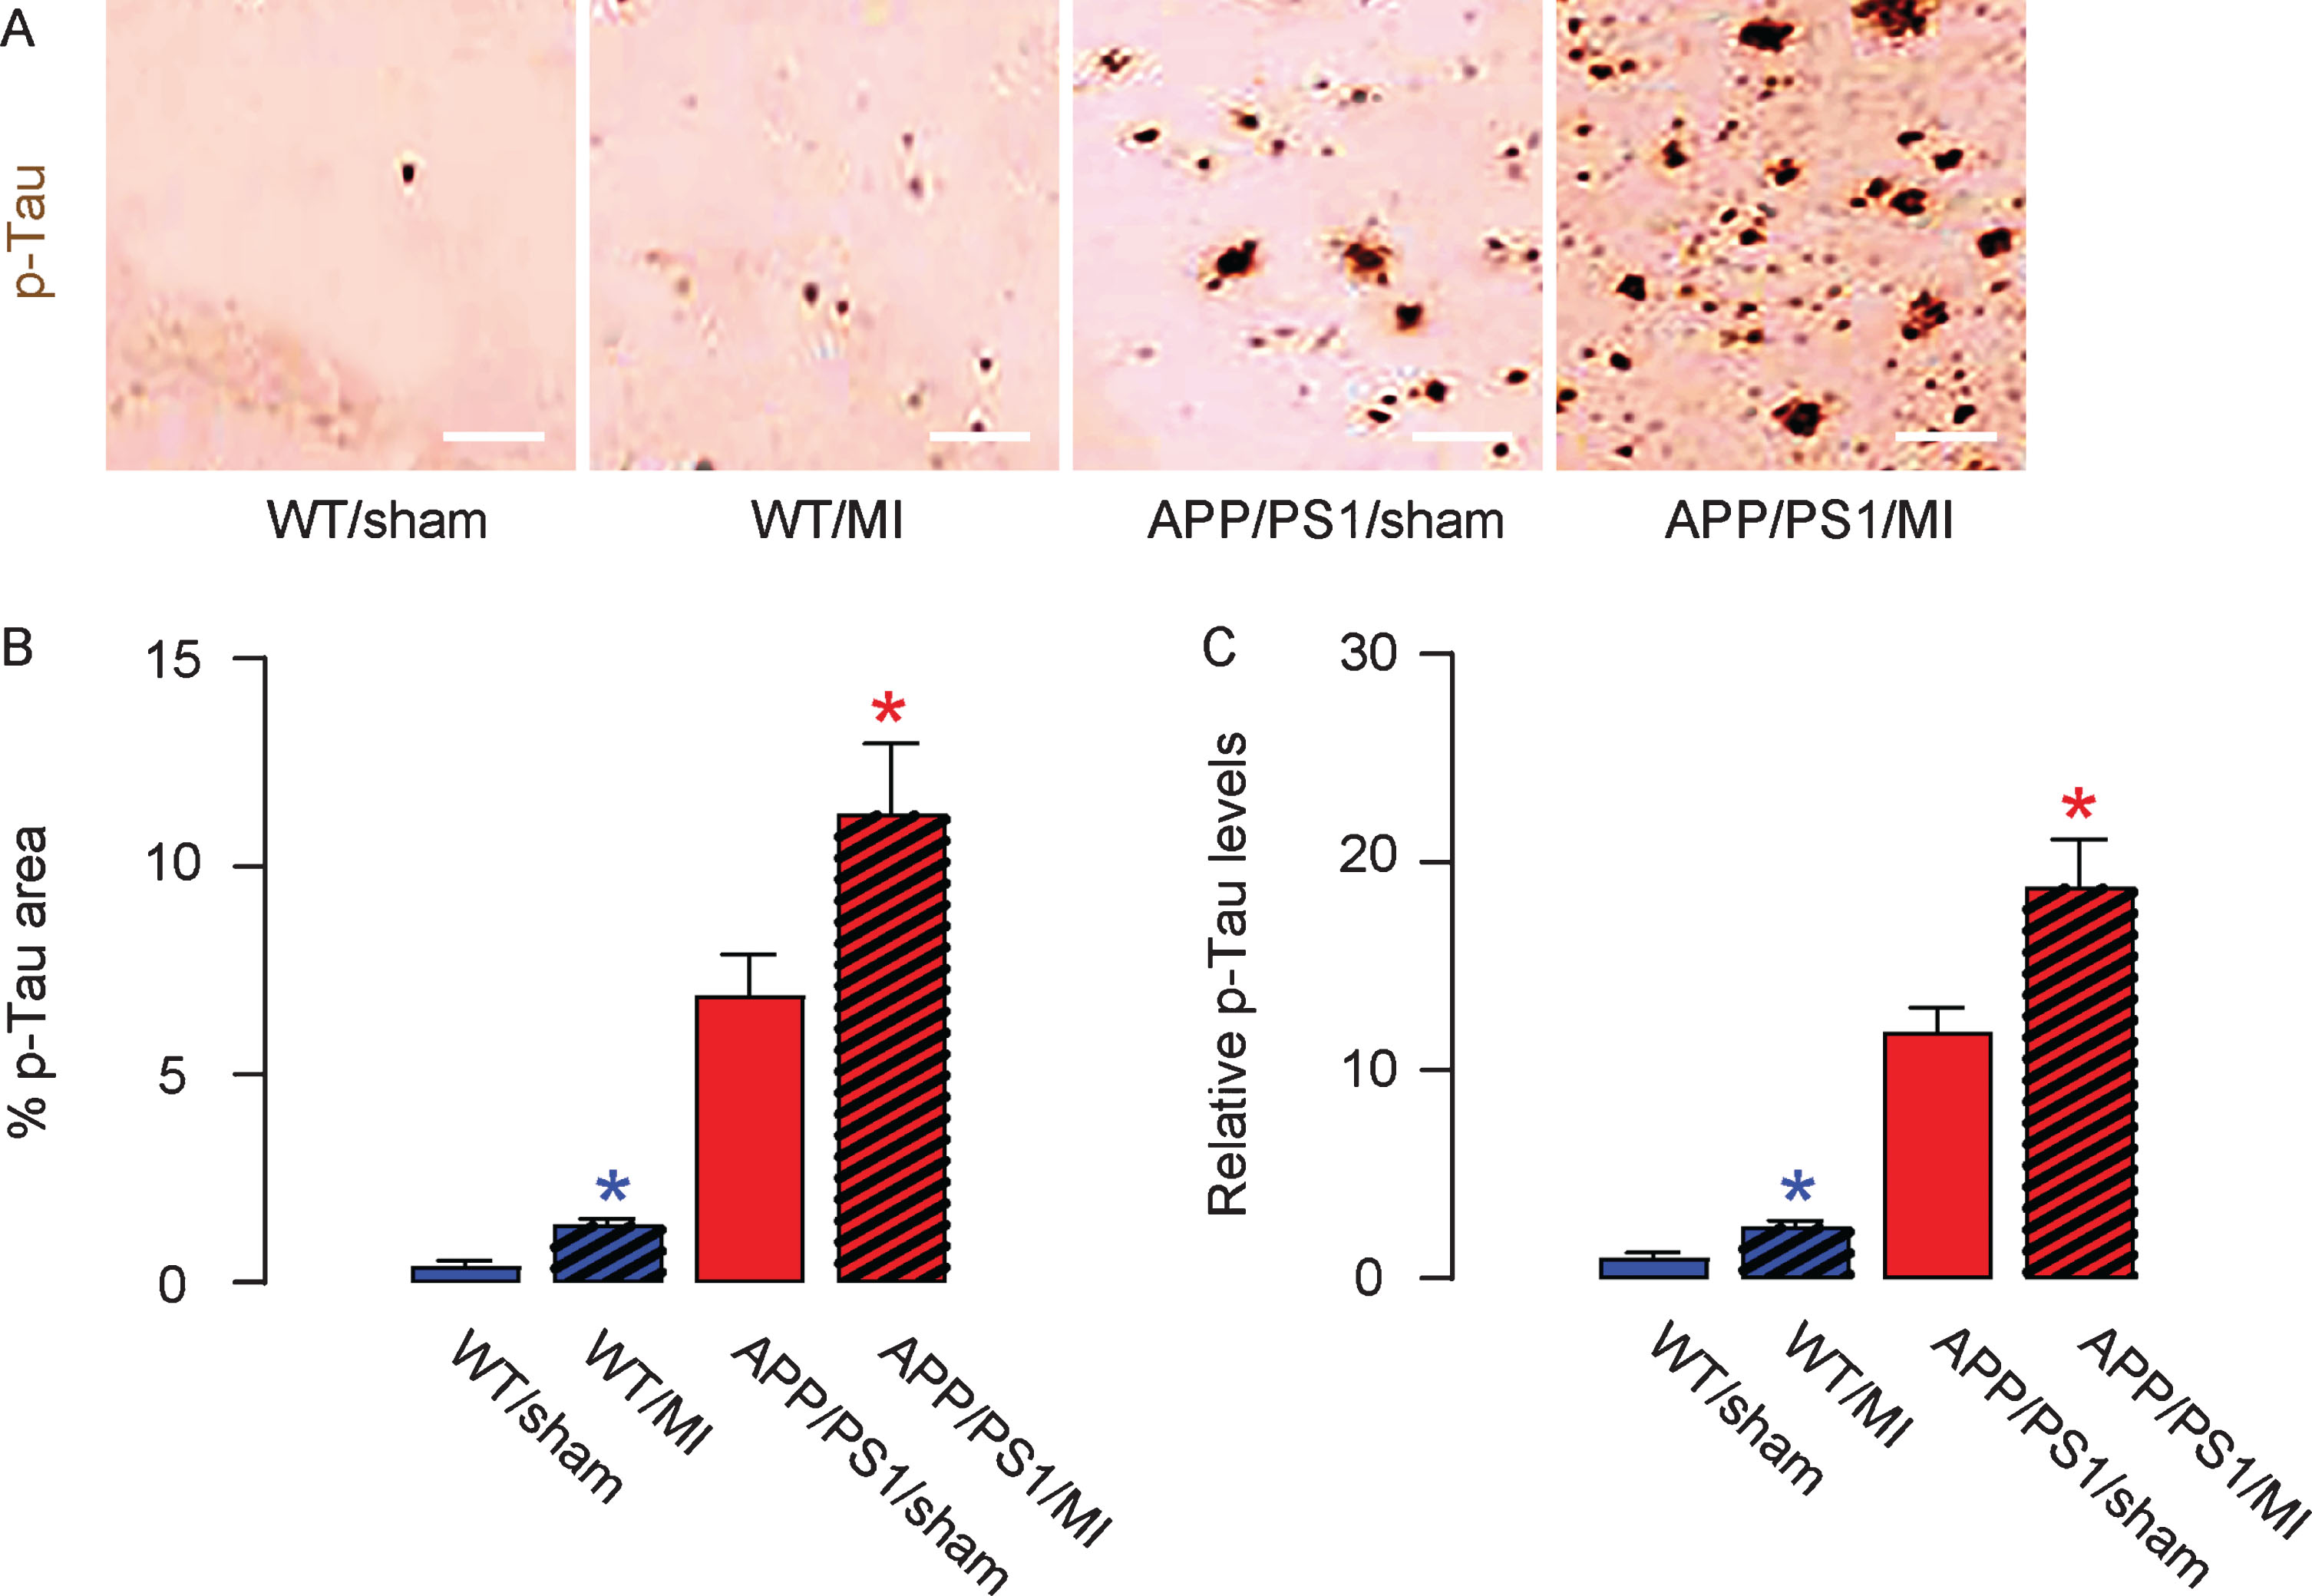
MI increases production of p-Tau in mouse brain. The phosphorylated Tau (p-Tau) area in mouse hippocampus was quantified, shown by representative images (A) and by quantification (B). C) ELISA for p-Tau levels in mouse hippocampus. *p < 0.05 (blue: C57/BL6; red: APP/PS1). N = 10. Scale bars are 50μm.
MI induces polarization of microglia to a more proinflammatory phenotype
Microglia are abundant in brain and coordinate multiple function associated with tissue responses to stressful situations like inflammation, hypoxia, and low nutrient. Thus, we isolated microglia from mouse hippocampus using the strategy of CD11b+ and CD45-low for flow cytometry (Fig. 6A). A combination of CD11b and CD45 labeling can be used to distinguish microglia from macrophages. Resting microglia are CD11b-high, CD45-low, whereas macrophages are CD11b-high, CD45-high. Key factors/cytokines associated with inflammation, including iNOS, CD86, TNFα, IL-6 and IFNγ, were evaluated by ELISA in microglia from 4 groups, showing significant increases in MI-treated mice regardless of the mouse strain (Fig. 6B). These data suggest that MI may induce polarization of microglia to a more proinflammatory phenotype to promote the AD progression.
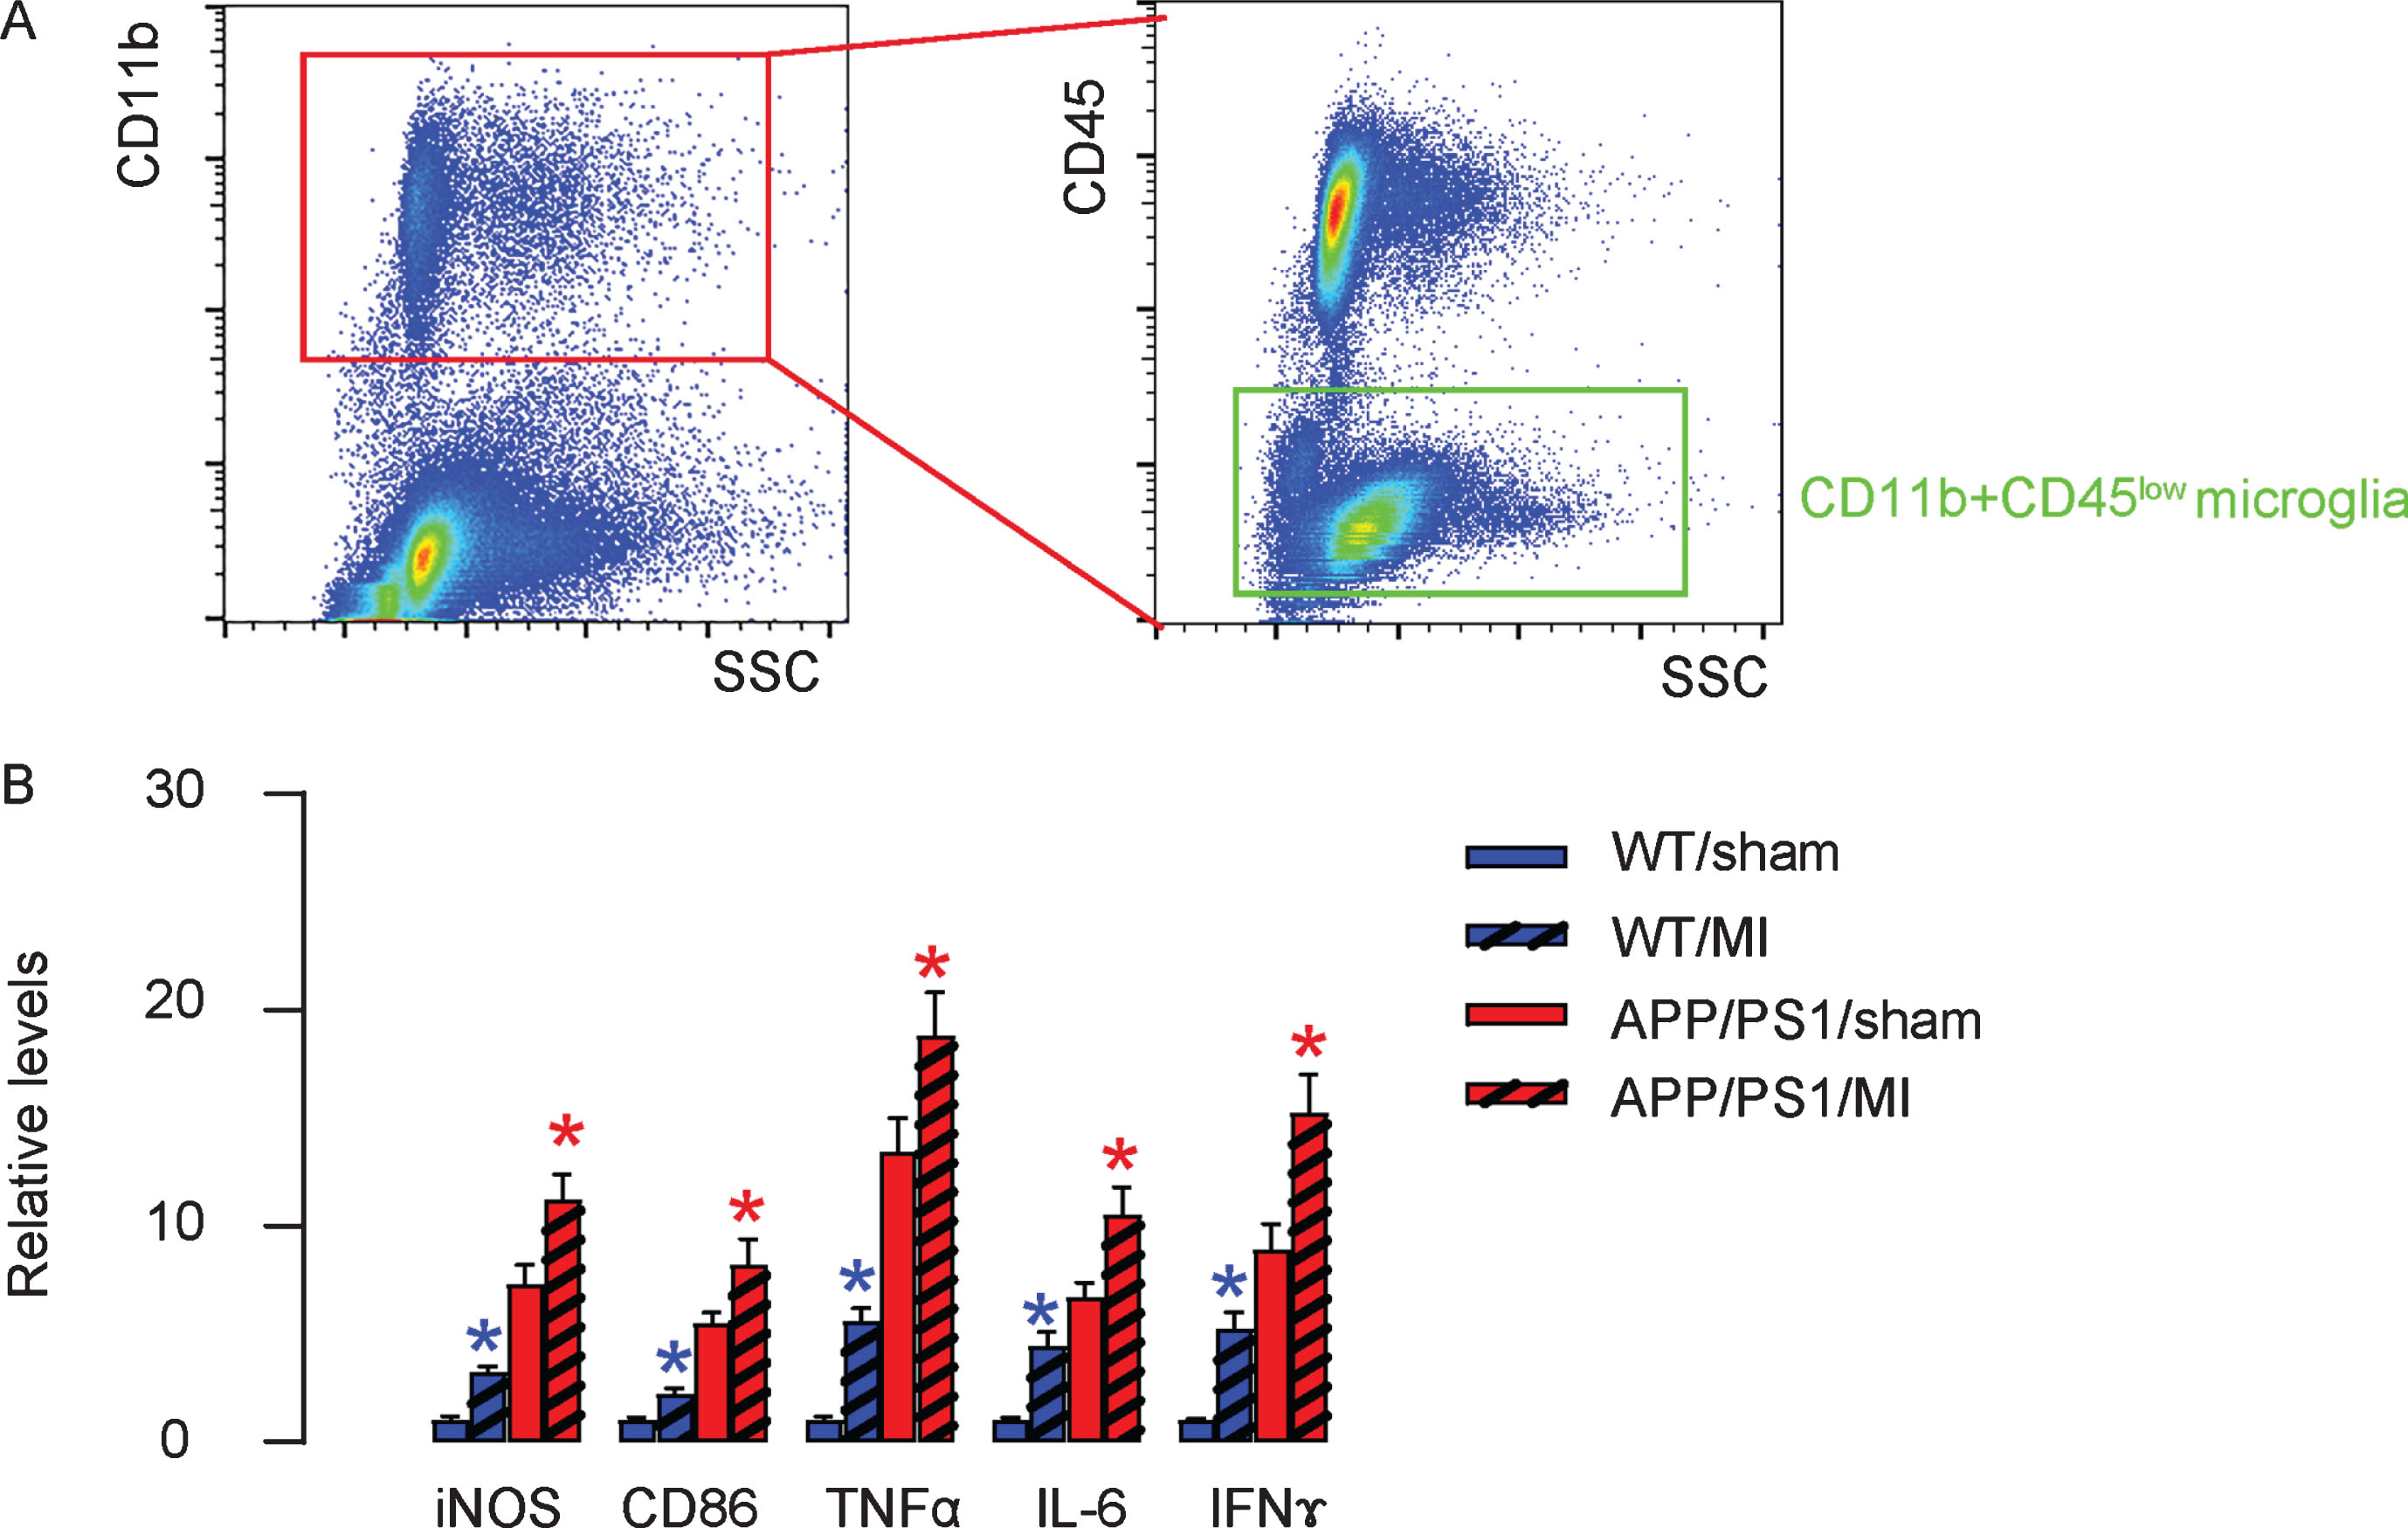
MI induces polarization of microglia to a more proinflammatory phenotype. A) Microglia were isolated from mouse hippocampus using the strategy of CD11b+ and CD45-low in flow cytometry. B) Key factors/cytokines associated with inflammation, including iNOS, CD86, TNFα, IL-6, and IFNγ, were evaluated by ELISA in microglia from 4 groups. *p < 0.05 (blue: C57/BL6; red: APP/PS1). N = 10.
DISCUSSION
The risk of developing dementia and AD may include several mechanisms. As mentioned earlier, the chronic or short-term hypoxia and hypoperfusion by MI are direct hazards to neuronal cells, which are very sensitive to these stresses [9–11]. Moreover, in patients, MI often develop on the basis of aggravated atherosclerosis and chronic ischemia of peripheral tissues [12]. Additionally, formation of emboli after MI, together with atrial fibrillation or regional wall motion abnormalities, can facilitate the possible occurrence of cerebral embolization, leading to ischemic stroke or hemorrhagic stroke to develop dementia or AD in a late stage [9–11].
While it is well accepted that these disorders contribute to development of dementia and AD, it is relatively controversial about the direct triggers. The amyloid cascade hypothesis has dominated the field of AD research for a very long period until its failure in clinical trials [13]. The other candidate theories include Tau theory [13] and ROS theory [14]. Indeed, formation of hyperphosphorylated tau and formation of ROS also characterize the pathogenesis of AD, but is under-investigated. In the current study, we detected significant increases in all these 3 featured pathological changes, Aβ, p-Tau and ROS, thus solidly linking MI with development of dementia and AD.
Our most interesting finding was the alteration of polarization of microglia in the mouse brain after MI, showing increases in major pro-inflammatory factors, iNOS, CD86, TNFα, IL-6, and IFNγ. iNOS is inducible nitric oxide synthase, which produces large amounts of nitric oxide in microglia in response to inflammation [15]. CD86 is a protein expressed on antigen-presenting cells that provides costimulatory signals necessary for T cell activation and survival [16]. TNFα, IL-6, and IFNγ are well characterized pro-inflammatory cytokines [17]. All 5 proteins are predominantly produced by pro-inflammatory microglia or M1 microglia; CD86 can be also generated by a subpopulation of M2-like microglia, M2b, which is a pro-inflammatory M2 type [16]. Thus, the alteration in microglia phenotype committed them to promote cerebral inflammation, and subsequent development of neuronal disorders like AD.
To the best of our knowledge, this is the first study to provide strong evidence to indicate a direct effect of MI on late development of AD with a possible contribution by microglia. The exact of function of microglia in the mechanism still needs further investigation, which is left unanswered in the current study. Future studies may address it using proper loss-of-function experiments, e.g., to stabilize the microglia polarization or to prevent their pro-inflammatory activation, and examine its effect on MI-induced development of AD. These approaches with the conclusion from the current study may enable us to better understand the relationship of MI to the development of neurodegenerative diseases.
DISCLOSURE STATEMENT
Authors’ disclosures available online (https://www.j-alz.com/manuscript-disclosures/19-1225r1).