
Abstract
Background:
An early symptom of Alzheimer’s disease (AD) is a disturbance of the circadian rhythm that is associated with disrupted sleep/wake cycles.
Objective:
To investigate if BMAL1, a key gene that drives the circadian cycle, is epigenetically regulated in brains in relation to longitudinal changes in cognition, sleep quality, and AD neuropathology.
Methods:
Frontal cortex tissues were acquired from the Manchester Brain Bank (N = 96). DNA methylation at six CpG sites at the promoter of BMAL1, determined using bisulfite pyrosequencing, was tested for associations with Braak stage, CERAD score and Thal phase, longitudinal changes in cognition, sleep measurements and cross-section measures of depressive symptoms (BDI score).
Results:
Methylation across all the CpGs strongly correlated with each other. We found increased CpG2 methylation with higher Braak (t(92), p = 0.015) and CERAD (t(94), p = 0.044) stages. No significance was found between longitudinal fluid intelligence, processing speed and memory tests, but methylation at CpG1 (r = 0.20, p = 0.05) and CpG4 (r = 0.20, p = 0.05) positively correlated with vocabulary. CpG2 positively correlated with cross-sectional fluid intelligence (r = 0.20 p = 0.05) and vocabulary (r = 0.22 p = 0.03). Though longitudinal analysis revealed no significance between sleep duration, midsleep and efficiency for any of the CpG sites, CpG3 (B = 0.03, 95% CI, p = 0.03) and CpG5 (B = 0.04, 95% CI, p = 0.01) significantly correlated with night wake. CpG4 correlated with depressive symptoms (B = –0.27, 95% CI, p = 0.02).
Conclusion:
Methylation of BMAL1 associated with tau pathology, changes in cognitive measures, a measure of sleep and depressive symptoms, suggesting an involvement of the circadian cycle.
INTRODUCTION
Sleep disorders and sleep-wake rhythm disturbances are typical symptoms of Alzheimer’s disease (AD) that may precede the other clinical signs of this neurodegenerative disease [1]. Insomnia, excessive daytime sleepiness, and sun-downing are among the most common reported disturbances and AD patients show decreased sleep efficiency and increased latency to REM sleep, together with disturbances in sleep-wake cycles [2, 3]. Alterations in the diurnal rhythm of activity and sleep due to circadian rhythm dysregulation often occur early in the course of the disease and may even precede the development of cognitive symptoms [4]. Decreased robustness of circadian rhythms has been associated with increased risk of future dementia in an elderly cohort [5], while sleep fragmentation appears to impart a higher risk of subsequent AD [6].
A hallmark of AD is a deficit in executive functioning affecting skills such as working memory, fluid intelligence, and processing speed, and the frontal cortex has been widely associated with these functions. The frontal cortex is also highly sensitive to sleep changes [7]. A PET study found that changes in this region, including the superior frontal gyrus, were present in patients with mild cognitive impairment that progressed to AD compared to those that did not [8]. Accumulating evidence, especially in animal models, suggests that circadian clock dysfunction could promote neurodegeneration and contribute to AD pathogenesis. Studies in transgenic AD mice models have found that chronic sleep restriction and deprivation exacerbates AD pathology in brains, including increased amyloid-β (Aβ) and phosphorylated tau [9 –11]. A recent study in humans found that circadian dysfunction could contribute to the earliest stages of AD pathogenesis, with increasing AD-related neurodegeneration, as measured by cerebrospinal fluid (CSF) levels of phosphorylated tau to Aβ42 ratio, associated with fragmentation of circadian rest-activity rhythms [12]. This may further relate to dysregulation of the orexinergic system found in AD [13]
Increases in AD pathology are further linked to alterations and degradation of key circadian clock factors important in controlling regulation of circadian rhythm. Song et al. [14] found the changes in circadian rhythm caused by Aβ, correlated with the accelerated degradation of BMAL1 in transgenic mice containing AD mutations. BMAL1 (Brain and Muscle ARNT-Like 1) also known as ARNTL (Aryl hydrocarbon receptor nuclear translocator-like protein 1) is a core component in the regulation of the circadian rhythm and studies have shown that methylation of CpG sites in the promoter of BMAL1 can lead to epigenetic silencing in the expression of the gene [15]. Taniguchi et al. [16], found epigenetic silencing of BMAL1 prevented the activation of CLOCK protein to targeted areas, leading to the disruption of circadian rhythm in malignant cells. These findings suggest the epigenetic inactivation of BMAL1 contributes to disruption of the cellular circadian clock. Investigating the role of epigenetic regulation of BMAL1 in AD, Cronin and colleagues found altered circadian transcription of the gene in mid frontal cortex and fibroblasts, that associated with abnormal promoter methylation when compared with controls [17]. Interestingly, they further detected differences in oscillatory patterns of methylation between early and late AD cases in fibroblast cells and within brains when related to time of death suggesting alterations in circadian rhythm.
Depression is a risk factor for AD and studies find with lifetime depression associates with 2- to 4-fold increased risk of developing AD [18]. A recent large study found increased odds for dementia diagnosis after depression, even when the depression occurred 20 years or more before the dementia diagnosis [19]. Depression and stress have been linked to damage of neurons together with an increase in AD-related pathology, indicating a link between the two. Chronic stress in a rat model was found to increase levels of phosphorylated tau in the hippocampus and frontal cortex of depressive animals. Human studies have found that neurofibrillary tangles accumulate in greater numbers in the hippocampus of AD patients with depression than in those without depression [20, 21]. Disruptions in circadian rhythms have been associated with depression [22] and individuals with an arrhythmic biological clock have a higher risk of developing depression [23]. Linked to this, BMAL1 has been found to be hypermethylated in patients with bipolar disorder compared to healthy controls [24] suggesting that altered epigenetic regulation of circadian clock genes may provide a mechanistic basis for circadian rhythms and depressive symptoms [25].
That disturbances in sleep-wake cycles together with depression occur early in AD, and that preclinical changes and disruptions in circadian rhythm are linked to both suggest that circadian regulation may be a key factor linking these symptoms in the disease. Studies suggest that epigenetic regulation of BMAL1 plays an important role in AD via deregulation of circadian rhythms. However, the link between epigenetic changes in circadian regulatory factors in the brain in relation to sleep and depression in AD has yet to be fully explored. The aim of this study was to investigate mechanisms underlying the possible role of BMAL1 epigenetic regulation within frontal cortex of AD brains in relation to neuropathology, cognition, depressive symptoms, and sleep.
METHODS
Study population
Fresh, frozen tissue was taken from superior frontal gyrus (Brodmann area 8) of the frontal cortex from 96 brains of donors who were participants of a large prospective cognitive aging cohort known as The University of Manchester Longitudinal Study of Cognition in Normal Healthy Old Age cohort (UMLCHA) [26, 27]. Samples were acquired through the Manchester Brain Bank with ethical approval granted from the Manchester Brain Bank Committee. AD neuropathology were determined using the National Institute on Aging-Alzheimer’s Association guidelines [28] (Supplementary Table 1).
The study took place over five waves between 1982 and 2010 during which a number of Personal Details Questionnaire (PDQ) were performed by the participants themselves. The first PDQ questionnaire was performed in recruitment until 1995; along with the Beck Depression Inventory (BDI) as a measure of depressive symptoms. The second PDQ questionnaire was performed between 1984 and 1996 and the third PDQ was performed between 2001 and 2003. The fourth and fifth PDQ were completed in 2007 and 2010, respectively [29].
The fifth wave also included validated sleep questionnaires, including the Pittsburgh Sleep Quality Index (PSQI). Cognitive g factors (vocabulary, fluid intelligence, processing speed, and memory) derived from longitudinal biennial measures were included in the analysis. The methods of these cognitive assessments were previously described by [26]; they included an intercept and slope per fluid, vocabulary, speed, and memory which represent two different perspectives. Intercept is estimate of function at age 70 years from the longitudinal model while slope is the measure of change over time from model.
Sleep questions within the PDQ included “Generally, at what time do you go to bed at night?”, “Generally, at what time do you get up in the morning?”, “On average, how many hours sleep do you get every night?”, “How many times during the night do you wake up?” (night wake), and “Do you have any difficulty in getting to sleep?”. Sleep efficiency (%) was calculated as “sleep duration×100/(getting up time-going to bed time)”, with sleep efficiency above 100% was accepted as 100% [29]. We used longitudinal sleep data (collected in 5 wave): sleep duration (time), mid-sleep time for evaluation of chronotype, sleep efficiency (%), night wakes (number).
The BDI [30] was used to measure depressive symptoms and the scores for this were continuous with a higher number indicating more depressive symptoms. The mean BDI score for the 1st wave was 6.3 [31], while for the participants tested in this study the scores of the 93 were: mean = 6.57, standard deviation (SD) = 6.30, range = 0–31.
DNA methylation analysis
Genomic DNA was extracted using the Isolate II Genomic DNA kit (Bioline) and 500 ng bisulfite-converted using the EpiMark Bisulfite Conversion Kit (New England Biolabs). The mean ratio of the absorbance at 260 and 280 nm (A260/280) of the 96 samples was 1.89 (StdDev 0.118). A linear regression with A260/280 and PMD gave a non-significant correlation (Coeff Std error 0.000, Std Coeff Beta 0.025, t 0.236, p = 0.814) Primers were designed using the Pyromark Assay design software (Qiagen) to amplify regions of the BMAL1 promoter (F –GTGGGATATTTGGAGGTTATGATG; R: ACAATTCCTAACTCCCTCTCT-Biotinylated). PCRs were performed using MyTaq HS mix PCR reagents (Bioline) with the following conditions: initial denaturation of 5 min 95°C; 49 cycles of 95°C for 30 s, 56°C for 30 s, 72°C for 30 s; final extension of 72°C for 5 min. The BMAL1 promoter region analysed (GRCH38/hg38 chr11 : 13277037-13277245) contained 6 CpG sites and located to the shore of a CpG island spanning the transcriptional start site (Fig. 1). Amplicons were processed on the Qiagen Q24 Workstation and sequenced using the Sequencing primer ATATTTGGAGGTTATGATGA designed to analyse the bisulphite converted region AYGTAAAGAAYGTGAGAATATTTGTAGTTTTYGGGGTGGAAATGTTTTTTAGAAATATTAAGTATTYGTTTTTTYGTTGAGATTTTGGTAAATTAGGGATTTTAGGAAGGGTTTGGTATTTAAYGTTTTTAAAATTGGTTTTTTAGATG. Assays were performed in duplicate on the Qiagen Q24 pyrosequencer and included a control for complete bisulphite conversion [32]. The region we focused on was 590 bp upstream of the transcriptional start site and in a shore region 60 bp 5’ of the CpG island, previously shown to be epigenetically silenced by promoter methylation, bound by Mecp2 and histone modifications in cell lines [33].
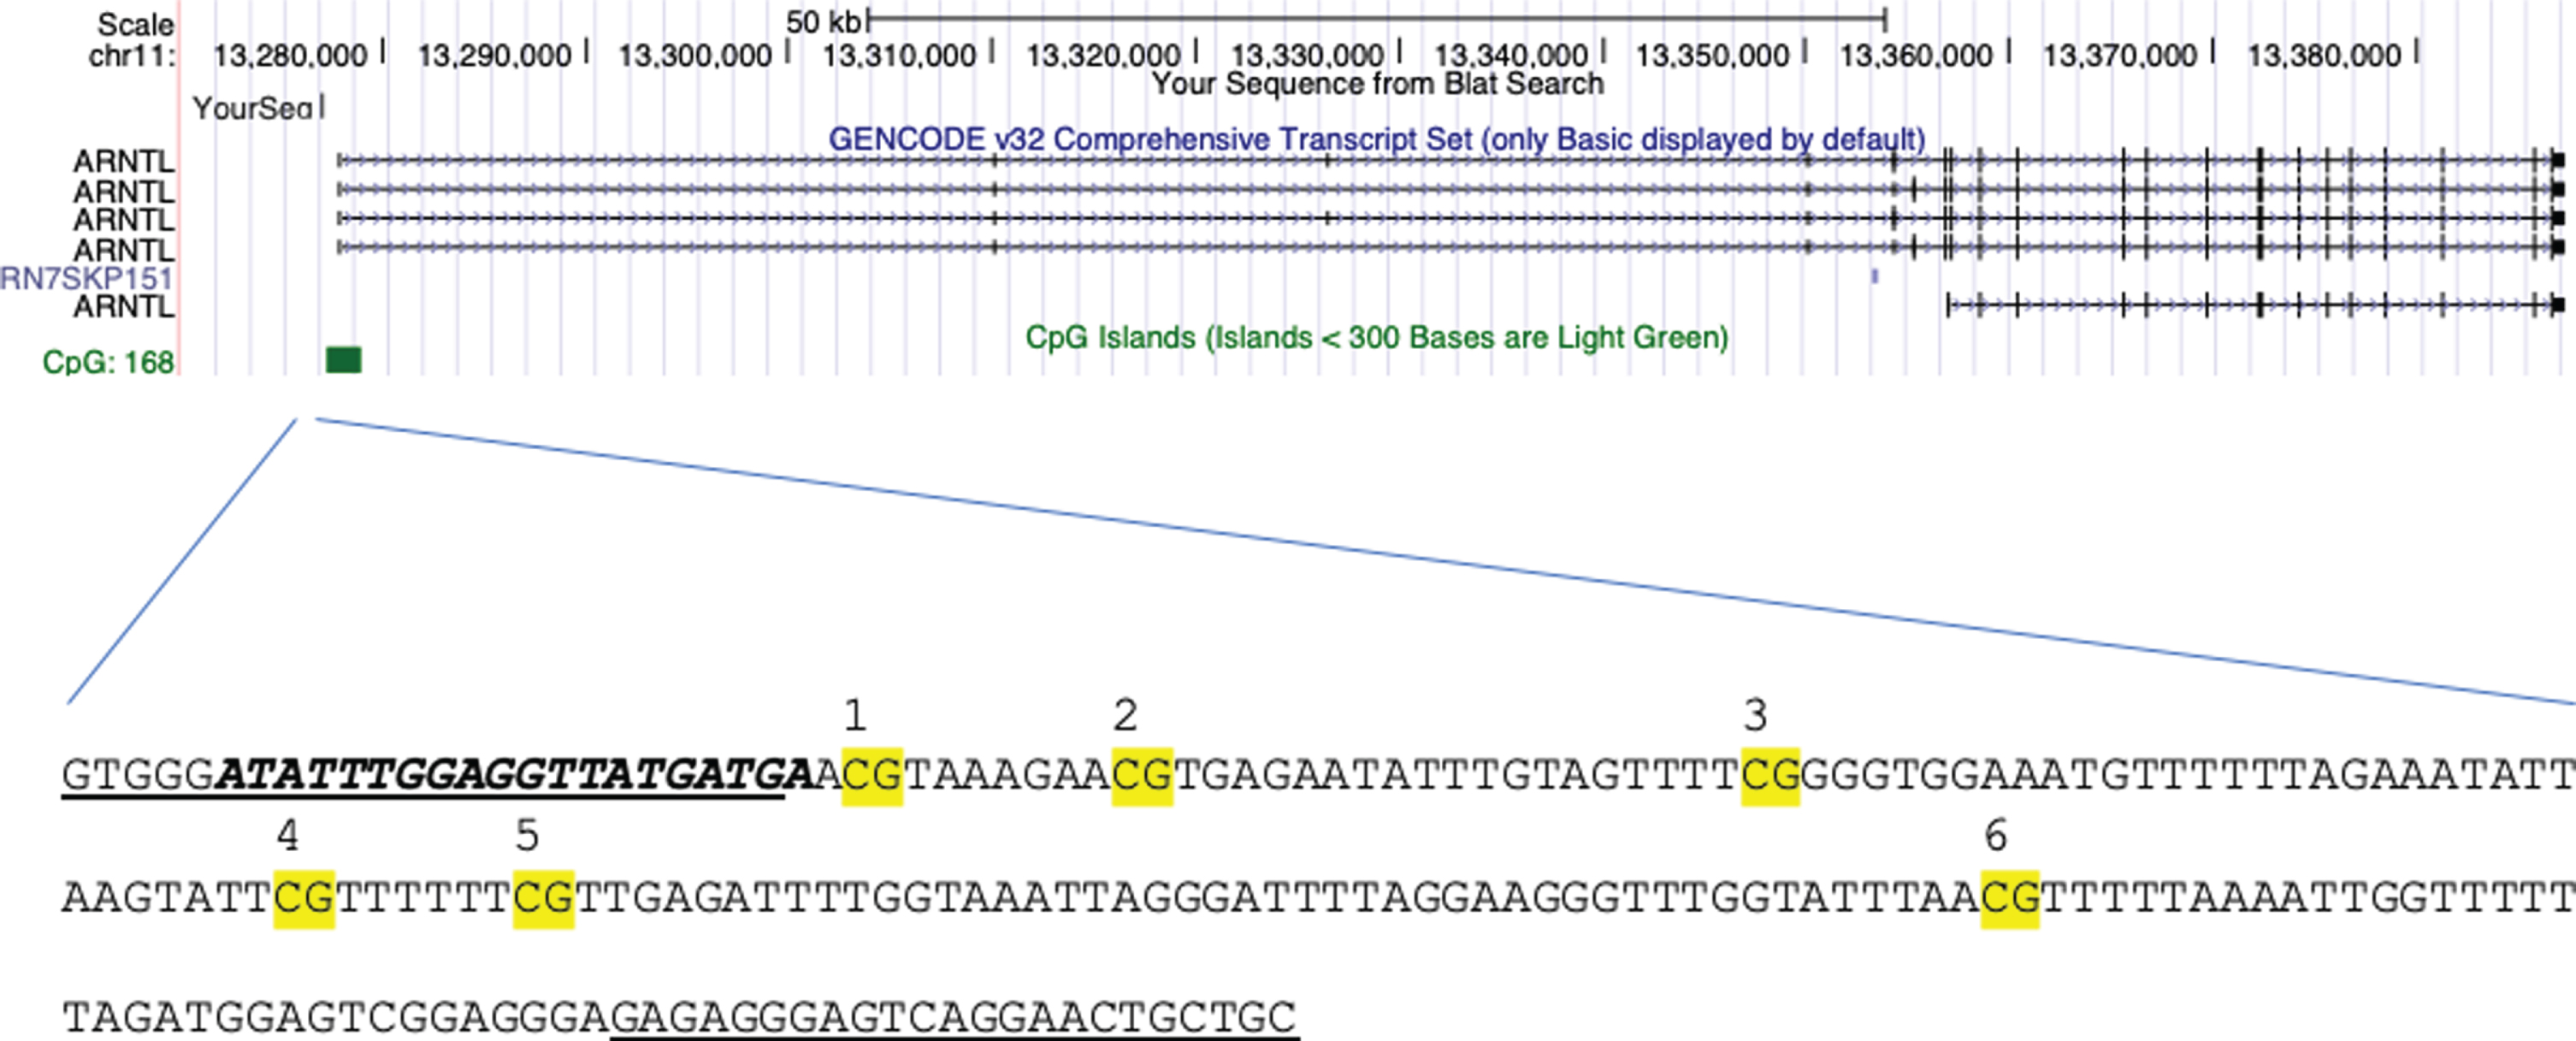
Location of CpGs analyzed in the BMAL1 (ARNTL) sequence. Highlighted with the forward and reverse primers (underlined), sequencing primer (bold) and each CpG site (numbered) at the BMAL1 promoter at the shore of the CpG island (green). Location: GRCH38/hg38 chr11 : 13277037-13277245.
Statistical analysis
All statistical analyses were performed using Stata Statistical Software (Release 14. College Station, TX: StataCorp LP). The significance threshold was p < 0.05; accounting for multiple analysis of 6 CpGs using Bonferroni this would be corrected to p < 0.008. Data was analyzed using Pearson correlation to determine association between CpG methylation and neuropathology stages, and linear regression to determine differences between AD pathology groups adjusting for age and sex. A trigonometric regression fit was used to test for daily methylation cycles (Y(timeofdeath) = Intercept + B1 * Cos(2pi*timeofdeath/24) + B2 * Sin(2pi*timeofdeath/24)). A Pearson correlation was used to analyze methylation amounts and score of longitudinal and cross-sectional cognition change. For longitudinal sleep data analysis, linear mixed model was used to analyze methylation, adjusting for age and sex. For cross-sectional data of depressive symptoms, linear regression was used to analyze methylation amounts adjusting for age and sex.
RESULTS
Clinical and pathological characteristics of the study population can be found in Table 1.
Clinicopathological characteristics for the donor samples
aN = 89; bN = 69; cN = 94.
BMAL1 methylation and AD neuropathology
The mean methylation percentages for all samples per each CpG site were: CpG1 (5.77±6.93), CpG2 (4.80±6.18), CpG3 (7.76±6.34), CpG4 (7.15±5.69), CpG5 (8.40±6.48), and CpG6 (3.48±3.50). Methylation between all the CpGs highly correlate with each other (Supplementary Table 2). There were no significant differences between males (n = 32) and females (n = 64) at any CpG sites (p > 0.05) and age of death also not correlated with any CpG.
A trigonometric regression fit was created for individual CpG methylation with time of death. None of the models was significant (Supplementary Figure 1).
A Pearson correlation test was used to analyze Braak stage and methylation revealing that CpG2 positively correlated with Braak stage (r = 0.26, p = 0.01) but lost significance when accounting for multiple analysis. CpGs 1, 3, 4, 5, and 6 did not significantly associate. Samples were grouped into AD (Braak stage V–VI) and Non-AD (Braak stage 0–IV). Mean methylation of each CpG between the groups are shown in Fig. 2. CpG site revealing that CpG2 again showed a significant difference (t(92) = –2.47, p = 0.015) with higher methylation in the AD group. When samples were grouped into control, intermediate and AD by Braak stage, Control (Braak 0–II) (n = 46), Intermediate (Braak III–IV) (n = 36), AD (Braak V–VI) (n = 12), AD group have more CpG2 methylation then intermediate and control groups (F(2,91) = 3.02, p = 0.05). This suggestive significance is still valid after adjusting for age of death and sex (B = 4.60, 95% CI = –0.85/8.34, p = 0.017). When testing for CERAD (Control, 0–A; AD, B–C) CpG2 also differed between control and AD groups (t(94) = –2.04, p = 0.04), though did not retain significance after correction for multiple analysis. None of the CpGs correlated with Thal groups (Control, 0–3; AD, 4–5).
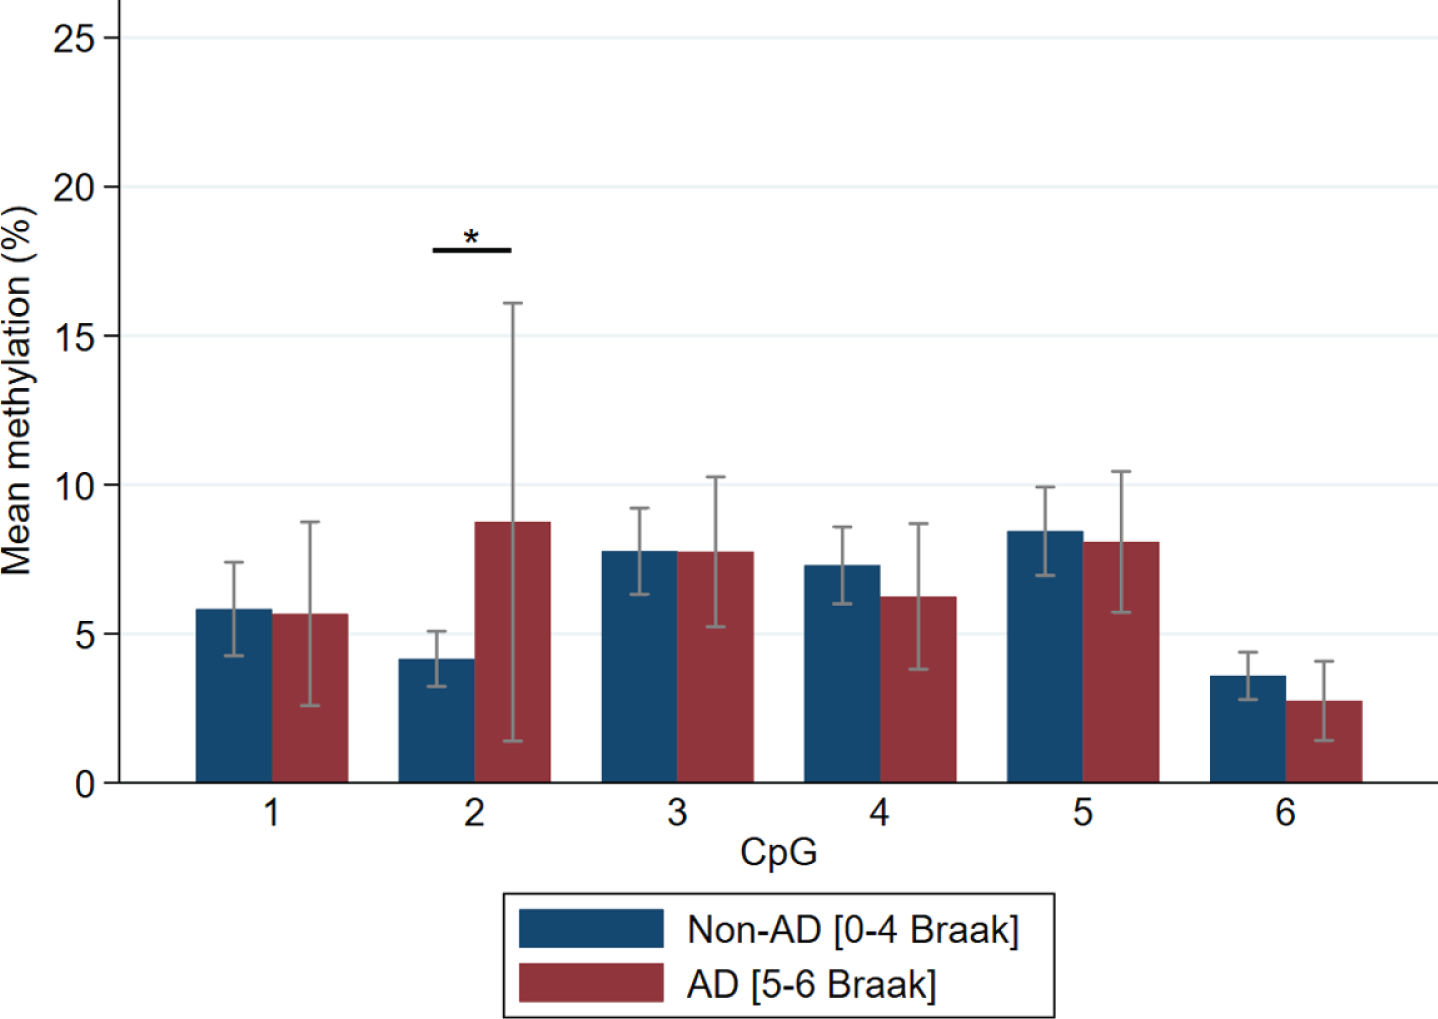
Methylation of CpG sites comparing Braak stage. Mean±95% CI is presented. n = 94; Control (Braak 0–II) n = 46, Intermediate (Braak III–IV) n = 36, AD (Braak V–VI) n = 12. ∗significant at 0.05 level.
BMAL1 methylation and longitudinal changes in cognition
A Pearson correlation test was used to analyze longitudinal cognition scores with BMAL1 methylation. No significance was found between fluid intelligence, processing speed, and memory cognitive tests, though for vocabulary CpG 1 (r = 0.20, p = 0.05) and CpG4 (r = 0.20, p = 0.05) showed positive correlations that did not remain significant when accounting for multiple analysis. Average methylation across all CpGs showed a non-significant association (p = 0.06) with vocabulary. When testing intercept (age-adjusted cross-sectional data), CpG2 showed positive correlations with fluid intelligence (r = 0.20 p = 0.05) and vocabulary (r = 0.22 p = 0.03) that again did not remain significant when accounting for multiple analysis (Table 2).
A Pearson Correlation test to analyze cognitive measures and CpG methylation
Pearson correlation coefficients (r) *correlation is significant at 0.05 level.
BMAL1 methylation and sleep
A 5th wave cross-sectional analysis was performed using linear regression adjusted for age and sex to analyze methylation % per CpG and sleep data for the PSQI. Data for PSQI was only available for 38 participants and there were no significant findings between any CpG and PSQI total score, though CpG4 showed a non-significant correlation (B = –0.16, 95% CI = –0.31/0.01, p = 0.06).
Sleep characteristics of the samples collected using the PDQ used in this study are shown in Table 3. A longitudinal analysis performed using linear mixed model adjusting for age and sex to analyze sleep data and methylation percent per CpG site revealed no significance between sleep duration, midsleep and efficiency for any of the CpG sites. However, night wake showed a significant correlation with CpG5 (B = 0.04, 95% CI = 0.01/0.07, p = 0.01) and with methylation of CpG3 (B = 0.03, 95% CI = 0.00/0.06, p = 0.03) (Fig. 3A, B).
Sleep characteristics of the samples used in this study
PDQ, Personal Detail Questionnaire; SD, standard deviation; h, hour; m, minute; %, percent/100. Mean ages at each wave were, respectively 1–62.66±5.32, 2–66.24±5.49, 3–77.90±5.4, 4–83.03±5.25, 5–85.0±5.45 (mean±SD). PDQ4 for night wake was not collected. Pearson correlation coefficients (r) *correlation is significant at 0.05 level, **0.005, ***>0.0001.
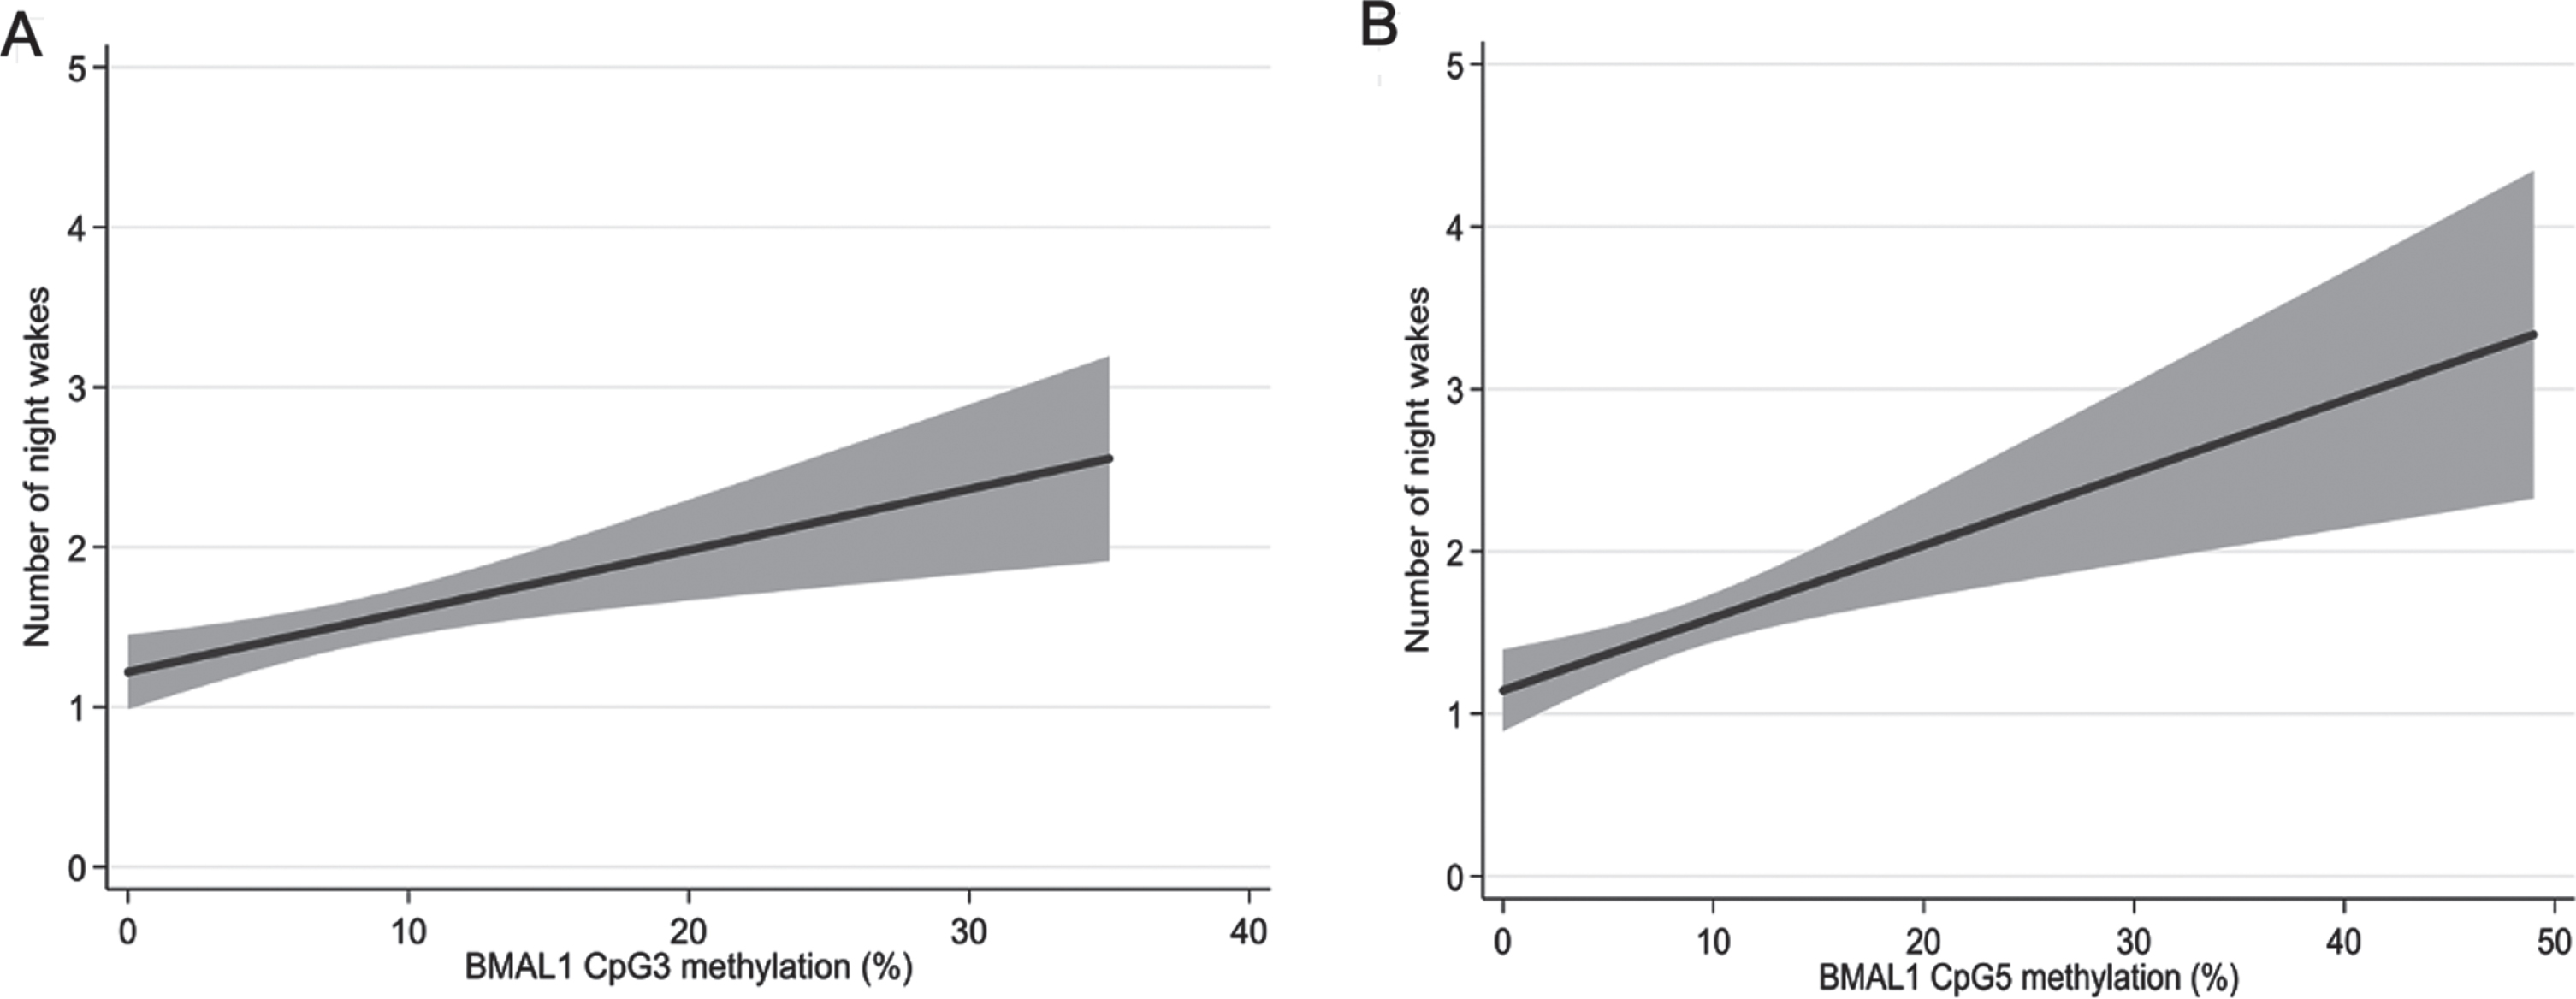
Correlations between number of night wakes and BMAL1 methylation. Linear models adjusting for age and sex with methylation of CpG sites 3 (A) and 5 (B). The grey area represents 95% confidence intervals.
BMAL1 methylation and depressive symptoms
A cross-sectional analysis was performed using linear regression adjusted for age and sex to analyze methylation per CpG and depressive symptoms using BDI. Only CpG4 significantly correlated with BDI score (B = –0.27, 95% CI = 0.49/–0.05, p = 0.02).
DISCUSSION
Investigating DNA methylation at the BMAL1 gene in superior frontal gyrus tissues, we find positive correlations at individual CpGs with Braak stage, night wake, fluid intelligence, vocabulary, and BDI score (depressive symptoms). However, none of these associations remained after controlling for multiple analyses.
The positive correlation between methylation with Braak stage and CERAD score stages, suggests a reduced activity of BMAL1 with increased AD pathology, specifically tau and neurofibrillary tangles. Tau pathology has been shown to be the earliest observable AD-like change in human brain, with abnormal tau phosphorylation and aggregation beginning as early as young adulthood and extending to other connected regions even before Aβ is detected [34]. Several animal studies find mechanistic links between tau pathology and circadian clock gene disruption. Koss et al. showed that transgenic mice with forebrain mutant human tau expression show increased wake and decreased NREM sleep, as well as more robust changes in EEG power than observed in transgenic mice with both tau and Aβ [35]. A transgenic mouse model that develop progressive tau pathology leading to formation of neurofibrillary tangles, show a long free-running period indicating a disruption in the circadian rhythm. They further show disruption in the cyclic expression of BMAL1 and other circadian clock genes in the hippocampus [36]. Studying BMAL1 methylation in human prefrontal cortex, Lim et al. [37] found reduced 24 h rhythms in DNA methylation from samples with AD when compared with control that related to rhythms in RNA expression. A further study has shown desynchrony in the 24 h rhythmicity of BMAL1 expression together with PER1 and PER2, between different brain areas in AD important in cognitive functions and circadian rhythm regulation [38]; that may contribute to the cognitive and sleep-wake deficits seen in AD patients.
Sleep deprivation is a major factor affecting cognitive performance, particularly tasks mediated by the frontal cortex [39]. Additionally, it has been reported that memory and learning are regulated through the circadian timekeeper [40 –42]. If memory and learning are regulated by the circadian clock and AD disrupts circadian rhythm, then it could be hypothesized that memory and learning would deteriorate as AD worsens with circadian clock disruption being a contributing mechanism. We find positive correlations between BMAL1 methylation and fluid intelligence and vocabulary. Previous research in mice suggests that essential signaling events in the hippocampus required for memory, depends on BMAL1 [43]. It was reported that mice who were completely arrhythmic in constant conditions had impaired spatial learning and memory. This supports the theory that cognition performance is dependent on the circadian clock. Snider et al. [44] also reported in mice, when BMAL1 was selectively deleted from excitatory forebrain neurons but the suprachiasmatic nucleus (SCN) clock remained the same, deficits in both acquisition and recall were observed. These studies suggest that both the clock timings and BMAL1 play a critical role in cognitive performance and for both learning, and memory retrieval.
Sleep disturbances, which are common in AD [1], are known to associate with declines in executive functioning [45], verbal episodic memory, and episodic memory [46]. In this study, night wake had a positive correlation with methylation; however, sleep duration, mid sleep, and efficiency did not correlate. Cedernaes et al. [47] found that a single night of wakefulness, or missing one night’s sleep, altered the epigenetic and transcriptional profile of core circadian clock genes, including BMAL1, and an increase in BMAL1 expression has also been found among shift workers when compared with night work [48]. Older adults, particularly those institutionalized with AD, are more likely to lead an indoor lifestyle, resulting in decreased exposure to daylight which can disrupt circadian regulation leading to sleep problems including night wakefulness and daytime sleepiness. Several studies have found that lighting intervention in AD significantly increased circadian entrainment and sleep efficiency [49, 50], together with reducing symptoms of depression [51].
Several studies have indicated that restricted sleep increases the level of deposition of Aβ and formation of neurofibrillary tangles [52]. Animal experiments show that changes in the sleep-wake cycle can elevate hyperphosphorylated tau protein in the brain [9, 11]. Tau, released through neuronal activity, has recently been found to increase with sleep deprivation in both the interstitial fluid of mice and human CSF [53, 54]. That we find positive correlations with methylated CpGs in BMAL1 with tau pathology and sleep disruption might suggest a shared mechanism. The involvement of frontal areas in sleep and neurodegeneration is further supported by topographically-specific drop of K complex, one of the hallmarks of NREM sleep representing the EEG graphoelement with highest amplitude during normal sleep, in AD compared to healthy controls [55].
Depressive symptoms are particularly common in AD [56] and a high number of depressed patients report insomnia, with insomnia also being a risk factor for developing depression [57]. That we find BMAL1 methylation associated with depressive symptoms supports the role of circadian clock genes in depression and individuals with an abnormally-shifted or arrhythmic biological clock have been linked to a higher risk of developing depression [23]. In animal models, Christiansen et al. [58] found that BMAL1 regulation was particularly susceptible to stress and Landgraf et al. [59] showed that SCN-specific BMAL1-knockdown mice exhibited depression-like behavior. Altered expression of circadian rhythm genes have been found in individuals with depression [60] together with polymorphisms in clock genes [61]. There is further evidence that a lifetime history of depression is associated with AD pathology. For example Rapp et al. [20] found that AD patients with a lifetime history of depression showed an increase in Aβ plaques and neurofibrillary tangles when compared against AD patients without a history of depression, suggesting an interaction between major depression and AD neuropathology. It has also been suggested that depressive symptoms in older age could be affected by tau pathology. Positron emission tomography research showed that individuals with elevated tau were twice as likely to be depressed and antidepressant use modified this relationship [62]. Furthermore, it has been observed that people with mild cognitive impairment and depression are at significantly greater risk of developing AD than those without depression [63]. There are therefore clear links between depression, pathology, and AD and it could be hypothesized that depressive symptomatology could be an early symptom of underlying AD neuropathology, that might further relate to regulation of circadian rhythm.
A major strength of this study is the wealth of data from The University of Manchester Longitudinal Study of Cognition in Normal Healthy Old Age cohort. To our knowledge, this is the first study that has examined the association between BMAL1 methylation in postmortem brain in relation to AD neuropathology, longitudinal cognition, sleep, and depression. Importantly, though this is preliminary work, this needs replicating and the results of this study should be interpreted as associations and not causality. Important limitations are that six CpG sites were investigated and if corrected for Bonferroni, as a conservative approach, significance would be lost especially as we only had access to limited samples with all the measures. Importantly though, the CpGs individually correlated with each other (Supplementary Table 2). Therefore, as the test statistics are highly dependent, in that adjacent CpGs significantly relate to each other, testing each individually and adjusting for Bonferroni throughout could be considered highly stringent. Methylation patterns are tissue-specific and it is unclear whether the changes we see in the superior frontal gyrus reflect other regions and particularly the SCN. We did not measure gene expression due to differences in RNA quality between the brain samples that related to autopsy delay (data not shown). Another consideration is that the sleep data in this study was evaluated through questionnaires, PDQ and PSQI, most conducted around 20–30 years before death. We have previously reported PSQI-PDQ correlation using the PSQI as a validation [29, 31] and as such we had data from more participants for PDQ than the PSQI. Importantly, we found significance in only one variable from PDQ, night wake, without any significances between sleep duration, midsleep, and efficiency for any of the CpG sites. Other more direct measures of sleep, perhaps including different sleep stages, could allow to test further mechanisms together with further data at later timepoints. Further studies could look at other important CLOCK genes and relate their methylation to sleep and AD. This will help create a more robust view of the circadian cycle and give insight into how much influence sleep has on circadian clock gene methylation and AD neuropathology.
In summary, the use of human brain samples from the superior frontal gyrus in this study allowed us to develop a mechanistic view of how epigenetic regulation of BMAL1, AD neuropathology, cognition, sleep, and depressive symptoms may all be linked together. We find that BMAL1 methylation positively associated with tau pathology, longitudinal fluid intelligence score for males, longitudinal vocabulary for females, night wakes, and depression (BDI score). However, surprisingly, no significance or associations were found between BMAL1 and speed and memory tests, sleep duration, mid-sleep, and sleep efficiency. These results suggest that BMAL1 methylation does play a role in sleep and AD neuropathology but to what extent needs further research. As the circadian cycle is linked to sleep and sleep highly linked to the circadian cycle, it could be hypothesized that all play a role in AD neuropathology.
DISCLOSURE STATEMENT
Authors’ disclosures available online (https://www.j-alz.com/manuscript-disclosures/20-0634r1).