
Abstract
Background:
Brevican and neurocan are central nervous system-specific extracellular matrix proteoglycans. They are degraded by extracellular enzymes, such as metalloproteinases. However, their degradation profile is largely unexplored in cerebrospinal fluid (CSF).
Objective:
The study aim was to quantify proteolytic peptides derived from brevican and neurocan in human CSF of patients with Alzheimer’s disease (AD) and vascular dementia (VaD) compared with controls.
Methods:
The first cohort consisted of 75 individuals including 25 patients with AD, 7 with mild cognitive impairment (MCI) diagnosed with AD upon follow-up, 10 patients with VaD or MCI diagnosed with VaD upon follow-up, and 33 healthy controls and cognitively stable MCI patients. In the second cohort, 31 individuals were included (5 AD patients, 14 VaD patients and 12 healthy controls). Twenty proteolytic peptides derived from brevican (n = 9) and neurocan (n = 11) were quantified using high-resolution parallel reaction monitoring mass spectrometry.
Results:
In the first cohort, the majority of CSF concentrations of brevican and neurocan peptides were significantly decreased inVaDas compared withADpatients (AUC = 0.83.0.93, p≤0.05) and as compared with the control group (AUC = 0.79.0.87, p ≤ 0.05). In the second cohort, CSF concentrations of two brevican peptides (B87, B156) were significantly decreased in VaD compared with AD (AUC = 0.86.0.91, p ≤ 0.05) and to controls (AUC = 0.80.0.82, p ≤ 0.05), while other brevican and neurocan peptides showed a clear trend to be decreased in VaD compared with AD (AUC = 0.64.80, p > 0.05). No peptides differed between AD and controls.
Conclusion:
Brevican and neurocan peptides are potential diagnostic biomarkers for VaD, with ability to separate VaD from AD.
INTRODUCTION
Alzheimer’s disease (AD) is a chronic neurodegenerative disorder, the most common form of dementia, characterized by memory impairment and decline in other cognitive domains [1].
The histopathological hallmarks of AD include extracellular plaques mainly composed of amyloid-β (Aβ) and intracellular neurofibrillary tangles composed of hyperphosphorylated tau [1]. Even though symptomatic treatments for AD are available [2], there is currently no cure [3].
Mild cognitive impairment (MCI) is characterized by cognitive decline greater than that expected for age and education level, which does not interfere with everyday activities [4]. Often, it is an intermed-iate cognitive stage between healthy aging and de-mentia. However, not all MCI patients progress to dementia—they might remain clinically stable or re-vert to normal cognition [5].
Vascular dementia (VaD) is the second leading cause of dementia after AD [6]. It is a progressive disease caused by microvascular pathology with reduced cerebral blood flow to the brain that affects cognitive abilities [7]. The contribution of vascular pathology to dementia makes VaD a heterogeneous group of brain disorders with different subtypes, including multi-infarct dementia, small vessel dementia, hypo-perfusion dementia, or hemorrhagic dementia [8, 9]. Similar to AD, there is no cure for VaD. However, the risk factors for cerebrovascular disease, e.g., diabetes and hypertension, should be modified.
Since AD and VaD patients share many common pathological features, e.g., white matter lesions, and have clinically overlapping symptoms [10], there is a great need to develop biochemical markers to facilitate differentiation of VaD from AD and other dementias.
Cerebrospinal fluid (CSF) is a circulatory fluid found around and within the organs of the central nervous system (CNS). It can reflect the complex biochemical processes occurring in the brain, e.g., low CSF levels of Aβ42 and high CSF levels of total tau (t-tau) and phosphorylated tau (p-tau) proteins reflect plaque deposition, AD-type neuronal degeneration and tangle formation, respectively [11]. Since CSF is in direct contact with the brain, it is a great source for exploring brain pathology and it shows an increasing diagnostic relevance for neurological diseases. Thus, CSF is an important source for the biomarker development to enable detection of pathological changes in the brain, sometimes even before symptoms are noticeable.
Even though there are three CSF protein biomarkers used for AD diagnosis: Aβ42, t-tau, and p-tau [12, 13], there is still a great need for novel biomarkers to detect differential pathological processes in AD. The fact that AD pathology is present in 40–80%of VaD patients [14] makes the pure VaD diagnosis very challenging. Even though the differentiation of VaD from AD was observed to be improved to 85%when combining all the three AD biomarkers in CSF [15], a better measurable indicator specific to either of the two most common dementia forms is needed.
Brevican and neurocan are CNS-specific chondroitin sulfate proteoglycans expressed by both astrocytes and neurons, although the main producers of brevican are astrocytes, while neurocan is prima-rily expressed by neurons [16]. They are integral components of perineuronal nets (PNNs), a specialized extracellular matrix (ECM) structure enwrapping CNS neurons, whose role is to regulate neuronal and synaptic functions in the brain [17]. PNNs keep the balance between structural stabilization and synaptic remodeling, which is crucial for development and normal tissue functioning [18]. This homeostasis is sensitive to altered expression of proteases and excessive ECM remodeling might lead to many pathologies [18].
Both brevican and neurocan are substrates for several matrix proteases. Brevican undergoes proteolytic cleavage resulting in N- and C-terminal fragments of ∼55 kDa and ∼80 kDa, respectively [19]. A family of a disintegrin and metalloproteinase with thrombospondin motifs (ADAMTS) are the proteases responsible for the generation of the lower molecular weight brevican fragments observed in cultures of neurons, astrocytes and rodent brain tissues [20–22]. Also, matrix metalloproteinases (MMPs) are able to cleave brevican resulting in a 53 kDa fragment observed in mouse brain extracts [22, 23]. Neurocan is processed into two fragments, 130 kDa and 150 kDa, observed in cultures of astrocytes and rat brain tissues [24, 25] and is a substrate for both ADAMTS [26] and MMPs [27]. Since brevican and neurocan are highly involved in the creation of PNNs, it is believed that their processing may result in a loosing of PNNs and excessive ECM remodeling subsequently leading to many brain pathologies [28]. Since the proteolytic processing of brevican and neurocan in human brain tissues is largely understudied, the analysis of human CSF would provide an accessible window into the investigation of their degradation patterns in the brain.
We have previously reported that the brevican and neurocan levels in CSF do not reflect AD-pathology in CSF [29]. However, the abundances of either endogenous or tryptic peptides in CSF along the proteins were not investigated in AD. Moreover, to our knowledge, there is no study reporting brevican or neurocan in relation to VaD.
Therefore, the aim of this study was to investigate if CSF brevican and neurocan concentrations are associated with AD and VaD. To strengthen the study, it was carried out in two independent cohorts.
MATERIALS AND METHODS
Patient samples
The demographic data of the subjects included in the study are shown in Table 1 and Table 2 for cohort 1 and 2, respectively.
Demographics of study population in cohort 1
*AD with vascular components according to brain imaging. AD, Alzheimer’s disease; MCI, mild cognitive impairment; VaD, vascular dementia.
Demographics of study population in cohort 2
AD, Alzheimer’s disease; VaD, vascular dementia.
The study was conducted in accordance with the Helsinki Declaration and approved by the Swedish Ethical Review Authority. Informed consent was obtained either from participants or next of kin.
The first cohort consisted of 75 individuals (37 men and 38 women), including patients with AD or MCI diagnosed with AD upon follow-up (n = 32), patients with VaD or MCI diagnosed with VaD up-on follow-up (n = 10) and a control group (n = 33) consisting of healthy individuals and cognitively stable MCI patients. The admission criteria of these patients and CSF sampling have been described in detail in a previous study [30]. Briefly, CSF was obtained by lumbar puncture in the L3/L4 or L4/L5 interspace, using a standard Quincke cutting edge needle (length 90 mm, needle diameter 0.7 mm/22 gauge, gravity collection, free flow/dripping), and collected in a polypropylene tube, followed by centrifugation at 2,000×g at +4°C for 10 min. The supernatant was stored at –70°C pending analysis. For the clinical diagnosis, patients with AD had to fulfil the criteria of dementia [31] and of probable AD defined by NINCDS-ADRDA [32]; patients with MCI - criteria established by Petersen [33]; patients with VaD –criteria of dementia [31] together with the requirements for VaD by NINDS-AIREN (three diagnosed patients) [34] or criteria established by Erkinjuntti for VaD of the subcortical type (seven diagnosed patients) [35]. Healthy individuals showed no subjective symptoms of cognitive dysfunction.
The second cohort consisted of 31 individuals (16 men and 15 women), including patients with AD (n = 5), VaD (n = 14) and healthy controls (n = 12), and is a subsample from the Gothenburg MCI study [36]. CSF was obtained by lumbar puncture through the L3/L4 or L4/L5 interspace, using a standard Quincke cutting edge needle (length 90 mm, needle diameter 0.7 mm/22 gauge, gravity collection, free flow/dripping), and collected in polypropylene tubes, followed by centrifugation at 2,000×g at +4°C for 10 min. The supernatant was stored at –80°C pending analysis.
Similar to the first cohort, patients with AD had to fulfil the criteria of dementia [31] and of probable AD defined by NINCDS-ADRDA [32], while patients with VaD - criteria established by Erkinjuntti [35] as all VaD patients belong to the subcortical small vessel disease group. Healthy individuals included in the study did not exhibit any cognitive decline at the time of admission.
Regarding the nature of vascular pathology among the VaD patients, the majority exhibited the subcortical type of VaD with symptomatological and radiological signs of subcortical small vessel disease. Some of them also had stroke episodes (the first cohort). According to brain imaging, a few of the AD patients had signs of small vessel disease but not sufficiently pronounced to legitimate a VaD diagnosis. In general terms, the subcortical vascular burden was more advanced in the VaD than in the AD group. In addition, there was no significant difference in cognitive impairment measured by MMSE between VaD and AD patients.
Validation
Intra-assay variability was determined by calculating the coefficient of variation (CV) for four replicates of CSF pool quality samples evenly spread out throughout the 96-well plate.
The stability of brevican and neurocan fragments during freeze-thaw cycles was tested by thawing and freezing CSF aliquots (n = 5) one to five times.
To investigate the stability of brevican and neurocan peptides during storage, five CSF samples were stored under the following conditions: –80°C for one month, –20°C for one month, 5–8°C for 24 h, 5–8°C for 7 days, and room temperature (RT) for 24 h.
To evaluate linearity of the method, two-fold serial dilutions of the stock solution containing internal standard (IS) peptides were performed and spiked to CSF pool at five different occasions with subsequent digestion by trypsin/Lys-C and liquid chromatography –tandem mass spectrometry (LC-MS/MS) analysis. The curve fits were obtained using weighted sum of squares (1/Y2).
Explorative analysis
For the initial explorative analysis, immunoprecipitation (IP) was either followed or not by digestion by trypsin and subsequent analysis by a Dionex UltiMate 3000 nanoflow LC (Thermo Fisher Scientific Inc.) coupled to electrospray ionization high-resolution hybrid quadrupole-orbitrap MS, Q Exactive (Thermo Fisher Scientific Inc.) were performed to investigate the endogenous and tryptic brevican fragment patterns in CSF.
Explorative analysis: IP followed by digestion by trypsin
Four μg of each monoclonal anti-brevican anti-body (N-terminal B2739-70B and C-terminal B2739-70C, US Biological Life Science, Salem, MA, USA) were separately added to 25μL magnetic Dynabeads M-280 Sheep Anti-Mouse IgG (Invitrogen, Carlsbad, CA, USA) and incubated for 1 h on a rocking platform at RT. The remaining unbound antibody was removed by washing twice with phosphate-buffered saline (PBS, 10 mM Na-phosphate, 0.15 M NaCl, pH 7.4). Antibody-conjugated beads were added to 965μL of CSF or 400 ng of full-length recombinant brevican standard (R&D, Minneapolis, MN, USA), and diluted to 1 mL in 0.025%Tween 20 in PBS. Sample incubation was carried for 1 h on a rocking platform at RT. Using a magnetic particle processor (KingFisher, Thermo Fisher Scientific, Waltham, MA, USA), each sample underwent several washing steps in 1 mL 0.025%Tween 20 in PBS, 1 mL PBS, and finally 1 mL 50 mM ammonium bicarbonate (NH4HCO3, pH 8). Brevican fragments were eluted from the beads by adding 100μL 0.5%formic acid in deionized water (v/v). The collected supernatant was dried down in a vacuum centrifuge. Samples not digested by trypsin were stored at –20°C pending LC-MS analysis. Samples intended for tryptic digestion were reconstituted in 10μL NH4HCO3 and shaked for 30 min. They were then reduced (30 min, 60°C, on a shaker at 1200 rpm) with 10μL of 10 mM dithiothreitol in 50 mM NH4HCO3 followed by alkylation (30 min, RT, on a shaker at 600 rpm, in dark) with 5μL of 10 mM iodoacetamide in 50 mM NH4HCO3. Next, the samples were digested (15 h, 37°C, on a shaker at 1200 rpm) by adding 5μL (0.025μg) of trypsin (Sequencing Grade Modified Trypsin, Promega Corp., Madison, WI, USA). Digestion was stopped by adding 5μL of 10%formic acid in deionized water (v/v) and the digests were dried down in a vacuum centrifuge and stored at –20°C pending analysis.
Explorative analysis: LC-MS/MS
IP-purified samples were reconstituted in 7μL of 8%formic acid/8%acetonitrile in deionized water (v/v/v), from which 6μL was loaded onto an Acclaim PepMap C18 trap column (Thermo Fisher Scientific, Waltham, MA, USA). Sample loading buffer was 0.05%trifluoroacetic acid in deionized water (v/v). The separation was performed by reversed-phase Acclaim PepMap C18 analytical column (Thermo Fisher Scientific, Waltham, MA, USA) at a flow rate of 300 nL/min by applying a gradient of 0–40%B for 50 min (total cycle time 90 min). Mobile phases were A: 0.1%formic acid in deionized water (v/v) and B: 0.1%formic acid/ 84%acetonitrile in deionized water (v/v/v). The mass spectrometer was operated in data dependent mode using higher energy collision-induced dissociation (HCD) in a similar way as previously published [37]. Both full mass (MS) and tandem (MS/MS) mass spectra were acquired at a resolution setting of 70,000, 1 microscan, target values 106, and maximum injection time 250 ms. Isolation width was 3 m/z units and the normalized collision energy was set to 25.
Database searches of the LC-MS/MS spectra were performed using Mascot Daemon (v2.6, Matrix Science, Boston, MA, USA) against a custom made ECM database with the following parameters: fixed modifications: carboxymethyl, variable modificati-ons: oxidation (M), peptide tolerance 20 ppm, peptide charge 1 + and no missed cleavages.
Isotope-labelled peptides
Twenty isotope-labelled tryptic peptides (n = 9 for brevican, n = 11 for neurocan), labelled with both 13C and 15N at the C-terminal arginine or lysine (Δmass = +10 Da or +8 Da, respectively) were sel-ected for monitoring (JPT Peptide Technologies, Berlin, Germany) (Table 3). In the nomenclature of the peptides, “B” stands for brevican while “N” for neurocan and the following number is the first amino acid of the peptide (Table 3). Each peptide (10 nmol) was reconstituted in 1 mL 10%acetonitrile in deionized water (v/v), aliquoted and stored at –20°C pending analysis.
The peptides used in the PRM-MS assay with acquisition characteristics
a precursor m/z of the endogenous peptide. b normalized collision energy. Underlined C (
Brevican/neurocan panel
Twenty-five μL containing the 20 isotope-labelled peptides were spiked into 100μL CSF in Micronic 0.75 mL tubes (Lelystad, Netherlands). The samples were reduced with 25μL of 30 mM dithiothreitol in 50 mM NH4HCO3 (30 min, 60°C, on a shaker at 1200 rpm) and thereafter, alkylated with 25μL of 70 mM iodoacetamide in 50 mM NH4HCO3 (30 min, RT, on a shaker at 600 rpm, in dark). Samples were then digested with 25μL trypsin/Lys-C mix (Promega Corp., Madison, WI, USA) in 50 mM NH4HCO3 to a concentration of 20μg/mL (15 h, 37°C, on a shaker at 1200 rpm). The reaction was stopped by adding 25μL of 10%trifluoroacetic acid (v/v). The digests were desalted by solid phase extraction using Oasis hydrophilic-lipophilic balance (HLB, 2 mg sorbent, 30μm particle size, Waters Co., Milford, MA, USA) 96-well μElution plates. The samples were eluted using 100%methanol. Samples were then dried down in a vacuum centrifuge and stored at –20°C.
Prior to LC-MS analysis, the samples were reconstituted in 100μL 50 mM NH4HCO3. Each sample (50μL) was loaded onto a Hypersil Gold reversed phase high-performance LC (HPLC) C18 column (Thermo Fisher Scientific Inc.). Separation was performed at a flow rate of 300μL/min with a gradient from 0 to 40%B over 20 min using a Vanquish ultra HPLC (UHPLC) (Thermo Fisher Scientific Inc.). The total cycle was 30 min. The parallel reaction monitoring (PRM) assay was performed using the Q Exactive hybrid quadrupole-orbitrap high resolution mass spectrometer (Thermo Fisher Scientific Inc.), with electrospray ionization, operated as described previously [38] with minor modifications. Briefly, fragment mass spectra were acquired by scheduled parallel reaction monitoring (PRM) with retention time windows of 30 s for each peptide, with the following acquisition parameters: resolution setting of 35,000, 1 microscan, target values 3×10⁶, and maximum injection time 125 ms. Isolation width was 3 m/z units and normalized collision energies were optimized manually for each peptide (see Table 3 for values).
Biochemical analyses of other markers
Biochemical analyses of the subsequent additional markers were performed previously, as follows: the analyses of CSF glial fibrillary acidic protein (GFAP) and neuron-specific enolase (NSE) were performed using the Randox biochip array technology [39] in-cluding the Randox Cerebral Arrays I and II (Randox Laboratories, Antrim, UK), respectively [40]. CSF YKL-40 levels were measured by ELISA (R&D Sys-tems Inc.) [41]. Albumin levels were measured using immunonephelometry performed on a Beckman Im-mage Immunochemistry system (Beckman Instrume-nts, Beckman Coulter, Brea, CA, USA). The albumin ratio was calculated as CSF albumin (mg/L)/serum albumin (g/L) [42]. CSF Aβ42, t-tau, and p-tau levels were measured using the INNOTEST® ELISA assays (Innogenetics, Ghent, Belgium) [30].
Statistical analyses
The majority of the measurements were not normally distributed based on the Kolmogorov-Smirnov test. The differences between the groups were investigated using Kruskal-Wallis test with Dunn’s multiple comparisons. Area under the curve (AUC) from receiver operating characteristic (ROC) analysis was used as a measure of the effect size. The correlation coefficients (rho) were calculated using the Spearman’s rank correlation. Since the populations in both cohorts were age and gender-matched (evaluated by Kruskal-Wallis test with Dunn’s multiple comparisons and Chi-square test, respectively), neither age nor gender were included as covariates in the statistical analyses. The analyses were performed using SPSS software, version 25 for Windows (IBM Corp., Armonk, NY, USA) or GraphPad Prism, version 7 for Windows (GraphPad Inc., La Jolla, CA, USA). All tests were two-sided with a significance threshold set to p≤0.05.
RESULTS
Validation
The repeatability of the brevican and neurocan peptides in quality control CSF samples ranged from 1–19%for both cohorts, except B834, N145 and N1242 peptides, which showed a high variability (CV > 20%). These peptides were excluded from further analysis. The majority of brevican (except B87) and neurocan (except N582) peptides in CSF showed analytical stability for up to five freeze-thaw cycles (Supplementary Figures 1, 2). All brevican and neurocan peptides in CSF showed storage stability upon tested conditions (Supplementary Figures 3, 4). The relative error of the back-calculated concentrations were below 20%for all calibrators, except for N1195 (Supplementary Figures 5, 6).
Explorative analysis
Several tryptic, but not endogenously intact, brevican peptides were detected in CSF (Supplementary Table 1). N-terminal brevican fragments (covering aa 23 –aa 429) were detected in IP-purified CSF using the N-terminal antibody, while C-terminal brevican fragments (covering aa 718 –aa 841) were detected in CSF using the C-terminal antibody (Fig. 1A, Supplementary Table 1).
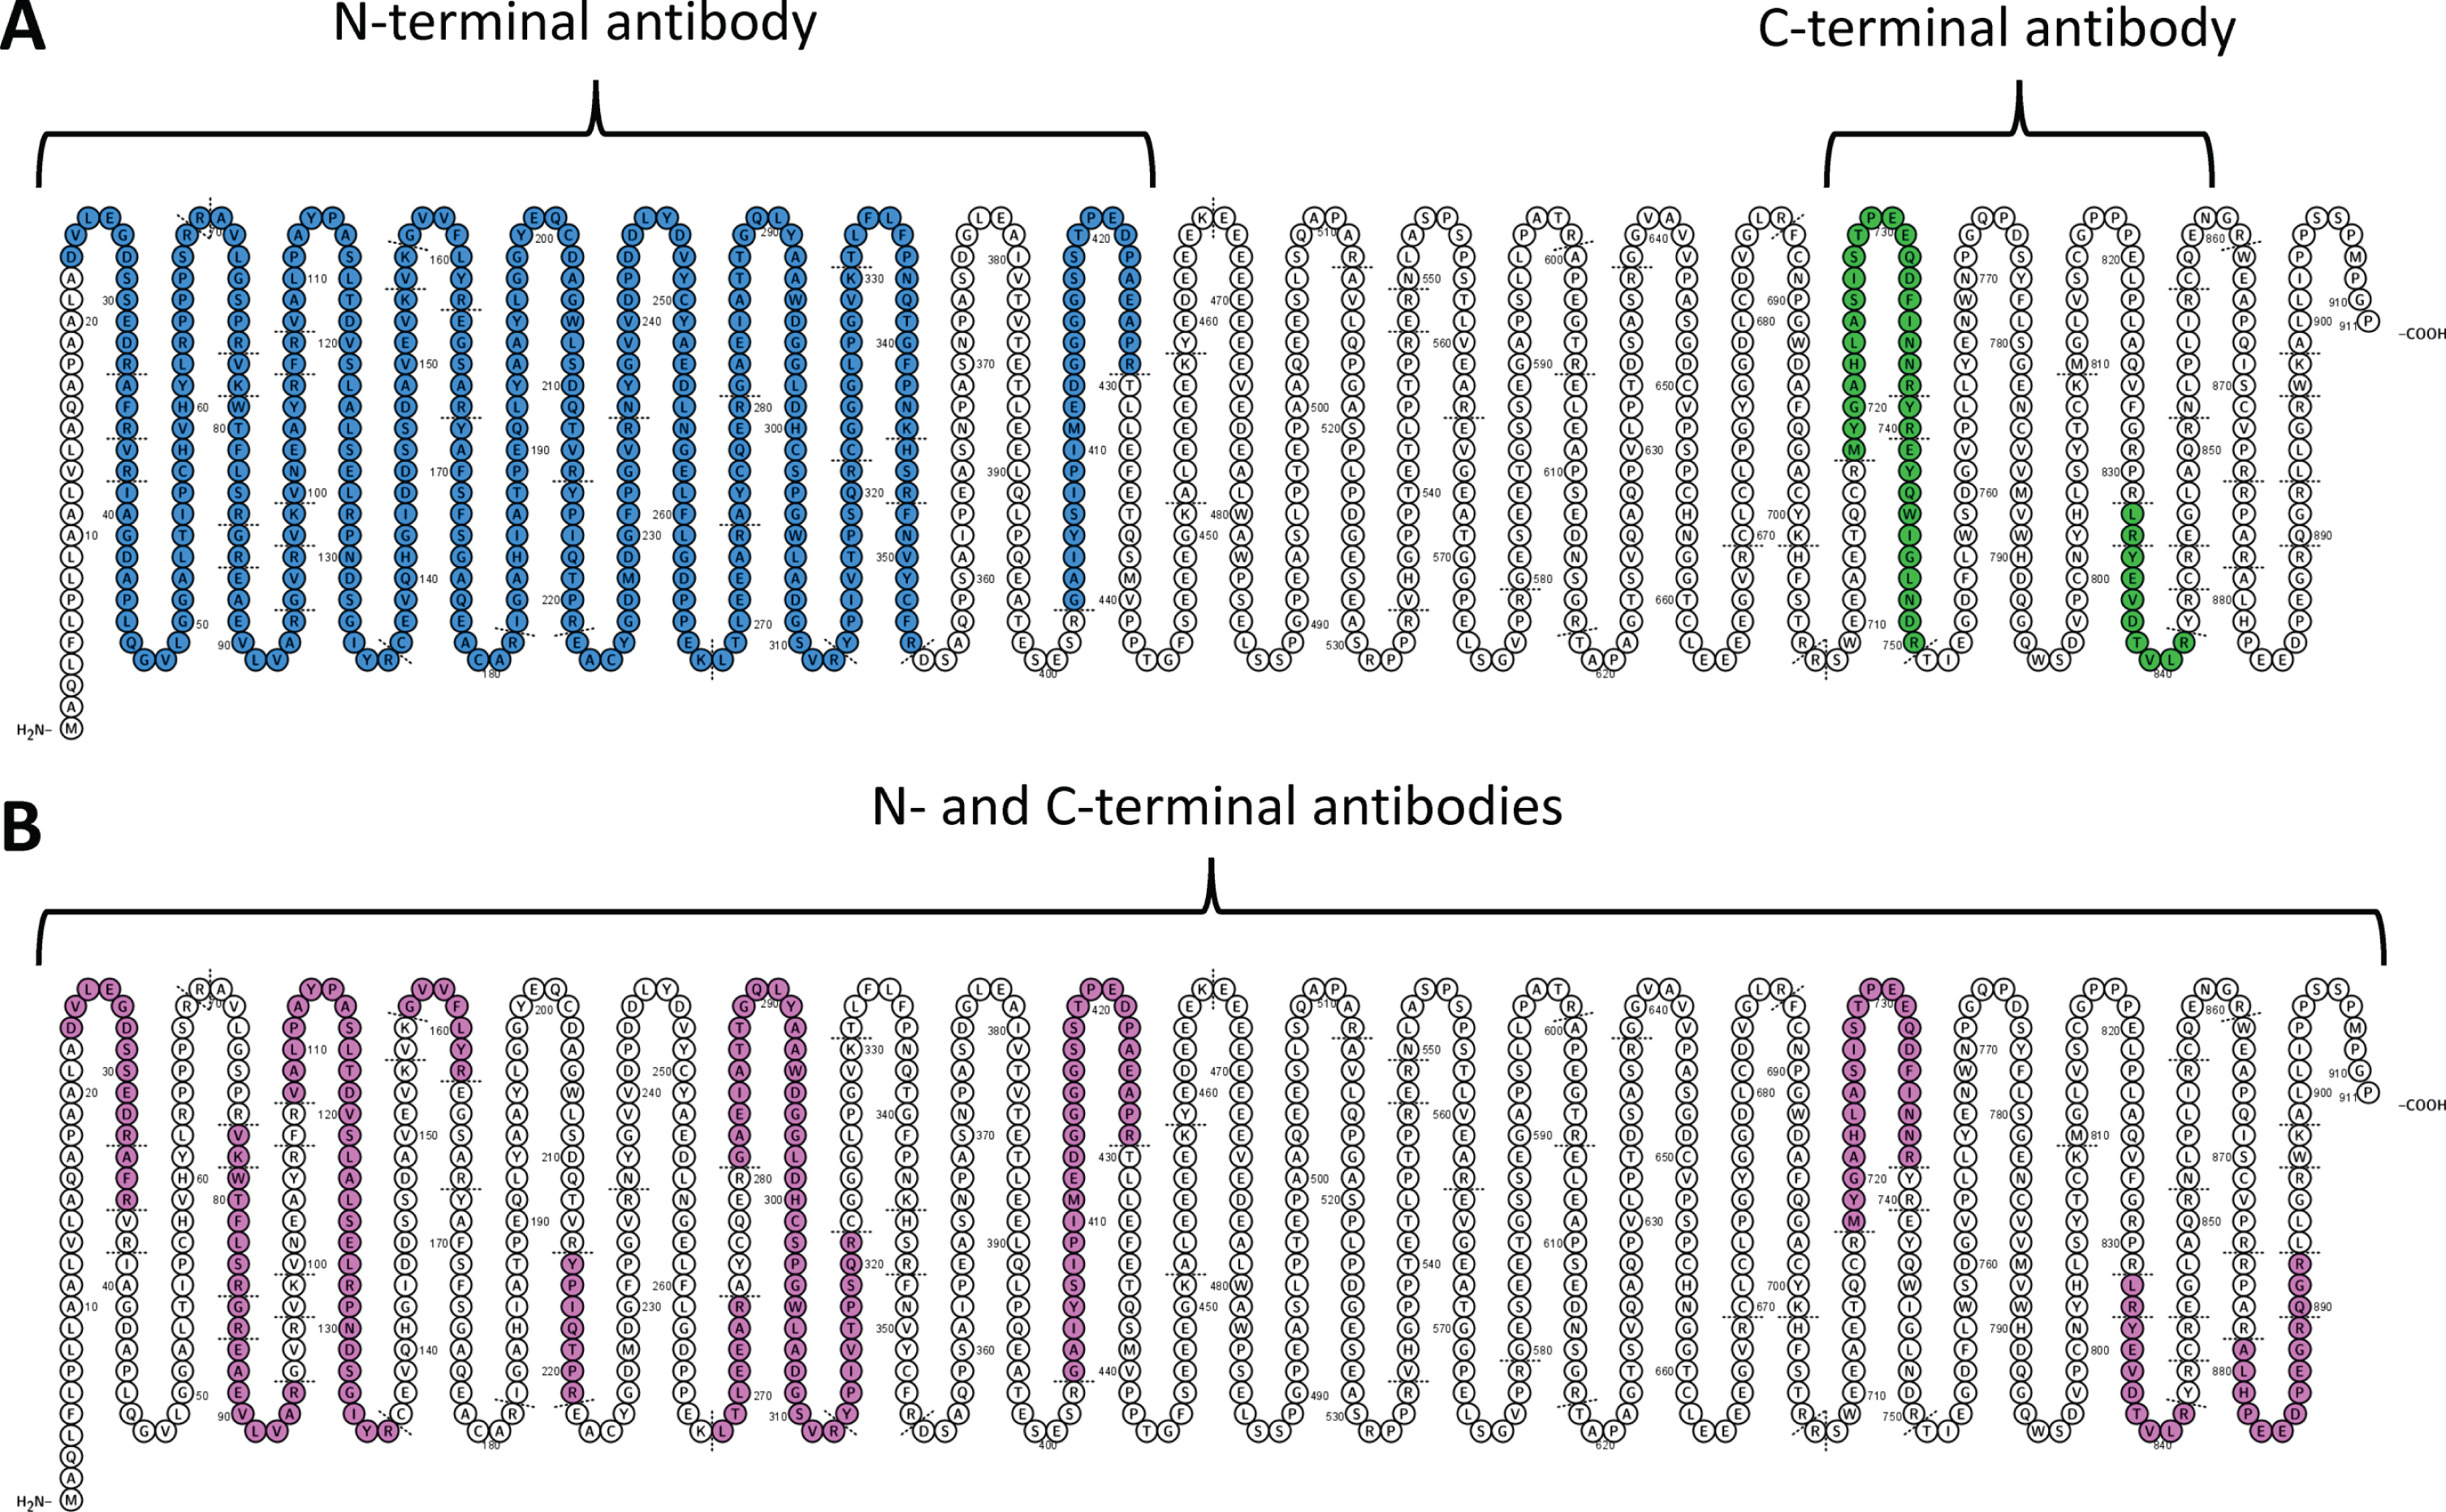
Explorative IP-based analysis of CSF (A) and full length standard brevican protein (B). In CSF (A), N-terminal brevican antibody captured only N-terminal brevican fragments (covering aa 23 –aa 429, blue), while C-terminal brevican antibody only C-terminal brevican fragments (covering aa 718 –aa 841, green). For full-length brevican standard (B), N-terminal or C-terminal antibody captured peptides covering the whole brevican sequence (aa 23 –aa 892, pink).
IP of full-length brevican standard using either N-terminal or C-terminal antibody resulted in the detection of peptides spanning the whole brevican sequence (Fig. 1B, Supplementary Table 1). The most C-terminal peptide included in the panel (B879) was observed with the full-length standard (Fig. 1B), but not in any of the IP-purified CSF (Fig. 1A).
Brevican/neurocan panel: cohort 1
For the CSF concentrations of all brevican and neurocan peptides quantified in cohort 1, see Supplementary Table 2.
In the first cohort, the CSF concentrations of all brevican (Fig. 2) and neurocan (Fig. 3) peptides were significantly decreased in VaD compared with AD patients (AUC = 0.83–0.93, p≤0.05). Additionally, CSF concentrations of five brevican peptides (N-terminal B156, B268, B313, B322, and C-terminal B741) and all neurocan peptides were significantly decreased in VaD when compared with control group (AUC = 0.79–0.87, p≤0.05) (Figs. 2, 3). There was no difference in CSF concentrations of neither brevican nor neurocan peptides between AD patients and control group (Figs. 2, 3).
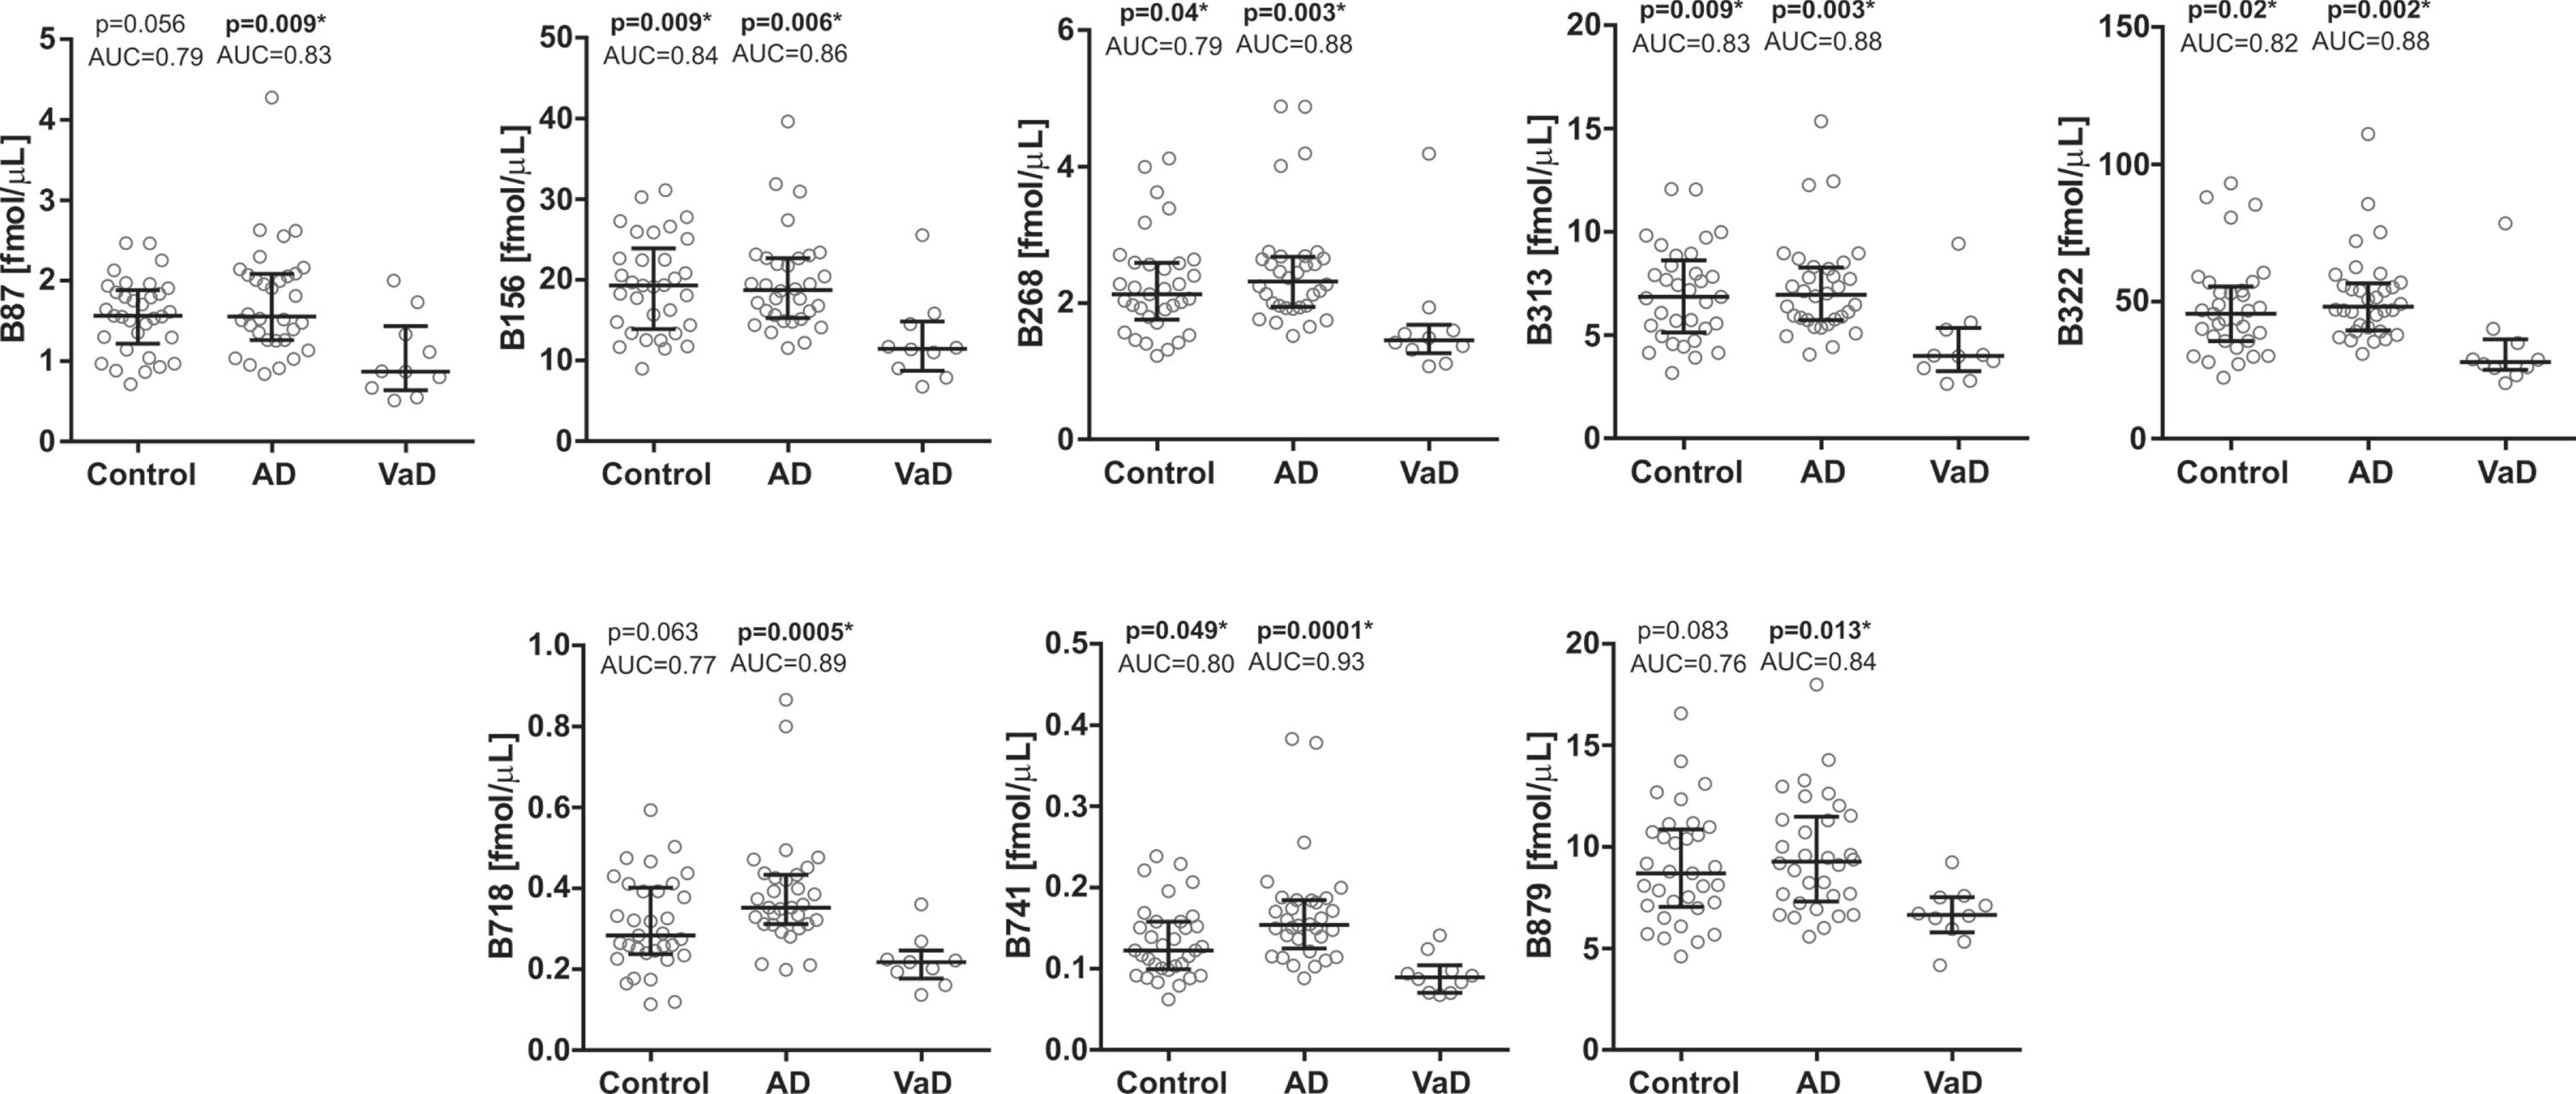
CSF concentrations in cohort 1 for the brevican N-terminal (upper five panels) and C-terminal (lower three panels) peptides in controls and Alzheimer’s disease (AD) patients compared with vascular dementia (VaD) patients. Statistical significance and effect size are in comparison to VaD group. AUC, area under the curve.
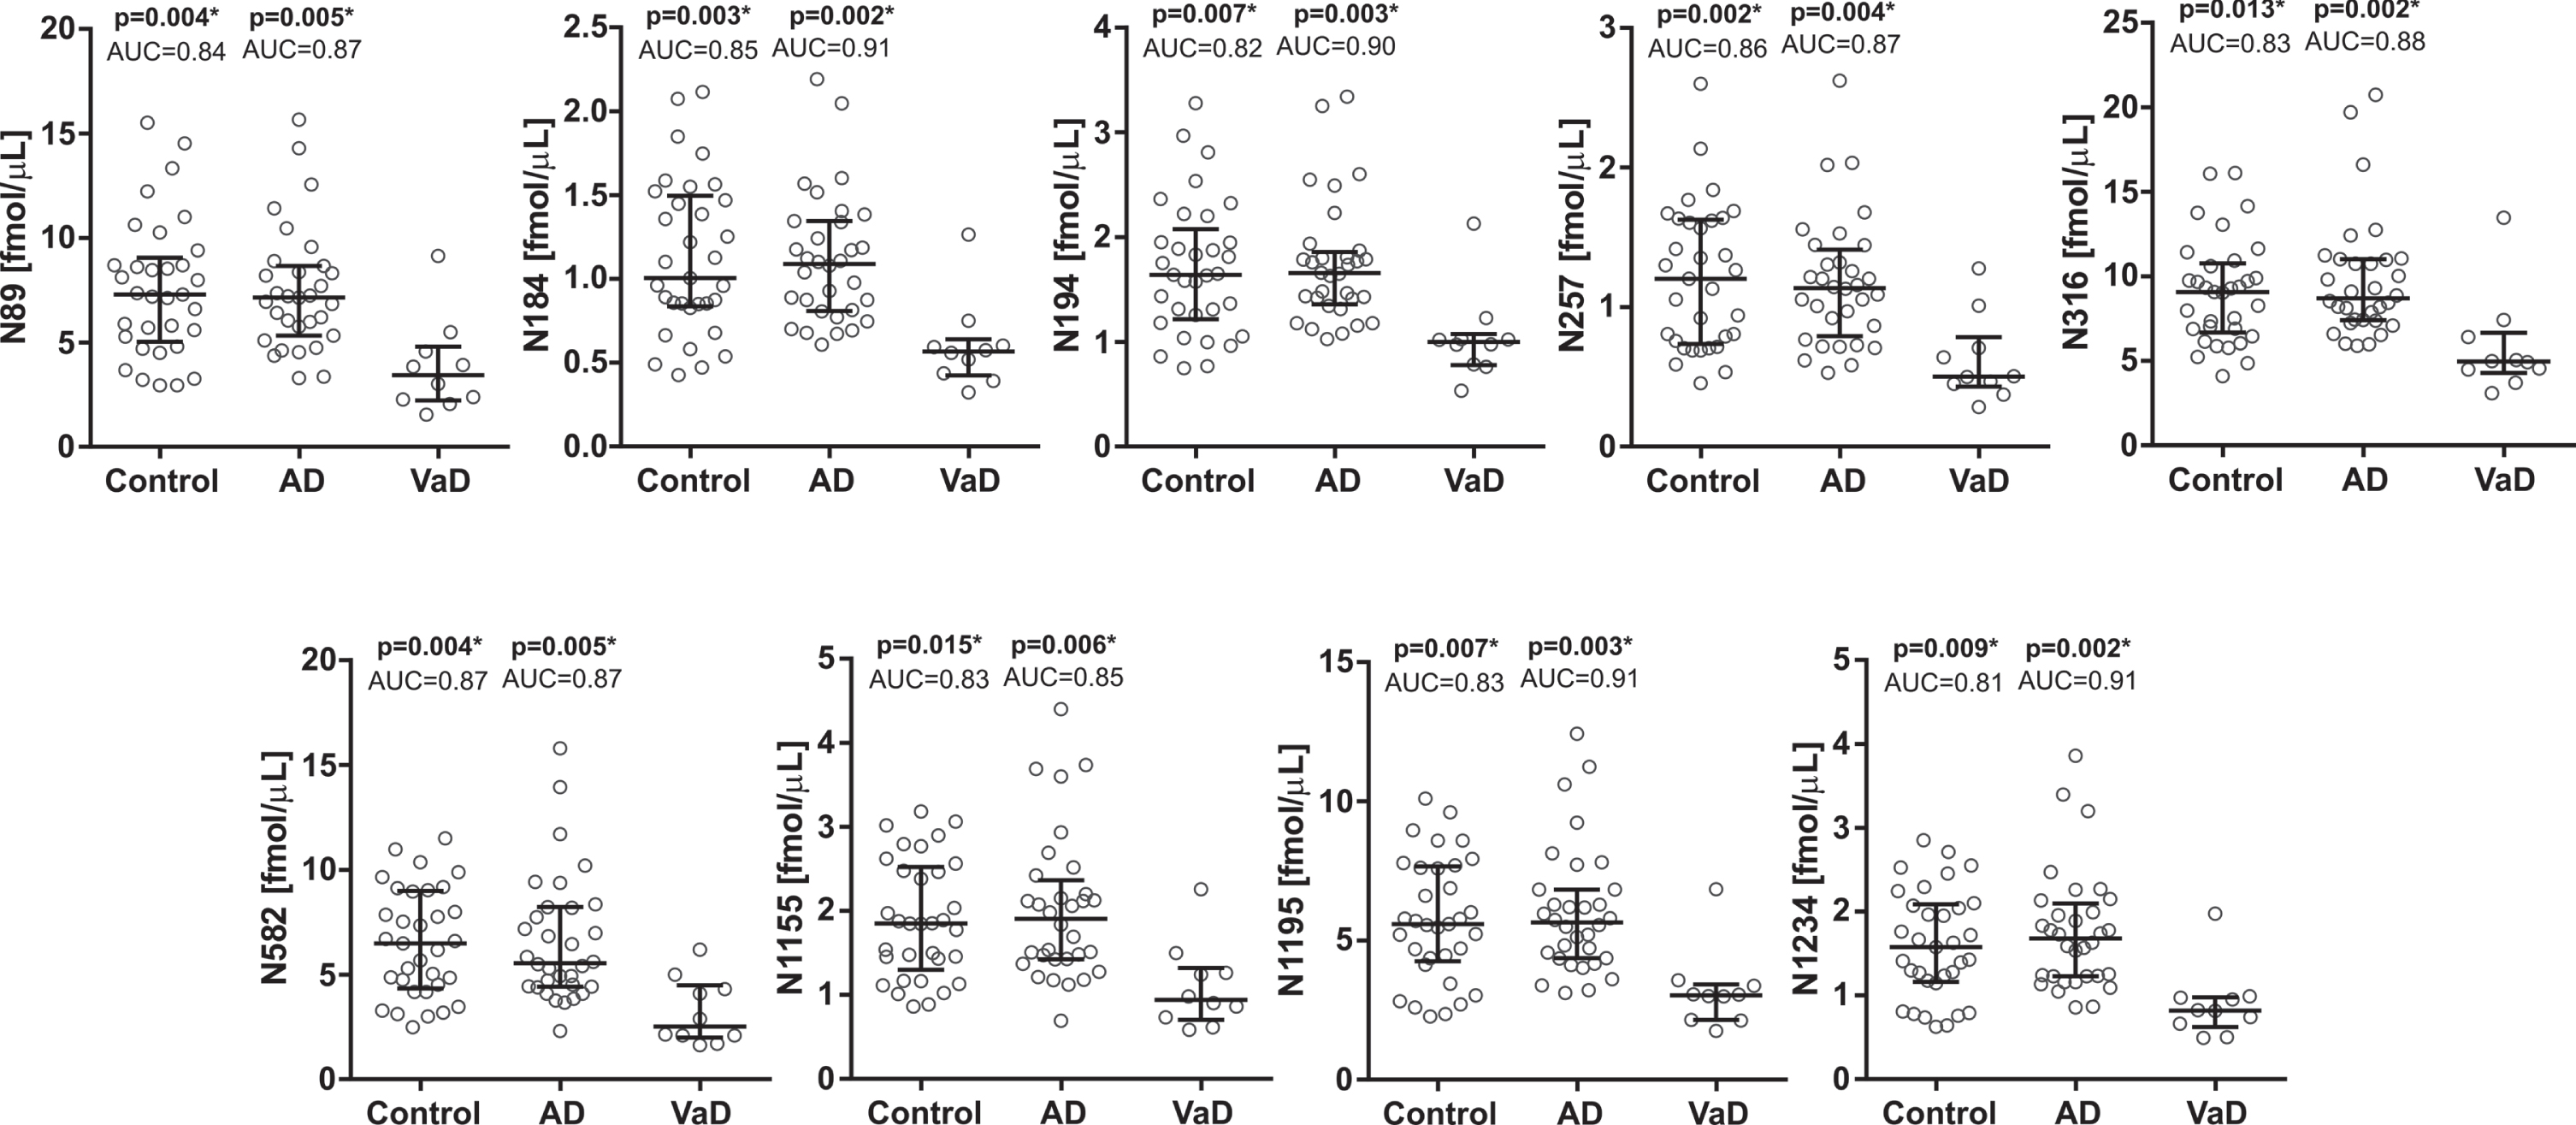
CSF concentrations in cohort 1 for the neurocan N-terminal (upper five panels) and C-terminal (lower four panels) peptides in controls and Alzheimer’s disease (AD) patients compared with vascular dementia (VaD) patients. Statistical significance and effect size are in comparison to VaD group. AUC, area under the curve.
All the brevican and neurocan peptides signifi-cantly correlated to each other in control (rho = 0.58–0.99, p≤0.05) and AD (rho = 0.37–0.99, p≤0.05) groups (Fig. 4). In the VaD group, N-terminal brevi-can peptides were strongly correlated with each other (rho = 0.69–0.99, p≤0.05), while C-terminal brevican peptides did not correlate neither to each other nor to the N-terminal part of the protein (Fig. 4). Neurocan peptides also showed lower correlations between each other in VaD group. The most N-terminal neurocan peptide did not correlate with several other neurocan peptides (N257, N316, N582, N1155) (Fig. 4). Additionally, middle part of neuro-can (N316, N582) did not correlate with the most C-terminal neurocan peptides (N1195, N1234) (Fig. 4).
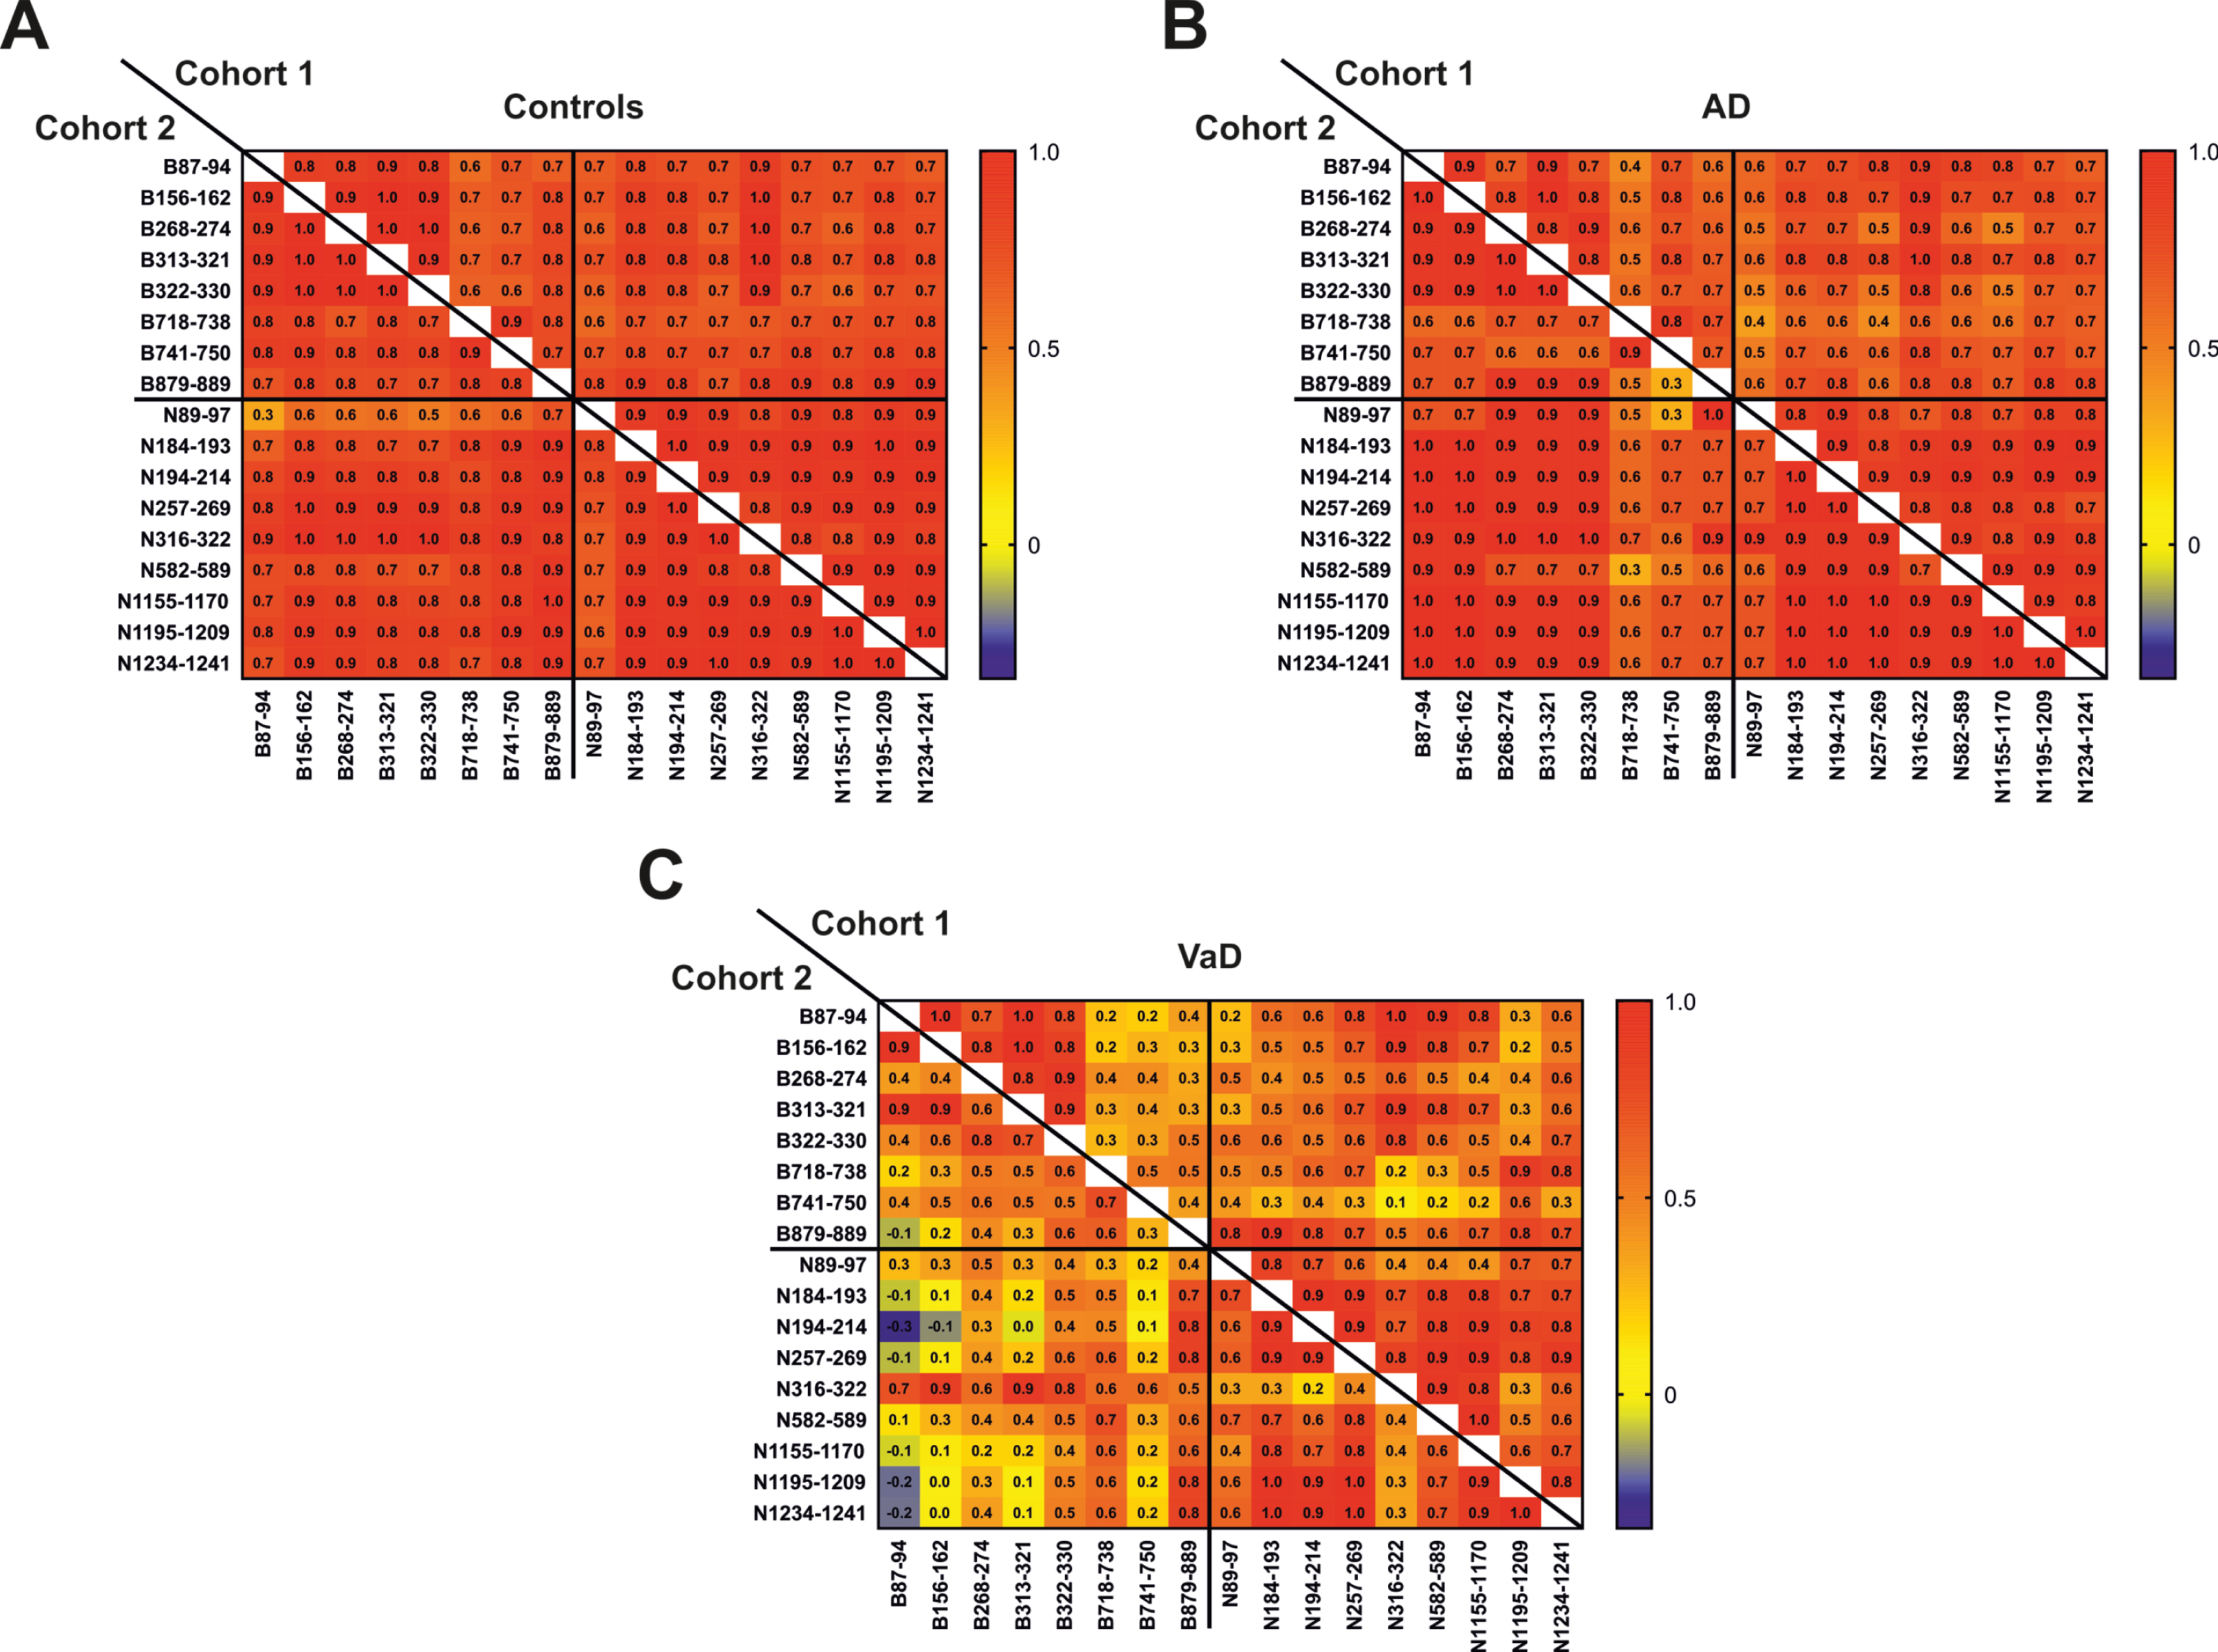
Correlation matrix between CSF concentrations of brevican and neurocan peptides in control (A), AD (B) and VaD (C) groups in cohorts 1 and 2. The correlation coefficients are presented as Spearman’s rho.
There was no association between brevican or neurocan peptides and age, Mini-Mental State Exa-mination (MMSE), or CSF Aβ42 (Supplementary Table 3). All brevican and neurocan peptides significantly correlated to t-tau and p-tau (rho = 0.42–0.64, p≤0.05) (Supplementary Table 2). The majority of the peptides were associated with GFAP (except B718, B741), NSE (except B879), and YKL-40 (rho=–0.42–0.49) (Supplementary Table 3). Two C-terminal peptides (B718, B741) correlated to CSF/serum albumin ratio (rho = 0.29-0.30, p≤0.05) (Supplementary Table 3).
Brevican/neurocan panel: cohort 2
For the CSF concentrations of all brevican and neurocan peptides quantified in cohort 2, see SupplementaryTable 4.
In the second cohort, CSF concentrations of two brevican peptides (B87 and B156) were significantly decreased in VaD compared with AD patients (AUC = 0.86–0.91, p≤0.05) and controls (AUC = 0.80–0.82, p≤0.05) (Fig. 5). The other brevican (Fig. 5) and neurocan (Fig. 6) peptides showed clear trends to be decreased in the VaD group when compared with AD patients (AUC = 0.64–80, p > 0.05). There was no difference in CSF concentrations for neither brevican nor neurocan peptides between AD patients and controls (Figs. 5, 6).
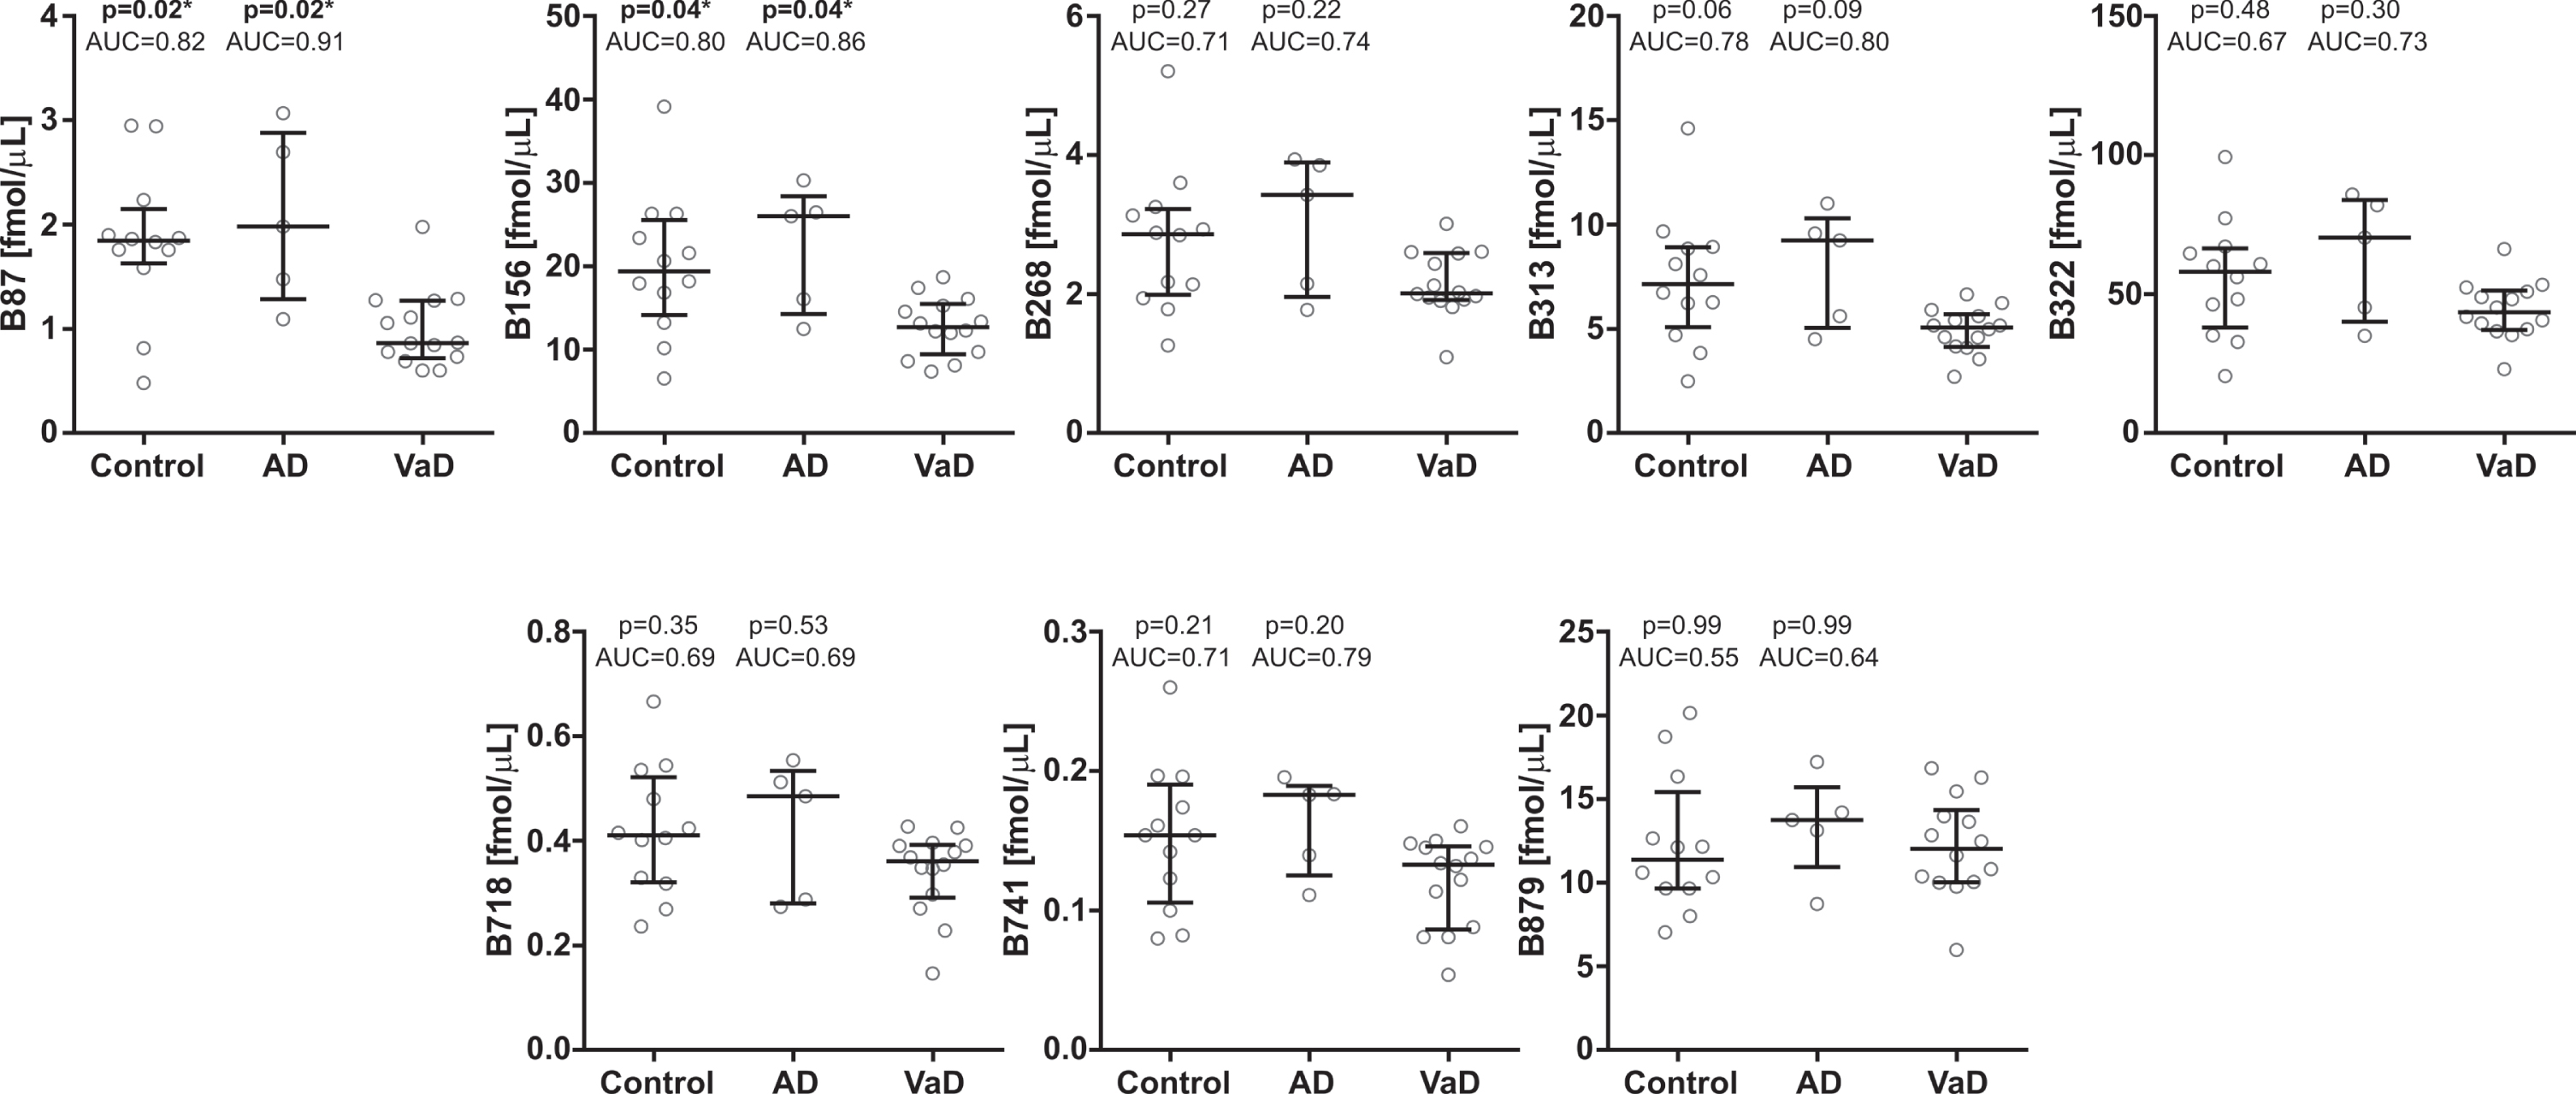
CSF concentrations in cohort 2 for the brevican N-terminal (upper five panel) and C-terminal (lower three panel) peptides in controls and Alzheimer’s disease (AD) patients compared with vascular dementia (VaD) patients. Statistical significance and effect size are in comparison to VaD group. AUC, area under the curve.
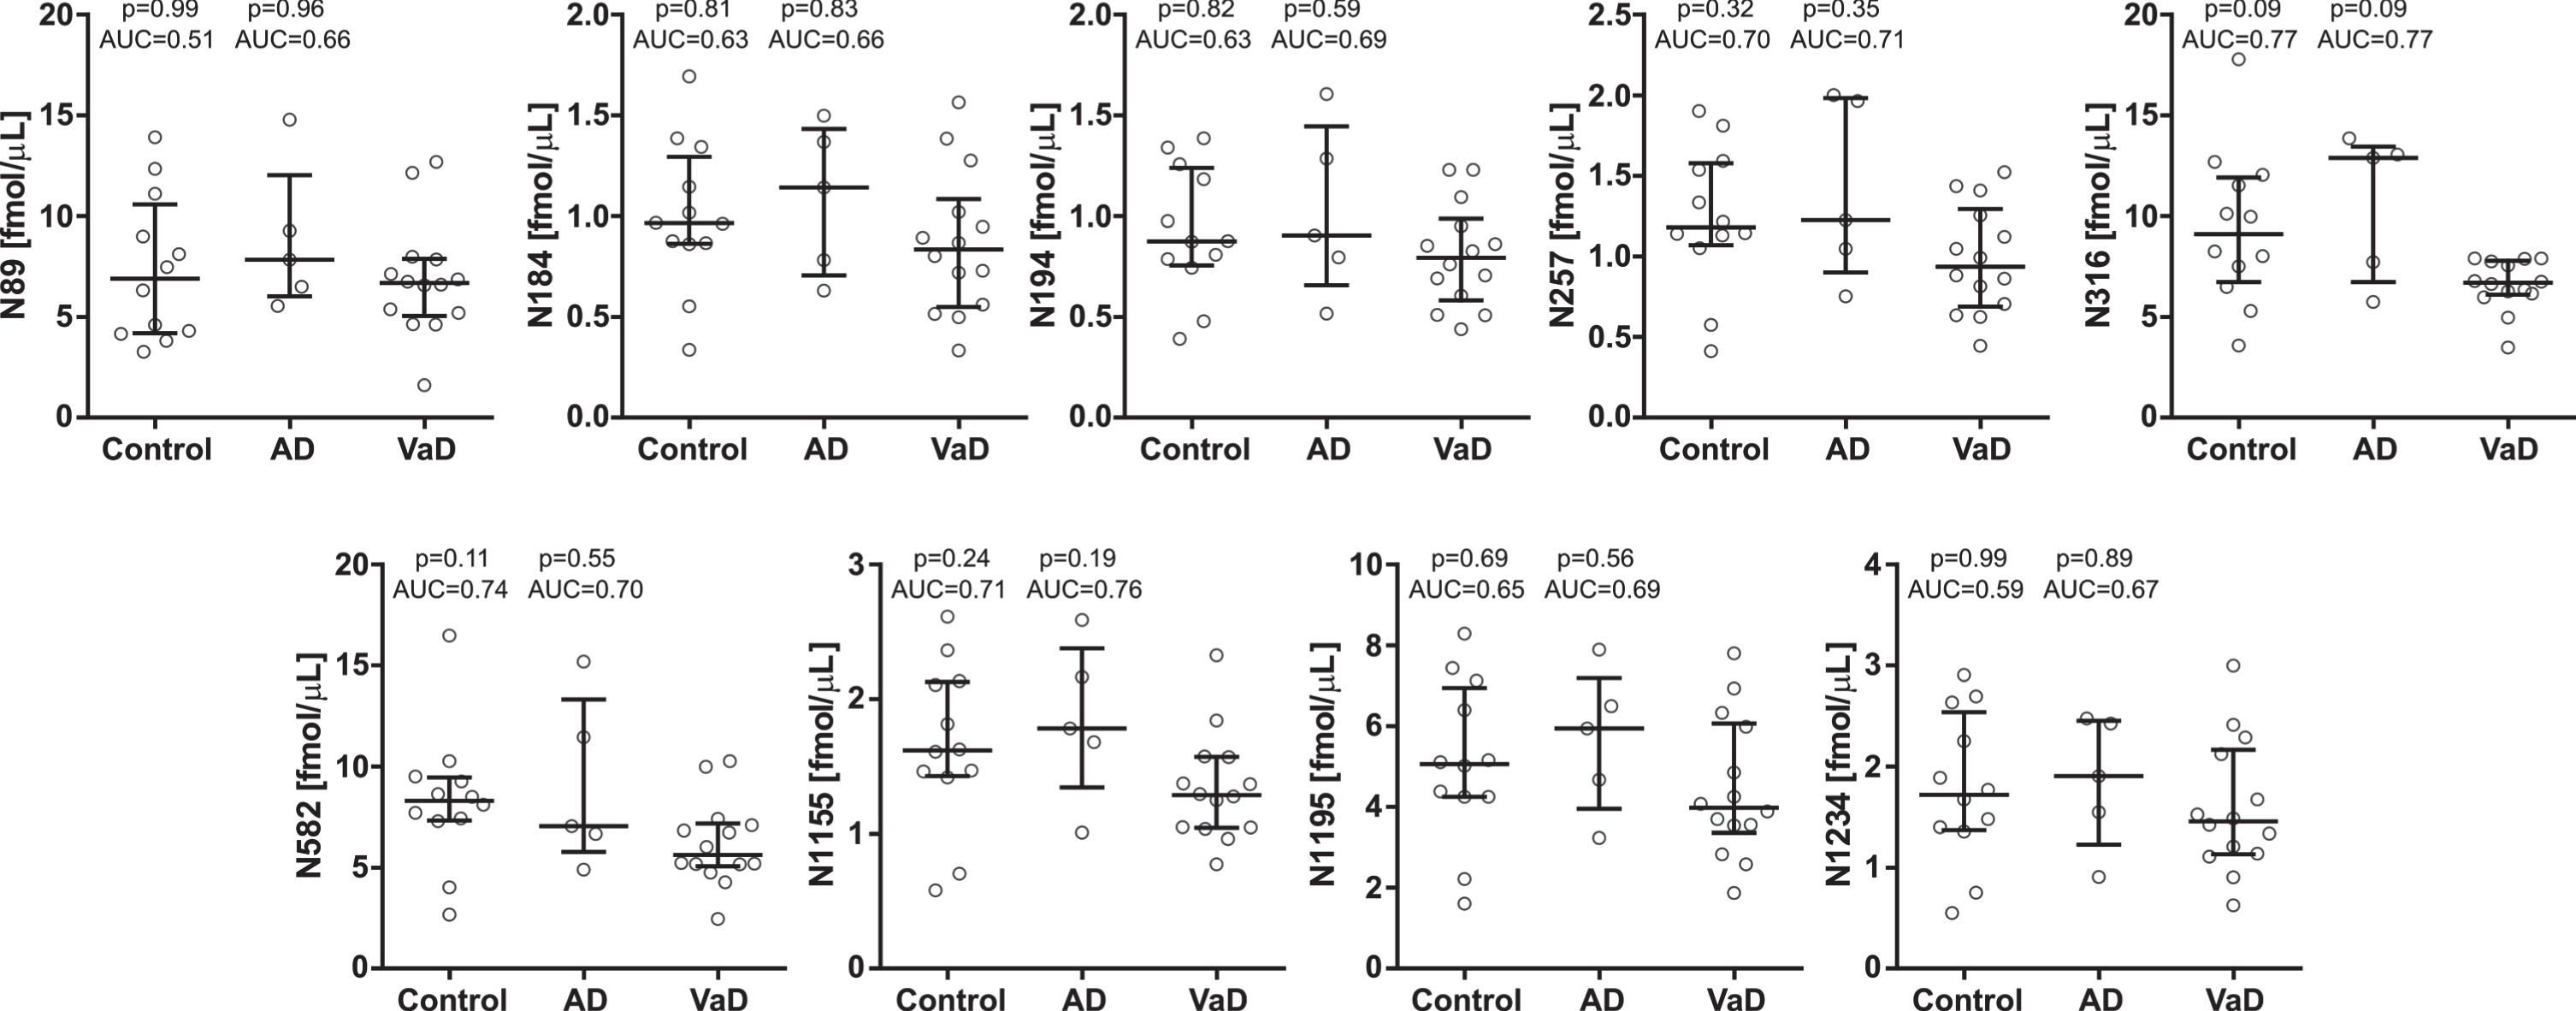
CSF concentrations in cohort 2 for the neurocan N-terminal (upper five panels) and C-terminal (lower four panel) peptides in controls and Alzheimer’s disease (AD) patients compared with vascular dementia (VaD) patients. Statistical significance and effect size are in comparison to VaD group. AUC, area under the curve.
All the brevican and neurocan peptides (except N89) significantly correlated to each other in the control group (rho = 0.65–0.99, p≤0.05) (Fig. 4). In the AD group, N-terminal brevican peptides and all neurocan peptides were associated with each other (rho = 0.60–0.99), even though most of these correlations were not significant due to the small sample size (n = 5) (Fig. 4). The correlations between C-terminal brevican peptides (rho = 0.30–0.90) were lower than in the N-terminal part of the protein (rho = 0.90–0.99) (Fig. 4). In VaD group, the majority of brevican peptides were not associated with each other in contrast to neurocan peptides which, except N316, correlated with each other (rho = 0.58–0.99, p≤0.05) (Fig. 4).
There was no or a very weak association between brevican or neurocan peptides and age, MMSE or CSF Aβ42 (rho=–0.16–0.43) (Supplementary Table 5).
Most of the brevican peptides, except B87, correlated with p-tau (rho = 0.38–0.78, p≤0.05), while only the most C-terminal brevican peptide (B879) showed association with t-tau (rho = 0.70, p≤0.05) (Supplementary Table 5). The neurocan peptides correlated with both p-tau (all) and t-tau (except N316, N582) (rho = 0.45–0.70) (Supplementary Table 5). Some of the peptides (B87, B156, B313, B741, N316 and N582) were associated with CSF/serum albumin ratio (Supplementary Table 5).
DISCUSSION
The main finding of this study is that tryptic CSF brevican and neurocan peptide concentrations may represent potential novel diagnostic markers to differentiate VaD from AD.
The detection of separate pools of N- and C-terminal brevican proteolytic peptides in CSF using N- and C-terminal brevican antibodies, respectively, indicates the presence of endogenous cleavage of brevican in CNS. Moreover, the most C-terminal tryptic brevican peptide (B879) was present in CSF but not detected using the two antibodies. This indicates that there is a third pool of naturally occurring brevican fragments in CSF. The inability to detect endogenous brevican compounds in CSF samples is likely because the captured brevican variants in CSF were too long to be detected by MS at the present levels.
Several studied evaluated various biomarkers to discriminate between AD and VaD in both plasma and CSF (for review [43]). Although the CSF concentrations of platelet-derived growth factor receptor-β (PDGFRβ) is a promising biomarker of BBB breakdown and cognitive dysfunction irrespectively of Aβ and tau changes [44, 45], there is no specific biochemical marker to distinguish between AD and VaD patients. The differentiation between AD and VaD is of a great importance since the pathogenic mechanisms between these diseases differ. Thus, treatment strategies with different targets are needed to prevent or slow down the progress of the respective diseases. For instance, targeting white matter lesions and lacunar infarcts, the most prominent manifestations of subcortical VaD, enables identification of patients at an early stage of this disease and possibility to initiate appropriate treatment [46].
In this study, brevican and neurocan proteolytic peptides present a strong potential to provide a distinction between AD and VaD, a finding confirmed in two independent cohorts. The first cohort showed significant differences between AD and VaD for all the brevican and neurocan peptides, which was confirmed by the second cohort showing a trend for these peptides to be decreased in the VaD group. The lack of significances in the second cohort is most probably caused by the low number of AD patients (n = 5). Even though most of the differences in the second cohort were not statistically significant, the substantial effect size (AUC = 0.64–0.91) confirms that brevican and neurocan peptides have discrimination capacity to distinguish between AD and VaD.
The decrease of CSF concentrations of brevican and neurocan peptides in the VaD group compared with controls and AD patients indicates that brevican/neurocan degradation is enhanced in VaD. Increased levels of several MMPs in brain tissues from VaD patients have previously been observed [47], which might explain the decreased CSF concentrations of MMP’s substrates, brevican and neurocan peptides, in VaD.
The lower correlations of brevican and neurocan peptides in VaD compared with controls and AD pa-tients indicate the brevican/neurocan proteolytic processing is dysregulated in VaD. Different proteolytic processing along the brevican and neurocan protein cores in VaD might reveal imbalance between the synthesis and degradation of different parts of brevican and neurocan in this disease. It might be explained by possible differential activity of various extracellular enzymes along the brevican/neurocan protein core. For instance, CSF MMP-9, but not MMP-2, -3, -10, concentrations were previously obs-erved to be increased in VaD compared with AD patients [48, 49]. However, even though one study showed that individual MMPs might cleave brevican at different sites [23], the proteolytic processing of neurocan is largely unknown. The fact that most of the brevican and neurocan peptides correlated to each other in the AD and control groups, but not in the VaD group, indicate that there is a different ECM proteolytic processing that is specific to VaD. Substantial decrease of correlations between C-ter-minal brevican peptides in the VaD group compared with control and AD groups indicate that the in-creased processing of brevican is mostly located in the C-terminal part of this protein. The decrease of correlations between neurocan peptides in VaD cohorts was observed throughout the protein, indicating that there are several endogenous cleavages along the neurocan core in CNS.
Since none of the CSF brevican/neurocan peptide concentrations in AD differed compared with the control group, these proteolytic peptides do not reflect AD pathology in CSF. This is in accordance with the previous findings from our group that show no significant differences in CSF brevican and neurocan concentrations between AD and control groups [29]. High correlations between brevican or neurocan peptides in control and AD groups indicate that there is very little AD pathology driven proteolytic processing of these proteins in CNS. In addition, brevican and neurocan are not linked to cognitive status as determined by MMSE test scores.
The correlation of the majority of brevican and neurocan peptides to CSF t-tau, p-tau, and YKL-40 suggests that they might be related to the AD-type neuronal degeneration, tangle pathology and neuroinflammation, respectively. The significant correlations of several brevican and neurocan peptides to CSF/serum albumin ratio indicate that they also might be related to blood-brain barrier (BBB) dysfunction, which is a core feature of VaD pathophysiology [50]. MMPs, which cleave brevican and neurocan [22, 27], degrade tight junctions between endothelial cells in BBB. This suggests that the brevican and neurocan processing might be implicated in BBB breakdown.
The lack of correlation of C-terminal brevican peptides to GFAP or NSE, in contrast to other brevican and neurocan peptides, suggests differential pathophysiological role of these peptides.
The strength of the study includes well-charact-erized, age and gender-matched populations in both cohorts. The multi-center setting involving two inde-pendent cohorts allowed for demonstration of reproducibility of the findings.
However, there are some limitations to the study that should be considered, including lack of explorative IP-based data for neurocan protein and low number (n = 5) of AD patients in the second cohort. In addition, the CSF sample collection involves an invasive lumbar puncture procedure that requires special training by the physician. Moreover, complications might follow, e.g., post-lumbar puncture headache. Lastly, the current study includes only a biomarker for AD-type neurodegeneration (t-tau) and does not incorporate any marker for subcortical damage such as neurofilament light.
In conclusion, this study demonstrates that CSF brevican and neurocan peptides concentrations have potential to become a complementary tool in the differentiation of VaD from AD.
Footnotes
ACKNOWLEDGMENTS
KM acknowledges funding from Stiftelsen för Gamla Tjänarinnor, Herbert och Karin Jacobssons Stiftelse, and Gun och Bertil Stohnes Stiftelse. PK is supported by the ALF-agreement (#ALFGBG-724331). HZ is a Wallenberg Scholar supported by grants from the Swedish Research Council (#2018-02532), the European Research Council (#681712), Swedish State Support for Clinical Research (#ALFGBG-720931), the Alzheimer Drug Discovery Foundation (ADDF), USA (#201809-2016862), and the UK Dementia Research Institute at UCL. KB is supported by the Swedish Research Council (#2017-00915), the Alzheimer Drug Discovery Foundation (ADDF), USA (#RDAPB-201809-2016615), the Swedish Alzheimer Foundation (#AF-742881), Hjärnfonden, Sweden (#FO2017-0243), the Swedish state under the agreement between the Swedish government and the County Councils, the ALF-agree-ment (#ALFGBG-715986), and European Union Joint Program for Neurodegenerative Disorders (JPND2019-466-236).