
Abstract
Background:
Neighborhood greenness (vegetative presence) has been linked to multiple health outcomes, but its relationship to Alzheimer’s disease (AD) and non-Alzheimer’s (non-AD) dementia has been less studied.
Objective:
This study examines the relationship of greenness to both AD and non-AD dementia in a population-based sample of Medicare beneficiaries.
Methods:
Participants were 249,405 US Medicare beneficiaries aged > 65 years living in Miami-Dade County, FL, from 2010 to 2011. Multi-level analyses examined the relationship of greenness, assessed by mean Census block level Normalized Difference Vegetation Index (NDVI), to odds of each of AD, Alzheimer’s disease and related dementias (ADRD), and non-AD dementia, respectively. Covariates included age, gender, race/ethnicity, number of comorbid health conditions, and neighborhood income.
Results:
Higher greenness was associated with reduced risk of AD, ADRD, and non-AD dementia, respectively, adjusting for individual and neighborhood sociodemographics. Compared to the lowest greenness tertile, the highest greenness tertile was associated with reduced odds of AD by 20%(odds ratio, 0.80; 95%CI, 0.75–0.85), ADRD by 18%(odds ratio, 0.82; 95%CI, 0.77–0.86), and non-AD dementia by 11%(odds ratio, 0.89; 95%CI, 0.82–0.96). After further adjusting for number of comorbidities, compared to the lowest greenness tertile, the highest greenness tertile was associated with reduced odds of AD (OR, 0.94; 95%CI, 0.88–1.00) and ADRD (OR, 0.93; 95%CI, 0.88–0.99), but not non-AD dementia (OR, 1.01; 95%CI, 0.93–1.08).
Conclusion:
High neighborhood greenness may be associated with lower odds of AD and ADRD. Environmental improvements, such as increasing neighborhood vegetation, may be a strategy to reduce risk for AD and possibly other dementias.
Keywords
INTRODUCTION
Estimates of incidence and prevalence of Alz-heimer’s disease (AD) are high across the globe. As of 2020, it is estimated that there are 5.8 million adults aged 65 years or older living with AD in the United States, or approximately one in ten people aged 65 years or older [1, 2]. AD is the most common form of dementia, and is related to amyloid-β plaque formation at neuronal synapses that is associated with neuronal injury and cognitive dysfunction. Non-Alzheimer’s (non-AD) dementia also has relatively high incidence and prevalence, with significant impacts on morbidity, mortality, and quality of life [3, 4]. Non-AD dementia encompasses a broader group of less prevalent dementias including: vascular dementia, frontotemporal dementia, senile dementia, presenile dementia, Pick’s disease, and other specified and unspecified dementias. Alzheimer’s disease and related dementias (ADRD) include both AD, plus forms of non-AD dementia defined above. The pathophysiology of AD and non-AD dementia has been described in detail previously [4–7]. Environmental risk factors have been documented to play significant roles in the natural history of both AD and non-AD dementia [8, 9]. Among environmental factors, air pollution has consistently shown a relationship with AD [8]. A similar relationship with air pollution—as measured by particulate matter or ozone levels—has been shown with non-AD [10]. It is hypothesized that reduction of AD and non-AD dementia incidence at the population level could be accomplished through vascular risk factor modifications such as hypertension control, smoking cessation, physical exercise, and other lifestyle changes [11]. The Institute of Medicine and the World Dementia Council have recommended increased physical activity as a means to reduce risk of cognitive decline and dementia [12, 13]. A relatively novel environmental protective factor that has been identified for chronic diseases is environmental greenness, or vegetative presence. Environmental greenness can be quantified using Normalized Difference Vegetative Index (NDVI), a measure based on the difference between the levels of visible and near infrared sunlight reflected from the earth’s surface. Chlorophyll in healthy plants absorbs visible light (for use in photosynthesis) and reflects near infrared light, while the inverse is true of areas with lower levels of healthy vegetation. Using this measure, neighborhood greenness has been associated with lower rates of cardiometabolic conditions including hypertension and diabetes, as well as cardiovascular disease [14, 15], and age-related cognitive decline [16, 17]—all of which are risk factors for AD and non-AD dementia [18]. Further, greenness has been shown to have an apparent protective effect on stroke, depression, Parkinson’s disease, and AD [19–22]. By developing a better understanding the role of environmental factors, including greenness, in AD and non-AD dementia among older adults, we may inform and complement existing prevention interventions for AD and non-AD dementia.
In this study we examine the relationship between neighborhood greenness and diagnosis of AD, ADRD, and non-AD dementia, among older US adults residing in Miami-Dade County, Florida.
METHODS AND MATERIALS
Study population
We included data from 249,405 U.S. Medicare beneficiaries living in Miami-Dade County, Florida, aged 65 years or older living in the same location from 2010–2011. The derivation of this Medicare beneficiary cohort was previously described in detail, as shown in Fig. 1 [14, 15]. In brief, among the initial cohort of 407,296 beneficiaries, 395,789 resided in Miami-Dade County, of whom 381,493 were alive throughout 2011. Among these adults, 313,812 were aged 65 years or older at the time of the analysis. After excluding beneficiaries who did not have NDVI data available for their home address, 299,771 beneficiaries remained. Once beneficiaries from racial or ethnic groups with insufficient size for analysis (i.e., representing a racial/ethnic group with 1%pre-valence in Miami-Dade County) were excluded, 287,639 remained. Excluding adults who did not live at the same address from 2010–2011, 253,055 re-mained. Lastly, nursing home residents were further excluded resulting in our final cohort of 249,405 older adults (Fig. 1). This study was approved by the University of Miami’s Institutional Review Board (IRB) and the U.S. Centers for Medicare and Medicaid Services’ (CMS’) Data Privacy Board.
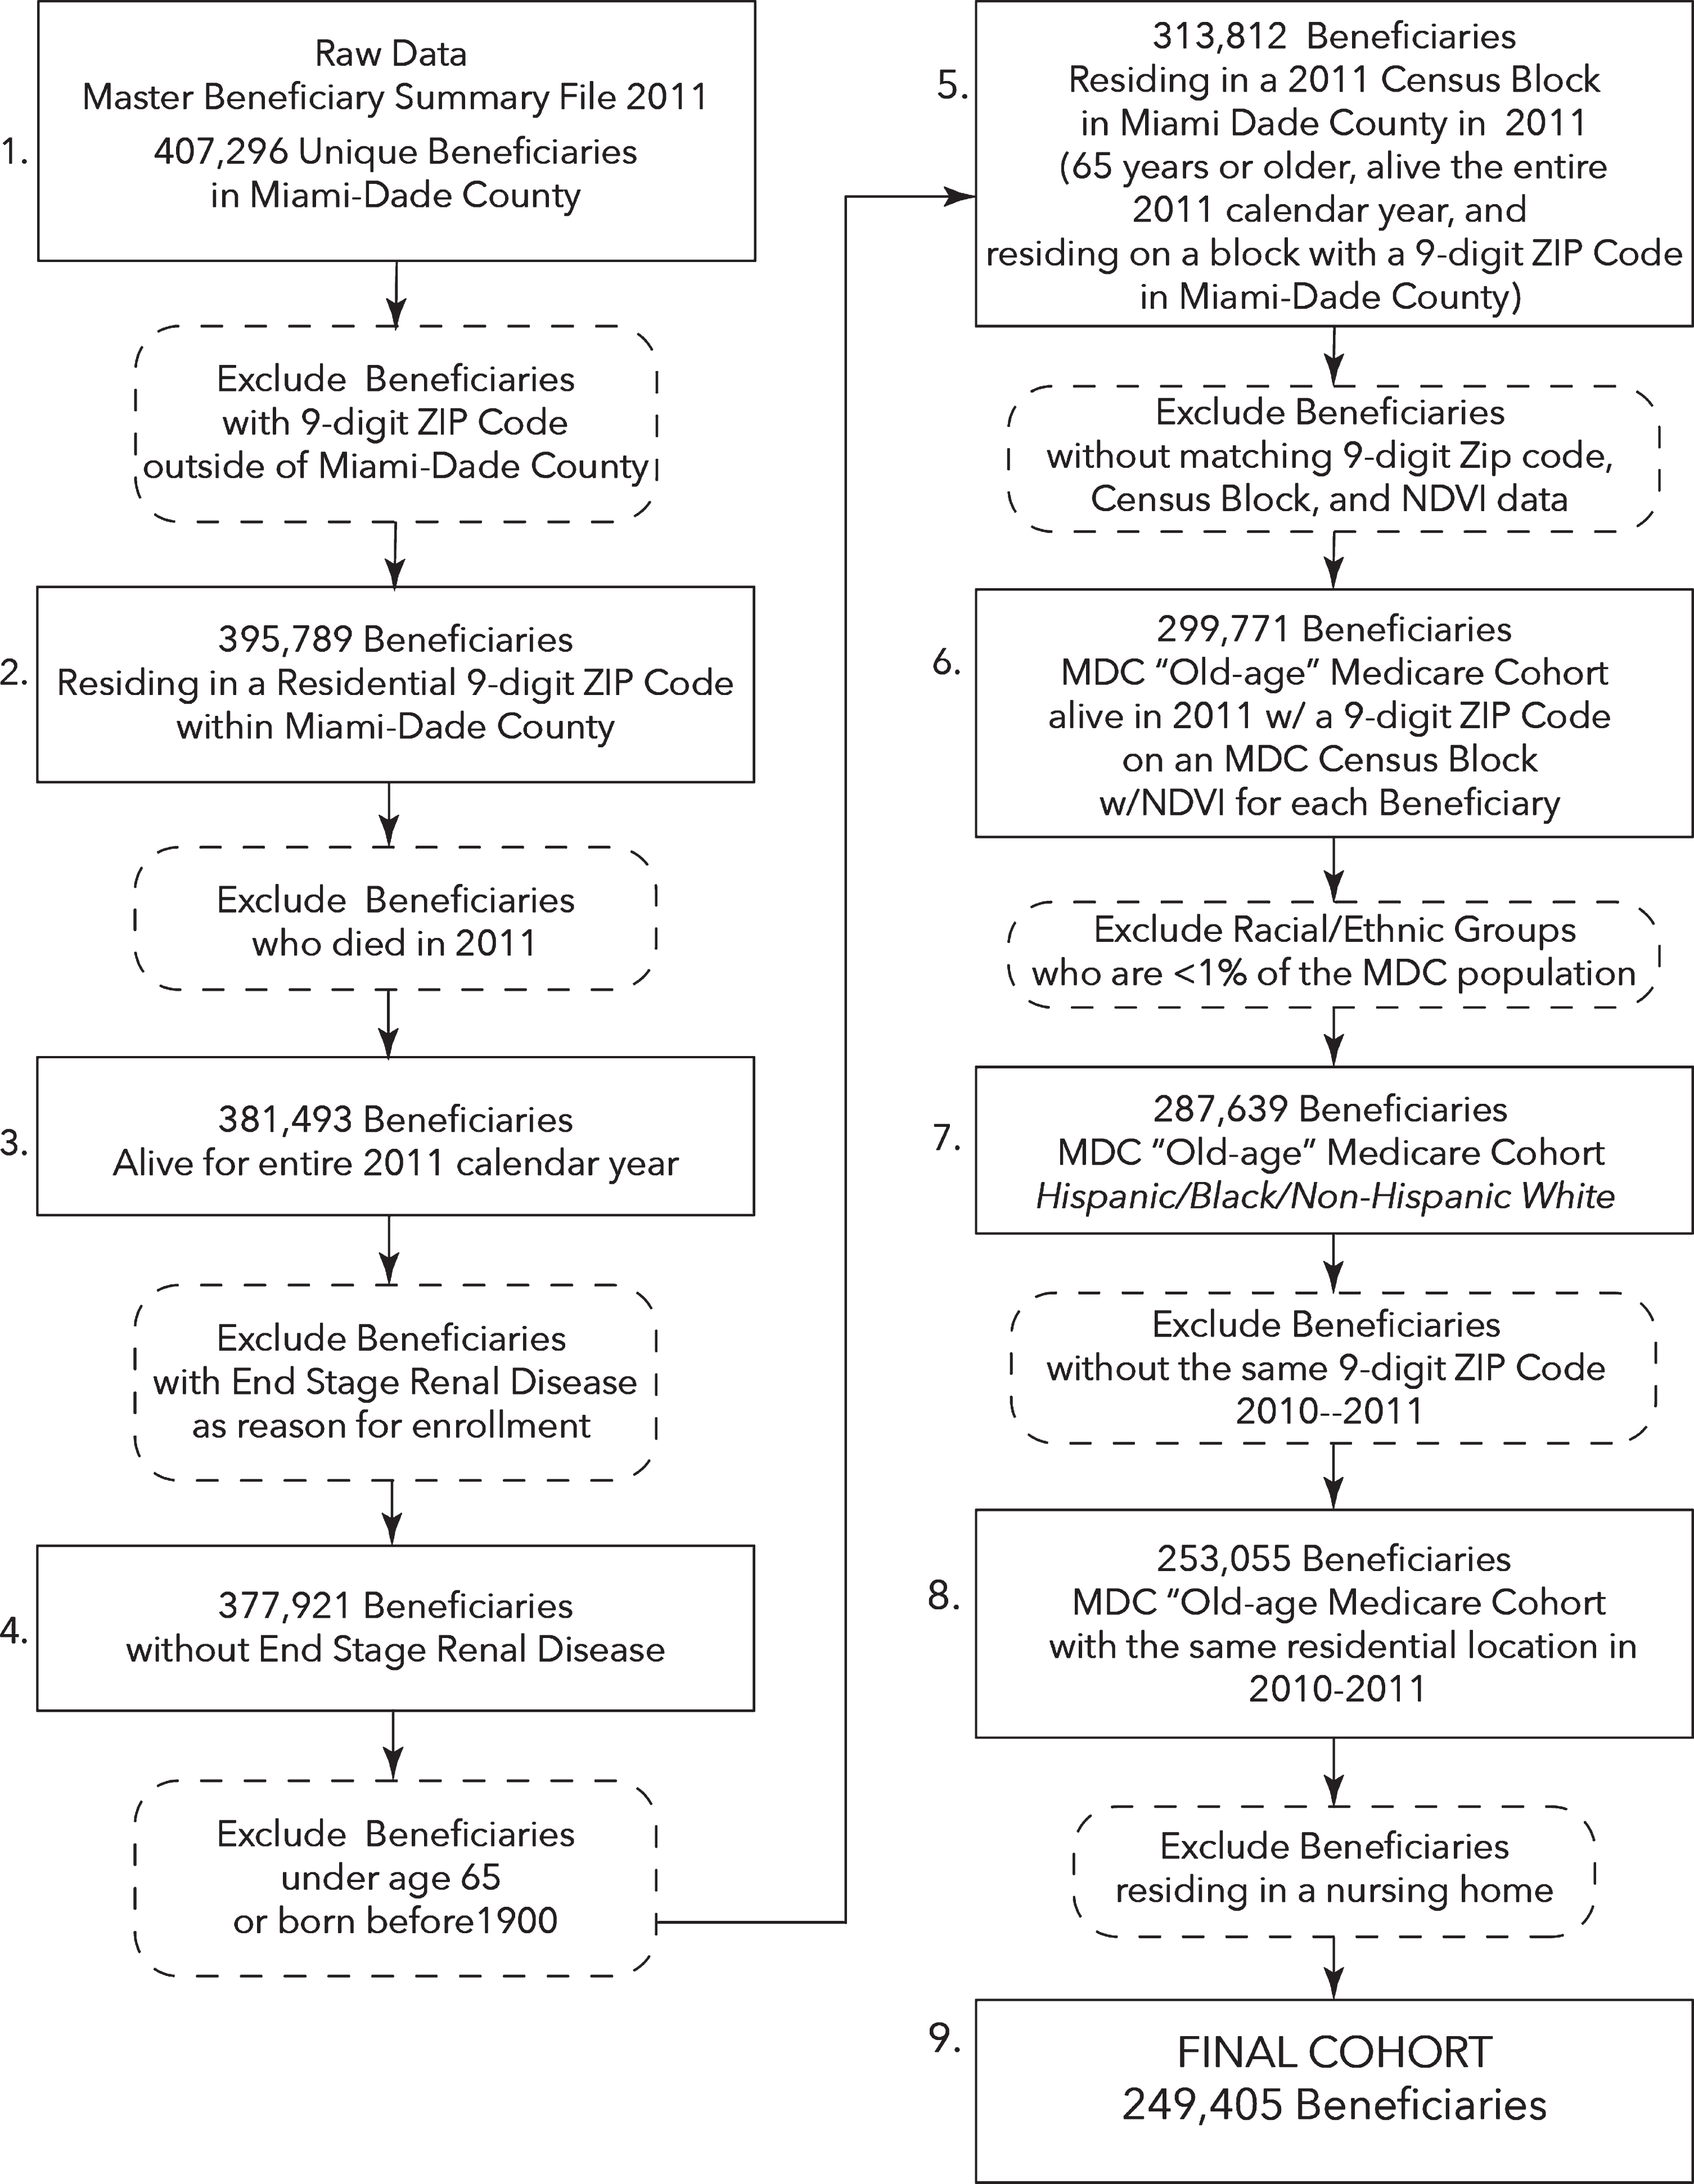
Flow Diagram of Final Cohort (adapted from Brown et al., 2016 [14], Wang et al., 2019 [15]). Illustrating the process of deriving the overall cohort of all Miami-Dade County (MDC) Medicare beneficiaries, over 65 years of age, alive and residing on a Census Block with an MDC residential 9-digit ZIP Code from 2010-11, identifying as an ethnic group > 1%of MDC, without End Stage Renal Disease (ESRD), and not a resident of a nursing home.
Data extraction
As previously described [14, 15], the U.S. Centers for Medicare and Medicaid Services’ (CMS’) 2011 Master Beneficiary Summary File for these ben-eficiaries was used to obtain individual age, sex, race/ethnicity, chronic conditions (see Fig. 2), and location (ZIP+4). The chronic conditions were defined by CMS’ chronic conditions algorithms, based on Me-dicare claims [23] (see Fig. 2). AD was defined using CMS’ chronic conditions algorithm for AD, which assesses the presence/absence of AD using ICD9 codes for DX 331.0 (any diagnosis for the claim, across claim types) for that beneficiary (CCW, 2020) [24]. ADRD diagnosis was defined to included AD defined above, plus forms of non-AD dementia (see Fig. 3) based on CMS’ chronic conditions algorithm using ICD9 diagnoses across claim types for that beneficiary (CCW, 2020) [24]. Non-Alzheimer’s dementia (non-AD) was defined as having a diagnosis of ADRD, but not AD. Geolytics ZIP+4 software was used to link each ZIP+4 for the corresponding Census block (GeoLytics, Inc, Somerville, NJ) [25].
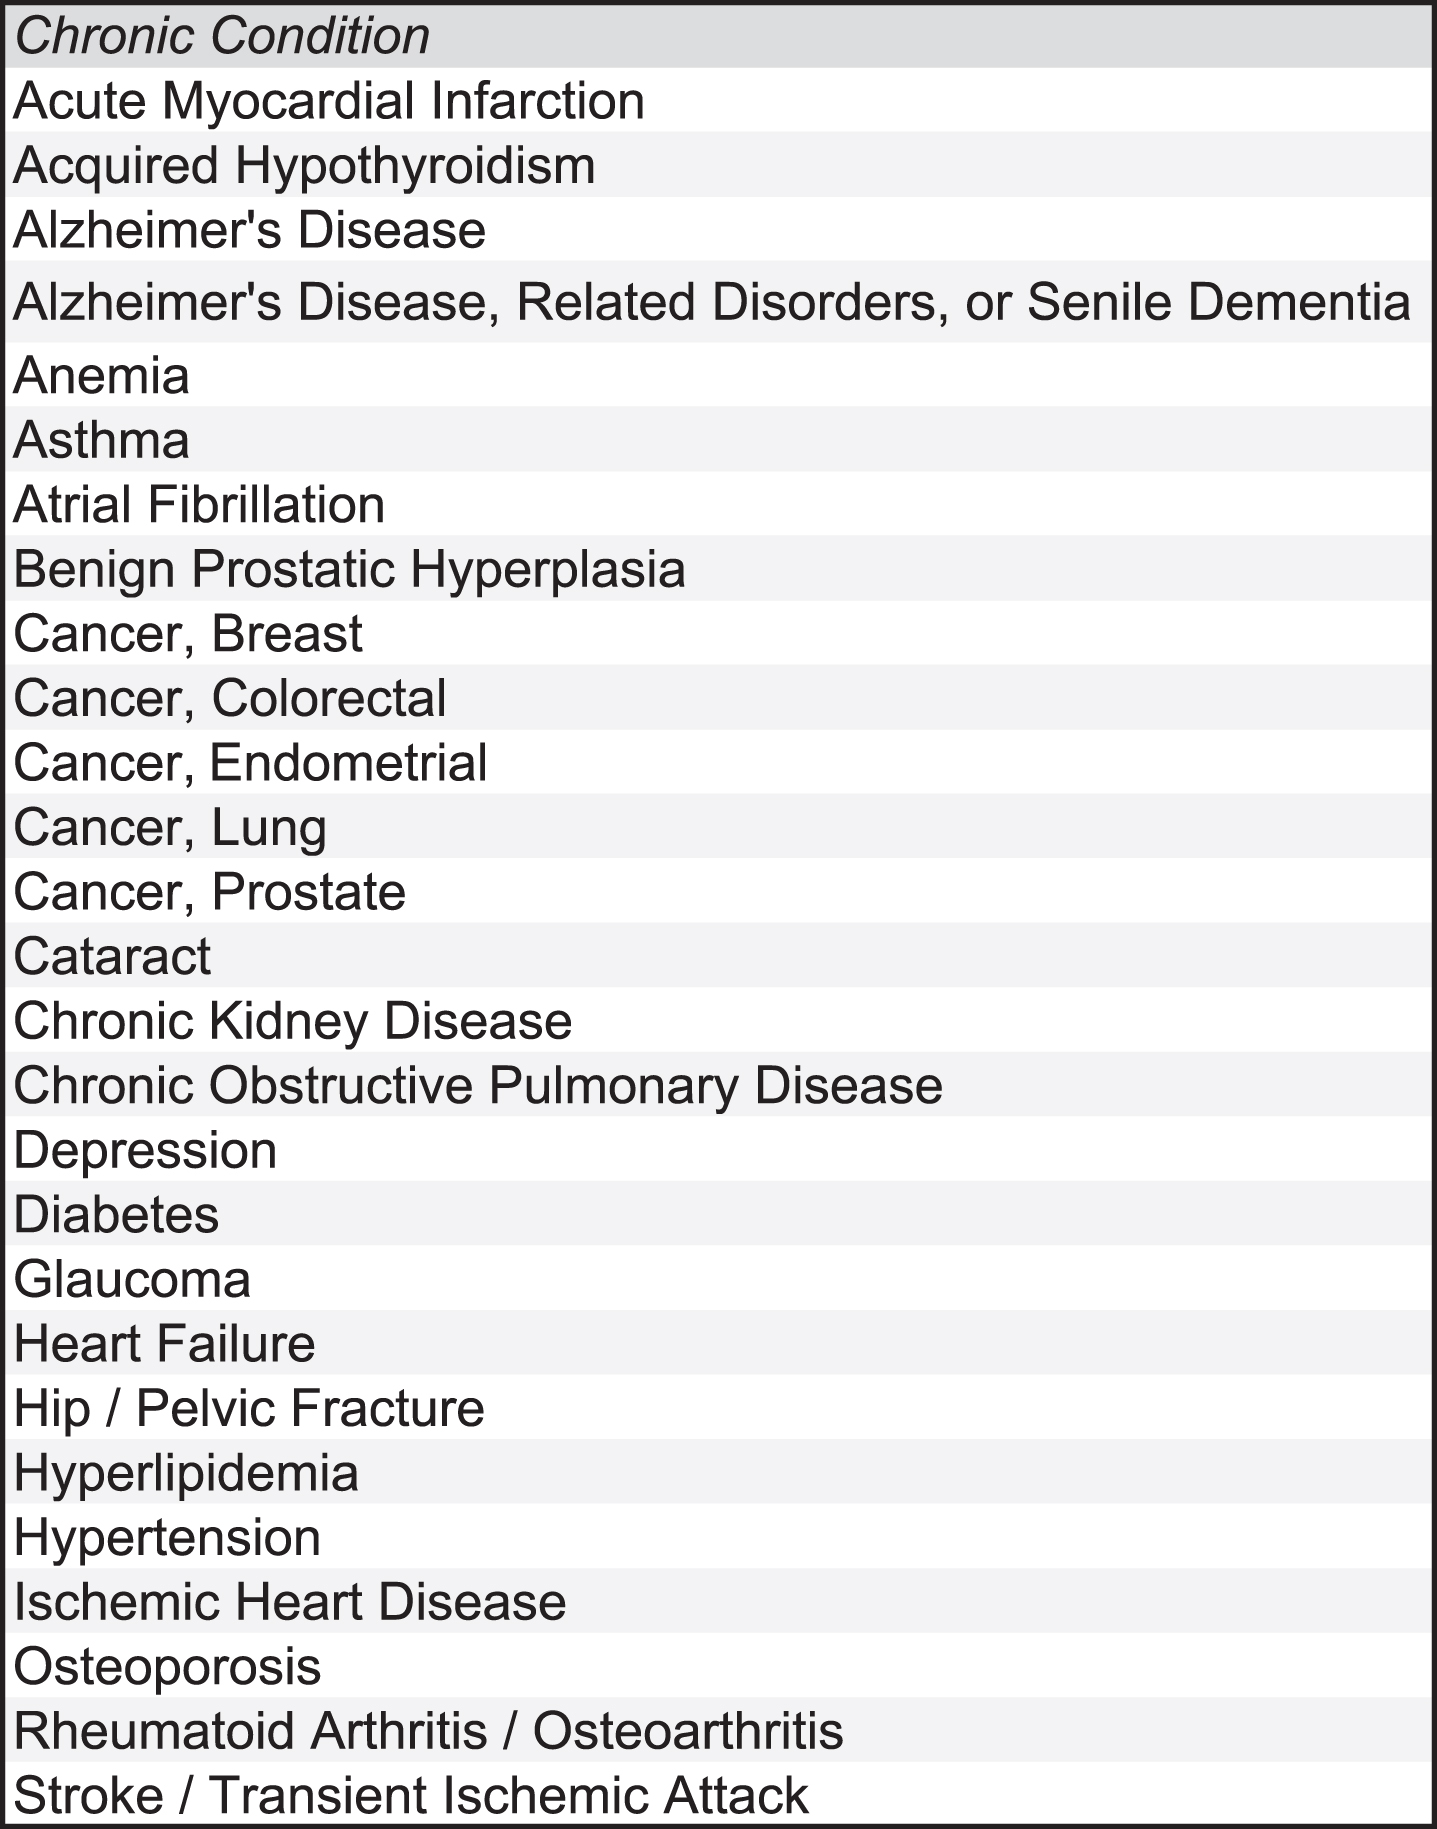
CCW Chronic Conditions Data Warehouse.
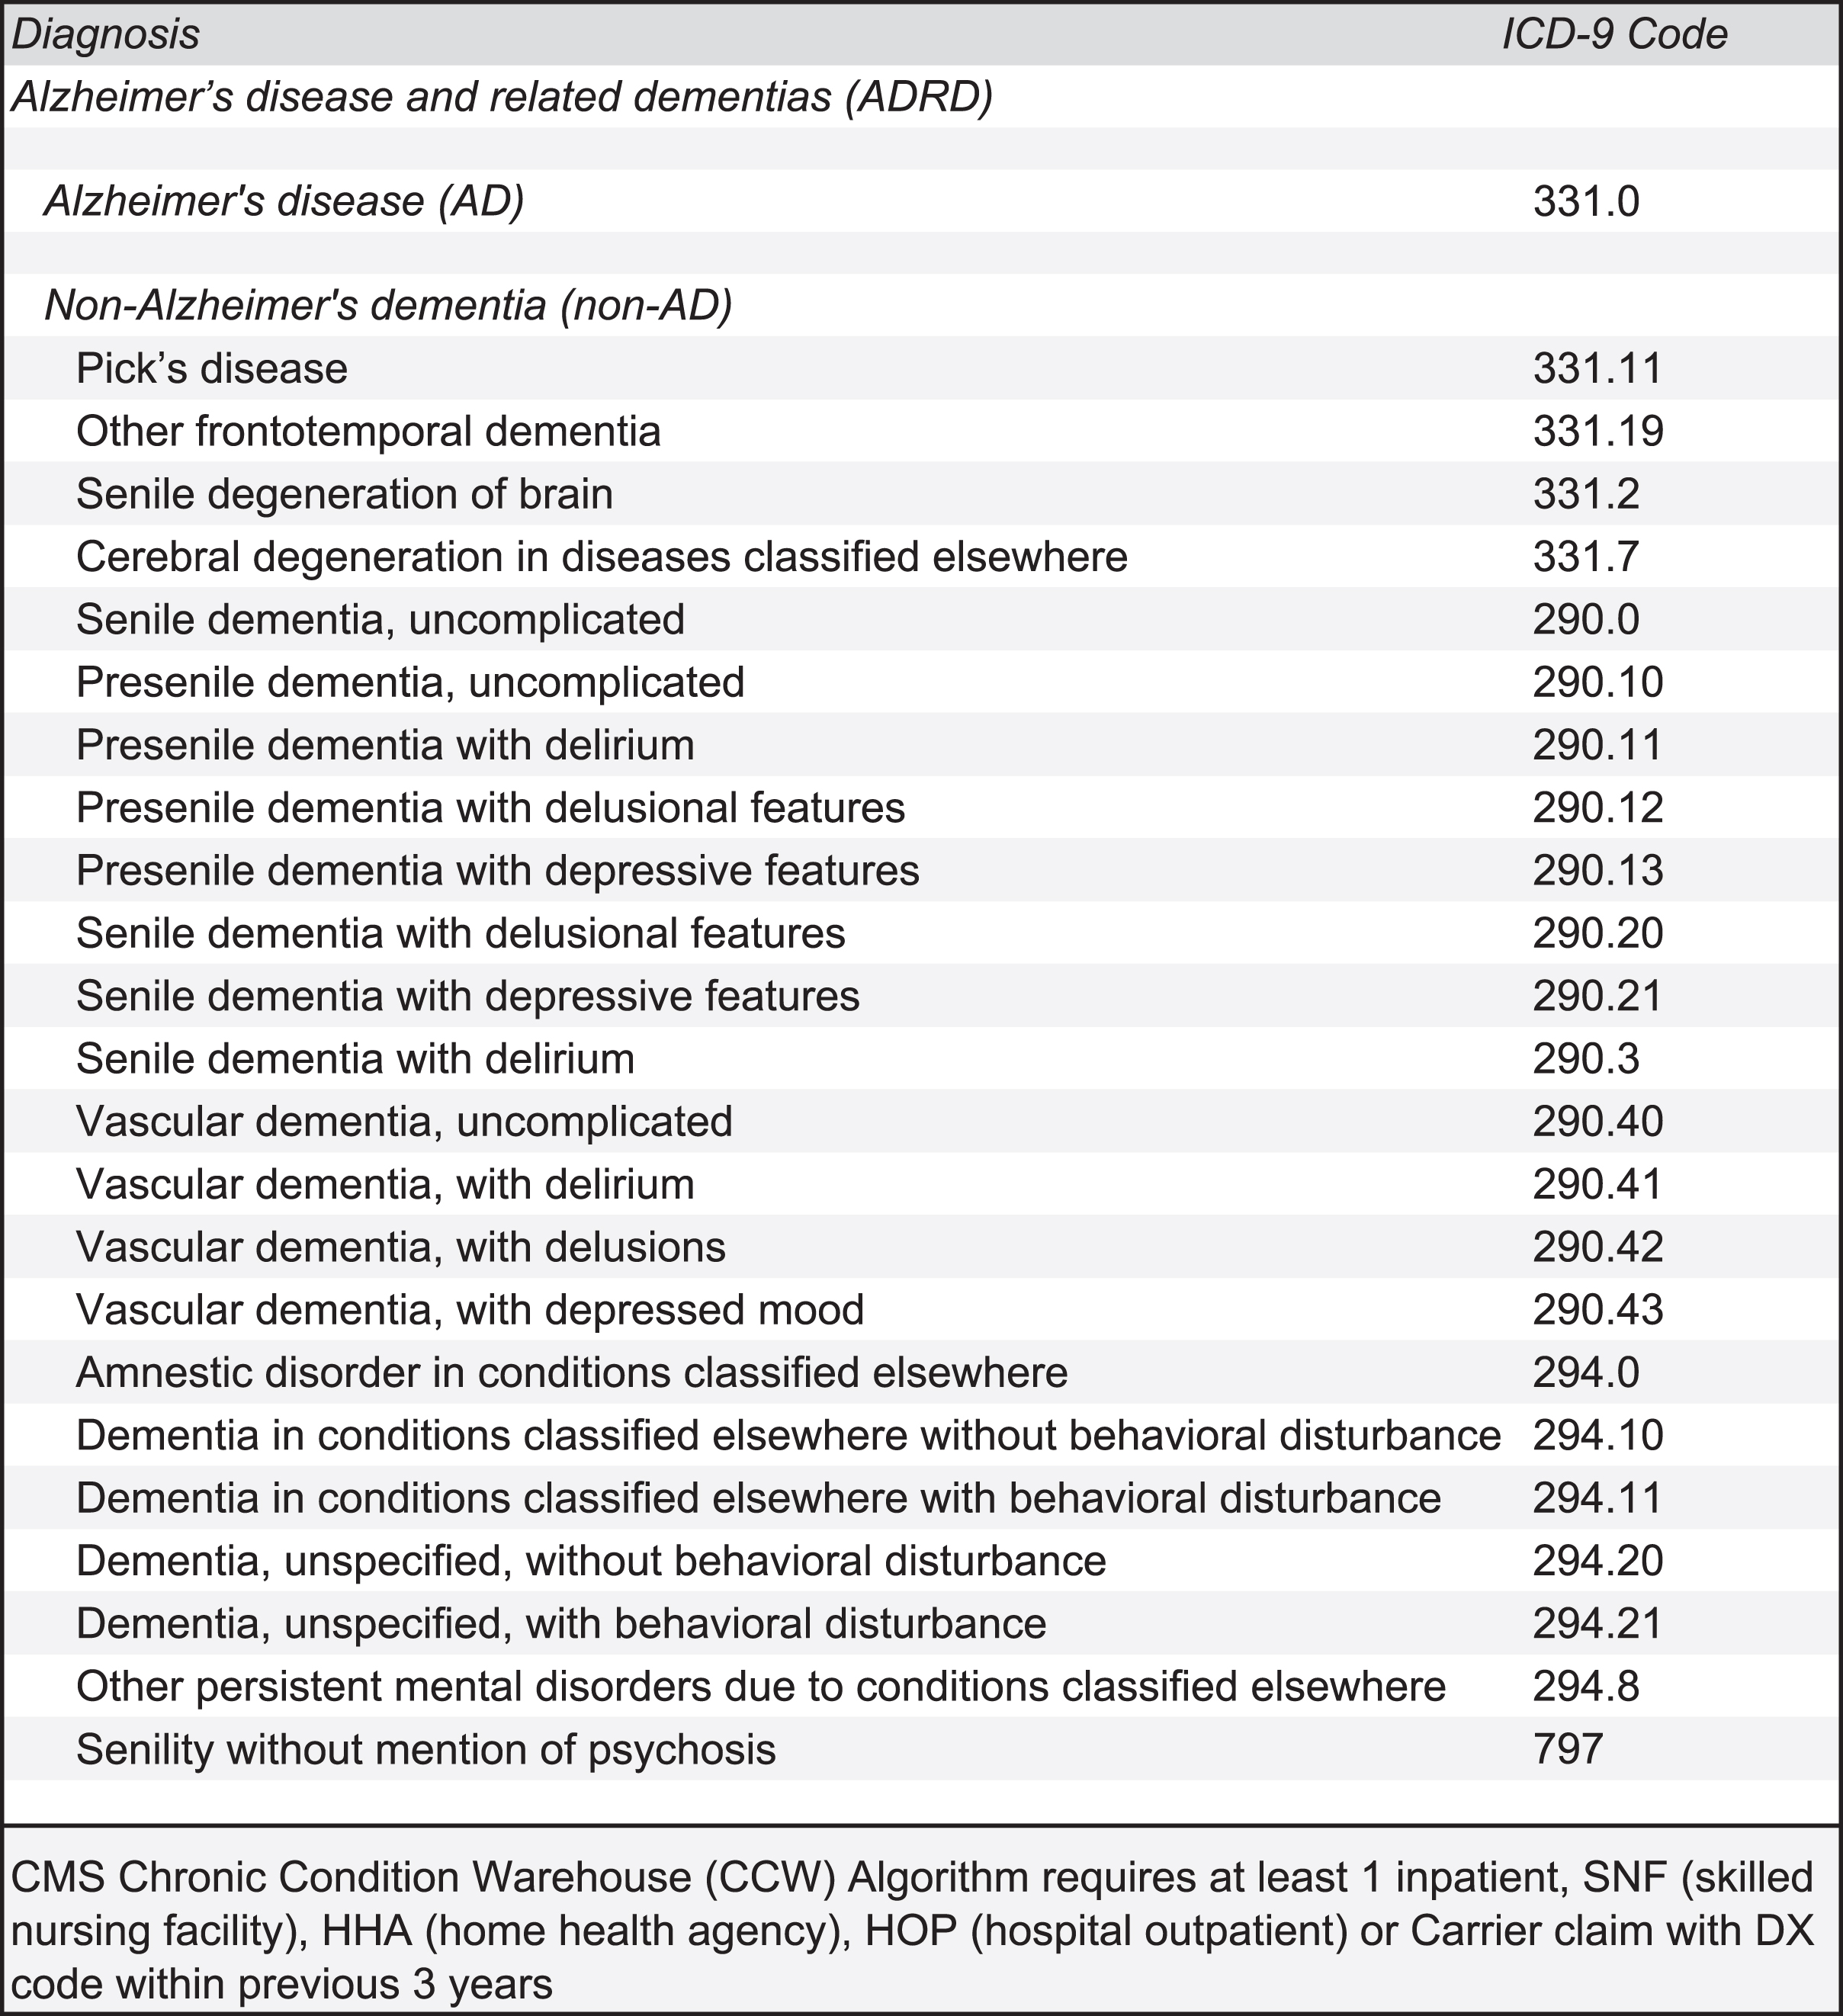
ICD9 Codes Corresponding to Alzheimer’s Disease and Related Dementias.
NDVI linkage and calculation
The CMS data were linked to U.S. Census Bureau 2011 data to assess median household income at the Census block-group level, and to mean 2011 Census block level Normalized Difference Vegetation Index (NDVI) for each beneficiaries’ residential address [26, 27]. NDVI has been previously established as a well-validated measure of neighborhood greenness for use in epidemiological research [28]. Data was obtained using US National Aeronautics and Space Administration Advanced Spaceborne Thermal Emission and Reflection Radiometer (ASTER) satellite imagery to observe the wavelengths of visible and near infrared sunlight reflected from the earth’s surface at 15×15 meter resolution in March 2011 [29]. The NDVI of sub-tropical forests remains fairly constant throughout the year; accordingly, Miami-Dade County does not have a peak greenness season and its greenness remains fairly constant throughout the year [30]. Chlorophyll in healthy plants typically absorbs more visible light wavelengths (for use in photosynthesis) and reflects near infrared light wavelengths, while the inverse is true of areas with lower levels of healthy vegetation [31]. More specifically, chlorophyll in plants absorbs visible light (0.4–0.7μm, including red visible light), whereas plants’ leaves reflect near-infrared light (0.7–1.1μm)—with these separate bands detectable from satellite imagery. NDVI is calculated by subtracting the spectral reflectance of the visible red band (VIS) of the image from the near infrared band (NIR) of the image, and dividing that difference by the sum of the visible red band (VIS) and the near infrared band (NIR). NDVI is: NDVI = (NIR-VIS) / (NIR + VIS). NDVI is a continuous measure ranging from –1 to +1.
Statistical analysis
Mean NDVI was calculated at the Census block level for all of Miami-Dade County and divided into tertiles based on greenness level: low NDVI (–0.40 to –0.06, low greenness), medium NDVI (–0.06 to 0.006, medium greenness), and high NDVI (0.006 to 0.429, high greenness). Analyses were conducted using hierarchical regression analyses in a multi-level framework using SAS 9.4 (SAS Institute, Cary, NC). Two logistic regression models were performed in a stepwise fashion in investigating the greenness to AD relationship. More specifically, we used generalized estimating equations models with compound symmetry covariance structure. Model 1 assessed the odds ratio of AD diagnosis among participants in medium and high greenness tertiles compared, separately, to the low greenness tertile, while controlling for age, gender, race/ethnicity, and median household income. These covariates have been previously found to be related to dementias [32]. Model 2 assessed the odds ratio of AD in medium and high greenness tertiles compared, separately, to the low greenness tertile, while controlling for age, gender, race/ethnicity, median household income, and number of comorbid health conditions other than AD. Secondary analyses repeated the testing of Models 1 and 2 for the outcome of ADRD, a broader diagnostic category including AD as well as non-AD dementia’s including: vascular dementia, frontotemporal dementia, senile dementia, presenile dementia, Pick’s disease, and other specified and unspecified dementias. A final analysis assessed the relationship of greenness to non-AD dementia in individuals having a diagnosis of ADRD, but not AD. To further test these associations, models were then run using NDVI quintiles. To better understand the role of comorbidities and demographic variables in the relationship between greenness and AD, separate interaction tests were conducted for greenness’ interaction with the number of comorbidities and with each of the demographic variables, respectively.
RESULTS
Study population characteristics
Table 1 provides descriptive statistics for the sample. The overall sample of 249,405 beneficiaries had a mean age of 76 years (standard deviation [SD] = 7.5 years), with 58%of the cohort being female. The sample was predominantly Hispanic (66%), followed by Non-Hispanic white (23%), and Non-Hispanic Black (11%), closely approximating the racial/ethnic composition of the Miami Dade County among adults aged over 65 years [33]. Median household income was $51,400 (SD = $30,700). The mean number of comorbidities was 2.0 (SD = 3.12). Notably, 5.5%(n = 13,685) of beneficiaries had a diagnosis of AD, and a further 2.9%(n = 7,218) of benefi-ciaries had a diagnosis of non-AD dementia, yielding a total sample of 8.4%(n = 20,903) beneficiaries with ADRD. Neighborhoods in the lowest tertile of greenness had lower rates of Non-Hispanic White residents when compared to medium and high gr-eenness tertile neighborhoods (Low-NDVI 16.3%, Medium-NDVI 18.2%, High-NDVI 35.4%; p < 0.0001). Low-greenness tertile neighborhoods also had lower median household incomes compared to high-greenness tertile neighborhoods (Low-NDVI mean $40,100, Medium-NDVI mean $48,400, High-NDVI mean $65,800; p < 0.0001). Living in the low greenness tertile was associated with having a greater number of comorbid medical conditions (Low-NDVI mean 2.3 conditions, Medium-NDVI mean 1.8 conditions, High-NDVI mean 1.8 conditions; p < 0.0001).
Descriptive statistics of the overall sample
a) Mean NDVI: Assessed greenness/vegetative presence at the Census block level (possible theoretical range of –1 to +1; [26]). b) Race and ethnicity: Measured by CMS for each beneficiary using race/ethnicity designation for Medicare enhanced by using first/last name algorithms from Research Triangle Institute’s race code [43]. c) Median household income: Assessed at the Census-block group level in thousands of U.S. dollars from US Census data. d) Number of medical conditions: other than Alzheimer’s using CMS Master Beneficiary Summary File, Chronic Conditions segment. e) Alzheimer’s disease (AD), assessed using CMS Master Beneficiary Summary File, Chronic conditions segment, chronic conditions algorithm for AD. f) Non-AD dementia: includes vascular dementia, frontotemporal dementia, senile dementia, presenile dementia, Pick’s disease, and other unspecified dementias; excludes Alzheimer’s disease. g) Assessed using CMS Master Beneficiary Summary File, Chronic conditions segment, Chronic conditions algorithm for “Alzheimer’s Disease, Related Disorders or Senile Dementia” includes both AD and non-AD, per absove.
Association of NDVI with AD and non-AD risk
Without adjusting for the above covariates, neighborhoods in the low greenness tertile demonstrated higher levels of AD (Low-NDVI 7.1%, Medium-NDVI 5.2%, High-NDVI 4.2%; p < 0.0001), ADRD (Low-NDVI 10.5%, Medium-NDVI 7.9%, High-NDVI 6.8%; p < 0.0001), and non-AD dementia (Low-NDVI 3.4%, Medium-NDVI 2.7%, High-NDVI 2.6%; p < 0.0001). Each progressively higher greenness tertile was associated with a further reduction in odds of AD. When compared to individuals residing in the low greenness tertile, those individuals residing in the medium greenness tertile had a 16%lower odds of AD (OR = 0.84; 95%CI: 0.79, 0.89, p < 0.0001) and those individuals residing in the high greenness tertile had a 20%lower odds of AD (OR = 0.80; 95%CI: 0.75, 0.85, p < 0.0001). In Model 2, when compared to individuals residing in the low greenness tertile, those residing in the medium greenness tertile had 4%lower odds of AD (OR = 0.96; 95%CI: 0.91, 1.01, p = 0.14) and those residing in the high greenness tertile had a 6%lower odds of AD (OR = 0.94; 95%CI: 0.88, 1.00, p = 0.04) (Table 2).
Relationship of NDVI and Alzheimer’s Disease, Alzheimer’s Disease and Related Dementias, and Non-Alzheimer’s Dementia, in Sequentially Adjusted Models
*P-value for linear trends is reported across the three tertiles of neighborhood greenness. a) non-AD: including diagnosis of vascular dementia, frontotemporal dementia, senile dementia, presenile dementia, Pick’s disease, and other unspecified dementias; excludes Alzheimer’s disease.
These relationships were similar when examining the more inclusive diagnostic category of ADRD. In Model 1, when compared to individuals residing in the low greenness tertile, individuals residing in the medium greenness tertile had a 16%lower odds of ADRD (OR = 0.84; 95%CI: 0.80, 0.88, p < 0.0001) and individuals residing in the high greenness tertile had an 18%lower odds of ADRD (OR = 0.82; 95%CI: 0.77, 0.86, p < 0.0001). In Model 2, when compared to individuals residing in the low greenness tertile, those residing in the medium greenness tertile had a 6%lower odds of ADRD (OR = 0.94; 95%CI: 0.89, 0.98, p = 0.007) and those residing in high greenness tertile had a 7%lower odds of ADRD (OR = 0.93; 95%CI: 0.88, 0.99, p = 0.0169).
A final set of analyses examined the relationship of greenness to odds of having non-AD dementia. In Model 1, when compared to individuals residing in the low greenness tertile, those individuals in the medium greenness tertile had a 15%lower odds of having non-AD dementia (OR = 0.85; 95%CI: 0.79, 0.91, p < 0.0001) and those individuals residing in the high greenness tertile had an 11%lower odds of having non-AD dementia (OR = 0.89; 95%CI: 0.82, 0.96, p = 0.0018). In Model 2, when compared to individuals residing in the low greenness tertile, those residing in either the medium greenness tertile or high greenness tertile were not statistically significant different in odds of having non-AD dementia (Medium-NDVI OR = 0.95; 95%CI: 0.89, 1.02, p = 0.13; High-NDVI OR = 1.01; 95%CI: 0.93, 1.08, p = 0.89). When the above models were run using NDVI quintiles without adjusting for number of comorbidities other than AD or ADRD, higher greenness was associated with a reduction in odds of AD in a dose-response relationship. However, after comorbidities were adjusted, only high greenness quintiles (4th & 5th quintile) had a significant reduction effect. Post-hoc analyses consisted of separate interaction tests for greenness’ interaction with the number of comorbidities and with each of the demographic variables, and a significant interaction of greenness with age was obtained. Notably, those beneficiaries aged 75 or older did not benefit from higher greenness.
DISCUSSION
Neighborhood greenness has been linked to lower levels of stress [34], increased physical activity and increased social connectedness [35], and attenuated negative impacts of air pollution [36], which could be mechanisms which may underlie greenness’ relationships to AD, ADRD, and possibly to non-AD dementia. Epidemiological research on AD and non-AD dementia has reported on numerous modifiable risk factors including: obesity [37], tobacco use [8, 38], or psychosocial stress [39] to be associated with increased risk of ADRD. Further, randomized clinical trials including the Finnish Geriatric Intervention Study to Prevent Cognitive Impairment and Disability (FINGER) have shown a causal link between modifiable risk factors such as diet or exercise and cognitive functioning among older adults [18]. Finally, emerging evidence also suggests that greenness may be protective against age-related cognitive decline and/or contribute to better physical functioning at older ages [16, 40]. Accordingly, perhaps it is via these pathways that greenness relates to AD and possibly non-AD dementia.
The results of this study suggest that higher levels of greenness at the residential block level is associated with having a lower odds of AD among older Medicare beneficiaries in Miami-Dade County. This relationship was independent of individual sociodemographics, neighborhood income, and number of comorbid health conditions. Importantly, after controlling for comorbidities (Fig. 2), the greenness to AD relationship remained statistically significant, but was somewhat attenuated, suggesting that chronic diseases could be a mechanism through which greenness is protective against AD. A similar pattern was seen when analyses were run by NDVI quintile instead of tertile. Finally, greenness was also related to individuals with non-AD dementia. However, the relationship of greenness to non-AD dementia was no longer statistically significant after accounting for comorbid health conditions. This suggests that chronic diseases and non-AD might have common risk factors. Further, post-hoc stratification analysis suggests that only those beneficiaries aged 65–74 years benefited from living in high greenness areas, which could relate to physical activity and/or degree of nature exposure. For example, the “young old” (those individuals under age 75) may be more likely to spend time outdoors and/or engage in physical activity, which may be necessary to benefit from the effects of high greenness. In an earlier report, we found that higher levels of greenness were associated with reduced odds of AD [21]. However, the present study is the first study to find an independent relationship after controlling for other comorbid conditions that may confound the greenness to AD relationship. Additionally, this is the first study to examine the relationship of greenness to both AD and non-AD dementia in a large population-based sample.
While having a better understanding of environmental determinants of AD and non-AD dementia has potentially important global implications for public health policy and practice, this study was only able to comment on greenness’ relationship to AD and non-AD dementia among a single large population-based sample of older adults—Medicare beneficiaries, living in Miami-Dade County, FL, USA—which is an important limitation, requiring replications in other geographic areas and populations. Future research might further strengthen the evidence base by longitudinally examining greenness in relation to a more detailed account of AD and non-AD dementia severity, which is not presently available from CMS’ Chronic conditions data, as well as progression of AD and non-AD dementia over time, which was beyond the scope of the present study.
While a person’s built and/or natural environment exposures has not traditionally been considered a modifiable risk factor in relation to AD and non-AD dementia, this research suggests that vegetation at the block or neighborhood level may be an important modifiable factor for reducing the risk for AD and possibly non-AD dementia, as well as improving mental health and general health in older populations. Environmental interventions, such as greenness, have the advantage that they are not dependent on an individual’s motivation for change, and moreover because of their pervasive quality, have the potential to reach populations, rather than just individuals. This adds to the growing body of research better understanding the relationship of the human envirome to health outcomes ranging from cardiovascular health to AD and non-AD dementia, which is important for developing interventions to modify the prevalence and incidence of AD and non-AD dementia at the population level [41,42, 41,42].
Footnotes
ACKNOWLEDGMENTS
This project was supported in part by grants from the U.S. Department of Housing & Urban Development (Grant # HUD H-21620-RG; PI: S. Brown), the Health Foundation of South Florida (PI: S. Brown); an Ed & Ethel Moore Alzheimer’s Research Grant from the State of Florida (Grant # 9AZ23; PI: S. Brown); the Parks Foundation of Miami-Dade County; and the Evelyn F. McKnight Brain Institute at the University of Miami. An earlier version of this paper was presented as a poster at the Alzheimer’s Association International Conference, July 22–26, in 2018, Chicago, Illinois.