
Abstract
Background:
Blood pressure variability is linked to Alzheimer’s disease (AD) risk and MRI-based markers of cerebrovascular disease. Less is known about the role of blood pressure variability in postmortem evaluation of cerebrovascular disease and AD.
Objective:
To determine whether antemortem blood pressure variability predicts cerebrovascular and AD pathology and follow-up cognitive change in autopsy-confirmed AD.
Methods:
National Alzheimer’s Coordinating Center participants (n = 513) underwent 3-4 approximately annual blood pressure measurements and were confirmed to have AD at postmortem evaluation. A subset (n = 493) underwent neuropsychological evaluation at follow-up. Regression models examined relationships between blood pressure variability and cerebrovascular and AD pathological features and follow-up cognitive change.
Results:
Elevated blood pressure variability predicted increased postmortem cerebrovascular lesion burden (ß = 0.26 [0.10, 0.42]; p = 0.001; R2 = 0.12). Increased blood pressure variability predicted specific cerebrovascular lesion severity, including atherosclerosis in the Circle of Willis (OR = 1.22 [1.03, 1.44]; p = 0.02) and cerebral arteriolosclerosis (OR = 1.32 [1.04, 1.69]; p = 0.03). No significant relationships were observed between blood pressure variability and AD pathological findings, including Braak & Braak stage, neuritic plaques or diffuse plaques, or cerebral amyloid angiopathy, or follow-up cognitive decline.
Conclusion:
Findings suggest that elevated blood pressure variability is related to postmortem cerebrovascular lesion burden in autopsy-confirmed AD, independent of average blood pressure and AD neuropathology. Blood pressure fluctuation may selectively promote atherosclerotic and arteriolosclerotic brain lesions with potential implications for cognitive impairment and dementia.
INTRODUCTION
Elevated visit-to-visit (e.g., over months to years) blood pressure variability (BPV) is recognized as a risk factor for stroke, cognitive impairment, and dementia, including Alzheimer’s disease (AD) and vascular dementia, independent of average blood pressure (BP) [1–14]. Mechanisms underlying links between BPV and AD remain unclear, but it has been hypothesized that BP dysregulation may disrupt the steady cerebral perfusion that critically supports neuronal and cognitive function [2, 15–17]. Chronic high variation in BP may place oscillatory transmural pressure on arterial walls, leading to microvascular injury and arterial remodeling, and increasing risk for large and small cerebrovascular disease (CVD) [2, 17–19]. Increased amplitude of pressure oscillations may also drive vascular-endothelial injury in larger vessels, driving atherosclerosis [20]. Older adults may be particularly vulnerable to these vascular changes [21–24]. Importantly, converging lines of evidence suggest that vascular factors contribute to 30–75%of cases of AD [25]. Several studies in older adults have reported a link between increased BPV and MRI-based markers of CVD (e.g., white matter hyperintensities, cortical infarcts, cerebral microbleeds) [2, 26], but it remains unclear how BPV may be related to specific cerebrovascular or AD neuropathological findings. Elevated BP has been linked to postmortem CVD in autopsy-confirmed AD, independent of AD pathology [27], and one study reported links with both BP [28] and BPV [29] in community-dwelling older adults. However, it remains unclear whether BPV may relate to postmortem CVD or AD pathology independent of mean pressure in AD. Relatedly, the growing literature of BPV predicting cognitive decline is largely based on individuals without history of dementia at the time of BPV assessment [2, 30]. A few studies have linked higher BPV to cognitive impairment in individuals clinically diagnosed with AD [7, 11], while one study did not support this association [31]. Less is known about how BPV may or may not be related to follow-up cognitive change in individuals determined to have AD at autopsy. The current study aimed to investigate whether antemortem BPV predicts postmortem CVD and AD pathology as well as follow-up cognitive change in autopsy-confirmed AD patients.
METHODS
Participants
Participants were selected from the National Alzheimer’s Coordinating Center (NACC) database [32], a repository of standardized clinical, neuroimaging, and neuropathological data collected from older adult volunteers across the past and present Alzheimer Disease Centers (ADCs) in the United States. Details about study recruitment and data collection have been described elsewhere [33, 34]. The study was approved by the institutional review boards at each ADC and all participants provided written informed consent prior to study enrollment.
The present study used data collected from 29 of the ADCs since NACC’s inception in 2005 through the September 2020 data freeze of the Uniform Data Set [35]. Participants were included if they underwent baseline health exam and neuropsychological assessment, repeated approximately annual BP measurement at least 3 times from study baseline to 3- to 4-year follow-up and brain autopsy. A subset of these participants also underwent ≥ 1 neuropsychological assessment at follow-up visits after the final BP measurement. See Supplementary Figure 1 for a schematic of study visits. From this initial sample, participants were included if they met the National Institute on Aging Reagan and Consortium to Establish a Registry for Alzheimer’s Disease (CERAD) criteria for probable or definite AD at autopsy [36]. Cases were specifically excluded from the present analysis if they had significant pathology other than AD (e.g., hippocampal sclerosis, Lewy Body disease, frontotemporal lobar degeneration, vascular disease, prion disease) and did not meet CERAD criteria for probable or definite AD.
Measures
Demographic characteristics and clinical data
Several demographic and clinical variables were determined from baseline health exam: age, sex, race/ethnicity (categorized as non-Hispanic White versus non non-Hispanic White due to the small number of non non-Hispanic White participants), years of education, use of antihypertensive medication (all classes), body mass index (BMI [weight (kg)/height (meters) squared]) and vascular risk most relevant to CVD and cognition, as described elsewhere in a study of BP and neuropathology using the NACC database [37]. Briefly, history of hypercholesteremia, diabetes, heart attack, atrial fibrillation, congestive heart failure, transient ischemic attack, and tobacco use within the past 30 days were coded as either absent, remote/inactive, or recent/active. Participants with any remote/inactive or recent/active factor were categorized as having vascular risk versus those without vascular risk (i.e., all factors coded as absent) [37]. Antemortem CVD burden at baseline was estimated based on Hachinksi ischemic score (range 0–12). Hachinski scores ≤ 4 were representative of low antemortem CVD burden [38]. The Mini-Mental State Examination (MMSE) (out of 30, inclusive) was used to measure global cognition and was determined from neuropsychological assessment at baseline and at any available follow-up visit after the final BP measurement. The following cognitive measures were also collected at later follow-up visits: Logical Memory total number of story units recalled, which has been shown to identify memory decline due to AD [39], and Trails B of the Trails Making Test, which is a measure of executive function that is sensitive to clinical progression of AD [40]. A measure of “time-to-death” (i.e., number of years between first BP measurement and death) was also calculated [27].
BP assessment
Seated BP measurement was collected at least 3 times between study baseline and 3- to 4-year follow-up, consistent with other studies of visit-to-visit BPV in aging adults [4, 26]. Intraindividual BPV was calculated as the SD, coefficient of variation (CV [100 x SD/mean]) and variability independent of mean (VIM), a commonly used measure of visit-to-visit BPV that is a transformation of BP SD and is therefore independent of mean BP [9, 41]. VIM was calculated as:
where the power x was derived from non-linear curve fitting of BP SD against mean BP using the nls package in R Project [42].
Neuropathological feature assessment
The NACC Neuropathology Data Set [43] (using the July 2014 Data Dictionary last updated 12/5/2016) was screened to determine several neuropathological features including evidence of AD pathology (i.e., Braak & Braak stage, neuritic plaques, diffuse plaques), cerebral amyloid angiopathy (CAA) and CVD (i.e., atherosclerosis in the Circle of Willis [COW], cerebral arteriolosclerosis, lacunes, cortical microinfarcts, hemorrhage, large artery infarction). For markers of AD pathology, severity of Braak & Braak stage ranged from 1 to 6 and severity of neuritic plaques and diffuse plaques was scored on a 3-point scale (0 = none, 1 = mild, 2 = moderate, 3 = severe). Severity of CAA was scored on a separate 3-point scale (0 = none, 1 = mild, 2 = moderate, 3 = severe). For markers of CVD, severity of atherosclerosis in the COW and cerebral arteriolosclerosis was scored on a separate 3-point scale (0 = none, 1 = mild, 2 = moderate, 3 = severe). Evidence of lacunes, cortical microinfarcts, hemorrhage and large artery infarction was scored as absent (0) or present (1). A composite score of CVD severity [27] was calculated as the following: severity of atherosclerosis in the COW (0–3), severity of cerebral arteriolosclerosis (0–3), and the presence or absence of lacunes (0–1), cortical microinfarcts (0–1), hemorrhage (0–1) and large artery infarction (0–1). Therefore, CVD severity scores could range from 0 to 10.
Statistical analysis
BPV values were log-transformed to approach a normal distribution. First, multiple linear regression was used to investigate relationships between BPV and CVD severity and Braak & Braak severity. Next, ordinal logistic regression was used to examine relationships between BPV and the severity of specific contributions of CVD (i.e., atherosclerosis in the COW, cerebral arteriolosclerosis), AD (i.e., neuritic plaques, diffuse plaques), and CAA. Finally, Bayesian linear growth modelling using the brms package in R [42] tested the interaction of BPV by time on global cognition as measured by MMSE, memory as measured by Logical Memory and executive function as measured by Trails B. These models specified random intercepts for participant, to account for individual variation in cognitive score change, and fixed effects for BPV to test for differences in cognitive score change due to BPV. Only cognitive scores acquired after the final BP measurement were used in analyses to determine temporal order of any associations; therefore, passage of time for cognitive scores was calculated as years elapsed since BPV determination (e.g., after the last BP measurement was collected) (range: 1 –6 years) and then grand centered at 0. Multiple linear regression and ordinal logistic regression models controlled for the following: age, sex, race/ethnicity, years of education, BMI, antihypertensive medication use, baseline MMSE score, time-to-death, vascular risk, and average BP. Bayesian growth models controlled for these same variables, with age and antihypertensive medication use now determined at each neuropsychological evaluation. Additional sensitivity analyses covaried for the use of antidementia agents, given the potential for these medications to alter physiology [44]. All analyses were 2-tailed with significance set at p <0.05 or effect estimates with credible intervals excluding 0. All analyses were carried out in R Project [42].
RESULTS
A final sample of 513 participants with at least 3 valid BP measurements over a 3- to 4-year period from study baseline and a primary pathological diagnosis of AD (and met CERAD criteria for probable or definite AD at autopsy) were available for primary analyses of relationships between antemortem BPV and neuropathological features. Participants contributed to 1,862 BP measurements (median 4 measurements). A subset of 493 participants with ≥ 1 neuropsychological evaluation after final BP measurement were included in secondary analyses of change in cognition. This participant subset contributed to 1,113 neuropsychological evaluations (median 3 evaluations) and the median time interval between BPV measurement and neuropsychological evaluation was 2 years (IQR: 3 years). Table 1 summarizes demographic and clinical descriptive data (means and SDs).
Baseline clinical and demographic data
Means and SDs shown unless otherwise indicated. M, male; F, female; MMSE, Mini-Mental State Exam; BP, blood pressure; BPV, blood pressure variability; BMI, body mass index; CV, coefficient of variation; VIM, variability independent of mean.
The average CVD severity score was 2.9 (1.8 SD). Frequency of features of CVD include: atherosclerosis in the COW (80.3%), cerebral arteriolosclerosis (69.8%), cortical microinfarcts (16.0%), lacunes (14.6%), large artery infarction (8.8%), and hemorrhages (5.1%). The average Braak & Braak score was 5.3 (0.8 SD). All participants were observed to have neuritic plaques and diffuse plaques. CAA was present in 72.7%of participant brains. 61.2%of participants had vascular risk (i.e., the presence of ≥ 1 vascular risk factor). 96.1%of participants had low antemortem CVD burden at baseline (Hachinski scores ≤ 4). The average time from first BP measurement to death (i.e., “time-to-death”) was 5.1 years (1.2 SD).
BPV and neuropathology
Multiple linear regression analyses revealed that elevated diastolic BPV was significantly related to increased CVD severity (SD: standardized beta (β) = 0.25 [95%CI 0.09, 0.40]; p = 0.003; R2 = 0.11; CV: β = 0.25 [0.09, 0.41]; p = 0.003; R2 = 0.11; VIM: β = 0.26 [0.10, 0.42]; p = 0.001; R2 = 0.12) (Fig. 1) but not Braak & Braak severity (SD: β = 0.03 [–0.04, 0.10]; p = 0.42; R2 = 0.27; CV: β = 0.03 [–0.04, 0.10]; p = 0.35; R2 = 0.27; VIM: β = 0.03 [–0.04, 0.10]; p = 0.35; R2 = 0.27) after controlling for age, sex, race/ethnicity, years of education, BMI, MMSE, antihypertensive medication use, time-to-death, vascular risk, and average BP.
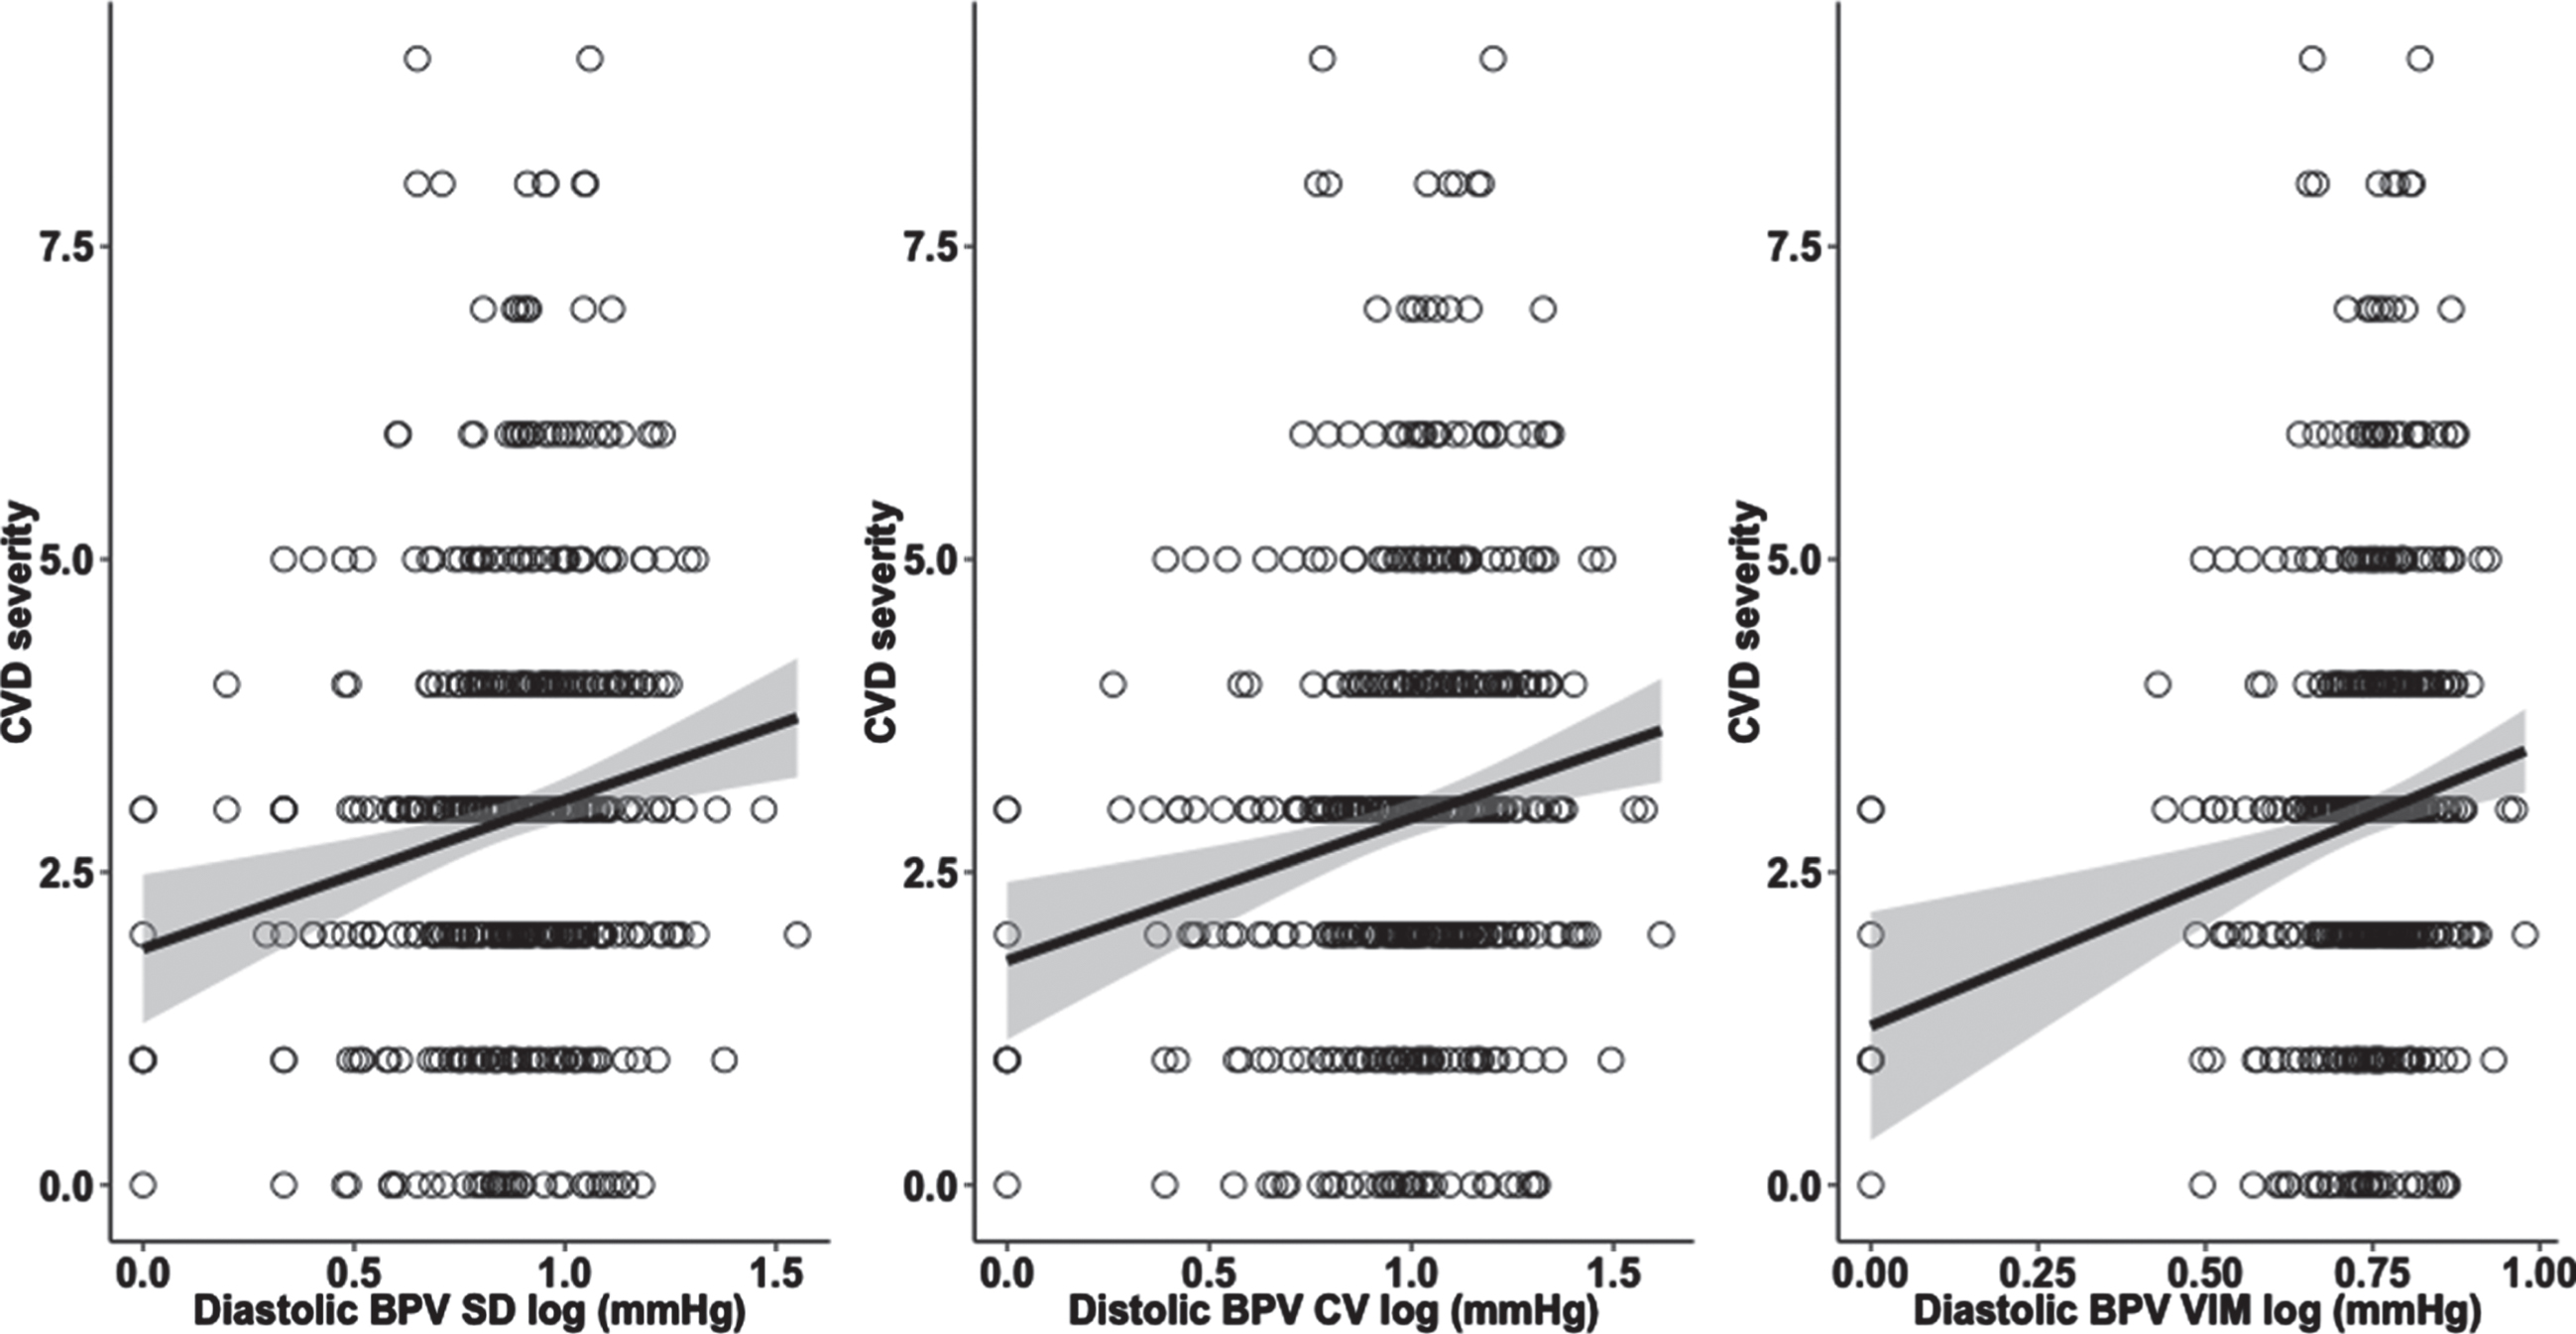
Elevated diastolic BPV is related to CVD severity in autopsy-confirmed AD. Scatterplots display the results of the linear regression between diastolic BPV and CVD severity. 95%confidence interval is shaded around the regression lines. BPV, blood pressure variability; CV, coefficient of variation; VIM, variability independent of mean; CVD, cerebrovascular disease.
In ordinal logistic regression analyses, elevated diastolic BPV was significantly related to increased severity of atherosclerosis in the COW (SD: odds ratio (OR) = 1.20 [95%CI 1.01, 1.43]; p = 0.04; CV: OR = 1.21 [1.01, 1.42]; p = 0.04; VIM: OR = 1.22 [1.03, 1.44]; p = 0.02) (Fig. 2) and increased severity of cerebral arteriolosclerosis (SD: OR = 1.27 [1.03, 1.57]; p = 0.02; CV: OR = 1.27 [1.03, 1.57]; p = 0.03; VIM: OR = 1.32 [1.04, 1.69]; p = 0.03) after controlling for the same covariates (Fig. 3). Diastolic BPV was not significantly related to the severity of neuritic plaques (SD: OR = 1.12 [0.91, 1.37]; p = 0.27; CV: OR = 1.12 [0.92, 1.37]; p = 0.27; VIM: OR = 1.14 [0.94, 1.39]; p = 0.18), diffuse plaques (SD: OR = 1.06 [0.84, 1.34]; p = 0.62; CV: OR = 1.06 [0.84, 1.34]; p = 0.61; VIM: OR = 1.13 [0.89, 1.40]; p = 0.30) or CAA (SD: OR = 0.95 [0.80, 1.13]; p = 0.54; CV: OR = 0.95 [0.79, 1.12]; p = 0.55; VIM: OR = 0.93 [0.77, 1.13]; p = 0.45). Figure 4 summarizes the ORs of diastolic BPV predicting severity of specific neuropathological features.
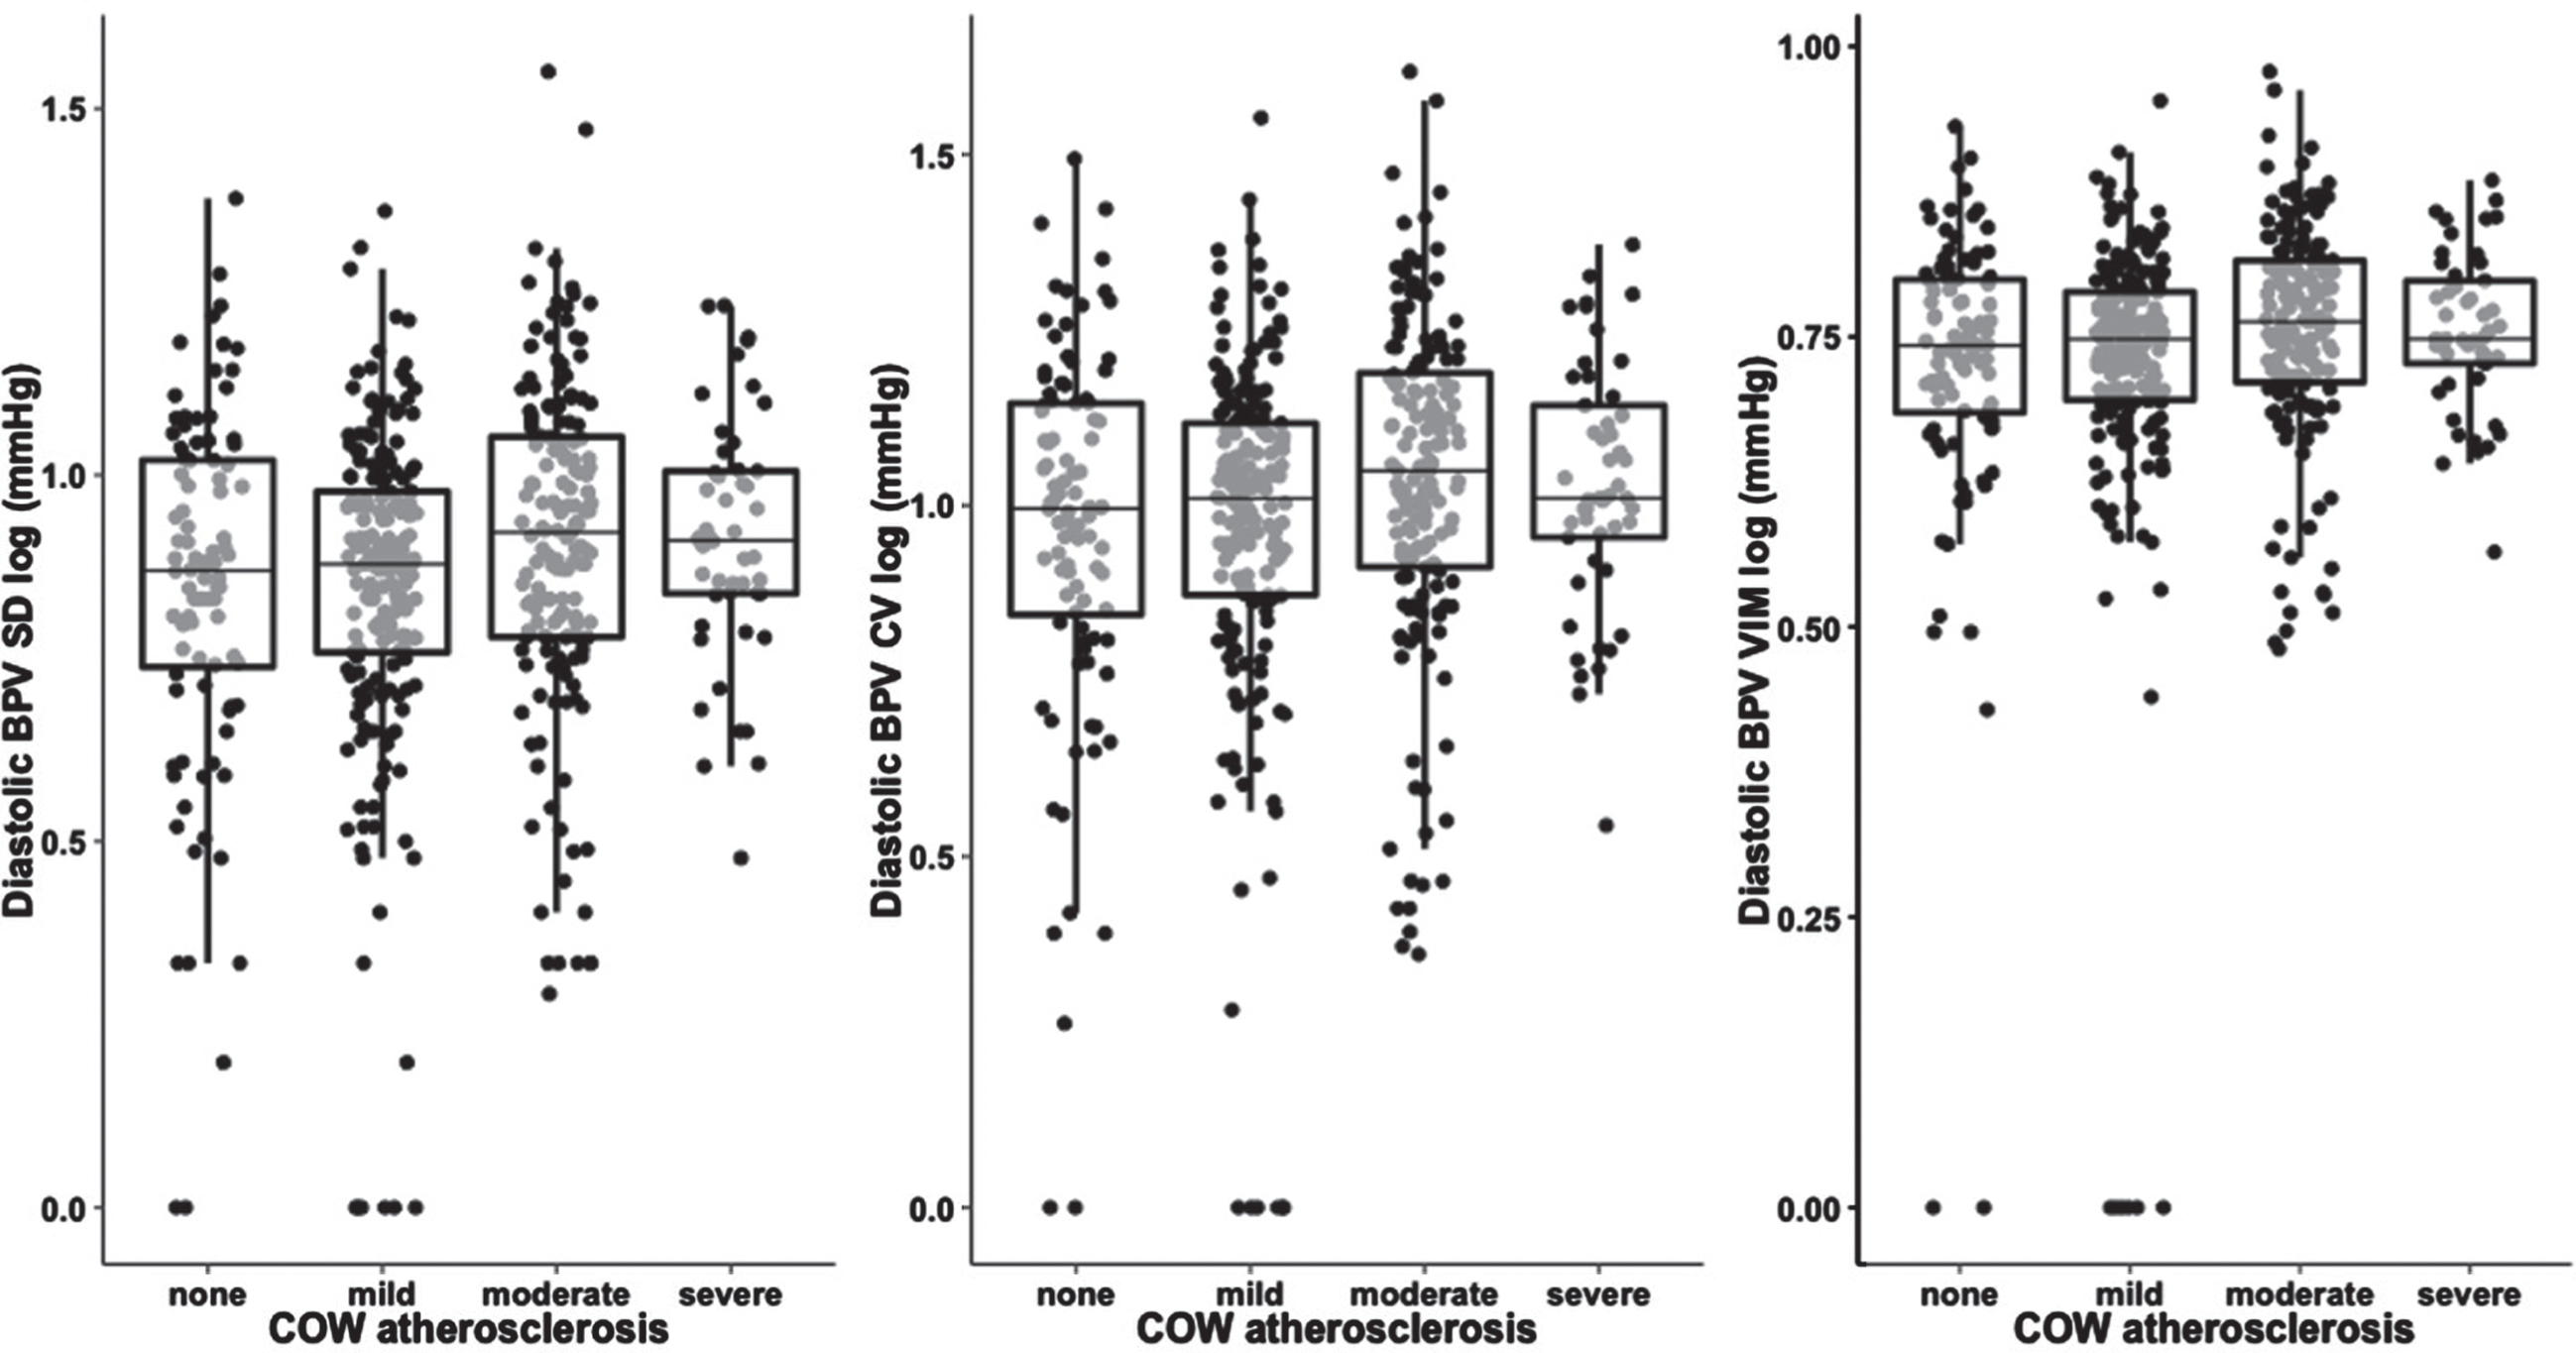
Elevated diastolic BPV is related to severity of atherosclerosis in the COW. Boxplots display the results of the ordinal logistic regression of diastolic BPV predicting the severity of atherosclerosis in the COW. BPV, blood pressure variability; CV, coefficient of variation; VIM, variability independent of mean; COW, Circle of Willis.
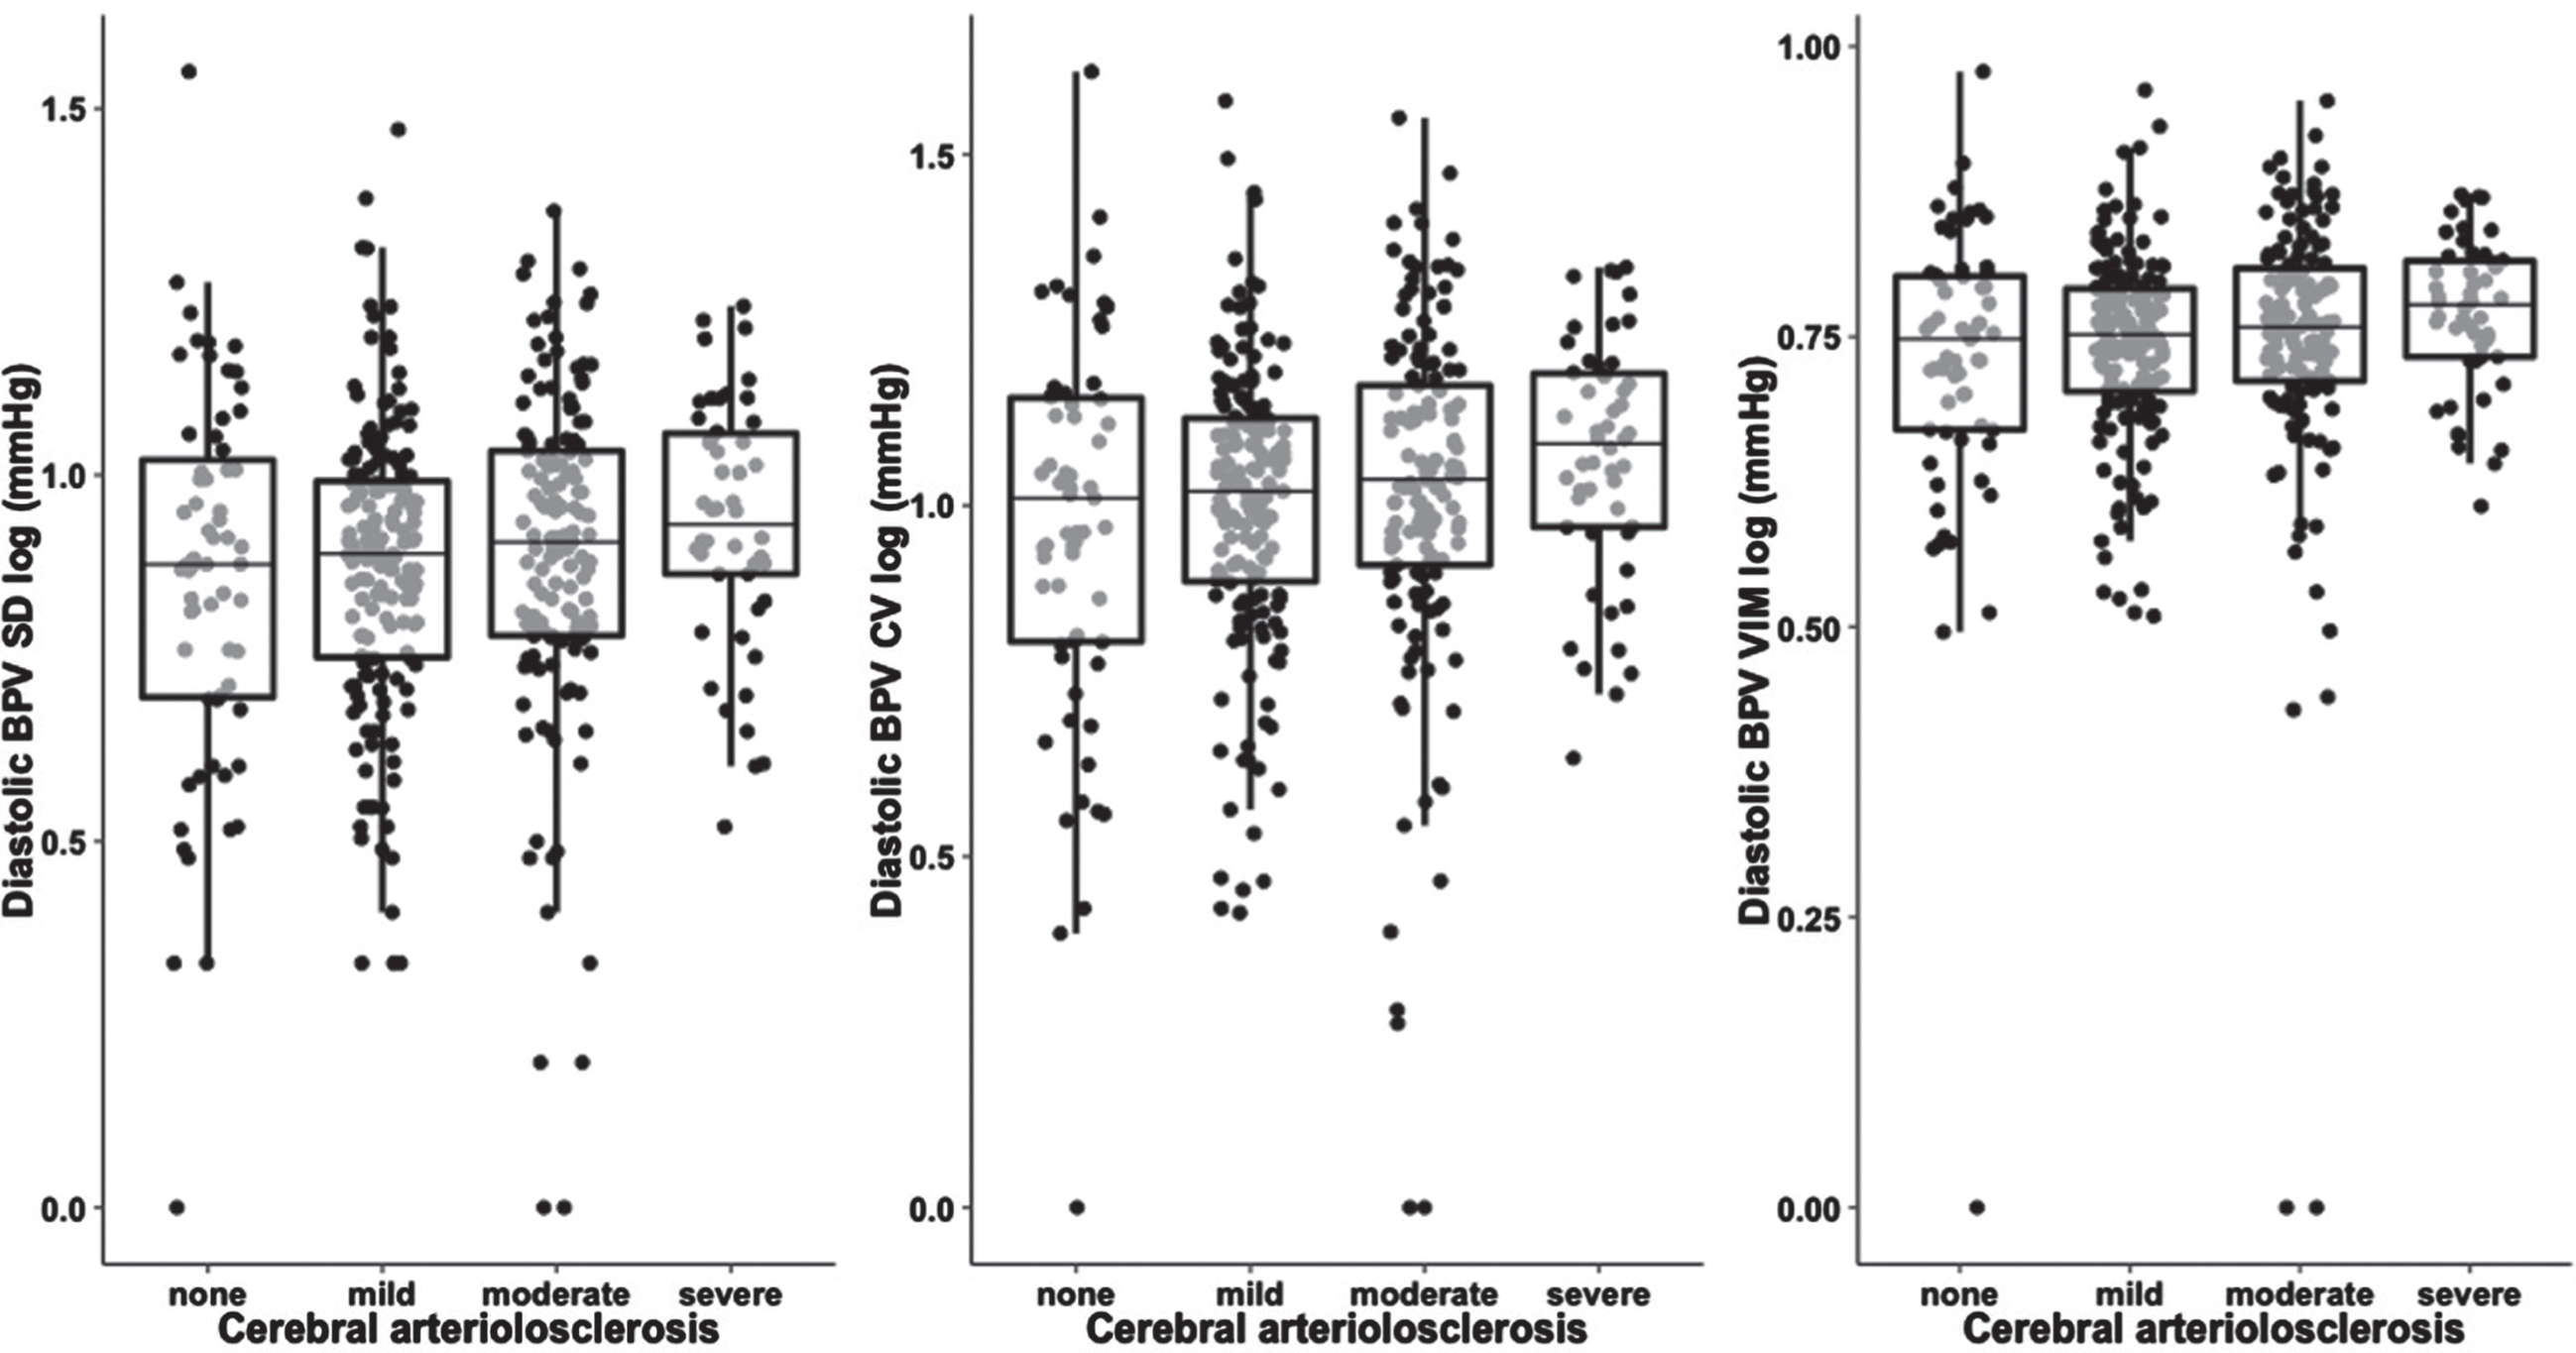
Elevated diastolic BPV is related to severity of cerebral arteriolosclerosis. Boxplots display the results of the ordinal logistic regression of diastolic BPV predicting the severity of cerebral arteriolosclerosis. BPV, blood pressure variability; CV, coefficient of variation; VIM, variability independent of mean.
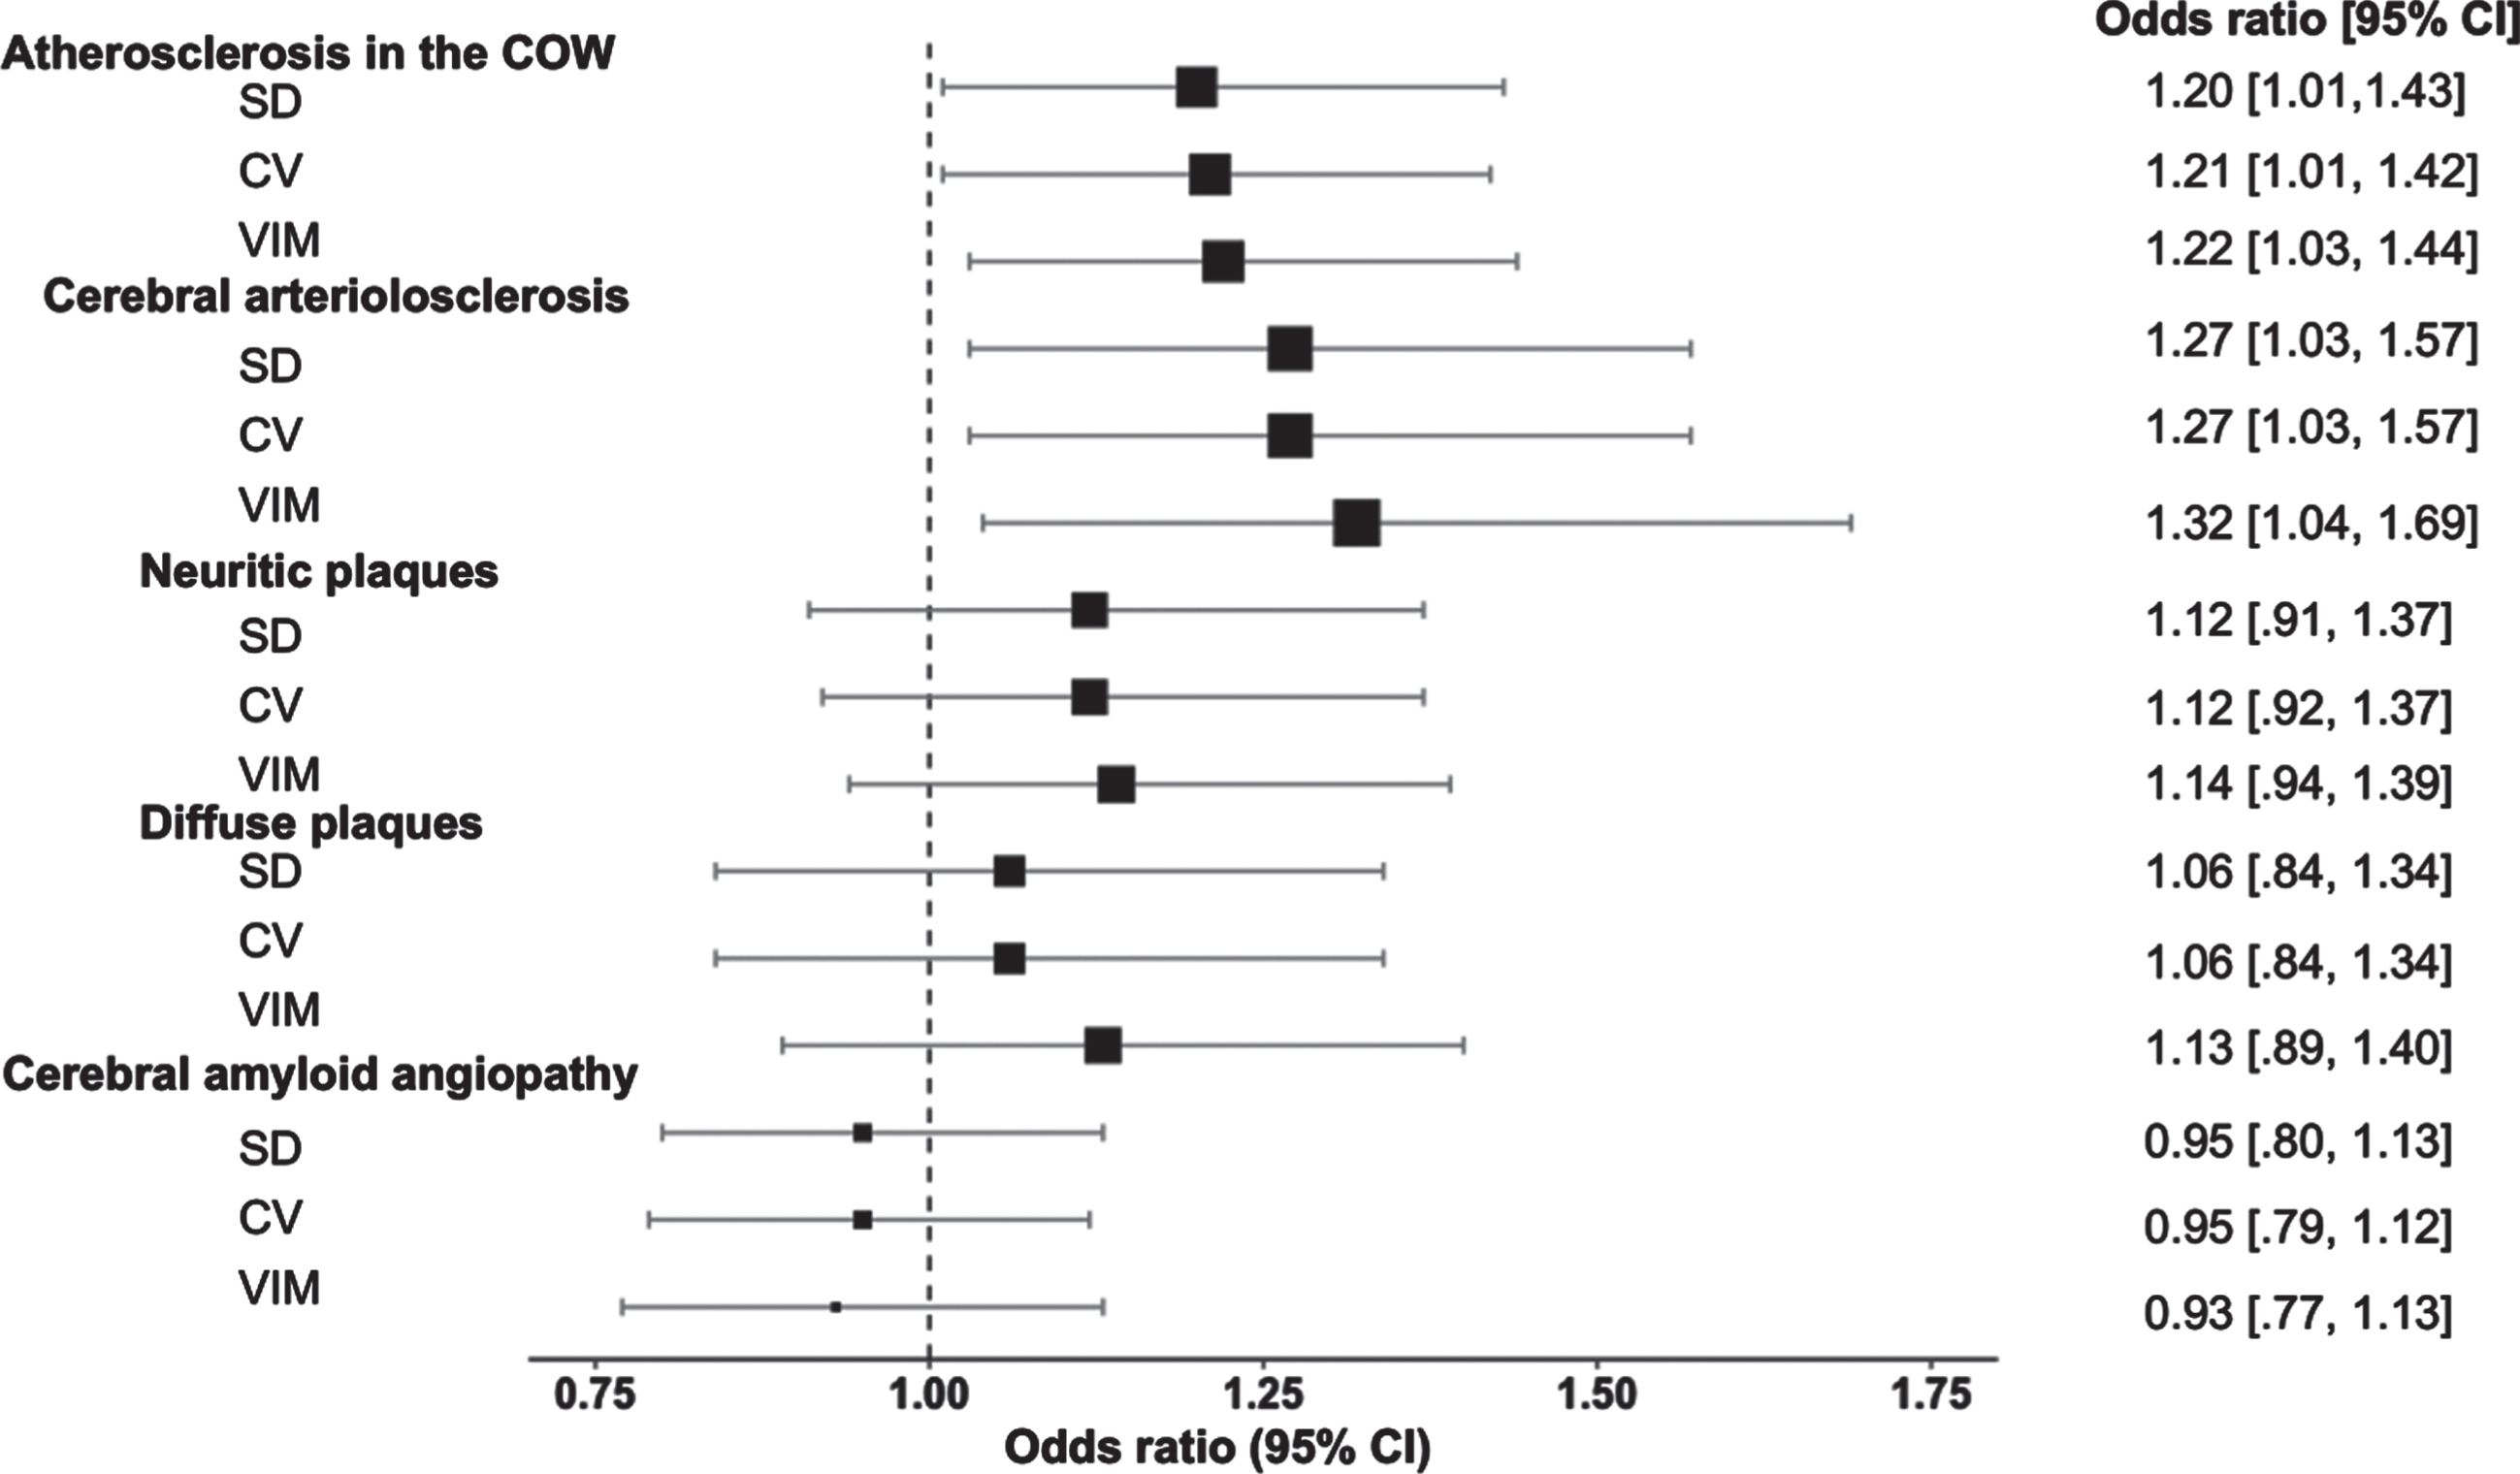
Diastolic BPV and risk of neuropathological severity. Forest plots display the odds ratios (95%confidence interval) of diastolic BPV predicting severity of atherosclerosis in the COW, severity of cerebral arteriolosclerosis, severity of neuritic plaques, severity of diffuse plaques, and severity of cerebral amyloid angiopathy. BPV, blood pressure variability; CV, coefficient of variation; VIM, variability independent of mean; COW, Circle of Willis.
There were no significant associations between systolic BPV and any measure of neuropathology (p’s = 0.05 to 0.99). Sensitivity analyses remained essentially unchanged when also controlling for the use of antidementia agents (data not shown).
BPV and cognitive change
Analyses of cognitive change revealed no significant interactions of systolic or diastolic BPV by time on follow-up performance of MMSE, Logical Memory, or Trails B (all 95%credible intervals included 0) (data not shown).
DISCUSSION
Study findings indicate that elevated antemortem diastolic BPV predicts increased postmortem CVD lesion burden, independent of average BP, in older adults with autopsy-confirmed AD. In contrast, BPV was not related to markers of AD pathology, including Braak & Braak stage or severity of neuritic plaques or diffuse plaques, or CAA. These results are consistent with studies showing increased in vivo MRI markers of CVD severity associated with elevated BPV in older adults [2, 26] and one study of BPV and postmortem CVD in community-dwelling older adults [29], and extends prior work by investigating postmortem relationships in older adults with autopsy-confirmed AD. Additionally, BPV did not predict follow-up change in cognition in this sample with autopsy-confirmed AD, which adds to the small number of studies reporting mixed findings of BPV predicting cognitive change in individuals clinically diagnosed with AD [7, 31].
The link between elevated BPV and increased CVD severity was particularly apparent with regard to advancing severity of atherosclerosis in the COW and cerebral arteriolosclerosis, both of which are well documented in and increase risk for AD [23, 45]. Specifically, for an increase of 1 SD in diastolic BPV, there was a 20%–22%increased odds of having more severe atherosclerosis in the COW and a 27%–32%increased odds of having more severe cerebral arteriolosclerosis, depending on the index of BPV used. These findings implicate increased BPV in the potential exacerbation of both cerebral large vessel disease (atherosclerosis) and small vessel disease (arteriolosclerosis) in AD patient brains. Large oscillations in BP could exacerbate atherosclerotic lesion formation in vessels such as the COW that exhibit a morphology predisposing to high levels of turbulent flow [20]. Increased COW atherosclerosis has been linked to cognitive impairment and AD dementia, possibly through impairment of cerebral blood flow or downstream microinfarcts [21–24], suggesting potential mechanisms mediating the increased risk for dementia observed in relation to high BPV. Chronic high fluctuations in BP may promote cumulative damage down the arterial tree to smaller vessels and further disrupt cerebral blood flow to the arterioles and capillaries [17], especially in areas particularly vulnerable to BP-related ischemic-hypoxic injury, including the subcortical white matter and hippocampi [13, 46].
There is a large literature linking average BP levels to both AD pathology and CVD [28, 47]. Additionally, the pulsatile component of BP (i.e., pulse pressure) is increasingly recognized as a contributor to both CVD and tau pathologies [27, 48]. Our results suggest that the variability of BP may be more related to CVD specifically, even in patients with predominant AD pathology. Importantly, the study sample was largely comprised of older adults with limited antemortem CVD at the first measurement of BP (e.g., Hachinski score ≤ 4), suggesting the observed relationships may be even stronger in populations with more severe CVD during life. Relatedly, BPV was not linked to change in cognition at follow-up in older adults confirmed to have AD at autopsy, suggesting that increased BPV may be predominantly related to risk for CVD rather than AD pathology or cognitive impairment in individuals with AD. However, autopsy studies in individuals with a pathological diagnosis of AD have high levels of disease with a restricted range available for investigation, which may preclude us from examining how BPV may be related to the full spectrum of AD pathology including earlier disease stages. For example, AD pathology reaches the insular cortex at Braak & Braak stage 3 and may be related to autonomic dysfunction in early AD, including declining average BP levels [49, 50]. While the current study sample had an average Braak & Braak score of 5.3, future studies should investigate how BPV may be related to less advanced AD pathology.
Studies of BPV in aging adults may have therapeutic implications. Beyond aggressive BP lowering, which has been found to attenuate risk for cognitive impairment [51], consideration of the variability of BP when making antihypertensive treatment decisions may improve our ability to target individuals most at risk for CVD. Some antihypertensive classes have differential effects on BPV in risk for stroke, independent of average levels, including the possible decrease of BPV with calcium-channel blockers and increase of BPV with β blockers [41, 52]. One review of clinical trials for antihypertensive treatment in the prevention of dementia suggests that calcium-channel blockers may be superior to diuretics and β blockers [53]. However, it remains unclear which antihypertensive class or combination of classes confers the largest cognitive benefit [54–56]. The current study cannot address the potential class effects of antihypertensive medication monotherapy or combination therapy on BPV and neuropathology given sample limitations. More studies are needed to disentangle the class effects on BPV and cognition and neuropathology.
Study findings implicate diastolic BPV, and not systolic BPV, in CVD lesion burden in the context of AD pathology. One study reported stronger links of diastolic BPV compared with systolic BPV with MRI-based markers of CVD in older adults without history of dementia at the time of BPV measurement [19]. It has been hypothesized that diastolic BPV may reflect endothelial dysfunction or sympathetic autonomic nervous system over-activation, while systolic BPV may reflect arterial stiffening, but further research is warranted [11, 58]. There is also the possibility that the time course of BPV elevation may differ for systolic and diastolic BP. Future studies that capture variability in BP across the lifespan will help elucidate this.
Study strengths include the large sample size of participant brains with neuropathological evaluation and neuropsychological follow-up. Another strength is the longitudinal design of the study, which allowed investigation of relationships between BPV during life and postmortem neuropathological features. Additionally, by investigating cognitive change after the measurement of BPV, we were able to appreciate the temporal order of any associations and assess the role of BPV in cognitive change in individuals with AD. The study also examined participants with an autopsy-confirmed diagnosis of AD and excluded participants with primary pathological diagnoses other than AD. Finally, the study design followed participants approximately annually, which is similar to routine examination in clinical settings using SD and CV indices of BPV that are readily computed.
There are several noteworthy study limitations, including the general limits of the NACC database which draws from a large number of centers and includes both clinical and population-based study data. Although the neuropathological variables assessed in the present study are harmonized across ADCs, more detailed neuropathological data are not available. Relatedly, some details about BP collection are not available. There is the possibility of selection bias due to the nature of autopsy studies excluding participants who do not come to autopsy. Additionally, study participants had extensive AD pathology (i.e., all participants met CERAD criteria for probable or definite AD at autopsy), which limits study findings to advanced disease stages. BPV was derived from BP measurements taken near the end of life, which limits generalizability of findings to BPV earlier in life. While it is largely appreciated that dysregulated BP in mid-life is linked to later brain health [47, 59], two recent studies of late-life average BP suggest links with cerebrovascular and AD pathology at autopsy [28, 37]. Additionally, the present study calculated BPV from 3 to 4 BP measurements. Using more BP measurements may improve the calculation of BPV [60]. Finally, the study sample was largely comprised of non-Hispanic White older adults with limited CVD. Some evidence suggests that the relationship between CVD and cognitive impairment may differ by ethnicity [61]. Therefore, generalizability of study findings to other racial and ethnic groups is limited. However, one study of BPV and in vivo neuroimaging markers of CVD in a racially and ethnically diverse sample of older adults reported no significant difference between ethnic groups [26]. Future studies should explore potential differences in postmortem CVD in racially and ethnically diverse study populations.
CONCLUSION
Elevated antemortem BPV is related to increased severity of postmortem CVD, and not AD pathology or CAA, in older adults with autopsy-confirmed AD, independent of average BP levels. Atherosclerosis in the COW and cerebral arteriolosclerosis appear to be particularly vulnerable to elevated BPV, suggesting that the variability of BP may selectively promote neuropathology in areas critical for cognition.
Footnotes
ACKNOWLEDGMENTS
The study data analysis was supported by NIH/NIA grants (R01AG064228, R01AG060049, P50 AG016573, and P01 AG052350) and Alzheimer’s Association grant AARG-17-532905. Data collection and sharing for this project was funded by the National Alzheimer’s Coordinating Center (NACC). The NACC database is funded by NIA/NIH Grant U01 AG016976. NACC data are contributed by the NIA-funded ADRCs: P30 AG019610 (PI Eric Reiman, MD), P30 AG013846 (PI Neil Kowall, MD), P30 AG062428-01 (PI James Leverenz, MD) P50 AG008702 (PI Scott Small, MD), P50 AG025688 (PI Allan Levey, MD, PhD), P50 AG047266 (PI Todd Golde, MD, PhD), P30 AG010133 (PI Andrew Saykin, PsyD), P50 AG005146 (PI Marilyn Albert, PhD), P30 AG062421-01 (PI Bradley Hyman, MD, PhD), P30 AG062422-01 (PI Ronald Petersen, MD, PhD), P50 AG005138 (PI Mary Sano, PhD), P30 AG008051 (PI Thomas Wisniewski, MD), P30 AG013854 (PI Robert Vassar, PhD), P30 AG008017 (PI Jeffrey Kaye, MD), P30 AG010161 (PI David Bennett, MD), P50 AG047366 (PI Victor Henderson, MD, MS), P30 AG010129 (PI Charles DeCarli, MD), P50 AG016573 (PI Frank LaFerla, PhD), P30 AG062429-01(PI James Brewer, MD, PhD), P50 AG023501 (PI Bruce Miller, MD), P30 AG035982 (PI Russell Swerdlow, MD), P30 AG028383 (PI Linda Van Eldik, PhD), P30 AG053760 (PI Henry Paulson, MD, PhD), P30 AG010124 (PI John Trojanowski, MD, PhD), P50 AG005133 (PI Oscar Lopez, MD), P50 AG005142 (PI Helena Chui, MD), P30 AG049638 (PI Suzanne Craft, PhD), P50 AG005136 (PI Thomas Grabowski, MD), P30 AG062715-01 (PI Sanjay Asthana, MD, FRCP), P50 AG005681 (PI John Morris, MD), P50 AG047270 (PI Stephen Strittmatter, MD, PhD).