
Abstract
Background:
Alzheimer’s disease (AD) is a multifactorial process that takes years to manifest clinically. We propose that brain-derived indicators of cerebrovascular dysfunction and inflammation would inform on AD-related pathological processes early in, and perhaps prior to neurodegenerative disease development.
Objective:
Define the relationship between cerebrospinal fluid (CSF) markers of cerebrovascular dysfunction and neuroinflammation with AD CSF biomarkers in cognitively normal individuals.
Methods:
Analytes were measured from CSF and plasma collected at baseline from two randomized control trials. We performed Pearson correlation analysis (adjusting for age, sex, APOE haplotype, and education) between markers of central nervous system (CNS) barrier disruption, cerebrovascular dysfunction, CSF inflammatory cytokines and chemokines, and plasma lipid levels. We then developed a statistical prediction model using machine learning to test the ability of measured CSF analytes and blood lipid profiles to predict CSF AD biomarkers (total tau, phospho-tau (181), Aβ42) in this clinical population.
Results:
Our analysis revealed a significant association between markers of CNS barrier dysfunction and markers of cerebrovascular dysfunction, acute inflammatory responses, and CSF inflammatory cytokines. There was a significant association of blood lipid profiles with cerebrovascular injury markers, and CSF inflammatory cytokine levels. Using machine learning, we show that combinations of blood lipid profiles, CSF markers of CNS barrier disruption, cerebrovascular dysfunction and CSF inflammatory cytokines predict CSF total tau, p-tau, and, to a lesser extent, Aβ42 in cognitively normal subjects.
Conclusion:
This suggests that these parallel pathological processes may contribute to the development of AD-related neuropathology in the absence of clinical manifestations.
INTRODUCTION
Alzheimer’s disease (AD) is characterized by neurodegeneration combined with the presence of amyloid-β (Aβ) plaques and tau neurofibrillary tangles. While the presence of all three features is necessary for a definitive diagnosis of AD [1], it is now understood that the pathological processes underlying these features begin at least a decade before the emergence of clinical symptoms of cognitive decline [2]. For this reason, much attention is now concentrated on defining the processes underlying the earliest pathological events in the progression of AD, and in defining biomarkers that reflect these early pathological processes.
Measures of cerebrospinal fluid (CSF) Aβ1-42, phosphorylated tau (p-tau), and total tau are used in both clinical and research settings to assess AD status in symptomatic individuals with cognitive impairment and dementia [3]. Aβ1-42 in the CSF is inversely correlated with Aβ plaque deposition, CSF p-tau reflects neurofibrillary tangle burden, and CSF total tau reflects neuronal degeneration [1, 4]. Together low CSF Aβ42 and high tau/p-tau are core neuropathological biomarkers of AD [5]. Prospective studies indicate that CSF concentrations of Aβ42 and tau/p-tau can provide ∼90% sensitivity for prediction of progression from mild cognitive impairment (MCI) to AD [6–9], although the utility of such biomarkers has not been conclusively defined in cognitively unimpaired subjects [10]. It remains unclear what biomarker signatures may reflect the earliest pathological processes, including those lying ‘upstream’ of Aβ and tau pathology, driving the development and progression of AD.
In contrast to rare cases of familial AD in which genetic mutations in Aβ processing pathways clearly drive disease development [11, 12], the processes contributing to the much more common sporadic form of the disease are less clear. Large population studies and meta-analyses show that vascular disease [13, 14], cerebrovascular dysfunction [15–17], inflammation [18], metabolic disorders [19], known genetic variants in cardiovascular [20, 21], lipid/cholesterol metabolism [22, 23], and immune pathways [24, 25] increase the risk of sporadic AD. With such a diverse array of contributing risk factors and pathogenic processes involved, a non-biased and systematic approach to identifying predictive biomarker signatures may be more appropriate to apply to such a heterogeneous disease. In addition, studies defining changes occurring prior to the development of cognitive decline, or even prior to the development of detectable Aβ or tau pathological burden, may shed important new light on these early disease processes and on potential targets for prevention.
In the present study, we have leveraged paired baseline plasma and CSF biomarker data from two randomized controlled trials carried out in cognitively intact participants [26, 27]. Both trials were designed to test the effect of lipid-lowering statin therapy on CSF biomarkers of AD: the first in participants with hypercholesterolemia, and the second in participants with normal plasma cholesterol levels. Pooling plasma and CSF biomarker data from both studies, we first defined the relationship among markers of central nervous system (CNS) barrier (e.g., blood-brain barrier, blood-CSF barrier) dysfunction, CSF markers of cerebrovascular inflammation, and CSF inflammatory cytokine levels. We then characterized the association between plasma lipid levels and the CSF inflammatory biomarkers. Finally, we examined relationships among AD CSF biomarkers and plasma lipid levels, markers of CNS barrier disruption, CSF markers of vascular dysfunction, and CSF inflammatory cytokines. Using a machine learning approach incorporating the many analytes measured across these two studies, we developed and tested a model that predicted CSF total tau and p-tau levels within these cognitively intact populations. The predictors included features reflecting cerebrovascular dysfunction, central neuroinflammation, and changes in plasma lipid levels, providing evidence for convergence of several biological processes in the earliest stages of AD pathological progression.
METHODS
Data collection
Data used in this study were the baseline data from two separate double-blinded randomized trials, (Trial 1 [27]) and (Trial 2 [28]).
Trial 1: This trial was designed to test the hypothesis that statin treatments (simvastatin or pravastatin) could improve AD-related CSF markers (e.g., preventing the decline of CSF Aβ42 or preventing the increase in CSF total tau or p-tau (181)). Thus hypercholesterolemic participants (n = 23) aged 34–87 years (mean = 60.6, SD = 13.0) without dementia were recruited [27]. Participants were cognitively normal by score ≥26 on Mini-Mental State Exam (MMSE), ≥6 on the New York University delayed paragraph recall test, and a Clinical Dementia Rating (CDR) scale score of zero. All participants were free of cholesterol lowering drugs for at least one year prior to sample collection and had cholesterol between 200 and 350 mg/dL or LDL ≥130 mg/dL. Participants were treated with simvastatin (40 mg/day) or pravastatin (80 mg/day) for 12 weeks. CSF and blood samples from baseline used in the current analysis were collected in the morning after fasting since midnight. Demographic features for participants in Trial 1 are provided in Table 1.
Trial participant demographic features
Trial participant data, mean, [lower limit, upper limit]. APOE, Apolipoprotein E (number with this haplotype), UK, unknown.
Trial 2: This study registered with clinicaltrials.gov (NCT01142336) was conducted to measure the ability of statins to protect against AD pathological changes using CSF AD markers (CSF total tau or p-tau (181)) in participants with normal or mildly elevated cholesterol (LDL < 130 mg/dL), that did not need or take cholesterol lowering therapy [28]. Participants (n = 46) aged 45–64 years (mean = 56.2, SD = 4.5) completed a one-year study treated with simvastatin (40 mg/day) or placebo. All subjects were cognitively normal based on history, clinical examination, and neuropsychological tests (MMSE > 26, Logical Memory delayed recall score > 6, CDR score = 0). CSF and blood samples from baseline used in the current analysis were collected in the morning (between 9 am–11 am), after a night of fasting. Demographic features for participants in Trial 2 are provided in Table 1.
Serum and CSF collection, processing, and analysis
Collection and processing of serum and CSF samples were conducted as previously described [27, 28]. Briefly, lumbar punctures were performed following 30 min of bed rest with participants in the lateral decubitus position. CSF was collected with a 24 g Sprotte atraumatic spinal needle in sequential 5 ml syringes, with the first 2–3 ml collected and sent to VA Puget Sound Health Care System clinical lab for red and white blood cell, and more specific types of white cell counts, protein, and glucose measurements. All samples were below the threshold of 500 cells/μl considered sufficient for CSF standards [29]. Samples were aliquoted at the bedside into 0.5 ml aliquots, and immediately frozen on dry ice and stored at –80°C. Study 1 samples were stored for 13–16 years, and study 2 samples were stored for 5–9 years in monitored –80°C freezers. Samples were only thawed once for the assay.
Blood samples were centrifuged at 4°C within 90 min of collection, with serum and plasma aliquoted and stored at –80°C. The complete list of analytes measured from the CSF and plasma are included in Table 2. Albumin and C-reactive protein (CRP) were measured by nephelometry (Dade-Behring); serum total cholesterol, high-density lipoprotein (HDL), and plasma triglycerides were measured with a Roche Hitachy 917 automatic analyzer. Low density lipoprotein (LDL) was calculated using the Friedewald formula [30]. Apolipoprotein-E (APOE) haplotypes were analyzed using previously described methods of polymerase chain reaction with Hla1 digestion [31, 32]. Albumin assay of CSF and serum: Albumin was measured in CSF and serum using ELISA kits from Immunology Consultants Laboratory (cat no. E-80AL) according to manufacturer instructions. Prior to assay, CSF and serum were thawed on ice, and then centrifuged at 20,000×g for 5 min. CSF was diluted 1/10,000 and serum was diluted 1/1,000,000 in buffer provided with the kit. CSF and serum from the same participants were measured together on the same plate. All samples analyzed had absorbance values within range of the highest and lowest standards on the plate. CSF cytokines (pg/mL)
Analytes used in the current study
List of all analytes displayed in functional groups used in this study. *Analytes in italics denote measures used for specific association analysis (Figs. 1 and 2). All analytes were incorporated for machine learning algorithm (Fig. 3).
Meso Scale V-plex kits were used to measure analytes from the CSF in duplicate (cat no. K15050D (GM-CSF, IL-1α, IL-5, IL-7, IL-12/IL-23p40, IL-15, IL-16, IL-17, TNFβ, VEGF-A), K15049D (IFNγ, IL-1β, IL-2, IL-4, IL-6, IL-8, IL-10, IL-12p70, IL-13, TNFα, K15047D (Eotaxin, Eotaxin-3, IL-8, IP-10, MCP-1, MCP-4, MDC, MIP-1α, MIP-1β, TARC), K15198D (CRP, ICAM-1, SAA, VCAM-1), K15190D FGF (basic), PlGF, Tie-2, VEGF-A, VEGF-C, VEGF-D, VEGFR-1/Flt-1), K15277K (Ghrelin, glucagon, leptin, BDNF, FGF-21), Meso Scale Diagnostics). For every value below detectable level according to manufacturer’s instructions, an algorithm was used to generate a random value between zero and the detection level as an imputed value for the missing observation.
CSF Aβ42, p-tau(181), and total tau, were measured either using well-validated ELISAs described previously [33] (Trial 1), or by the Knight Alzheimer’s Disease Research Center at Washington University in St. Louis using the INNO-BIA AlzBio3 assay [28] (Fujirebio, formerly Innogenetics, Ghent, Belgium) (Trial 2). Aβ40 was only measured in Trial 1; therefore, we did not use this measure in any of our analyses.
Data analysis and statistical approaches
Although all the participants were enrolled into the clinical trials, only baseline (prior to study drug treatment) measurements were analyzed for this study. We first defined the associations among the markers of CNS barrier dysfunction, plasma lipid levels, markers of cerebrovascular dysfunction, acute peripheral inflammation, and central inflammatory cytokines. Because these analytes were measured using the same MesoScale V-plex kits, measures were pooled between Trial 1 and Trial 2. Pearson correlations coefficients (r) in Figs. 1 and 2 correlation matrices were calculated in GraphPad Prism to examine the linear relationship between the measured variables. As a sensitivity analysis we computed Spearman as well as Pearson correlation coefficients. The two sets of results were similar, supporting the validity of the normality assumption required by the Pearson method. Pearson r and p values can be found in the Supplementary Material. RStudio was used to present correlation matrices using the corrplot package. Adjusted p values were calculated using the glm() function in R, to correct for age, gender, years of education, and APOE ɛ4 haplotype. Multiple correction of those p values within each matrix were calculated using Holm Sidak method.
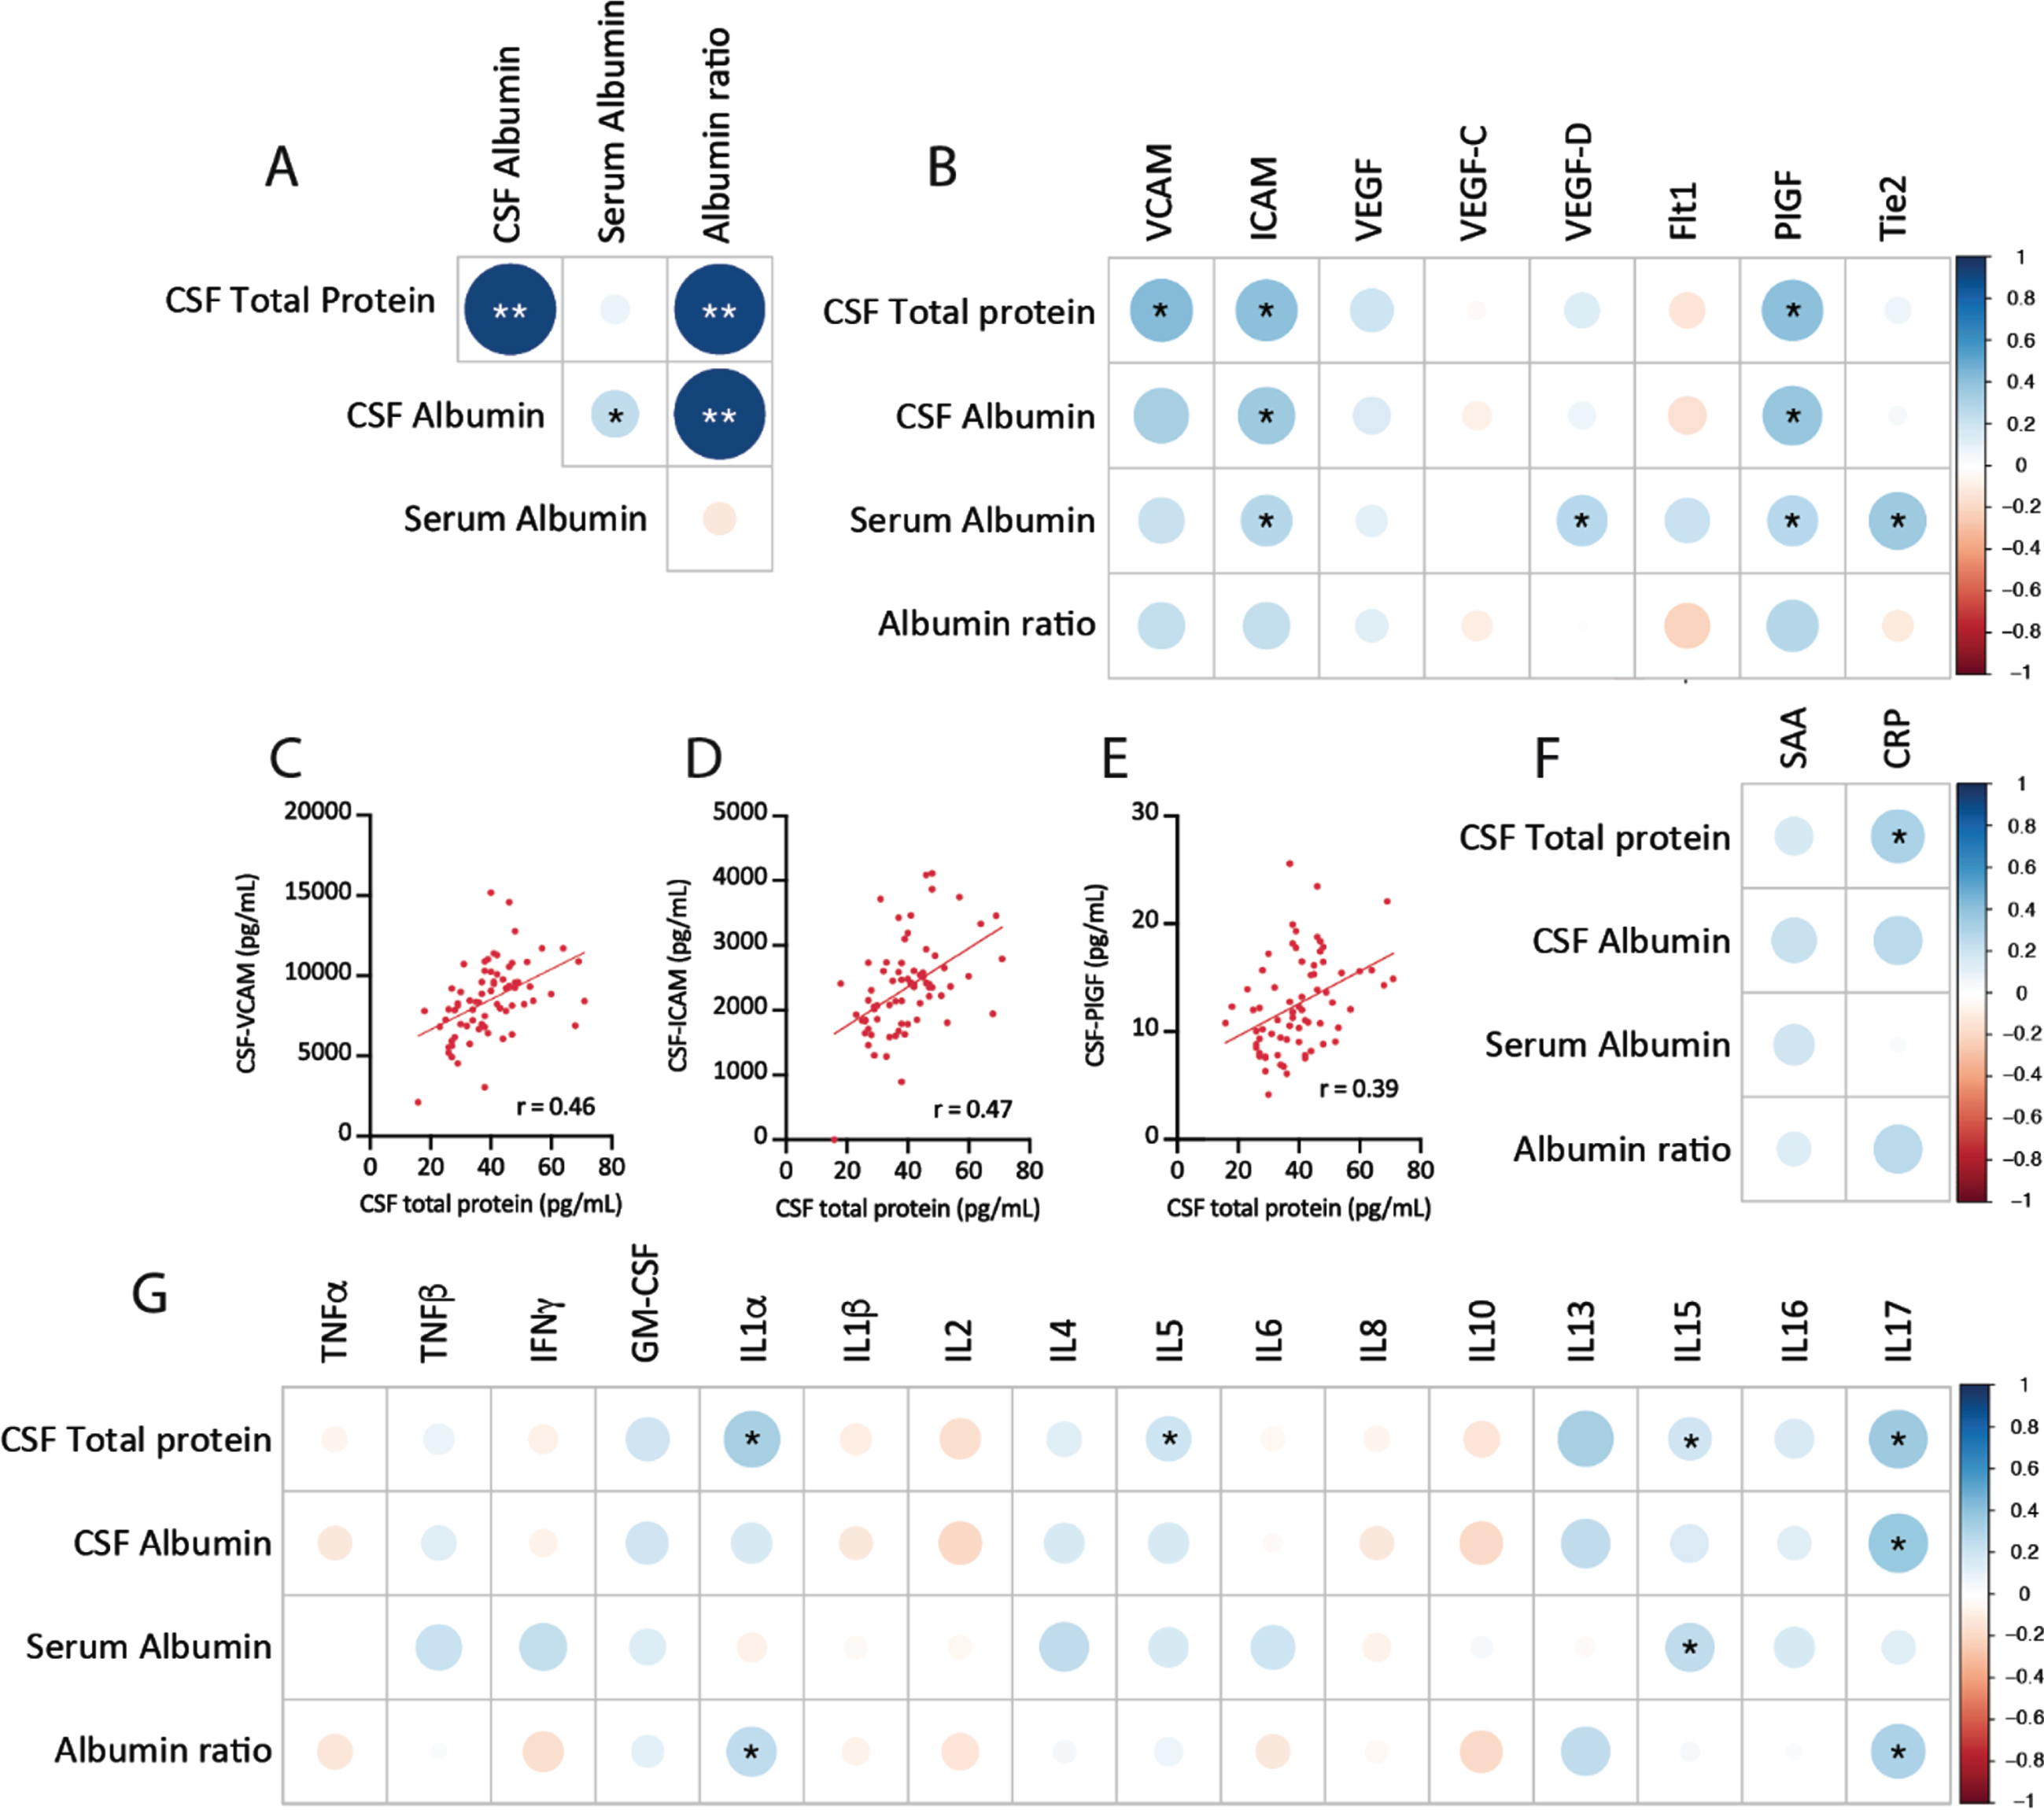
CSF protein concentration correlates with markers of cerebrovascular injury and neuroinflammation. A) Correlation plots of CSF protein measures from Trial 1 and Trial 2 baseline measures. B) Correlation plots of CSF protein levels with CSF markers of vascular injury. Plotted individual subject data for CSF total protein versus VCAM (C), ICAM (D), and PIGF (E). F) Correlations between CSF protein markers and markers of acute-phase peripheral inflammatory response, SAA, and CRP. G) Correlations between CSF protein markers and cytokine markers of neuroinflammation. Correlation plots of baseline values from Trial 1 and Trial 2, depicting r values (color and size), *p < 0.05, **significant after Holm-Sidak correction for multiple comparisons.
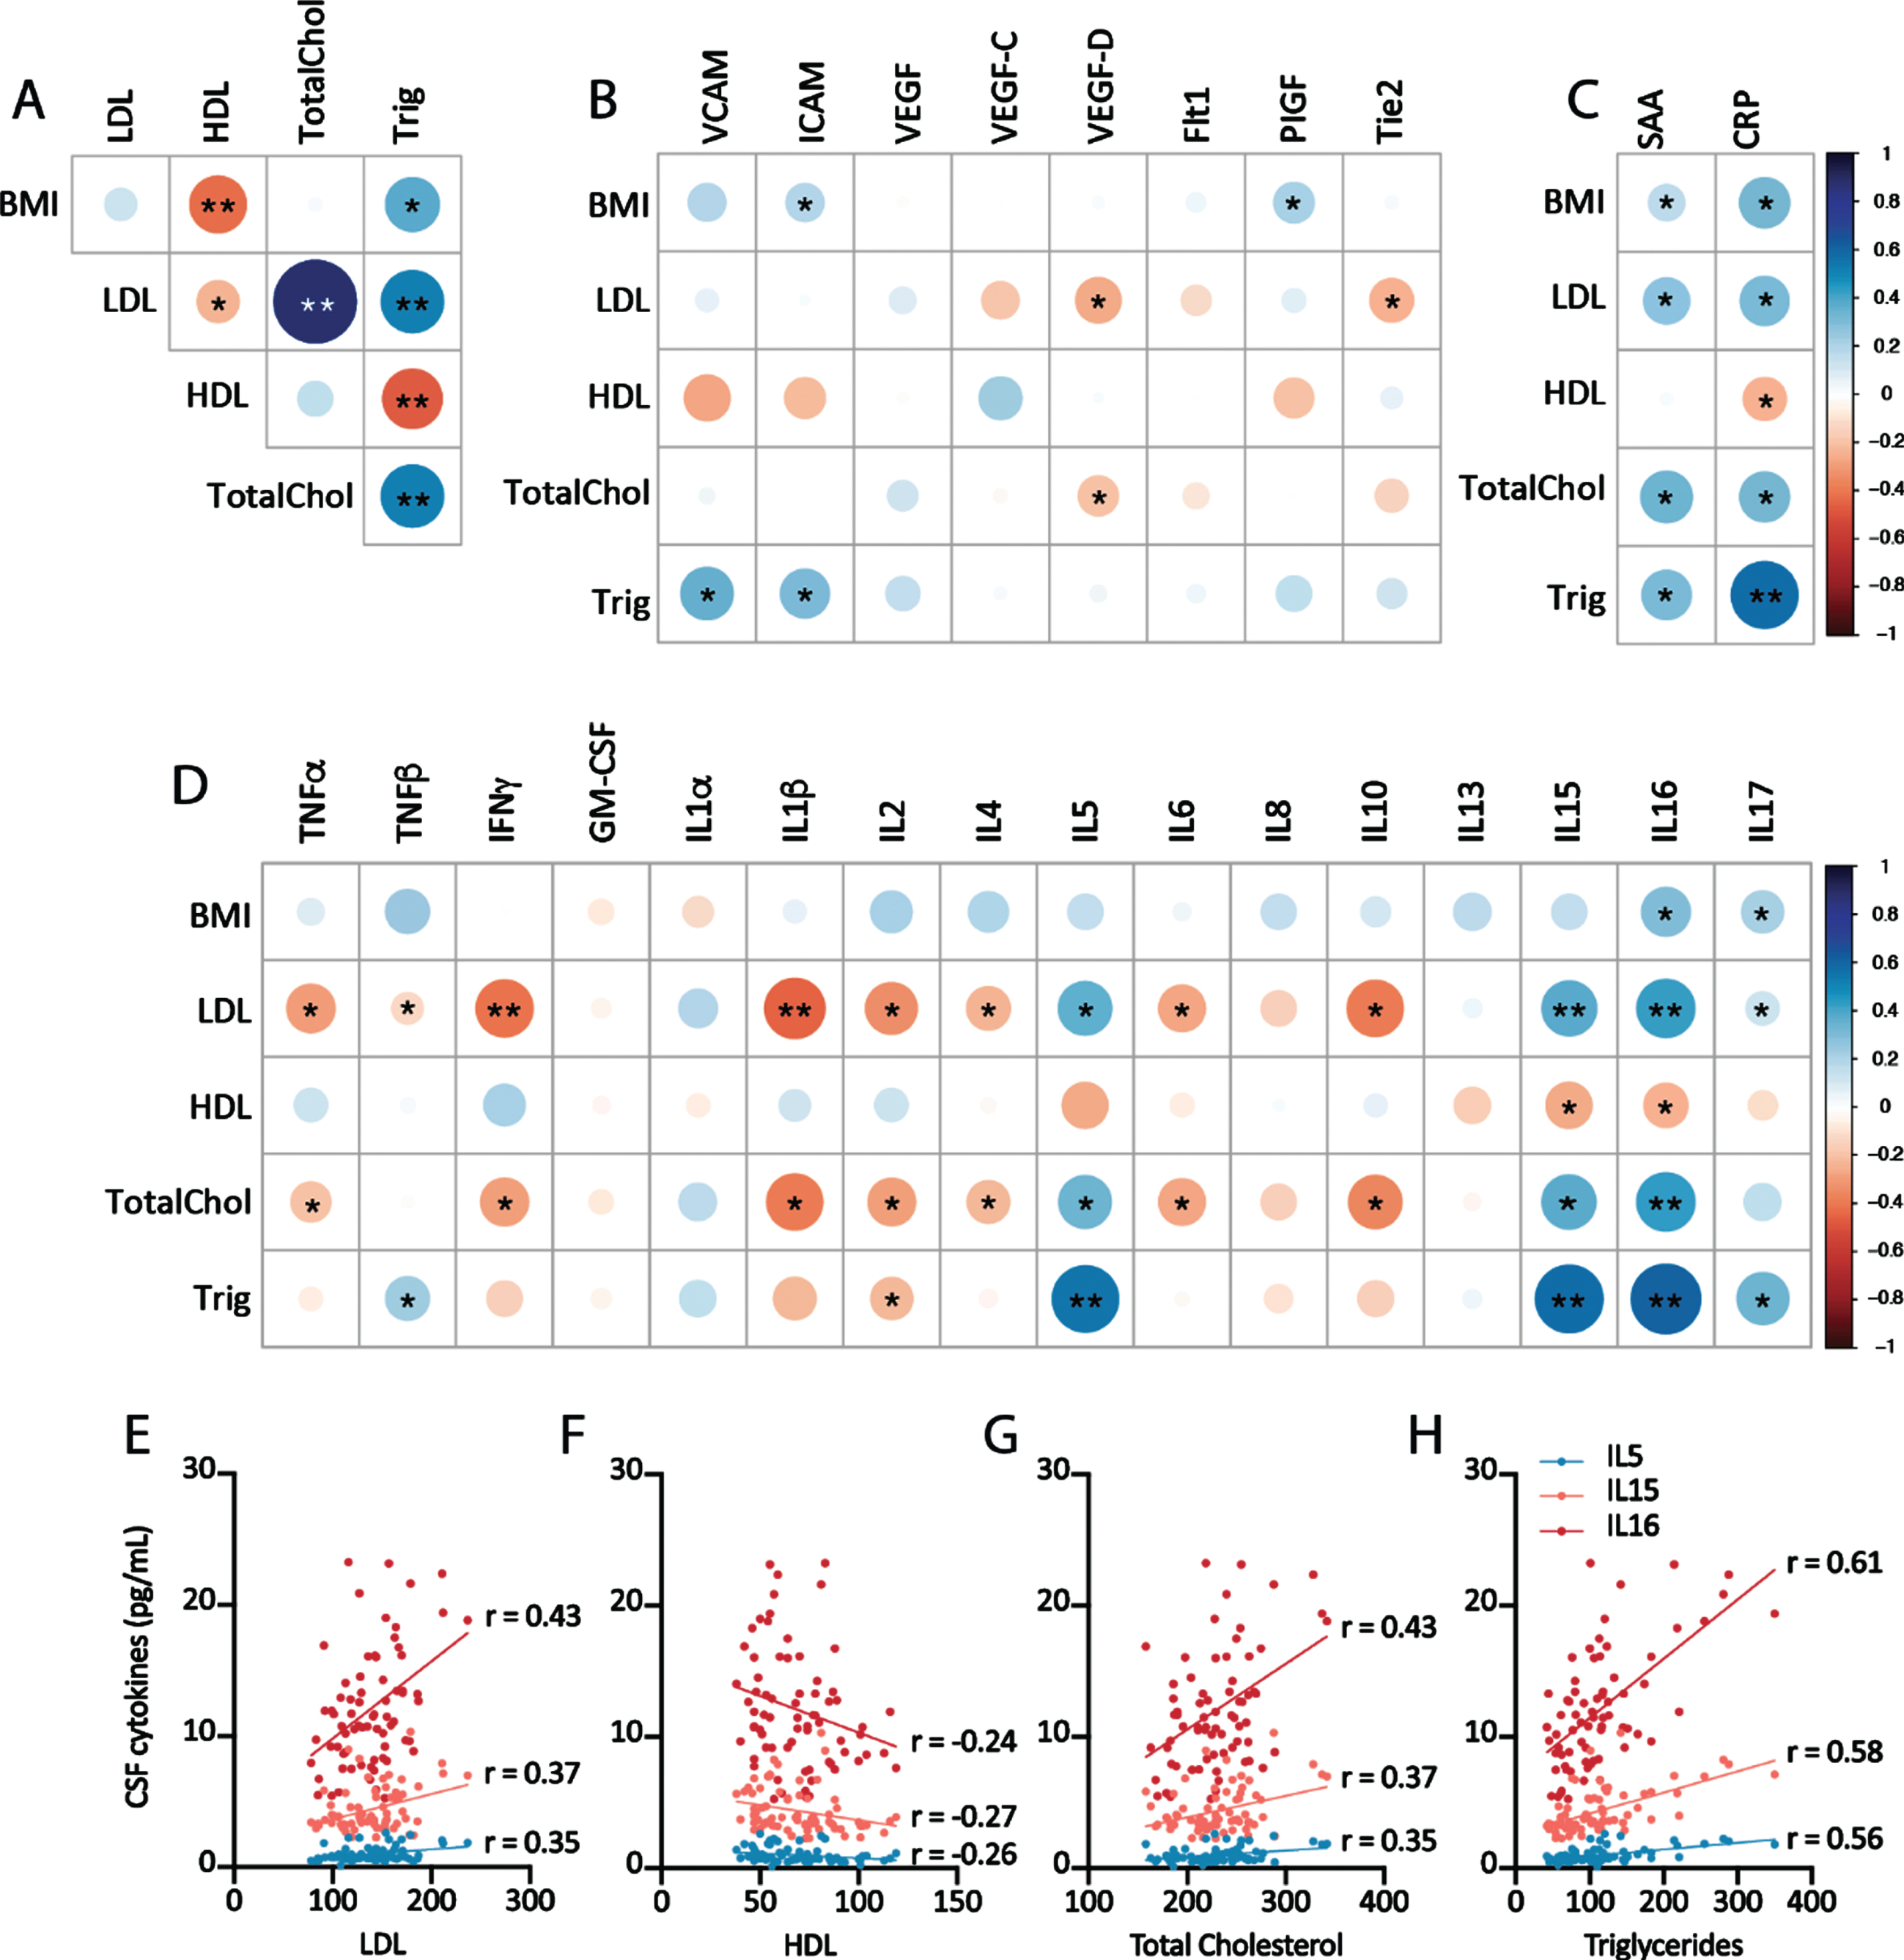
Relationship of plasma lipid measures with central measures of cerebrovascular injury and neuroinflammation. A) Correlation plots of plasma lipid levels from Trial 1 and Trial 2 baseline measures. Correlation plot of plasma lipid measures and CSF markers of cerebrovascular injury (B), acute peripheral inflammation (C), and CSF cytokine levels (D). E-H) Correlation plots of individual data points for plasma lipid measures and IL-5, IL-15, and IL-16. Correlation plots depict r-values (color and size), *p < 0.05 Pearson correlation, **significant after Holm-Sidak correction for multiple comparisons.
To understand how different disease processes associated with AD biomarkers, we built a supervised machine learning model using the partial least square regression method. Trial 2 was used as the training and validation dataset and Trial 1 was used as the testing dataset. The plsr() function was used to build the regression model. A 10-fold cross-validation was applied to the first round of model building to find the optimal numbers of components. After the cross-validation, only the first two components were used to refit the regression model. The top twenty features with the highest absolute value of the coefficients were listed in Fig. 3. The final model was applied to the testing dataset to test the model accuracy. These analyses utilized R studio version 1.3.959.
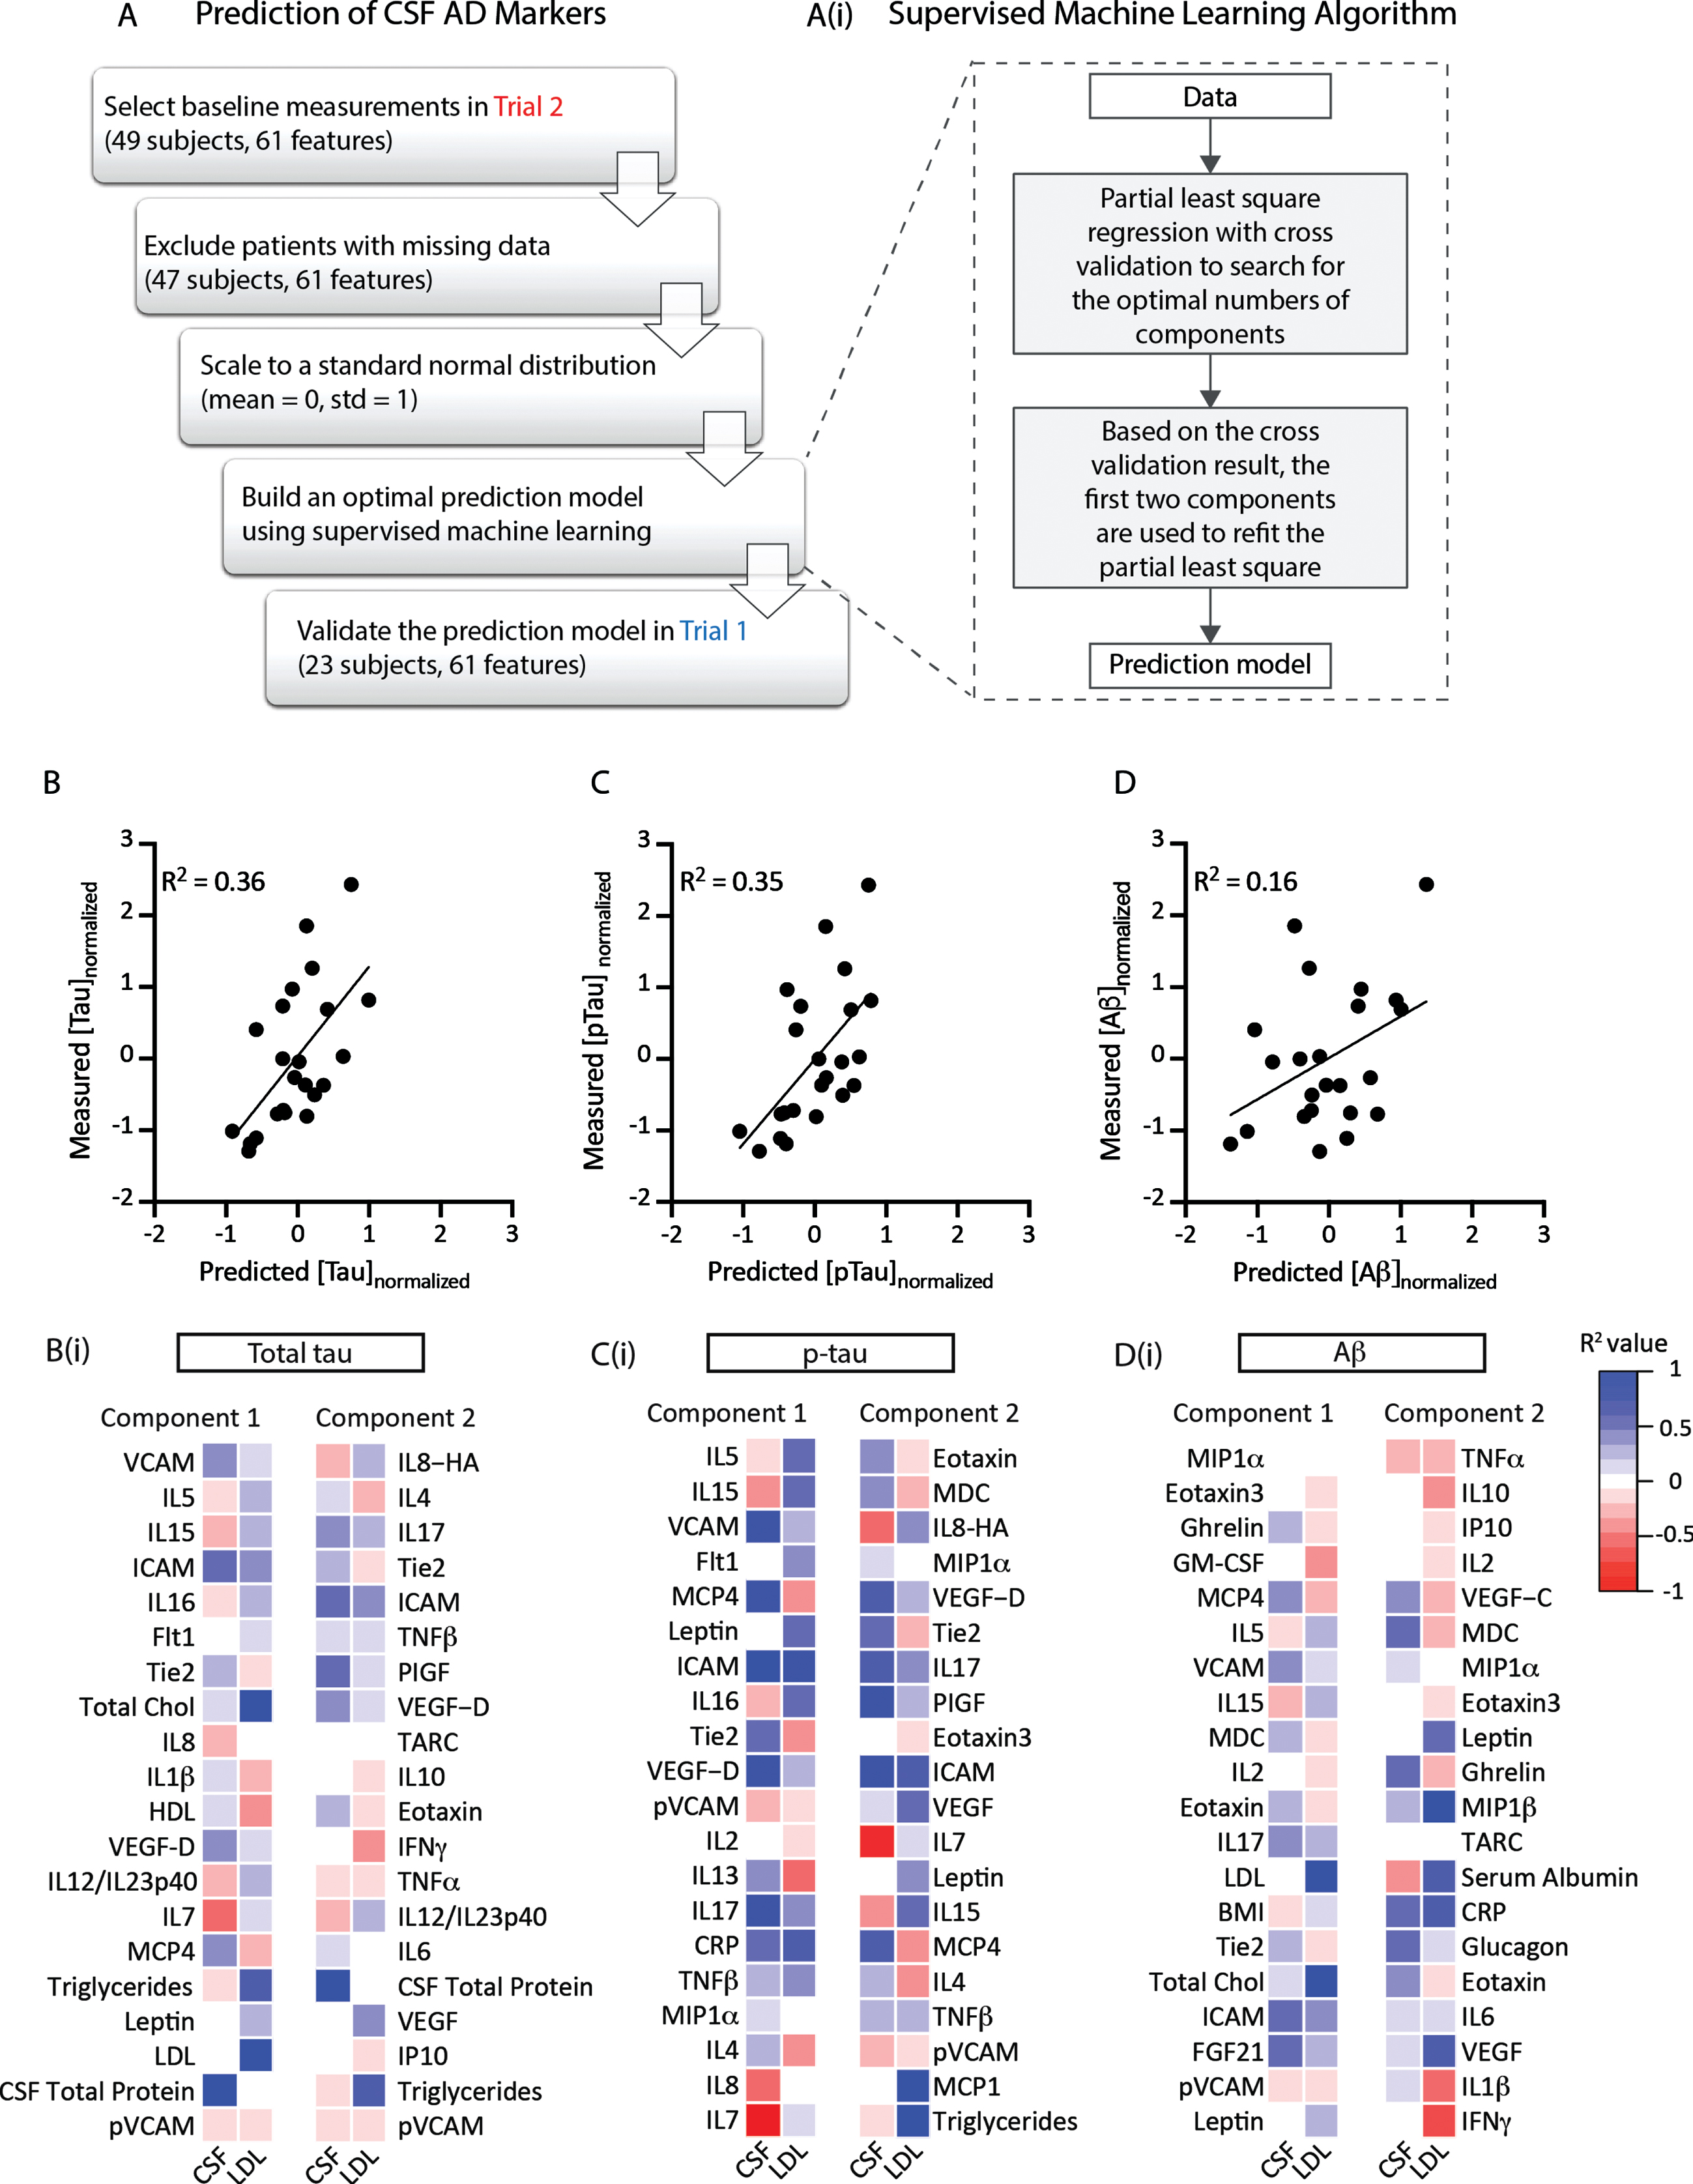
Statistical prediction model of CSF total tau and p-tau levels. A) Trial 2 (49 subjects) was used as the training dataset. 61 features were included to train the predictive model, including CSF and plasma analytes. The model was tested using data from Trial 1. Ai) A partial least square regression model was used to cross-sectionally predict the values of Alzheimer’s disease-related CSF biomarkers (total tau, p-tau, or Aβ42). In the first round of model fitting, a 10-fold cross validation was used to search for the optimal numbers of components to avoid overfitting. Based on the cross validation result, the first two components were used to refit the model. Cross-sectional prediction accuracies for total tau (B), p-tau (C), and Aβ42 (D) were plotted against measured values within the testing dataset (Trial 1). The supervised machine learning model was able to cross-sectionally predict CSF total tau and p-tau levels with R2 at 0.36 and 0.35, respectively. The model had less accuracy predicting Aβ42, R2 = 0.16. The top 20 features of the two components of the predictive models for CSF total tau (Bi), p-tau (Ci), and Aβ42 (Di) were ranked by the absolute value of their coefficients. The association (R2 value) of each component feature with CSF total protein (CSF) or plasma LDL levels (LDL) are represented in heat map form.
RESULTS
Markers of CNS barrier dysfunction associate with cerebrovascular dysfunction and neuroinflammation
We initially evaluated the association between markers of CNS barrier dysfunction and those of cerebrovascular injury and neuroinflammation. Elevated CSF total protein levels or a high CSF/serum albumin ratio are a commonly used marker of blood-brain barrier and blood-CSF-barrier permeability [16]. The initial analysis showed a strong positive correlation between CSF total protein and CSF albumin (Fig. 1A), which is consistent with the fact that albumin makes up the majority of the protein content of CSF [34]. Among markers of vascular inflammation measured in the CSF, there was a positive association between CSF total protein and CSF vascular cell adhesion molecules (VCAM, p = 0.011), CSF intracellular adhesion molecule (ICAM, p = 0.005), and placental growth factor (PlGF, p = 0.032) (Fig. 1B–E). Similar positive associations were observed between VCAM, ICAM, and PIGF with CSF albumin, although these associations were not observed with the CSF/serum albumin ratio. In addition, a significant relationship was observed between CSF total protein and plasma CRP, a marker of cellular acute stress and injury (p = 0.024, Fig. 1F). While detection of these vascular inflammatory analytes in CSF is not uncommon, the fact that a similar association is observed between CSF VCAM and ICAM with CSF total protein and CSF albumin levels suggests that these markers faithfully reflect cerebrovascular dysfunction and increased blood-brain barrier permeability.
As blood-brain barrier permeability is commonly accompanied by neuroinflammation [35], we also measured the relationship between CSF protein and levels of inflammatory cytokines in the CSF. Of the cytokines examined, positive associations were observed between CSF total protein and IL-1α (p = 0.027), IL-5 (p = 0.027), IL-15 (p = 0.037), and IL-17 (p = 0.002) (Fig. 1G). Only IL-1α and IL-17 levels were additionally associated with CSF albumin or CSF/plasma albumin ratios. It should be noted that the associations between measures of CNS barrier dysfunction (CSF total protein, CSF albumin, CSF/plasma albumin ratio) and CSF markers of vascular inflammation (VCAM, ICAM, PIGF) and neuroinflammation (IL-1α, IL-5, IL-15, IL-17) were significant only on initial analysis and did not persist after correcting for multiple comparisons. The associations between CSF ICAM, PIGF, IL-1α, and IL-17 and more than one measure of CNS barrier dysfunction, however, argue that these associations are likely not spurious.
Plasma lipid profile is associated with CSF measures of neuroinflammation
Alterations in lipid metabolism are intimately linked to AD pathogenesis [36], with the APOE ɛ4 allele of the apolipoprotein (APOE) gene representing the highest genetic risk factor for sporadic AD [37]. Indeed APOE regulates cholesterol and lipid balance in the CNS [38], as well as modulating aggregation and clearance of Aβ [39]. Thus, conditions involving changes in lipid and cholesterol homeostasis, including hypercholesterolemia, are associated with higher risk of both vascular disease and AD. Because one of the two studies included participants with normal plasma cholesterol levels while the other included participants with high cholesterol levels, we investigated the relationship between plasma lipid measures (total cholesterol, HDL, LDL, triglycerides, and body mass index (BMI)) with CSF markers of vascular injury and inflammation. As anticipated, plasma lipid measures showed strong positive associations with one another, except HDL which was negatively correlated with LDL, triglycerides, and BMI (Fig. 2A).
No consistent associations were observed between measures of plasma lipids and CSF markers of vascular injury (Fig. 2B). A clear positive association was observed between plasma LDL, total cholesterol, triglycerides, and BMI with markers of acute-phase inflammatory responses (serum amyloid A (SAA), CRP) [40], while a negative association was observed between HDL levels and plasma SAA and CRP levels (Fig. 2C). When the relationship between plasma lipids and CSF inflammatory cytokines was evaluated, a striking pattern was observed in which both LDL and total cholesterol were negatively associated with CSF TNFα, IFNγ, IL-1β, IL-2, IL-4, IL-6, and IL-10 levels, and were positively associated with CSF IL-5, IL-16, and IL-17 levels (Fig. 2D). Plasma triglycerides levels exhibited the same pattern of associations with CSF IL-2, IL-5, IL-15, IL-16, and IL-17. Consistent with the opposing biological roles of LDL and HDL in inflammation and lipid metabolism [41], plasma HDL levels were positively associated with CSF IL-15 and IL-16 levels. Figure 2E-H plots the relationship between plasma lipid measures and CSF IL-5, IL-15, and IL-16 levels.
Combination of markers of CNS barrier dysfunction, cerebrovascular dysfunction, neuroinflammation, and plasma lipids are associated with AD CSF biomarkers
AD-related CSF biomarkers (Aβ1-42, total tau, p-tau) were assessed from both Trial 1 and Trial 2 but using different analytic methods. For that reason, the results from the two studies for these measures could not be combined. When evaluated separately within each Trial, no significant association was observed between markers of CNS barrier dysfunction (CSF total protein, CSF albumin, CSF/plasma albumin ratio), plasma lipid levels (total cholesterol, LDL, HDL, triglycerides), CSF markers of cerebrovascular dysfunction, or CSF markers of neuroinflammation with these AD-related CSF biomarkers.
Because CNS barrier dysfunction [14], changes in lipid metabolism [23] and central neuroinflammatory processes [18, 35] are proposed to contribute to the earliest stages of AD, we leveraged the large number of measured plasma and CSF analytes to take an unbiased approach. In order to identify the measures that were closely associated with AD-related markers (CSF Aβ42, total tau, p-tau) in these cognitively-intact study participants we employed a statistical prediction model. Using the data from Trial 2 as a training dataset, we used machine learning to develop the partial least-square regression model for each of the three AD-related CSF biomarkers. A 10-fold cross validation was used to define the optimal number of features to define the principal components. The final model was fit using the first two components (Fig. 3A). Our model derived from Trial 2 identified principal components that could be used to cross-sectionally predict measured CSF total tau, p-tau, and Aβ42 levels for the participants in Trial 1, which we used as a validation dataset. To test model predictive power, we plotted model-predicted CSF total tau, p-tau, and Aβ1-42 levels against the measured values for subjects in Trial 1 (Fig. 3B–D). The model cross-sectionally predicted measured CSF total tau and p-tau moderately well (CSF total tau R2 = 0.36, CSF p-tau R2 = 0.35), while the model was less effective in predicting CSF Aβ42 levels (R2 = 0.16). The top 20 features of Components 1 and 2 for each predictive model are listed in Fig. 3Bi (CSF total tau), Fig. 3Ci (CSF p-tau), and Fig. 3Di (CSF Aβ42). The association of each component feature with total CSF protein (a marker of CNS barrier disruption) and plasma LDL levels is provided, color-coded based on Pearson r-values. It is noteworthy that both components from the predictive models for CSF total tau and p-tau included features that were associated with markers of cerebrovascular dysfunction, plasma lipid levels, and inflammatory cytokines.
DISCUSSION
Existing CSF and imaging biomarkers provide strong performance in terms of AD diagnosis and prediction of clinical conversion from MCI to dementia with AD [42–45]. Emerging evidence, however, suggests that the pathological processes underlying the development of AD may begin in the decades preceding clinically observable cognitive decline. Data from genetic association studies, clinical observational studies, and pre-clinical research suggest that a wide array of processes, including peripheral inflammation, metabolic dysfunction, changes in lipid metabolism, cardiovascular risk, central neuroinflammation and cerebrovascular dysfunction variously contribute to AD pathogenesis. In the present study carried out in cognitively intact participants, we observe that CSF markers of cerebrovascular dysfunction are related to changes in CNS barrier function and that hyperlipidemia is associated with a pronounced central neuroinflammatory profile. Although none of these biomarkers are individually associated with established AD-related CSF biomarkers, we utilized a machine learning-based statistical prediction model to demonstrate that these apparently distinct processes converge to associate with CSF total tau and p-tau levels. Importantly this prediction model was valid across two different study cohorts that have different lipid profiles, highlighting the generalizability of these findings.
Current biomarker approaches focus on markers of Aβ1-42, tau and neurodegeneration (the recently defined ‘A/T/N’ criteria) [46] for the diagnoses of dementia with AD and to predict clinical progression from MCI to AD [47]. However, the use of biomarker profiles rather than single analyte measures appears to improve predictive performance. Indeed, in a recent study of 435 cognitively-intact participants, the combined use of plasma Aβ42/40 ratio, p-tau(217), and neurofilament light chain protein predicted cognitive decline over a 4-year follow-up better than the use of individual markers [48]. In an in-depth study of 120 adults (cognitively normal, MCI or AD) authors found that VCAM, ICAM, IL-15, CCL2, Flt-1, and VEGF-D were highly correlated with CSF total tau levels [49]. In a later study incorporating proteomic, metabolomic, and lipidomic analysis in 120 cognitively normal elderly subjects, authors also found significant correlations between VCAM, ICAM, and IL-15 with CSF total tau [50], a finding consistent with the results of the present machine learning analysis. From these data, the authors concluded that inter-individual heterogeneity makes the use of single biomarkers to predict AD pathology unreliable. Our study also suggests that multiple overlapping pathological processes are occurring in the absence of clinical presentation and that the use of multiple biomarkers in combination will be superior in describing these early pathological processes.
Our data show that CSF markers of cerebrovascular injury are associated with CSF protein concentrations, a measure of CNS barrier dysfunction, and that measures of plasma hyperlipidemia are associated with a specific profile of CSF markers of neuroinflammation. These findings are consistent with emerging understanding of the role of blood-brain barrier dysfunction, changes in lipid metabolism, and neuroinflammation in CNS pathological processes. Blood-brain barrier dysfunction permits the passage of blood-borne proteins such as albumin from the blood compartment into the brain interstitial and CSF compartments, increasing CSF total protein levels, CSF albumin levels, and the CSF/serum albumin ratio. Recent data from studies in human subjects using dynamic contrast-enhanced MRI [51] and the assessment of CSF/plasma albumin ratio biomarkers show evidence of blood-brain barrier leakage in participants with MCI and AD [52]. In a large cohort study of > 1800 participants, blood-brain barrier dysfunction measured by CSF/albumin ratio was not specific to AD, but was associated with markers of cerebrovascular pathology both in AD and non-AD participants [53] suggesting that this measure alone cannot be used to identify or predict AD.
The ratio between CSF and plasma albumin concentrations is the measure most frequently used to define blood-brain barrier dysfunction in clinical biomarker studies, including in the setting of cerebrovascular injury and AD. To our knowledge, the relationship between CSF total protein, CSF albumin level, CSF/plasma albumin ratio, and CSF markers of cerebrovascular dysfunction has not been investigated in healthy human populations. Our data demonstrate the CSF total protein and CSF albumin levels are more closely associated with CSF VCAM and ICAM levels than the CSF/plasma albumin ratio, suggesting that these measures may more sensitively reflect cerebrovascular dysfunction, particularly in cognitively intact populations that are likely to be early in the pathogenic process.
Changes in CSF protein levels have been suggested to result from alterations in CSF production and turnover [54]. Studies in rodent models demonstrate that cerebrovascular dysfunction likely influences CSF flow and exchange [55]. The association between increased CSF protein levels and CSF markers of cerebrovascular dysfunction such as ICAM and VCAM are consistent with slowed CSF secretion and turnover [56]. If this were the case, then the association would be expected to extend to both plasma-derived proteins (such as albumin) as well as CNS-derived proteins (such as tau) in the CSF. The fact that neither the measures of CSF protein nor CSF markers of cerebrovascular dysfunction were associated with CSF total tau levels argues that the observed changes in CSF protein levels reflect primarily changes in CNS barrier function, rather than changes in CSF secretion and turnover.
Our data indicate that cerebrovascular and CNS barrier dysfunction may be present much earlier than anticipated in an otherwise cognitively healthy study population. In line with this notion, Aβ deposition appears to begin more than a decade prior to the onset of cognitive impairment [2]. If cerebrovascular and CNS barrier dysfunction contributes to the development of early AD-related pathological changes, such as Aβ deposition or tau phosphorylation, then it seems possible that subtle changes in these processes may be evident even in otherwise cognitively healthy at-risk populations. While a strong negative correlation exists between CSF Aβ concentrations and Aβ deposition by positron emission tomography (PET) in symptomatic individuals, this relationship is not so well defined in pre-symptomatic subjects [57]. Thus, the current study is limited in that there are no direct measures of parenchymal Aβ deposition in these individuals. Therefore, caution should be used when interpreting CSF Aβ42 levels as CSF Aβ concentration decreases with Aβ parenchymal accumulation [58].
We also observed that plasma lipid markers were associated with a specific profile of changes in CSF cytokine levels, with plasma LDL, total cholesterol, and triglyceride levels associated with reduced CSF IFNγ and IL1β levels, and increased IL-5, IL-15, and IL-16 levels. While this finding is consistent with prior studies demonstrating that high plasma cholesterol and LDL are associated with systemic inflammation [59], there is little published evidence in humans demonstrating that plasma lipids drive central inflammatory processes reflected in CSF cytokine levels [60]. The specific profile of CSF cytokine levels suggests a complex interplay between plasma lipids and central innate and adaptive immune processes. Increased CSF IL-5, IL-15, and IL-16 levels in the presence of hyperlipidemia suggest that alterations in CNS T-cell, dendritic cell, macrophage and microglial function may be taking place very early, even in otherwise cognitively normal, healthy at-risk populations [61–65].
The current study makes use of baseline lipid profiles, CSF analytes, and AD-related CSF biomarkers in cognitively normal subjects prior to any therapeutic intervention. While our cross-sectional study suggests that plasma lipids may associate with AD-related CSF biomarkers, a recent longitudinal study examining the association of blood lipids (HDL, LDL) with cognitive outputs revealed a detrimental effect of rising HDL levels in APOE ɛ4 negative subjects [66]. It would be interesting to test whether the current predictive model could be extended to a study cohort with cognitive impairment, or whether the predictive power applies to early stages of disease-related changes only. Additionally, how lipid profiles and their associations with central inflammatory profiles relate to the development of cognitive dysfunction has yet to be prospectively examined. We speculate that lipid profiles would have a more significant impact on changes in AD-related markers in the earlier stages of disease, when clinical presentation is absent or mild. We would also hypothesize that central inflammation would play a significant role in development of clinical symptoms exacerbating disease phenotypes in those with abnormal ratios of serum HDL/LDL. While our study was not powered to examine the effect of APOE ɛ4 allele status on any associations, a larger study may reveal differences in APOE phenotype with regards to the relationship of neuroinflammation, cerebrovascular pathology, and barrier function with CSF AD-related markers presented in the current study.
It is noteworthy that none of the measured CSF or plasma analytes were individually associated with levels of AD-related CSF biomarkers, total tau, p-tau, or Aβ42, in these cognitively healthy study samples. However, the present machine-learning approach integrating over 60 plasma and CSF analytes resulted in models with moderate cross-sectional predictive power for CSF total tau and p-tau (R2 = 0.35–0.36) across independent training and validation datasets (Trial 2 and Trial 1, respectively). For the models cross-sectionally predicting both CSF total tau and p-tau, the three most informative features of the first model component were CSF VCAM, IL-5, and IL-15. These findings suggest that while cerebrovascular dysfunction and central neuroinflammatory processes may develop independently, these processes may contribute parallel influences on the development of CNS pathology, particularly early in disease processes. If true, then incorporating measures of cerebrovascular dysfunction and neuroinflammation with conventionally measured CSF total tau, p-tau, and Aβ42 into routine CSF biomarker analysis could provide critical insight into the mechanisms driving early pathological processes and disease progression. Indeed this approach has been demonstrated in a recent CSF biomarker study that identified differences in total tau, ICAM, VCAM, IL-15, and total tau in Aβ42-negative subjects (non-demented and MCI subjects) and Aβ42-postitive (non-demented, MCI, and AD subjects) [67]. Interestingly, authors reported significant increases in these markers at preclinical stages (MCI, Aβ negative versus non-demented Aβ-negative) that continued with increasing disease severity. Measured levels of ICAM, VCAM, and IL-15 were associated with CSF tau and CSF concentrations of these analytes were significantly higher in Aβ-positive individuals. This suggests that markers of cerebrovascular dysfunction and central neuroinflammation may be most useful in elaborating the earliest AD-related pathological processes.
The present study demonstrates that evidence of cerebrovascular dysfunction and plasma lipid-associated central neuroinflammation is evident in two distinct cognitively intact clinical trial samples. While AD-related CSF biomarker levels were apparently normal within these study samples, combining CSF markers of cerebrovascular dysfunction and central neuroinflammation allowed CSF total tau and p-tau levels to be cross-sectionally predicted with surprising accuracy in a relatively small clinical sample. This suggests that cerebrovascular dysfunction and central neuroinflammatory processes may be exerting parallel, but synergistic influences on the earliest stages in the development and progression of AD-related pathology. Future studies should seek to replicate these findings in a larger independent cohort of otherwise healthy older individuals, and to define prospectively whether early evidence of cerebrovascular dysfunction and central neuroinflammation predicts the downstream development of AD-related Aβ and tau pathology.
Limitations of the current study include the small sample size and the singular timepoint of analysis. However, the strengths include the number of analytes measured that are known to be associated with early pathogenic processes, permitting an unbiased combinatorial approach compared to studies utilizing a single or small numbers of biomarkers. Incorporating the current multi-factorial analyte measures in longitudinal studies or perhaps across a much larger cohort of subjects that range in the spectrum of cognitively normal through MCI and AD could test the predictive power of the proposed approach. Utility to the field of biomarker research lies in the implementation of a disease-associated panel that can accurately predict those who are cognitively intact but most at risk of AD development.
Footnotes
ACKNOWLEDGMENTS
We acknowledge researchers and participants of Trial 1 and Trial 2 studies. This work was supported by the Hartford Foundation, Northwest Network Mental Illness Research, Education, and Clinical Center, the Friends of Alzheimer’s Research, and the NIH (AG033693, AG066509). D Jansson is supported by the Neurological Foundation of New Zealand. M Erickson is supported by the Joe W. & Dorothy Dorsett Brown Foundation.