
Abstract
Background:
The Montreal Cognitive Assessment (MoCA) is a standard test for screening and monitoring cognitive functions.
Objective:
This study explored the two-year changes in MoCA scores in older adults.
Methods:
Fifty-seven participants with mild cognitive impairment (MCI) and 87 participants with normal cognition completed the baseline and two-year follow-up assessments. Apart from MoCA, tests on visuospatial judgment, memory, and motor-related executive function were administered.
Results:
The results identified three MCI subgroups based on the differential changes in MoCA scores. They were the consistently low, consistently high, and low-to-high between-time performances. These heterogeneous test performances are on contrary to the significant deteriorations in executive function and finger dexterity across all subgroups. Repeated exposure to MoCA tests during the follow-up period was found to be a plausible indicator of the MCI subgroup categorization.
Conclusion:
Findings raise concerns over adopting brief clinical instrument for repeated testing, such as MoCA, for monitoring MCI conditions among older adults.
INTRODUCTION
Montreal Cognitive Assessment (MoCA) has been commonly used to identify cognitive impairment among older adults [1–3]. Evidence has been reported regarding its sound psychometric properties and usefulness in screening individuals with mild cognitive impairment (MCI), e.g., [4, 5]. The results of other studies have indicated MoCA’s moderate accuracy of differentiating MCI individuals from older adults with normal cognition (79% to 85.6%) [6–8]. Koski [9] suggested exploring the stability of MoCA scores using a longitudinal study design.
Recent review of literature has identified three longitudinal studies relating to MoCA. Cooley et al. [10] conducted a four-year prospective study on a group of older adults (n = 53), who completed MoCA and the Repeatable Battery for the Assessment of Neuropsychological Status (RBANS). The results showed that participants having a MoCA score of 26 or above had subtle and relatively small changes across the baseline (M = 27.7), 12-month (M = 26.9), and 48-month (M = 28.0) assessments. On the contrary, those who had a MoCA score below 26 showed a significant increase from the baseline (M = 23.7) during the 12-month (M = 26.3) and 48-month assessments (M = 26.3). The changes in MoCA scores in the latter group over the 48-month period were found to be inconsistent with the non-significant changes in scores on the RBANS. Krishnan et al. [11] explored the utility of MoCA in a community sample (n = 139) over a 3.5-year time period. Results showed a general decline but statistically non-significant changes in both the normal cognitive (M = 26.3 (time 1); M = 25.6 (time 2)) and MCI group (M = 23.3 (time 1); M = 21.5 (time 2)). Krishnan et al. [11] explained that the overall decline of the MoCA scores in both groups reflected degeneration of cognitive ability due to aging. The relatively stable decline trend in both groups were likely accounted for by the lower frequency of exposure and hence, minor practice effect on the MoCA. Iyer et al. [12] studied changes in cognitive ability in female older adults (n = 106), who received medication to treat overactive bladder syndrome over a time period of one year. Their results were different from those reported by Cooley et al. [10] and Krishnan et al. [11]. They found that both the medicated and control groups showed a significant increase in MoCA scores across the one-year period. The increase in MoCA scores was only found to be significantly associated with the scores at baseline. Iyer et al. [12] speculated that the greater increase in scores among those having a higher MoCA score at baseline would have been due to their better ability of learning and assessment retention than those with a lower MoCA score at baseline. The inconsistency across the results of these three studies motivated us to gain a better understanding of how individuals’ age and their test practice would influence the validity of MoCA scores across time. The research questions are, firstly, how older adults would yield different trends of change in MoCA scores; and secondly, how the practice effects would contribute to such trends of change.
Practice effect is defined as performance-gain after the first attempt of a test due to the learning of test content or test-taking process [13]. It is an issue of validity of test results. Previous studies reported systematic improvements in test performance due to practice effects, which impacted the repeatability, sensitivity, and integrity of the instrument [14]. Despite the fact that practice effect was found to diminish with time [15], different studies indicated that these effects could last a few years, particularly in tests or items involving delayed recall-memory abilities due to the following factors: higher level of education [16], younger age [17], female gender [18], and the interaction of age and gender [19]. Factors contributing to practice effects are novelty of the test process [20] and test environment [21], participants’ personal traits such as younger age, higher level of education [22], higher level of self-efficacy [23], and clinical condition [24]. Hayden et al. [25] grouped these personal factors as “test-wiseness”, which is defined as familiarity with, recognition of, shift in strategy of, the test materials and procedures. This study was aimed to investigate factors contributing to changes in MoCA scores among older adults. We used a two-year test-retest design tracking the changes in the performance of a group of MCI participants. It was hypothesized that participants in the MCI group would show heterogeneous trends of change in MoCA scores between the baseline and follow-up assessments. Personal factors of the participants, such as age, education and possibly practice effects, would strongly account for the heterogeneous trends of changes in MoCA scores, rather than the degeneration of cognitive abilities.
MATERIALS AND METHODS
Participants
Invitations were initially sent to the older adult members of the Institute of Active Aging (IAA) at The Hong Kong Polytechnic University. Two hundred and sixty older adults volunteered to be screened for participating in the study. The majority of them were members of the IAA, while others were community-dwelling older adults recruited through words of mouth or personal networks of the IAA members. Those with a self-reported history of cognitive impairments and depressive mood were excluded from the study. Among them, 209 participants reported normal or corrected-to-normal visual and auditory functions. The participants took part in a structured interview in which the Hong Kong version Montreal Cognitive Assessment (MoCA-HK) [25, 26] was administered. The instrument used for classifying participants into MCI and normal cognitive groups (NC) respectively. The criteria of being classified as a member of the MCI group were: 1) a MoCA score of 26 or below [10, 27]; 2) self-reported independence in daily living activities; and 3) self-reported cognitive decline [3, 28–30]. A total of 81 participants that fulfilled the criteria were classified according to the baseline MoCA scores as the MCI group, with a mean age of 66.0 years (SD = 4.1); while 128 participants were classified as the NC group, with a mean age 64.3 years (SD = 3.5). The average years of education were 10.8 (SD = 3.5) and 14.1 (SD = 3.9) for the MCI and NC groups respectively (Table 1). All of them completed Time 1 testing between 2017 and 2018 (see below). The effect sizes taken to compute the sample size for this study was based on those reported in Krishnan et al. [11] for three-year prospective changes in MoCA scores among the MCI (d = 0.6) and cognitively intact groups (d = 0.3). With an α= 0.05 and power to 0.95, the projected sample size was 52 for each of the MCI and NC group.
Demographics characteristics of the NC and MCI groups in the Time 1 and Time 2 assessment occasions
NC, normal cognition; MCI, mild cognitive impairment.
The participants were invited to complete Time 2 testing after two years in 2020. Among the original 209 participants, the research team managed to contact 144 participants, who agreed to participate in the second round of testing. The final sample size of the MCI group according to the baseline MoCA scores was 57, with a mean age of 66.1 years (SD = 3.4), while the NC group was 87, with a mean age of 67.5 (SD = 3.8); and male/female ratios: 28/58 (NC) and 20/36 (MCI). The average years of education were 11.2 (SD = 3.5) and 14.4 (SD = 4.1) for the MCI and NC groups. Their demographics characteristics are comparable to those of the participants involved in another study conducted in mainland China: mean age: 67.6 (NC) and 68.4 (MCI); years of education: 12.2 (NC) 11.8 (MCI); and male/female ratios: 87/99 (NC) and 58/63 (MCI) [31]. A Follow-up telephone interview was conducted within eight weeks after Time 2 testing. Only 91 out of the 144 participants were contacted with success. The data gathered from the telephone interview was from 48 MCI participants and 43 NC participants (Fig. 1).
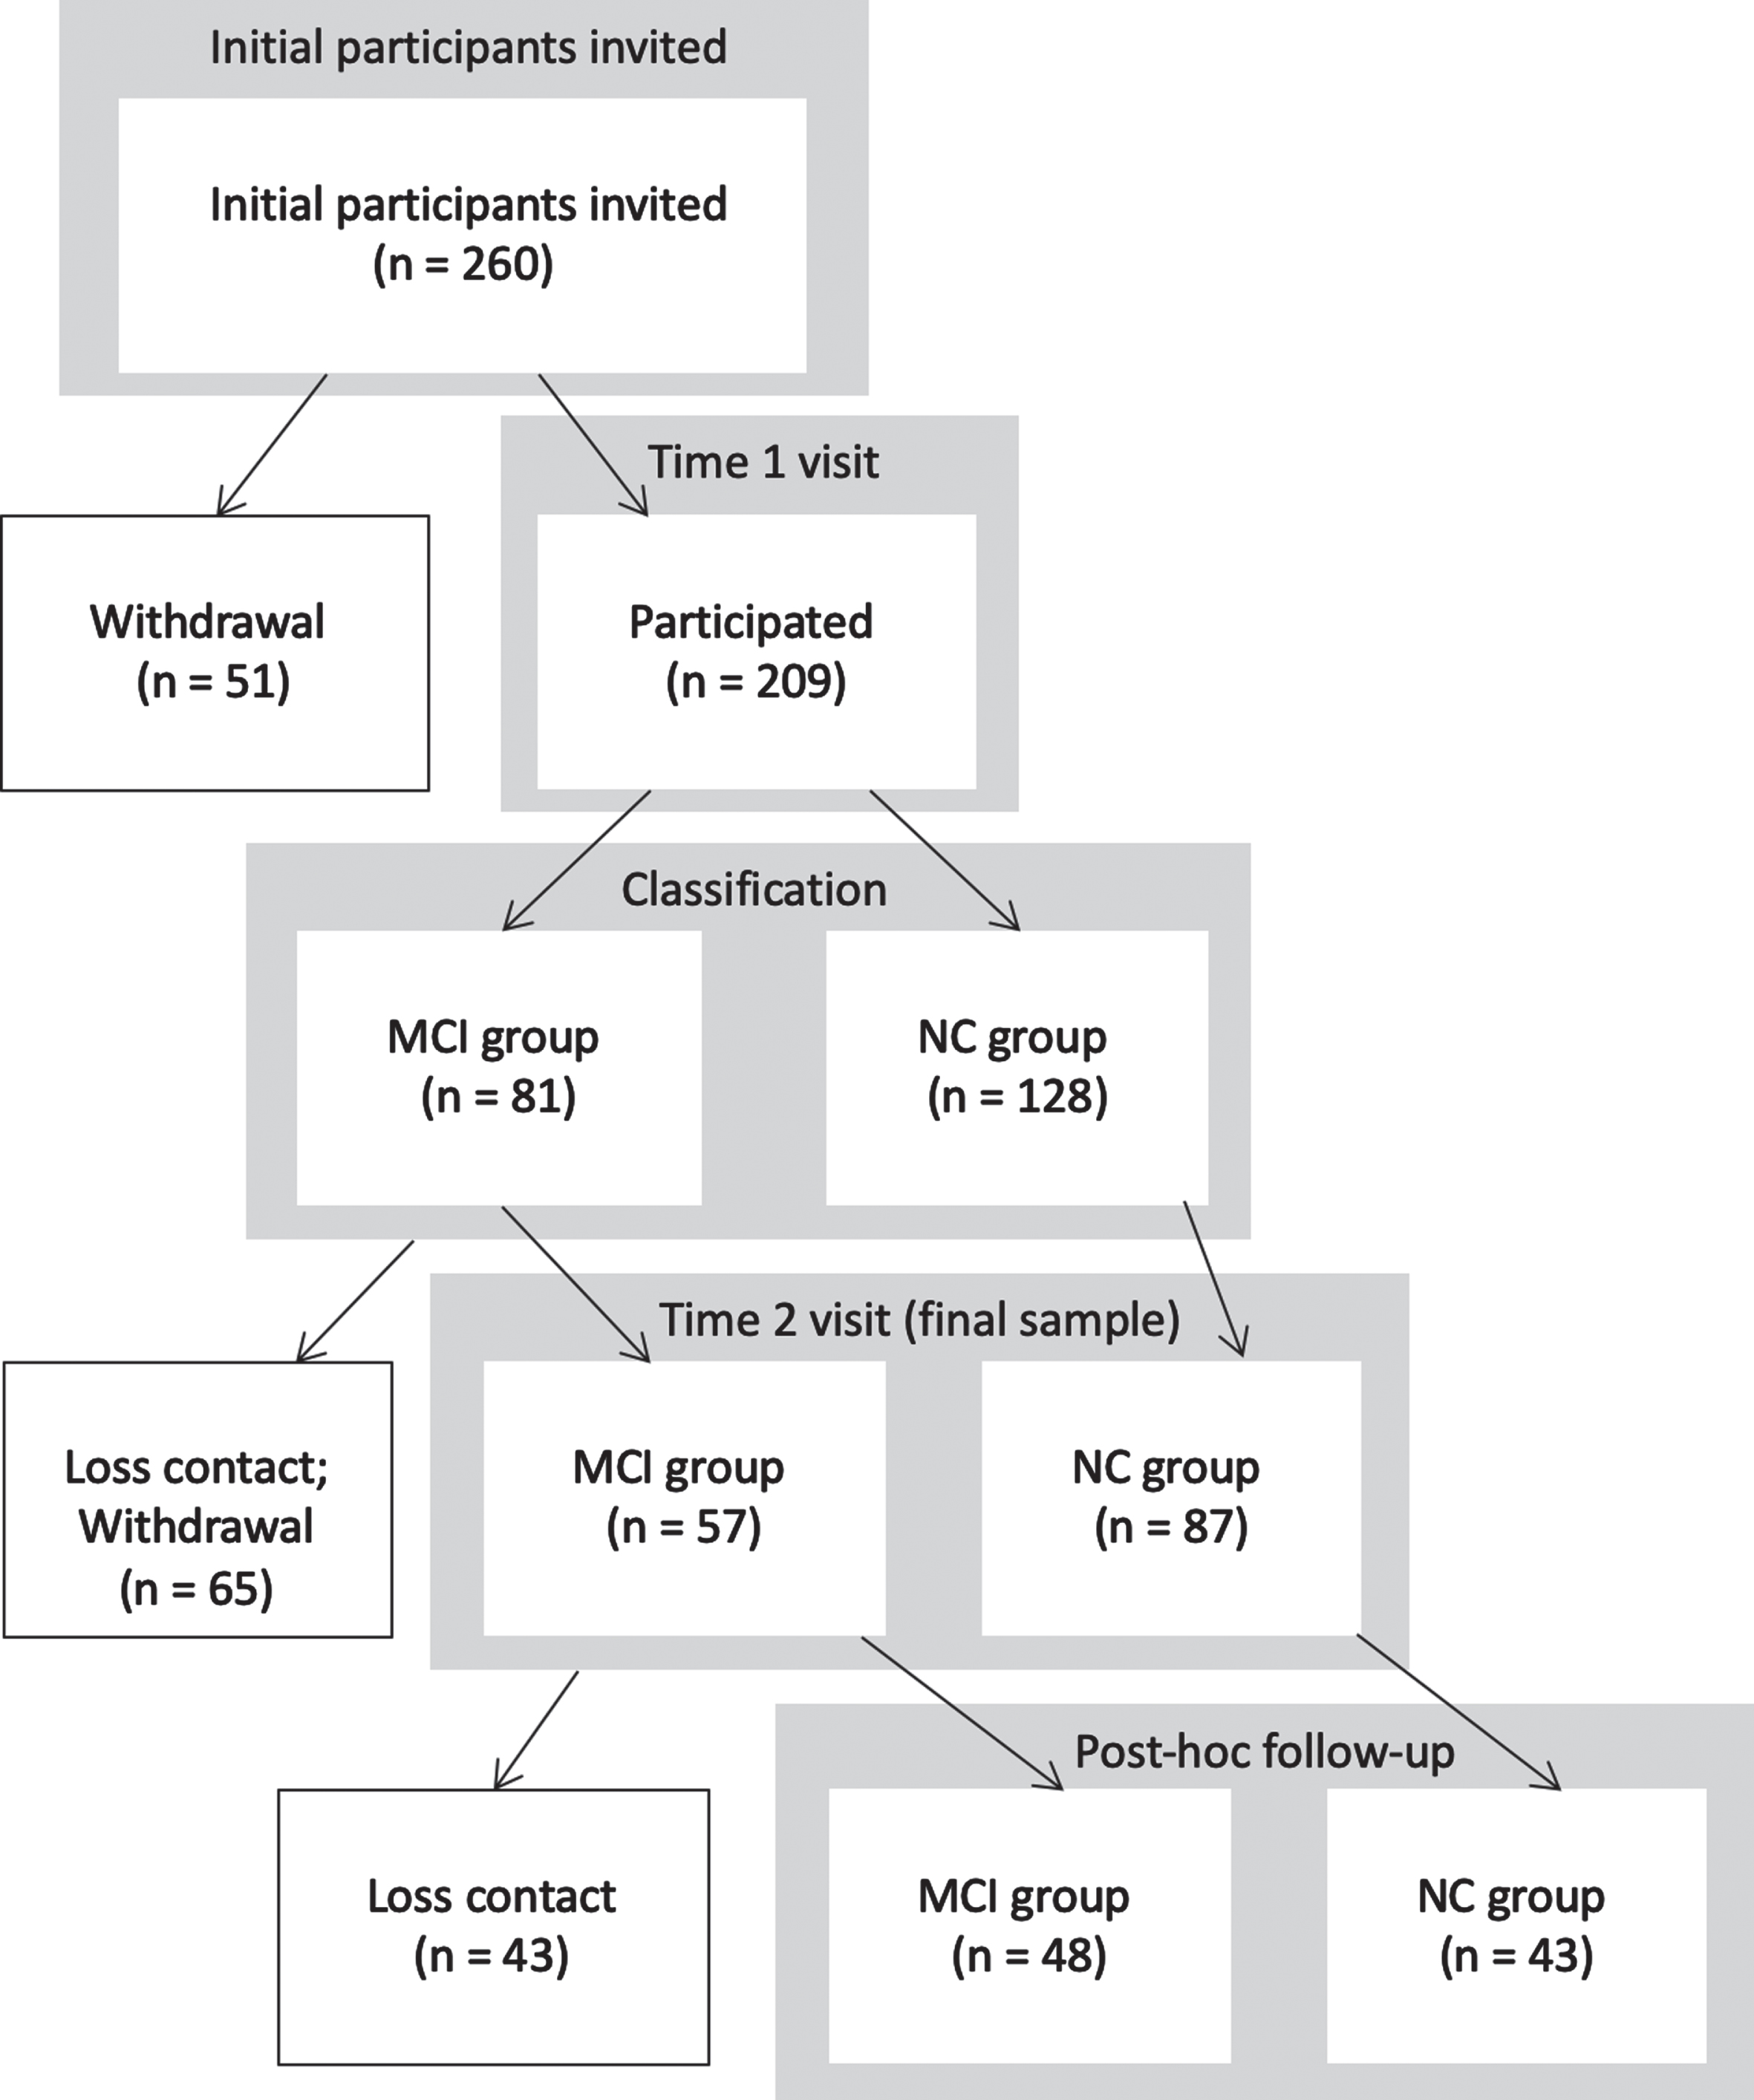
Flowchart Illustrating the Number of Participants at Each Stage (Time 1, Time 2, and Post-hoc). NC, normal cognition; MCI, mild cognitive impairment. Figure demonstrated the number of participants and the number of loss contact, withdrawal at each stage.
Ethics approval of this study was granted by the Human Subjects Ethics Sub-committee (HSESC) of the institution where the study was conducted. All procedures complied with the guidelines and protocols stipulated by the HSESC.
Procedure
During Time 1 testing, participants completed a semi-structured interview conducted by the researcher in order to gather information on their demographic characteristics. Other than the Chinese version of MoCA and other instruments for screening, the participants completed three other clinical instruments: Judgement of Line Orientation (JLO), the Chinese version of Rivermead Behavioural Test-Third Edition (RBMT-3), and the nine-hole pegboard test respectively. All tests were administered in a quiet room. Participants were offered rest periods in case they expressed fatigue or tiredness throughout the assessment session.
The participants were contacted after two years for completing Time 2 testing without any intervention administered. The same test administration procedures were followed for the MoCA, JLO, RBMT-3, and the nine-hole pegboard test. Contrary to Time 1 testing, participants took part in a follow-up semi-structured telephone interview two months after they completed Time 2 testing. The reason for the time-gap before making the follow-up telephone calls was to gather additional information regarding the observed discrepancies in scores between MoCA and other clinical instruments in Time 2 testing. The participants were asked to respond to two short dichotomous questions (Yes/No) related to their experience in taking MoCA and other potential factors that might have influenced testing results. They were: (1) “In the past two years, were you exposed to testing with MoCA other than the two times in this study? If yes, how many times do you think you were exposed to the MoCA?”; and (2) “Do you think the repeated exposure to MoCA testing aforementioned influenced your performance in the tests you took last time?”
Clinical measures
There were six measures used in this study, with three of them as screening criteria identifying participants with MCI and three as benchmark measures of the MoCA. The Chinese version MoCA was adopted. The cutoff score was adopted from studies by Cooley et al. [10] and Narazaki et al. [27] in light of the education level of the participants being high. The seven-item Katz Activities of Daily Living (ADL) scale [32] was used in the participants’ self-report on independence in daily-living indicated by dichotomous responses (Yes/No). The Chinese Memory Symptoms Scale (CMSS) with five items was used to gather information on the participants’ self-report regarding cognitive decline by rating “Yes” or “No” [33]. The adopted cutoff score of three or above had a sensitivity of 54.6% and a specificity of 57.4% in detecting a high risk of clinical cognitive deterioration. The other three measures were used to assess specific cognitive and motor abilities of the participants. The Chinese version of RBMT-3 developed by Fong et al. [34] was used by way of immediate and delayed recall of a story (a maximum score of 21×2) and by delayed recall of names (a maximum score of 8). The JLO measures a participant’s visuospatial ability by requiring the matching of two angled lines to a set of 11 lines in a semicircle 18 degrees apart [35]. A total of 30 items were presented without examiners’ feedback, and participants were asked to match the two line segments to a set of multiple choice response card. The nine-hole pegboard test measures a participant’s finger dexterity on his or her dominant hand. In this regard, performance is measured in terms of time used for completion [36]. The test was administered by asking the participants to place the pegs one by one into the holes on the board, followed by removing them one by one.
Statistical analysis
Repeated measure MANCOVA (RM-MANCOVA) was carried out testing the Time and Group effects on scores of the MoCA, JLO, RBMT-naming, RBMT-story immediate recall and RBMT-story delayed recall, and nine-hole pegboard test. The two Time factors were the baseline and Year 2 follow up assessments, and the two Group factors were the NC or MCI. Previous study suggested adjustment of MoCA’s total score such as adding one point for participants with 12 years of education or less [27]. However, recent study by Krishnan et al. concluded that actual score adjustment would adversely affect the reliability of MoCA [11]. In view of this, the participants’ age and year of education effects on the Time and Group factors were tested by including both variables as covariates of the RM-MANCOVA model [11]. Hierarchical cluster analysis (HCA) was conducted to assess whether there were subgroup classifications with respect to the differences in the MoCA score within a group. For HCA, similarity among cases was computed by square Euclidean distance and centroid clustering was used as the procedure for agglomeration. Discriminant function analysis was also conducted to further examine the validity of the clustering. Subgroup memberships were identified according to the stability of the scores across the two points in time. The same RM-MANCOVA was conducted at the subgroup level. Responses from participants with MCI of the two semi-structured interview items were collated. Discriminant analysis was used to test whether the responses to the two interview items would be indicative of the memberships of two subgroups, namely the low-to-high and consistently-low. All analyses used SPSS 25.0 [37] and statistical significance was set at p = 0.05.
RESULTS
Differences between Time 1 and 2 testing
Participants in the MCI group showed significant differences in scores of MoCA, RBMT-Naming, RBMT-story delayed recall, and nine-hole pegboard test comparing the data obtained from Time 1 and 2 testing, while those in the NC group only showed significant differences in scores of RBMT sub-scales (Table 2). Two-way RM-MANCOVA indicated significant Group (F(6, 125) = 26.76, p < 0.001; Wilks’ λ= 0.44,
Summary of Results of Participants’ Performance in Various Clinical Tests between Time 1 and Time 2
Mean and standard deviations (value in the bracket) represented. NC, normal cognition; MCI, mild cognitive impairment; MoCA, Montreal Cognitive Assessment; JLO, Judgement of Line Orientation; RBMT-Naming, Rivermead Behavioural Memory Test – Naming; RBMT-SI, Rivermead Behavioural Memory Test – story immediate recall; RBMT-SD, Rivermead Behavioural Memory Test – story delayed recall; Pegboard, Nine-hole pegboard test.
Repeated Measure MANCOVA Results of Comparing Performances in Clinical Tests between NC and MCI Group across Time 1 and Time 2
MoCA, Montreal Cognitive Assessment; JLO, Judgement of Line Orientation; RBMT-Naming, Rivermead Behavioural Memory Test – Naming; RBMT-SI, Rivermead Behavioural Memory Test – story immediate recall; RBMT-SD, Rivermead Behavioural Memory Test – story delayed recall; Pegboard, Nine-hole pegboard test. *p < 0.05, **p < 0.01, ***p < 0.001.
There were significant differences in the Time 1 and 2 scores in the MoCA, RBMT-naming, RMBT-story delayed recall and nine-hole pegboard test among the MCI group. A significant increase was found in the mean total score of MoCA (t(56) = –8.12, p < 0.001, d = 1.3) from Time 1 (M = 24.2, SD = 1.5) to Time 2 (M = 26.9, SD = 2.6). Adopting the same MoCA cut-off score, 39 participants changed its status from Time 1 MCI to Time 2 NC (MoCA score from M = 24.5, SD = 1.53 to M = 28.4, SD = 1.18); which compared with 8 participants changed from Time 1 NC (MoCA scores: M = 27.8, SD = 0.89 to M = 25.4, SD = 0.52). A similar significant increase was observed in the score in RBMT-naming (t(55) = –5.31, p < 0.001) from Time 1 (M = 4.9, SD = 2.6) to Time 2 (M = 6.7, SD = 1.3); and the same increase pattern was observed in the scores of RBMT-story delayed recall (t(55) = –2.11, p = 0.04) from Time 1 (M = 5.8, SD = 3.1) to Time 2 (M = 6.9, SD = 3.6). In contrast, the score in the nine-hole pegboard test showed a significant decrease (t(51) = –7.00, p < 0.001) from Time 1 (M = 20.3, SD = 2.9) to Time 2 (M = 24.5, SD = 4.1) in the MCI group. These results were rather different from those of the NC group, which showed non-significant changes in the MoCA score across the two times (t(86) = –1.72, p = 0.09, d = 0.2) (Time 1: M = 28.4, SD = 1.1; Time 2: M = 28.7, SD = 1.4). However, the NC group showed a significant increase in scores in RBMT-naming (t(85) = –6.05, p < 0.001), RBMT-story immediate recall (t(86) = –3.16, p = 0.002), and RBMT- story delayed recall (t(85) = –3.53, p < 0.001). No significant time-elapsed differences in scores were observed in other clinical instruments for both groups.
Heterogeneous changes in MoCA scores in MCI participants
There were two participant clusters identified from the results of HCA in the MCI participants’ MoCA scores in the two assessment occasions (Table 3). For Time 1, the first and second cluster included 29 (50.9%) and 28 (49.1%) participants respectively; and for Time 2, they were 39 (68.4%) and 14 (31.6%) participants respectively. The two-cluster solution was supported by discriminant function analysis for the Time 1 (Wilks’ λ= 0.27, χ2 = 70.7, p < 0.001) and Time 2 results (Wilks’ λ= 0.26, χ2 = 157.0, p < 0.001). Independent sample t test showed significant subgroup differences in the Time 1 MoCA scores (t(56) = 12.10, p < 0.001) (higher subgroup: M = 25.5; SD = 0.5; and lower subgroup: M = 22.9, SD = 1.0) and the Time 2 MoCA scores (t(56) = 12.53, p < 0.001) (higher subgroup: M = 28.4, SD = 1.2; and lower: M = 23.7, SD = 1.6).
Based on the subgroups the MCI participants belonged to in Time 1, cross-tabulation was used to test whether the trends of change were consistent between the higher and the lower subgroups across the time (Table 4). Results showed significant changes in the subgroup memberships between the two times (χ2 (1, n = 57) = 8.6, p = 0.003). Among the 29 participants that belonged to the Time 1-higher subgroup, 25 (86.2%) of them consistently remained in the Time 2-higher subgroup, with the mean MoCA score increasing from 25.5 to 28.5. Among the 28 participants that belonged to the Time 1-lower subgroup, 14 (50%) participants were found to have consistently remained in the Time 2-lower subgroup, with a slight increase in mean MoCA scores from 22.9 to 23.7. There were 18 MCI participants that belonged to different subgroups over the two times of assessment: 14 of them shifted from the Time 1-lower to the Time 2-higher subgroup, with the mean MoCA score increasing from 22.8 to 28.1. This is compared with where only four shifted from Time 1-higher to Time 2-lower subgroup, with mean MoCA scores decreasing from 25.3 to 23.5. According to these results, we further classified the MCI participants into the consistently-high MoCA subgroup, in which participants obtained relatively high MoCA scores between the Time 1 and Time 2 assessments; the consistently-low MoCA subgroup, in which the participants obtained relatively low MoCA scores between the two assessments; and the low-to-high subgroup, in which the participants obtained relatively low MoCA scores in Time 1, but shifted to obtaining relatively high MoCA scores in Time 2. The fourth subgroup is the high-to-low subgroup, in which the participants obtained relatively high MoCA scores in Time 1 but obtained relatively low MoCA scores in Time 2. The fourth subgroup (i.e., declined MoCA) was not included in further analyses because of its small sample size.
Sample Distribution of Time 1 Clusters * Time 2 Clusters among MCI Participants
In the MCI group, memberships were generated according to their MoCA total score. Among the 29 participants in the higher subgroup (Time 1), 25 of them remained in the higher subgroup at Time 2 whereas the remaining 4 participants migrated to lower subgroup (deterioration). Among the 28 participants in the lower subgroup (Time 1), 14 of them remained in the lower subgroup at Time 2 whereas the remaining 14 participants migrated to higher subgroup (improvement). **p < 0.01.
The participant clustering results of the NC group were rather different from those of the MCI group. The two-cluster solution was not significant in Time 1 but significant in Time 2. Cross-tabulation showed no significant changes in the subgroup memberships from Time 1 to Time 2 (x2 (1, n = 87) = 3.2, p = 0.07). There were 21 participants in the NC group that changed subgroups between the two times of testing. 17 of them were categorized as having a low-to-high profile, with the mean MoCA score increasing from 27.0 to 28.5. Only four participants were categorized as having a high-to-low profile, with the mean MoCA score decreasing from 28.5 to 25.3.
Possible factors influencing changes in MoCA scores in MCI subgroups
The scores in RBMT, JLO, and the nine-hole pegboard test of participants in the consistently-high, consistently-low, and low-to-high MCI subgroups were compared with RM-MANOVA (Table 5 and Fig. 2). No significant between-group differences were revealed in their age (F(2,47) = 0.35, p = 0.71) and years of education (F(2,47) = 1.42, p = 0.25). The results indicated significant Subgroup (F(4, 90) = 14.00, p < 0.001; Wilks’ λ= 0.38,
Summary of Participants’ Performances in the Clinical Tests among the Consistently-high, Consistently-low and Low-to-high Subgroups
Mean and standard deviations (value in the bracket) represented. MoCA, Montreal Cognitive Assessment; JLO, Judgement of Line Orientation; RBMT-Naming, Rivermead Behavioural Memory Test – Naming; RBMT-SI, Rivermead Behavioural Memory Test – story immediate recall; RBMT-SD, Rivermead Behavioural Memory Test – story delayed recall; Pegboard, Nine-hole pegboard test. aSignificance between low-to-high subgroup and consistently-high subgroup. bSignificance between low-to-high subgroup and consistently-low subgroup. cSignificance between consistently-high subgroup and consistently-low subgroup.
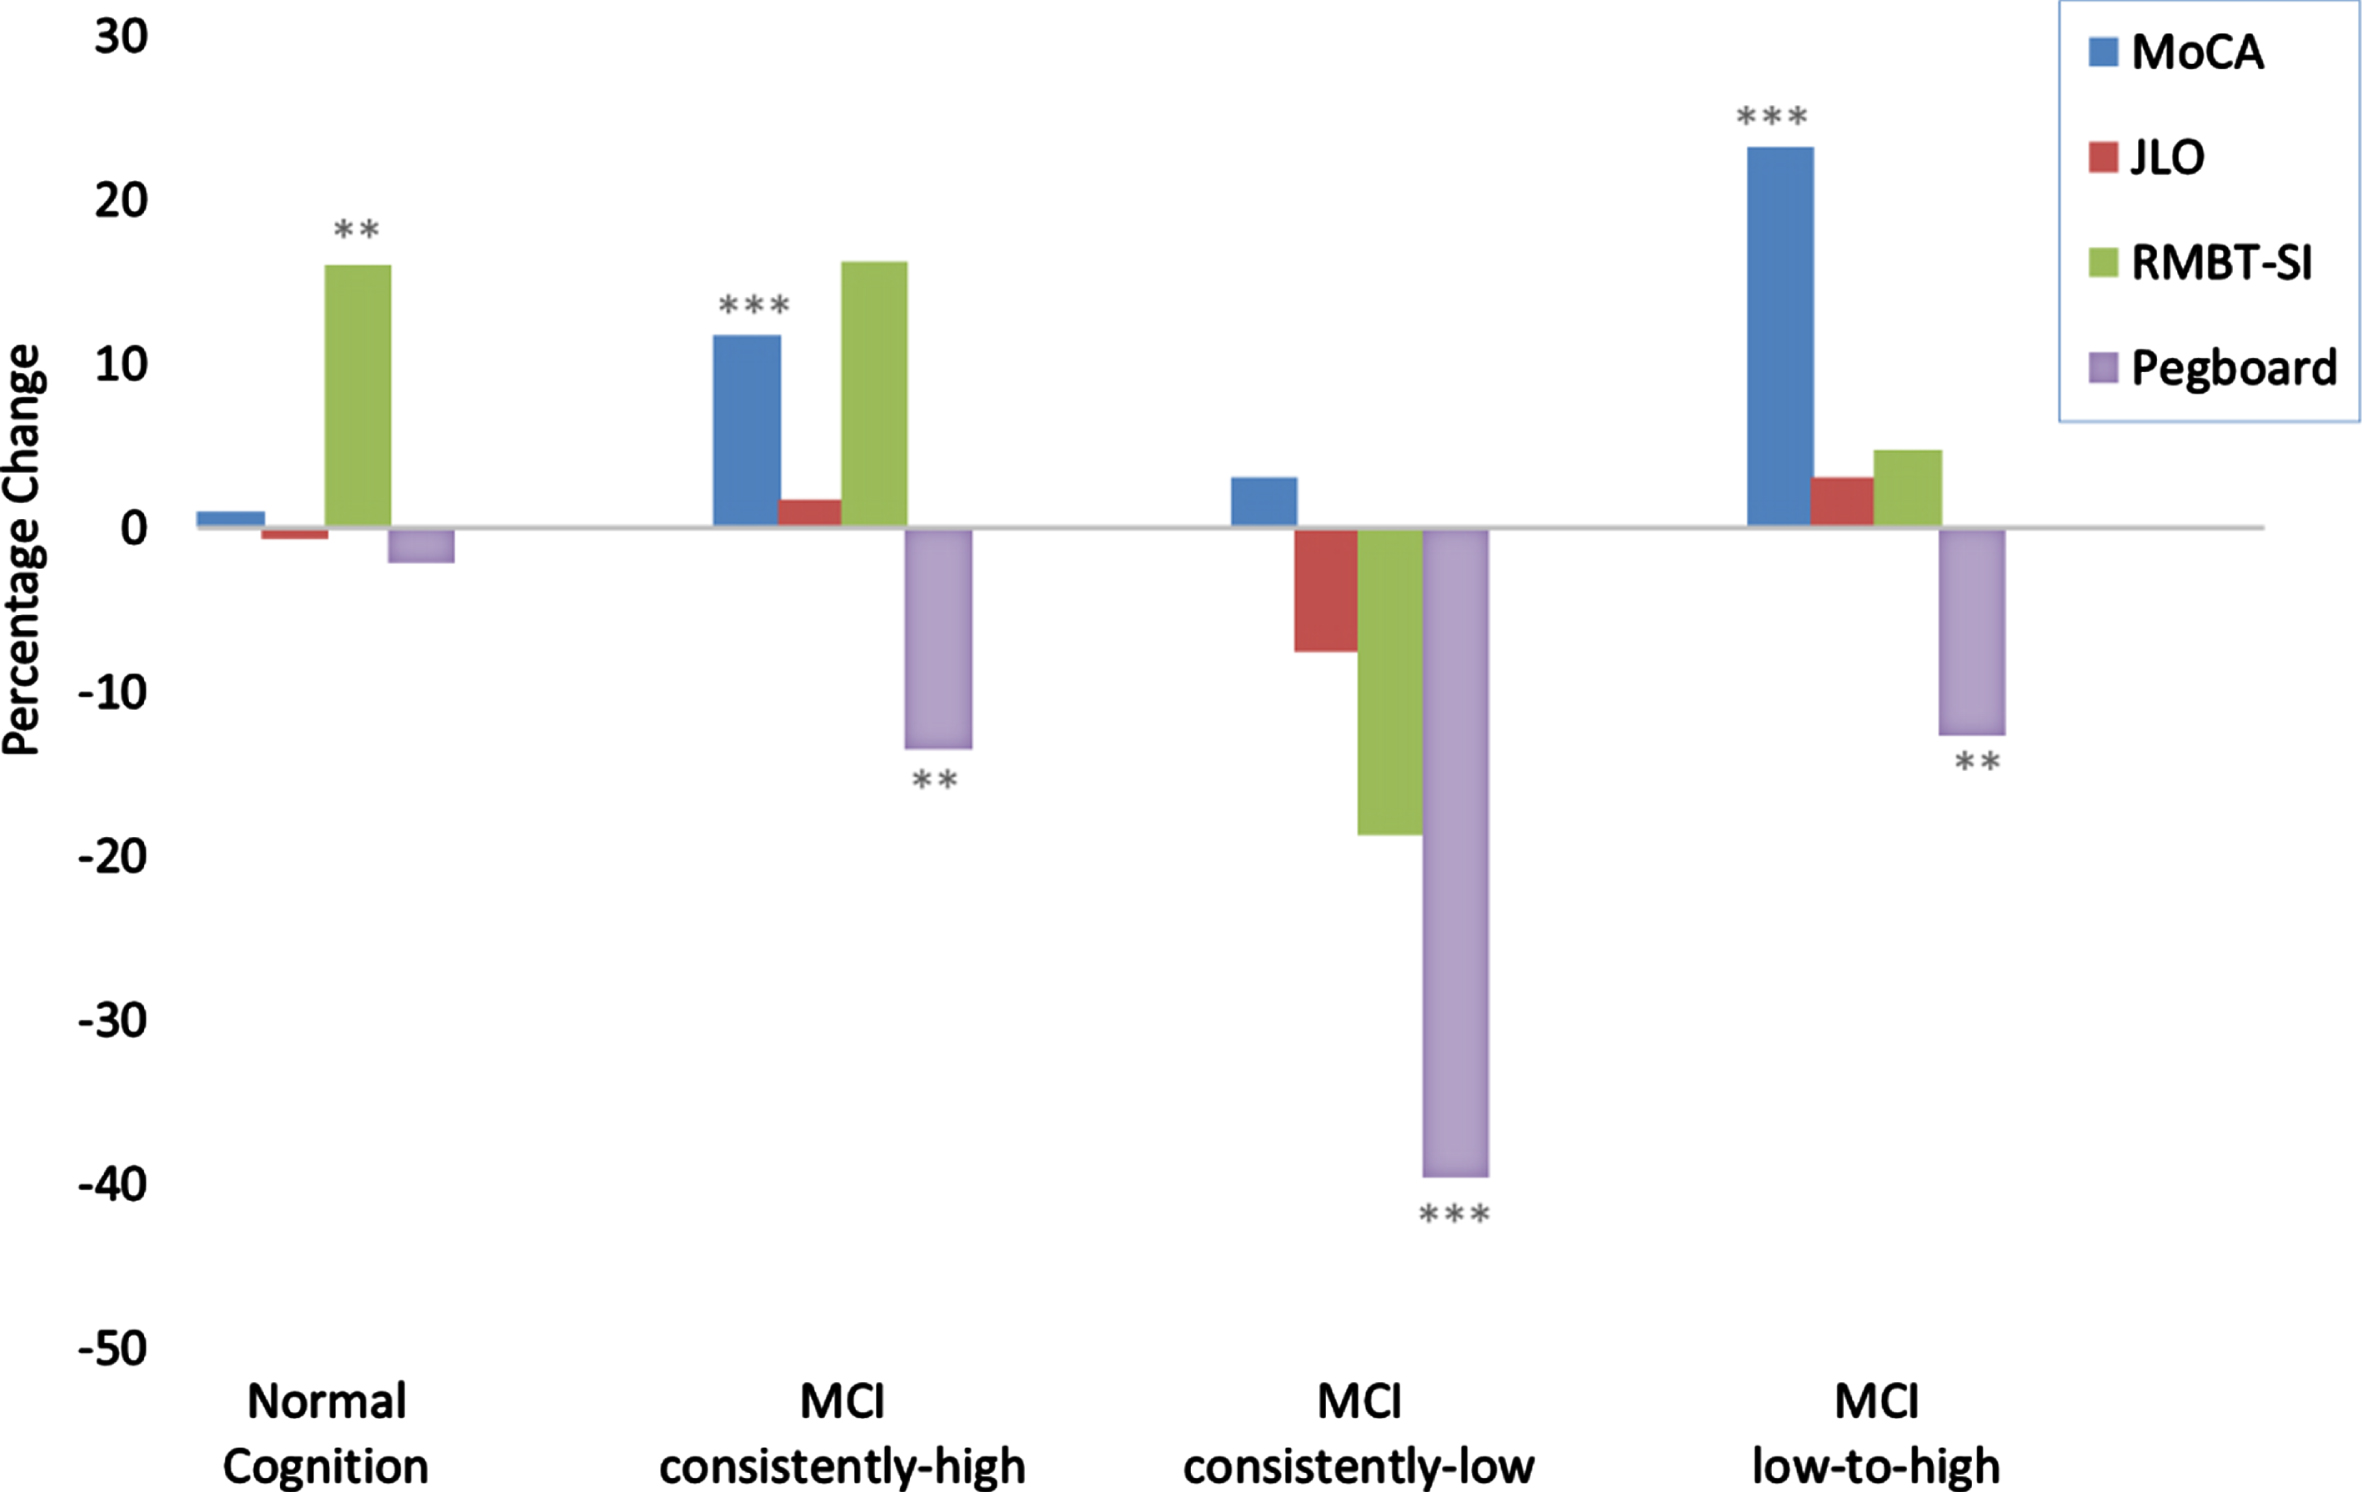
Percentage Change in Cognitive Performance between the Two Times in NC and MCI Subgroups. MCI, mild cognitive impairment; MoCA, Montreal Cognitive Assessment; JLO, Judgment of Line Orientation; RBMT-SI, Rivermead Behavioural Memory Test – story immediate recall; Pegboard, Nine-hole pegboard test. Percentage changes in cognitive assessments between NC, MCI consistently-high, consistently-low, and low-to-high subgroups – negative values indicate declines in function, while positive values indicate improvements in function. **p < 0.01, ***p < 0.001.
The summary of the participants’ responses (n = 49) to the two interview items which tap possible practice effects of the MoCA test is presented in Table 6. For the first item of “other exposures to MoCA test”, the low-to-high subgroup (57.1%) had a much higher proportion participants responding “Yes” than the consistently-low subgroup (21.4%). Similarly, the low-to-high subgroup had a higher proportion of participants (57.1%) responding “Yes” to “perceived practice effects on MoCA test” than the consistently-low subgroup (35.7%). The responses of participants in the consistently-high subgroup were in between the other two subgroups. To test whether the responses to these two items can differentiate the low-to-high and consistently-high memberships, discriminative analysis was conducted among the participants in these two subgroups (n = 24). Despite not reaching a statistical significance (Wilks λ= 0.83, χ2 (2) = 4.08, p = 0.13), which perhaps would have due to the small sample sizes, the discriminative model is:
D = 0.93 * [Exposure to MoCA] + 0.13 * [Perceived Practice Effects on MoCA]
Summary of Participants’ “Yes” Responses on the Two MoCA Repeated Exposure Items
NC, normal cognition; MCI, mild cognitive impairment. Number of participants and percentages are for the positive responses on each follow-up items.
The standardized canonical discriminant function coefficients of the above equation suggest that the “exposure” appeared to exert a stronger influence than the “perceived practice effect” for differentiating the memberships. The accuracy of the membership was 66.7% and 75% for the low-to-high and consistently-low subgroups respectively.
DISCUSSION
The present study was aimed to investigate the stability of MoCA scores over a time period of two years among a group of MCI participants. New findings were discovered in terms of the heterogeneity of the changes in the participants’ scores over time, particularly distinctive subgroup profiles namely consistently-high, consistently-low, and low-to-high. The consistently-low subgroup showed stable and low MoCA scores. This is consistent with cognitive deterioration, particularly highlighted by the significantly less satisfactory performance in finger dexterity assessments. On the contrary, the low-to-high subgroup showed a substantial increase in MoCA scores. However, the positive change in the MoCA scores in this subgroup was found to contradict with the significant deterioration in finger dexterity among the participants in the low-to-high subgroup. Our analyses further suggested the possibility that the observed positive changes in the low-to-high subgroup could have been attributed to the participants’ exposures to the MoCA test or other brief cognitive tests between the Time 1 and Time 2 assessments conducted in this study. The consistently-high subgroup shared a similar cognitive profile with that of the low-to-high subgroup, except the more modest increase in MoCA scores. Our argument is further supported by the non-significant changes in other cognitive measures and significant deterioration in finger dexterity. The practice effects of MoCA can be prominent, because it has relatively fewer items when compared with other cognitive instruments and is commonly used in clinical and non-clinical settings, where the exposure cannot be easily controlled. Our findings raise concerns in relation to using brief cognitive tests to conduct repeated assessment for older adults, particularly individuals with conditions edging towards MCI.
Heterogeneous changes of cognitive profile in MCI participants
The rebound of cognitive function among MCI participants has been reported in two longitudinal studies [38, 39]. Both studies revealed that participants that performed better in cognitive testing at baseline were more likely to show significant improvement during follow-up assessments. The MCI participants’ cognitive profiles in Han et al. and Koepsell and Monsell’s studies are comparable to those of the consistently-high subgroup in the present study. Iyer et al. [12] attributed the cognitive rebound phenomenon to better learning ability.
The findings of this study are contrary to those reported by Krishnan et al. [11], in which they did not observe heterogeneity in the changes of the participants’ MoCA scores over one year. Its participants’ MoCA profiles are found to be comparable to those of the consistently-low subgroups in the present study. Of note, Krishnan et al.’s study had a duration of one year, contrary to the two-year duration of our study. Both groups of participants had comparable baseline MoCA scores at around 23 and did not show significant changes across the two assessment occasions. A comparison of the within-group variability in the MoCA scores between the two studies indicates significant differences in the group variances for both the baseline (F = 8.4, p < 0.001) and follow-up assessments (F = 3.3, p = 0.02). These discrepancies suggest plausible within-group heterogeneity among the participants in Krishnan et al.’s study, particularly in the follow-up assessment. In their study, 42% of participants showed deterioration in cognitive ability, while of 49% remained stable, and 9% making progress. The differences in the break-down data further support our observation of possible within-group heterogeneity among the MCI participants. Cooley et al. [10] addressed the potential within-group heterogeneity by using a baseline MoCA score of 26 as a cutoff, classifying MCI participants into high- and low-scoring subgroups. According to the profiles reported by Cooley et al., its high-scoring subgroup corresponds to the consistently-high subgroup in this study. In contrast, its low-scoring subgroup corresponds to the low-to-high subgroup in this study. It is noteworthy that despite the baseline of the first year, and the first to fourth year differences, all the across-time changes of the MoCA scores reported by Cooley et al. were not statistically significant. Cooley et al. explained that the non-significant changes in MoCA results were consistent with the non-significant changes in scores of RBANS, an assessment of overall neuropsychological function, which was concurrently completed by the participants. These results are contrary to the significant increases in MoCA scores revealed in this study’s two subgroups. The increase in the MoCA scores of the participants of this study contradicts the considerable decline in their performance in the nine-hole pegboard test. The nine-hole pegboard test is a measure of psychomotor efficiency [40] involving finger dexterity, visual attention, and executive function [41]. Other studies revealed the association of poorer performance in the nine-hold pegboard test with cognitive [42] and self-care dysfunction in patients with AD or MCI [43]. The opposing results of the MoCA and the nine-hole pegboard test in this study further prompt the possibility of practice effects present during the retest occasions that the participants took part in.
Practice effects on MoCA
Practice effects have been discussed with regards to the repeated use of MoCA. Concerns regarding the small number of test items have been raised in relation to the instability and validity for non-clinical sample [10, 44]. Due to task-specific factors, such as conceptualizing problem-solving strategies and the range of item difficulty, practice effects are noticeable, particularly in visual memory, working memory, executive functioning, and attention [15]. Those are the major components of MoCA. This would also account for the practice effects, which is distinctive in a brief measure when compared with a comprehensive one [45]. Repeated use of brief cognitive measures other than MoCA, such as Mini-Mental State Examination [46], CogState [47] and Memory Impairment Screen [48] are also prone to inducing practice effects. This further supports our concerns on practice effects resulting in the instability of MoCA following repeated exposure.
It is highly plausible that the widespread use of MoCA in both clinical and non-clinical settings results in practice effects. Test-wiseness or previous experience of cognitive assessment, such as Trail Making Test, have been associated with better performance and decreased sensitivity [25] to testing. The different trends revealed in this study for the consistently-low and low-to-high subgroups in participants’ responses to the item “other exposures to MoCA test” suggests plausible test-wiseness. This speculation lends insight into the extent test-wiseness may influence the stability of repeated-measure MoCA among MCI participants.
Personal factors, such as age and education, would also contribute to practice effects accumulated by repeated cognitive assessments [11, 22]. However, the present study targeted older adults and also the range of years of education was small. These two factors limited the understanding on their manifestation in the different patterns of changes in cognitive profiles over time.
Limitations
Several limitations of the study should be considered. The study design was not pre-specified to target practice effects. Since the feedback of MoCA and post-hoc data is subject to test outcome, experience of and exposure to MoCA were solicited by adopting a brief telephone interview. It is difficult to verify the authenticity of the participants responses via the phone. Attributes of ‘authenticity’ are namely the content of experience or extent of exposure to MoCA, both of which cannot be acquired in detail, nor with precision. The relatively small sample sizes at the subgroup level would have lowered the power of the analyses. The homogeneity of the older adult sample would limit the generalization of the findings.
Clinical implication
To better understand the stability of cognitive assessment, practice effects or test-wiseness should be taken into measure during research design. Since the development of alternative forms of various cognitive assessments, there have been mixed findings in relation to eliminating practice effects [49, 50]. As such, further study investigating practice effects and the stability of changes in MoCA scores due to repeated cognitive assessments is needed. To help generalize the results to the overall aging population, it is necessary to understand the extent that age and education contribute to practice effects in repeated cognitive assessments. Participants with higher education levels were predominant in this study. At the same time, age also restricted detection of deficits of MoCA [51]. It is also worthwhile to study the cost effectiveness of employing comprehensive cognitive tests versus brief cognitive screening tests such as MoCA to identify community dwelling older adults with mild cognitive impairment.
Footnotes
ACKNOWLEDGMENTS
This study was supported by the Peter T. C. Lee endowment fund awarded to CCH Chan and the internal research fund of the Institute in Active Ageing of The Hong Kong Polytechnic University. The authors thank all the members and staff of the Institute of Active Ageing for participating in the study.