
Abstract
Background:
Cerebrospinal fluid (CSF) soluble triggering receptor expressed on myeloid cells 2 (sTREM2) is considered a biomarker of microglial activation. The relationships between CSF sTREM2 levels and Alzheimer’s disease (AD) CSF core biomarkers, cognitive status, and neurodegeneration remain unclear.
Objective:
To assess the association between CSF sTREM2 levels and AD progression and other AD hallmarks.
Methods:
Using the Alzheimer’s Disease Neuroimaging Initiative database, we investigated 1,035 participants, including 310 cognitively normal controls, 527 patients with mild cognitive impairment, and 198 patients with dementia. They were grouped according to CSF pathology (A/T profile) severity. CSF sTREM2 levels were compared between the groups, and linear regression analysis was performed to evaluate the factors affecting sTREM2 levels. The predictive effectiveness of sTREM2 levels was tested, and the correlation with other indicators was explored. The increase rate was assessed using linear mixed-effects models.
Results:
Higher CSF sTREM2 levels were associated with older age as well as higher CSF p-tau or t-tau and amyloid-β levels (all p < 0.001), but not with cognitive status. sTREM2 levels were not correlated with the baseline or longitudinal scale and neuroimaging result changes, and could not predict clinical conversion, but were correlated with multiple non-amyloid-β and non-tau CSF cytokines related to inflammation and neurodegeneration (p < 0.0001). The increased sTREM2 expression rate did not change among groups.
Conclusion:
CSF sTREM2 levels were jointly determined by age, amyloid-β, and tau pathologies, leading to complex AD cognitive continuum changes. Although sTREM2 levels could not predict cognitive deterioration and neurodegeneration, they could reflect the microglial state as a non-specific biomarker.
INTRODUCTION
Alzheimer’s disease (AD) is an extremely complex and distinctive entity that involves a series of interacting pathophysiological cascades [1, 2]. In addition to extracellular deposition of amyloid-β (Aβ) and intraneuronal presence of aggregated hyperphosphorylated tau proteins, other factors, such as immune dysfunction and neuroinflammation, cannot be ignored [1, 2]. Triggering receptor expressed on myeloid cells 2 (TREM2) is a star immune receptor uniquely expressed by microglia within the brain. When activated by stimuli, TREM2 can induce innate immune responses, including phagocytosis, chemotaxis, and transcriptional changes [1, 3]. Several studies have confirmed the association between TREM2 gene mutations and increased risk of AD [4–6], which strongly illustrates the crucial role of TREM2 in maintaining homeostasis.
Soluble TREM2 (sTREM2) is derived from the ectodomain shedding of TREM2 and is released into the extracellular space, where it can be detected in the cerebrospinal fluid (CSF) and plasma [3]. Interestingly, sTREM2 activates microglia and blocks neurotoxicity. In our previous review, we concluded that plasma sTREM2 is not a sufficient biomarker for AD [7]. In contrast, CSF sTREM2 expression is more complex. More specifically, reduced [8], increased [9–16], or unchanged [17–21] levels have been found in patients with AD dementia or mild cognitive impairment (MCI) compared with those in cognitively normal controls (NCs). Based on discrepant facts, three meta-analyses concluded that higher CSF sTREM2 levels were associated with increased risk of AD [22–24]. However, it may be more complex than that; considering the age-dependent nature of sTREM2 expression, the group differences became insignificant when age was matched between patients and NCs [23]. It should also be noted that the more demanding the diagnostic criteria, or rather, AD core biomarkers, the greater the difference between groups [23]. In addition, some studies have suggested that sTREM2 levels fluctuate as a function of clinical stage, rather than changing continuously in the same direction, reaching their highest levels before the dementia stage [14, 25]. The clinical phenotype is simply the concentrated expression of intrinsic pathological changes [26]; therefore, exploring sTREM2 from the perspective of biomarkers may be helpful in understanding the changing dynamics. In patients with autosomal dominant AD, researchers observed increased levels of CSF sTREM2 approximately 5 years before the estimated onset of symptoms [13]; similar results have been reported in other preclinical AD studies [12, 27], indicating that the pathological changes in AD are likely to affect the expression of sTREM2 independently of cognitive status. The current mainstream view suggests that CSF sTREM2 is significantly affected by tau pathology but not by Aβ [10–14, 28]. Nonetheless, some issues need to be addressed. Theoretically, Aβ was associated with sTREM2 by regulating TREM2 shedding [29], and sTREM2 protects against Aβ pathology by blocking its oligomerization and fibrillization [29, 30]. In AD mouse models, brain sTREM2 levels are strongly correlated with amyloidosis [31]. Furthermore, the correlation between sTREM2 and tau was not significant in subgroup analyses [9, 18], and some studies have emphasized an association between sTREM2 and Aβ [9, 27]. For example, under the same degree of tau pathology, simple deterioration of Aβ leads to a decrease in sTREM2 levels [27]. Thus, it is necessary to explore sTREM2 in patients with AD from the perspective of internal pathologies.
The objectives of this study were as follows: 1) to explore the relationships between CSF sTREM2 levels and clinical cognitive stages, AD CSF core biomarkers, and other indicators, including neuropsychological scale scores, brain metabolism and morphology, and other non-Aβ and non-tau CSF biomarkers; 2) to test whether CSF sTREM2 levels can predict future cognitive deterioration in actual clinical settings, as previous studies have suggested that higher levels were associated with a reduced AD risk by delaying the onset age [32, 33], attenuating the risk gene-related effects and neurodegeneration [34], and slowing Aβ accumulation [35]; 3) to observe longitudinal changes in CSF sTREM2 levels. In summary, we analyzed sTREM2 comprehensively in a large cohort.
MATERIALS AND METHODS
Participants
Data used in the preparation of this article were obtained from the Alzheimer’s Disease Neuroimaging Initiative (ADNI) database (adni.loni.usc.edu). The ADNI was launched in 2003 as a public-private partnership, led by Principal Investigator Michael W. Weiner, MD. The primary goal of ADNI has been to test whether serial magnetic resonance imaging (MRI), positron emission tomography (PET), other biological markers, and clinical and neuropsychological assessment can be combined to measure the progression of MCI and early AD.
In January 2022, we included 1,035 individuals with available CSF sTREM2 data at the baseline. All participants had available detailed clinical information, including demographic data, apolipoprotein E (APOE) status, and neuropsychological test results. The tests included the Clinical Dementia Rating scale (CDR), Mini-Mental State Examination (MMSE), 13-Item Alzheimer’s Disease Assessment Scale-Cognitive Subscale, logical memory test, and auditory verbal learning test. Composite scores, including executive functioning, memory, language, and visuospatial functioning scores derived from the ADNI or the Phenotype Harmonization Consortium [36, 37] were also obtained. The ADNI database classified individuals clinically as NCs (MMSE score: ≥24, CDR score: 0), those with MCI (MMSE score: ≥24, CDR score: 0.5, and objective memory loss measured using education-adjusted scores on delayed recall of logical memory), or those with AD dementia following predefined criteria [38]. Most participants had follow-up data. Among them, 203 patients with MCI developed dementia after 6–138 months (162 within 36 months), and 69 NCs developed MCI or dementia after 6–180 months (27 within 36 months). In addition, 424 participants had longitudinal sTREM2 data collected across 48 months.
CSF biomarkers
The measurement procedures for sTREM2 levels have been comprehensively described in previous publications [8, 14]. Briefly, the assay was based on an electrochemiluminescence method with a biotinylated polyclonal goat IgG anti-human TREM2 antibody (R&D Systems) as the capture antibody, a monoclonal mouse IgG anti-human TREM2 antibody (Santa Cruz Biotechnology) as the detection antibody, and a SULFO-TAG-labeled goat polyclonal anti-mouse IgG antibody (Mesoscale Discovery) as the secondary antibody. The samples were measured in duplicate with a coefficient of variation (CV) of <15%, and the mean intraplate CV and interplate CV were 3.1% and 10.3%, respectively. Additionally, the operators were blinded to the participant diagnosis.
As AD core biomarkers, CSF Aβ42, p-tau (phosphorylated at threonine 181), and t-tau levels were measured using fully automated Roche Elecsys® immunoassays as described previously [39]. The enrolled participants were classified as having high brain Aβ loads (A+) or fibrillar tau (T+) according to a priori principles that utilized established cutoff values of <977 pg/mL for CSF Aβ42 and >27 pg/mL for p-tau [40]. Generally, determining participants’ status is linked with the latest diagnostic framework [26].
Other non-Aβ and non-tau biomarkers related to inflammation, the complement system, neuronal damage, and other neurodegenerative diseases were identified in some participants. Briefly, chitinase-3-like protein 1 (YKL-40), visinin-like protein 1 (VILIP-1), synaptosomal-associated protein 25 (SNAP-25), and neurogranin were quantified in 540 participants in the Fagan Lab (Washington University) using enzyme-linked immunosorbent assay (ELISA; Quidel) or Erenna® immunoassay (Singulex); interleukin (IL)-7, IL-10, IL-6, IL-21, IL-9, IL-12 p40, transforming growth factor (TGF) β1/2/3, tumor necrosis factor (TNF)-α, soluble TNF-receptor 1/2 (TNF-R1/2), intercellular adhesion molecule 1 (ICAM1), vascular cell adhesion molecule 1 (VCAM1), and interferon γ-induced protein 10 (IP-10) were quantified in 316 participants in the Hu Lab (Emory University) using multiplex immunoassays (Millipore); α-synuclein (α-syn; n = 606) and complement factors (n = 306), including complement factors 3 (C3) and H (FH) were quantified in the Zhang Lab (Washington University) using the Luminex platform and Milliplextrademark kit (Millipore), respectively; neurofilament light (NFL; n = 305) and growth-associated protein 43 (GAP43; n = 1065) were quantified in the Blennow Lab (Gothenburg University) using ELISA methods (UmanDiagnostics and in-house made, respectively); and progranulin was quantified in parallel with sTREM2 in the Haass Lab (German Center for Neurodegenerative Diseases) using the electrochemiluminescence method.
Details regarding CSF collection and detection can be obtained from the database (http://adni.loni.usc.edu).
Neuroimaging acquisition and analysis
Structural imaging was performed using a 1.5- or 3.0-Tesla MRI scanner with a three-dimensional T1-weighted MPRAGE sequence. To obtain regional morphological parameters, including volume, surface area, and cortical thickness, we performed a region of interest (ROI)-based analysis using FreeSurfer (version 4.3 for 1.5-T data and version 5.1 for 3.0-T data) (http://surfer.nmr.mgh.harvard.edu/). In addition to baseline MRI, 752 and 585 participants were reexamined after 1 and 2 years, respectively. Notably, for the cross-sectional comparisons, images were segmented according to the same atlas defined in FreeSurfer; for the longitudinal data, an individualized template was used to initialize the longitudinal image processing to increase reliability and statistical power when measuring brain changes over time [41]. Only the results that passed the quality control were included. For [18F]fluoro-2-deoxyglucose (18F-FDG) PET, we used the hypometabolic convergence index (HCI) and metaROI standardized uptake value ratio (SUVR) to represent the global glucose metabolism. The HCI is a voxel-wise index that reflects the extent to which the pattern and magnitude of hypometabolism of an individual conform to AD dementia [42], while metaROI results from a set of predefined ROIs based on coordinates cited frequently in other AD-related FDG studies [43].
Details of neuroimaging acquisition and processing are available online (http://adni.loni.usc.edu) and in previous publications [42, 45].
Statistical analysis
Demographic, neuropsychological, and imaging data were summarized as numbers (%) or as means±standard deviations for categorical and continuous variables, respectively. Chi-square tests were used for categorical variables and one-way ANOVA followed by Tukey’s tests were used for continuous variables. The area under the curve (AUC) values with 95% confidence intervals of the receiver operating characteristic (ROC) curves were used to evaluate the ability of sTREM2 levels to identify “A” or “T” status. Furthermore, we used linear regression models to evaluate the effects of different factors, such as diagnostic status and AD CSF core biomarkers, on sTREM2 levels.
The predictive effectiveness of sTREM2 levels was verified through the following methods: 1) calculating the Pearson correlation coefficients between sTREM2 levels and degrees of change in the neuropsychological scale results or regional morphological parameters after 1 or 2 years; 2) evaluating the ability to predict outcomes among the non-dementia participants using logistic and Cox regression models adjusted for age, sex, educational level, APOE ɛ4 status, and CSF Aβ levels. AD CSF core biomarkers were also assessed for horizontal comparisons. In addition, we explored the relationships between sTREM2 levels and other indicators using Pearson’s correlation analysis. We also used linear mixed-effects models to evaluate longitudinal changes in sTREM2 levels in the groups with different diagnoses after correcting for confounding factors.
The significance threshold was set at p < 0.05 (corrected for multiple comparisons using Tukey’s tests), and the abovementioned analyses were performed using SPSS (version 24, SPSS Inc.) or R programming language (version 4.0.1).
RESULTS
Basic characteristics
The detailed demographic and clinical characteristics are presented in Table 1. A total of 1,035 participants, including 310 NCs, 527 patients with MCI, and 198 patients with dementia, were enrolled. The demographic information between the three groups was similar, with only minor differences. Specifically, the MCI group had a slightly younger baseline age than the other two groups (72.3±7.53 versus 73.7±5.93 [NC] and 74.6±8.33 [dementia]; both p < 0.05) and a higher proportion of men than the NC group (59.4% versus 49.7%; p < 0.01). The educational level of the dementia group was slightly lower than that of the NC group (15.4±2.82 versus 16.4±2.65; p < 0.01). As expected, the MCI and dementia groups both showed worse performance scores in the neuropsychological tests and higher proportions of APOE ɛ4 carriers than the NC group (all p < 0.001); the AD CSF core biomarkers were also more altered in these two groups than in the NC group (all p < 0.001). In addition, 83.3% of the participants underwent 18F-FDG-PET and 99.0% underwent brain MRI. As expected, the glucose metabolism represented by the metaROI SUVR and HCI index, as well as the regional morphological parameters, such as hippocampal volume and entorhinal cortex thickness, gradually changed across the cognitive continuum (all p < 0.001).
Baseline participant characteristics by clinical diagnosis
The participants were grouped according to their clinical diagnoses. Categorical and continuous measures are presented as numbers (%) or means±standard deviations. Logical memory indicates the total number of story units that are recalled. ADNI_MEM/EF refers to the composite measures of memory and executive function derived from the ADNI database. PHC_MEM/EF/LAN/VSP refers to the cognitive composite scores derived from the Phenotype Harmonization Consortium. The metaROI includes the left angular gyrus, right angular gyrus, bilateral posterior cingulate gyrus, left inferior temporal gyrus, and right inferior temporal gyrus, which are the most important hypometabolic regions indicative of pathological metabolic changes in patients with AD. The HCI characterizes AD-related cerebral hypometabolism of glucose and reflects the extent to which the pattern and magnitude of hypometabolism in a person’s FDG image corresponds to that in patients with the clinical diagnosis of AD. The statistical analyses were conducted by chi-square tests for categorical variables and one-way ANOVAs followed by Tukey’s test for continuous variables (adjusted p value). Compared with the NCs group: *<0.05; **<0.01; ***<0.001; #>0.05. Mark “a” and “b”: Four participants had values below the lower limit of detection for CSF p-tau. Among them, three had values below the lower limit of detection of t-tau, and one had values above the upper limit of detection of p-tau and t-tau; they were excluded from the quantitative analysis. NCs, cognitively normal controls; MCI, mild cognitive impairment; APOE, apolipoprotein E; MMSE, Mini-Mental State Examination; ADAS-Cog 13, Alzheimer’s Disease Assessment Scale-Cognitive 13; ADNI, Alzheimer’s Disease Neuroimaging Initiative; PHC, Phenotype Harmonization Consortium; MEM, memory sub-domain; EF, executive function sub-domain; LAN, language sub-domain; VSP, visuospatial sub-domain; CSF, cerebrospinal fluid; Aβ, amyloid-β; p-tau, phosphorylated tau; t-tau, total tau; FDG, [18F]fluoro-2-deoxyglucose; ROI, region of interest; SUVR, standardized uptake value ratio; HCI, hypometabolic convergence index; B, bilateral; HP, hippocampus; L, left; R, right; Ent, entorhinal cortex; AD, Alzheimer’s disease; Ava, available; ANOVA, analysis of variance.
Baseline CSF sTREM2 levels
There were no differences in the baseline sTREM2 levels among the NC, MCI, and dementia groups (Fig. 1A). However, the results changed when the groups were stratified according to AD CSF core biomarkers. More specifically, after stratification of the clinically diagnosed groups additionally by Aβ status (Fig. 1B), the sTREM2 levels were relatively higher in the A–dementia group than in the other groups (5922.2 pg/mL versus 3724.0–4320.3 pg/mL; all p≤0.0172); after stratification of the groups additionally by p-tau status (Fig. 1C), the three T+ groups all showed higher sTREM2 levels than the three T–groups (4634.7–5640.9 pg/mL versus 3391.7–3663.2 pg/mL; all p≤0.0030). Except for the level being higher in the T+ NC group than in the T+ dementia group (5640.9 versus 4634.7 pg/mL; p < 0.05), there were no differences among the T–or T+ groups. After stratification of the groups additionally by both Aβ and p-tau statuses (Fig. 1D), we found that sTREM2 was not differentially expressed among the same biomarker profiles, including A+T+, A+T–, A–T+, and A–T–, and was not affected by cognitive status. Furthermore, the sTREM2 levels of the T+ groups were still higher than that of the T–groups, regardless of the profile: A+ profile (4421.3–5369.4 pg/mL versus 2969.8–3117.2 pg/mL; all p≤0.0093) or A–profile (5876.8–7060.2 pg/mL versus 3964.0 pg/mL [NC] and 3716.7 pg/mL [MCI], all p < 0.0001; except there were no differences between the A–T–dementia group [4784.1 pg/mL] and A–T+ groups). Details regarding group characteristics are presented in Supplementary Tables 1–3.
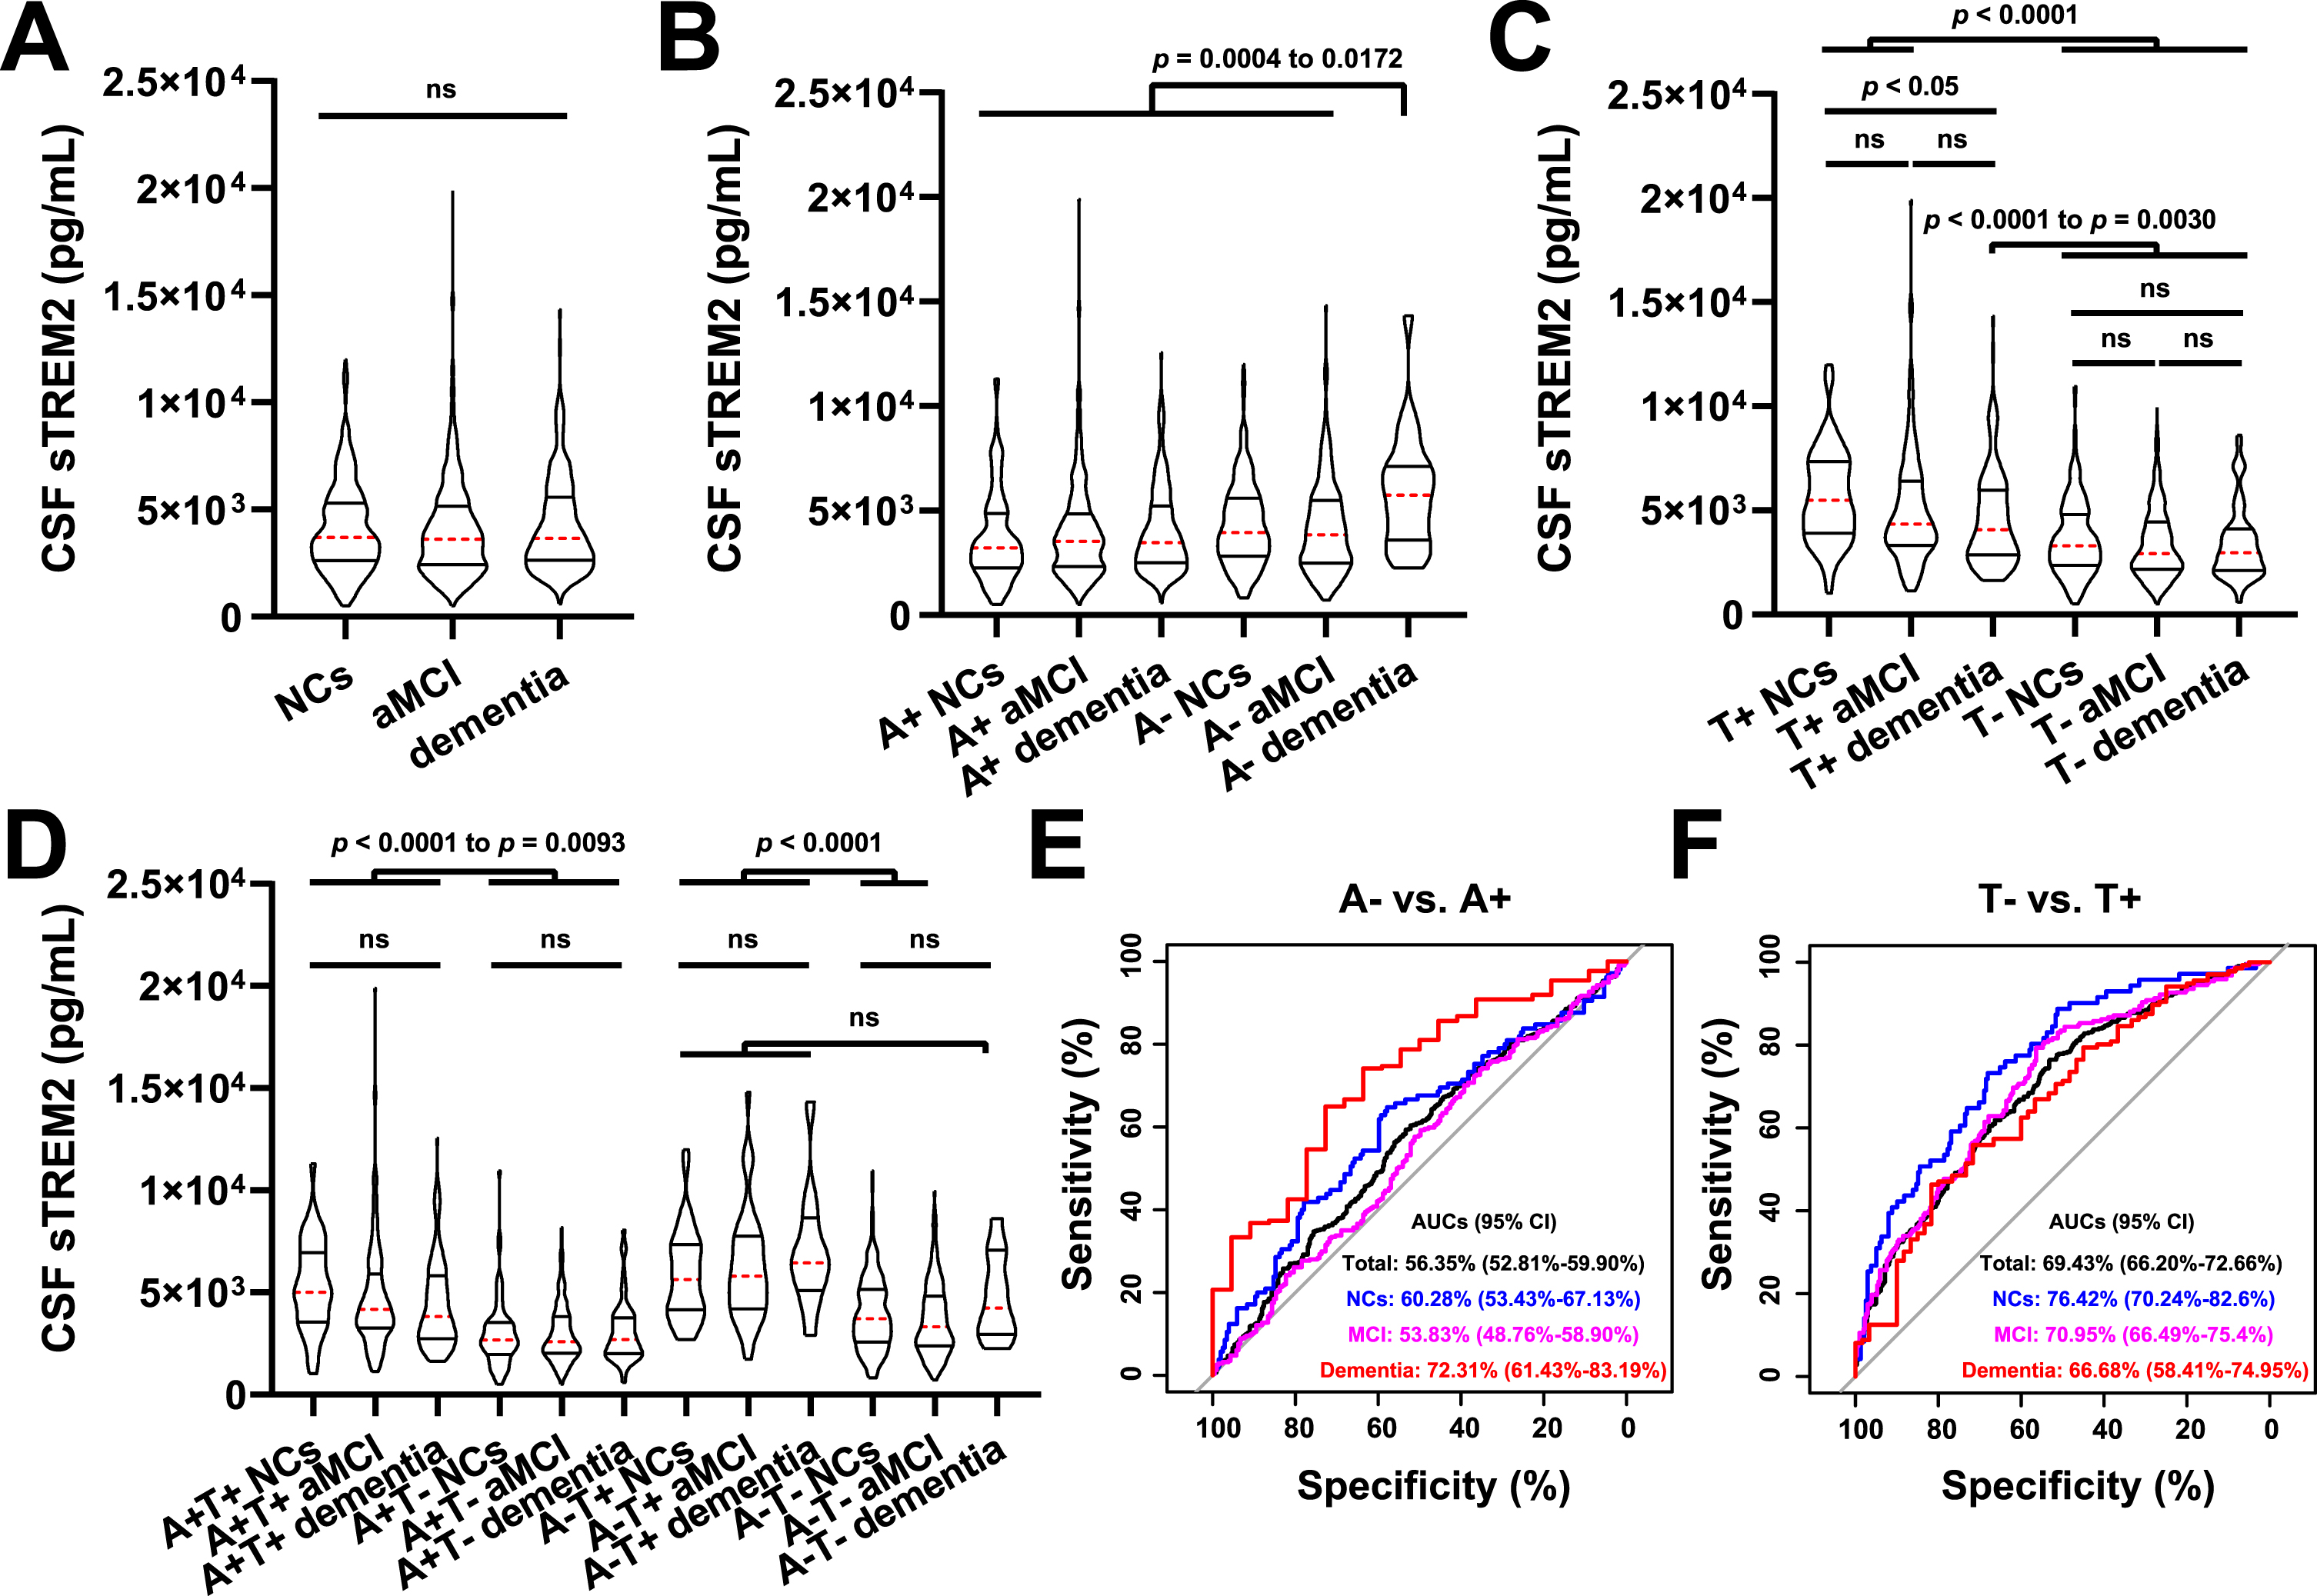
CSF sTREM2 levels in the different diagnostic groups and ROC curves. The participants were grouped by clinical diagnosis alone (A), clinical diagnosis and CSF-determined Aβ status (B), clinical diagnosis and CSF-determined p-tau status (C), or clinical diagnosis and CSF-determined Aβ and p-tau statuses (D). According to a previous standard, we set the cutoff value at 977 pg/mL for Aβ and 27 pg/mL for p-tau to select participants with Aβ deposition (<977 pg/mL; A+) and fibrillar tau (>27 pg/mL; T+). The results are presented in improved box charts; the red dotted lines indicate the average values; the upper straight lines indicate the upper quartiles; and the lower straight lines indicate the lower quartiles. Statistical analysis was conducted using one-way ANOVA followed by Tukey’s test (adjusted p value). Comparisons among groups: ns, >0.05; other p values are listed. ROC curves were used to distinguish the Aβ–group from the Aβ+ group (E) and the T–group from the T+ group (F); the analyses were performed by the “pROC” package of the R programming language in the total population (black), NC group (blue), MCI group (pink), and dementia group (red). The AUC values and corresponding 95% CIs are listed. CSF, cerebrospinal fluid; sTREM2, soluble triggering receptor expressed in myeloid cells 2; ROC, receiver operating characteristic; Aβ, amyloid-β; p-tau, phosphorylated tau; NCs, cognitively normal controls; MCI, mild cognitive impairment; AUC, area under the curve; CI, confidence interval; ANOVA, analysis of variance.
Relationships between CSF sTREM2 levels and core biomarkers
The analysis was performed in all except five participants whose p-tau levels were beyond the detection range. CSF core biomarkers, including Aβ42 and p-tau levels, plus age, sex, educational, and APOE ɛ4 status, were used as predictors of CSF sTREM2 levels. CSF t-tau was not included due to its extremely high correlation with p-tau (R = 0.984, p < 0.001). CSF, cerebrospinal fluid; sTREM2, soluble triggering receptor expressed in myeloid cells 2; APOE, apolipoprotein E; Aβ, amyloid-β; p-tau, phosphorylated tau; t-tau, total tau; CI, confidence interval; MCI, mild cognitive impairment.
Multivariate logistic regression model considering the evolution from MCI to dementia as outcome variable
Two hundred and sixty-eight patients with an MCI diagnosis were followed up for at least 36 months, and their cognitive functions did not deteriorate. In contrast, 162 patients developed dementia within 36 months. The analysis was performed using the logistic regression method; CSF core biomarkers, including Aβ42 levels, plus CSF sTREM2 levels, age, sex, educational, and APOE ɛ4 status were used as predictors of outcome events. MCI, mild cognitive impairment; OR, odds ratio; CI, confidence interval; APOE, apolipoprotein E; CSF, cerebrospinal fluid; Aβ, amyloid-β; sTREM2, soluble triggering receptor expressed in myeloid cells 2.
Based on these findings, we speculated that sTREM2 levels were not affected by cognition and Aβ but by p-tau. However, the regression analysis results suggested that both CSF Aβ42 and p-tau levels (β: 1.001 and 68.503; both p < 0.001), as well as age (β: 76.146; p < 0.001) and sex (β: –299.130 of the female; p = 0.018), were related to sTREM2 levels; meanwhile, the cognitive status, educational level, and APOE ɛ4 status had no effect (all p > 0.05; Table 2). Except for the unstable roles of sex, all other results remained similar in the subgroup analyses (all p < 0.001; Supplementary Table 4). Furthermore, the ROC analysis showed that sTREM2 levels could not distinguish between A–and A+ individuals, with an AUCs value of 0.564 (Fig. 1E). Similar results were obtained in the NC (AUCs: 0.603) and MCI (AUCs: 0.538) groups, but not in the dementia group (AUCs: 0.723). In contrast, the index was conducive to the identification of “T” status, with AUC values of 0.667–0.764 (Fig. 1F).
Relationships between sTREM2 levels and cognition, metabolism, and morphology
Figure 2A shows the Pearson correlation coefficients between the baseline CSF markers and other indicators. Clearly, Aβ42, p-tau, and t-tau levels were all closely correlated with the scores of the scales, such as the MMSE and composite tests, global metabolism, and volume or cortical thickness of some important brain regions, such as the temporal regions and the hippocampus (all p < 0.0001). Comparatively, the correlations between sTREM2 levels and these indicators were generally not significant.
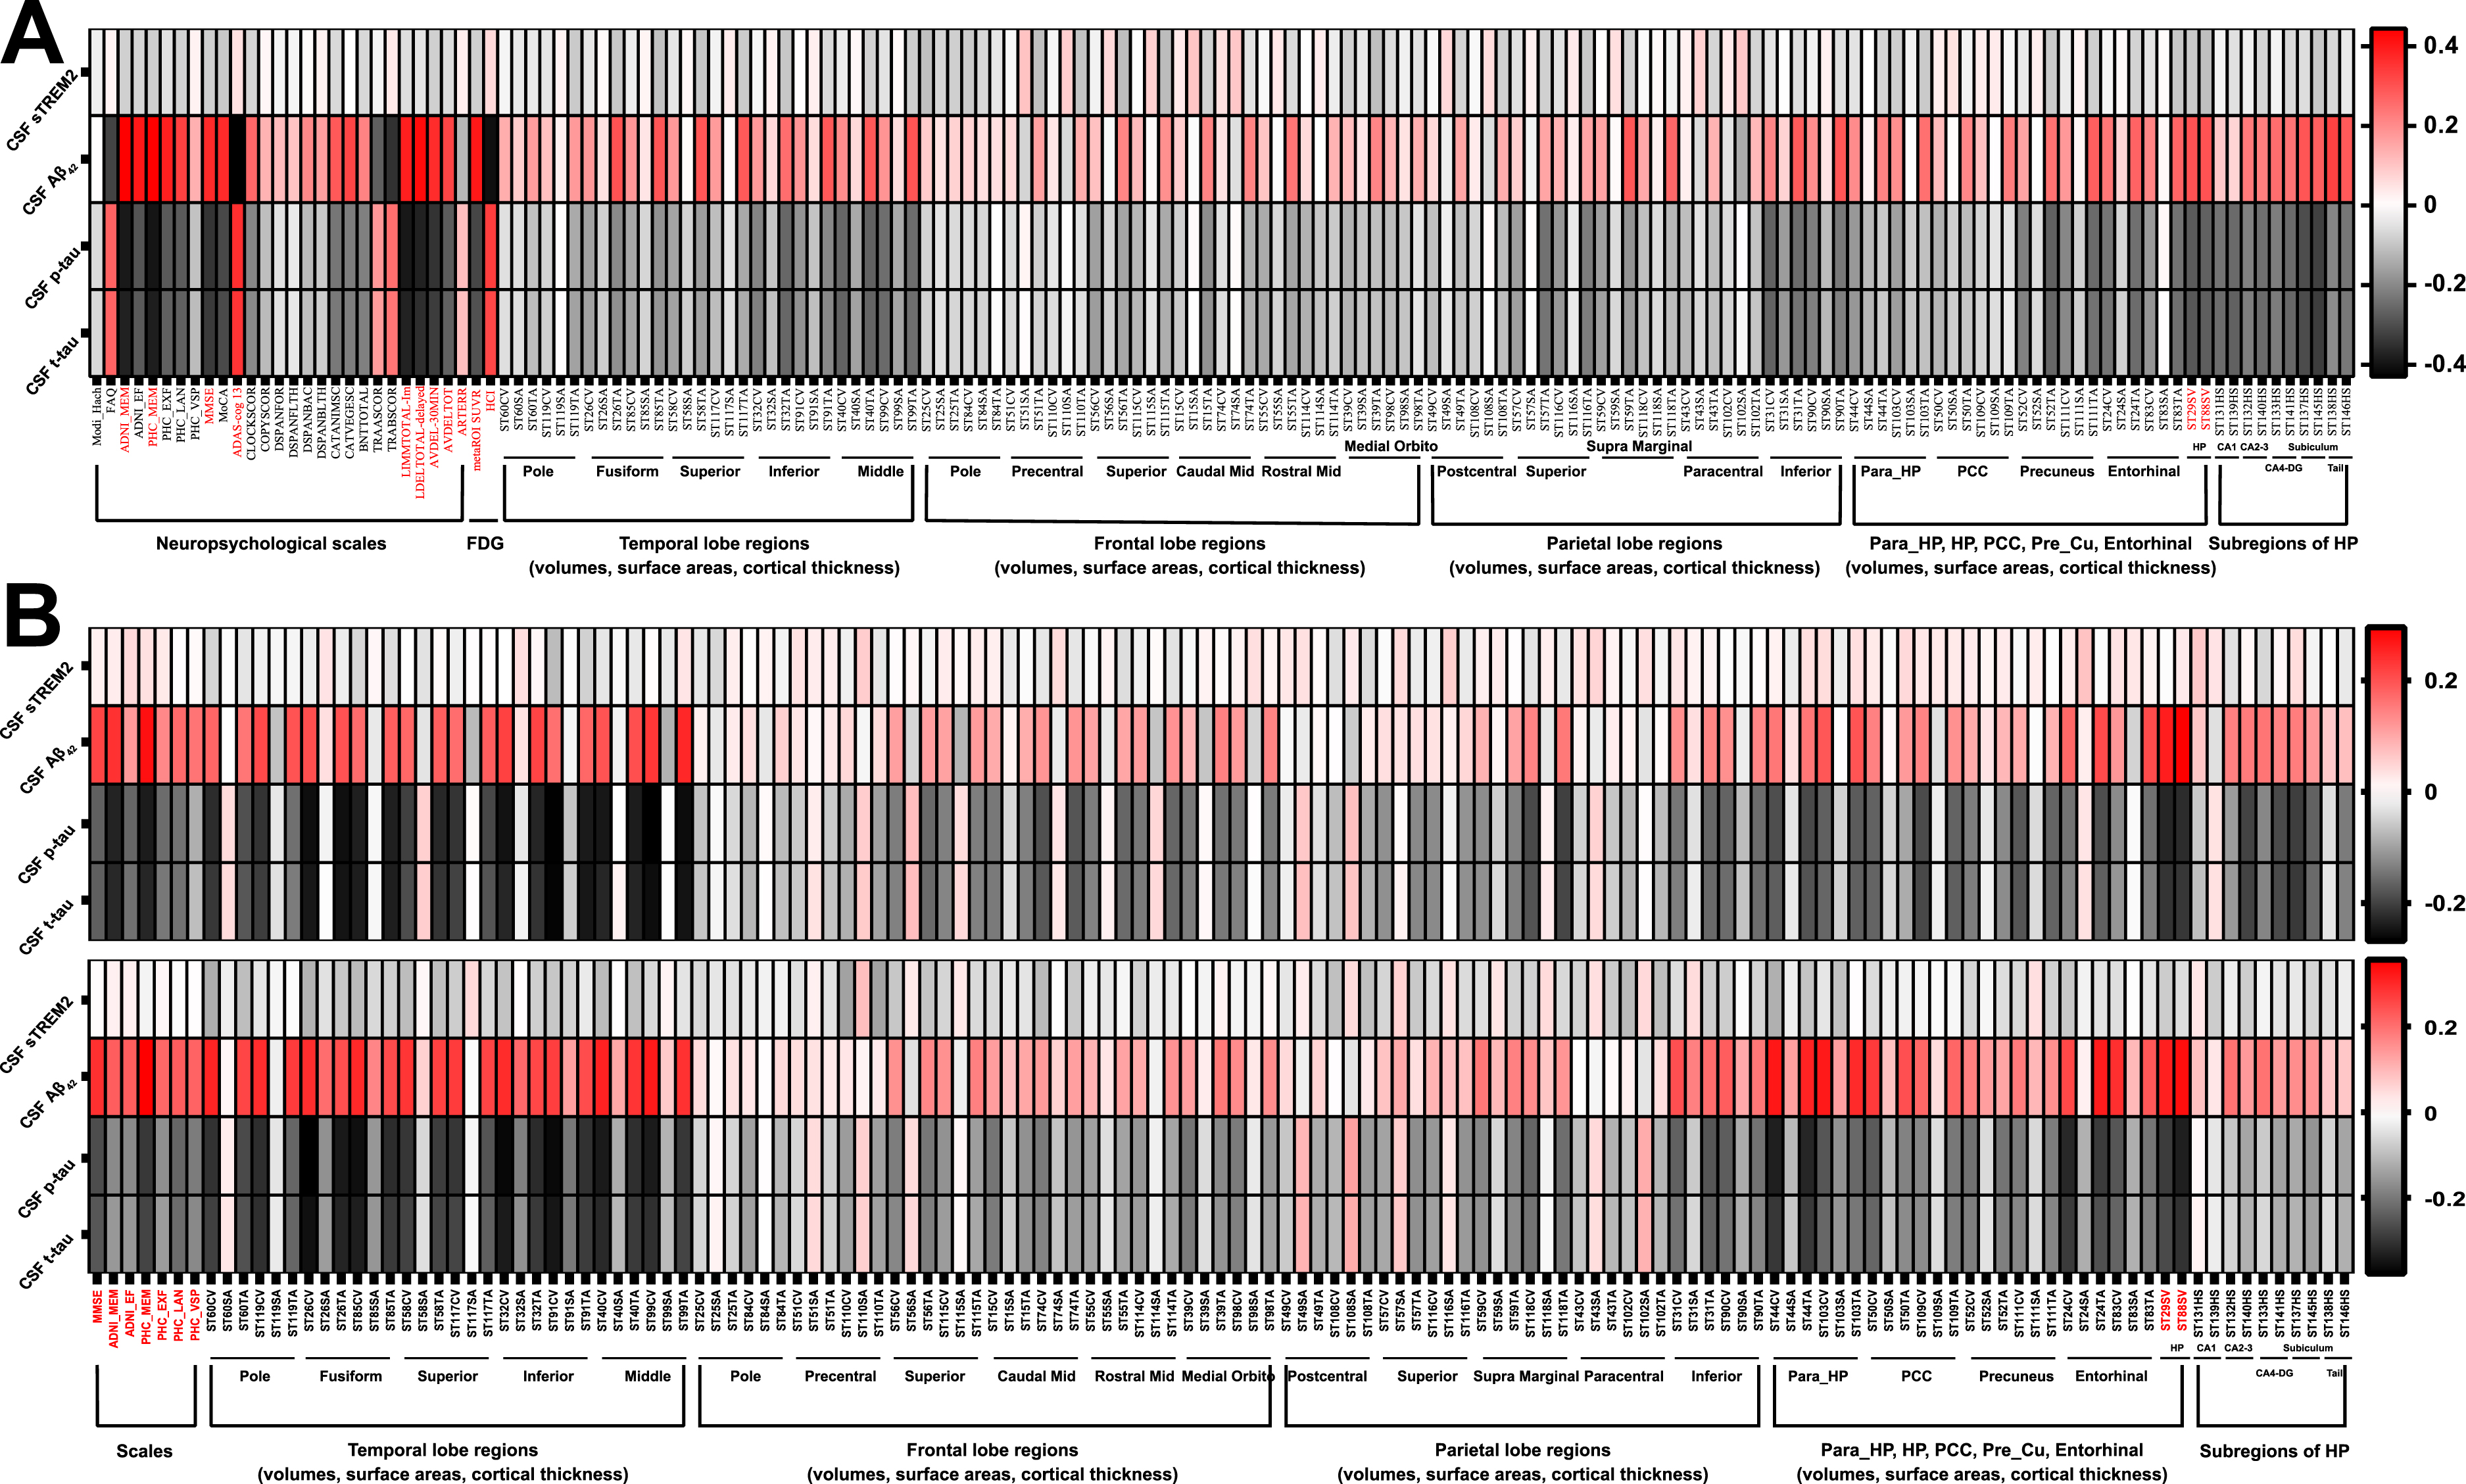
Correlation analysis matrices. The analysis was performed among the individuals with different diagnoses. A) The matrix shows the Pearson correlation coefficients between the baseline CSF markers (Aβ42, p-tau, t-tau, and sTREM2 levels) and other indicators, including neuropsychological scale scores, glucose metabolism reflected by FDG-PET, and brain regional volumes, surface areas, and cortical thicknesses reflected by structural MRI. B) A total of 893 participants had scale data at the 1-year follow-up (except for PHC_VSP, with 410 participants), and 752 participants had MRI data at the 1-year follow-up. The upper matrix shows the Pearson correlation coefficients between the baseline CSF markers and the 1-year change in the neuropsychological scale scores and indicators on structural MRI. A total of 790 subjects had scales data at the 2-year follow-up (except for PHC_VSP, with 336 participants), and 585 participants had MRI data at the 2-year follow-up. Correspondingly, the lower matrix shows the Pearson correlation coefficients between the baseline CSF markers and the 2-year change in the neuropsychological scale scores and indicators on structural MRI. The red parts of the abscissa are relatively more important indicators. Detailed abbreviations are shown in the Supplementary Material. CSF, cerebrospinal fluid; sTREM2, soluble triggering receptor expressed in myeloid cells 2; Aβ, amyloid-β; p-tau, phosphorylated tau; t-tau, total tau; ADNI, Alzheimer’s Disease Neuroimaging Initiative; PHC, Phenotype Harmonization Consortium; MEM, memory sub-domain; EF, executive function sub-domain; LAN, language sub-domain; VSP, visuospatial sub-domain; MMSE, Mini-Mental State Examination; ADAS-Cog 13, Alzheimer’s Disease Assessment Scale-Cognitive 13; LIMMTOTAL-Im/Delayed, Logical Memory-Immediate Recall/Delayed Recall; AVDEL-30MIN/TOT, Rey Auditory Verbal Learning Test-30 min delayed score/recognition score; ANARTERR, American National Adult Reading Test Total Score; FDG, [18F]Fluoro-2-deoxyglucose; PET, positron emission tomography; MRI, magnetic resonance imaging; ROI, region of interest; SUVR, standardized uptake value ratio; HCI, hypometabolic convergence index; HP, hippocampus; PCC, posterior cingulate gyrus; CV, cortical volume; SA, surface area; TA, cortical thickness average.
Predictive effectiveness of sTREM2 levels
Referring to previous methods [46], we assessed the correlations between baseline CSF sTREM2 levels and 1 or 2-year changes in the scale or MRI indicator scores. As shown in Fig. 2B, unlike Aβ42 and tau, sTREM2 levels were not significantly correlated with the longitudinal changes in the cognition or major morphological parameters, such as hippocampal volume.
We further explored whether sTREM2 levels could predict MCI deterioration. Four hundred and thirty patients with MCI were followed up for at least 36 months; among them, 162 had developed dementia within 36 months. Logistic regression suggested that sTREM2 was not a risk factor for conversion, unlike Aβ42 or tau (Table 3 and Supplementary Table 5). Identical results were obtained in the survival analysis ( Supplementary Table 6) and among NC group (Supplementary Table 7).
Correlations with non-Aβ and non-tau CSF biomarkers
Some participants had data for other CSF biomarkers. As shown in Fig. 3, correlation analyses suggested that sTREM2 levels had significant relationships with inflammation-related biomarkers (YKL-40, progranulin, IL-10, TGF β1, TNF-α, TNF-R1, TNF-R2, ICAM1, VCAM1, IL-9, and IP-10), complement-related biomarkers (C3 and FH), and neurodegeneration-related biomarkers (NFL, VILIP-1, SNAP-25, neurogranin, and GAP-43) (R = 0.261–0.643; all p < 0.0001). These correlations remained significant in the clinical subgroups. Although sTREM2 levels correlated with TGF β2 and IL-6 levels across the entire cohort (R = –0.121 and 0.120, respectively; both p < 0.05), the results were not significant in the subgroups. Other inflammatory factors, including IL-7, IL-12 p40, TGF β3, and IL-21 levels, were not associated with sTREM2 levels. In addition, sTREM2 levels were correlated with α-syn levels across the entire cohort and within subgroups (R = 0.182–0.260 and p≤0.006; data not shown).
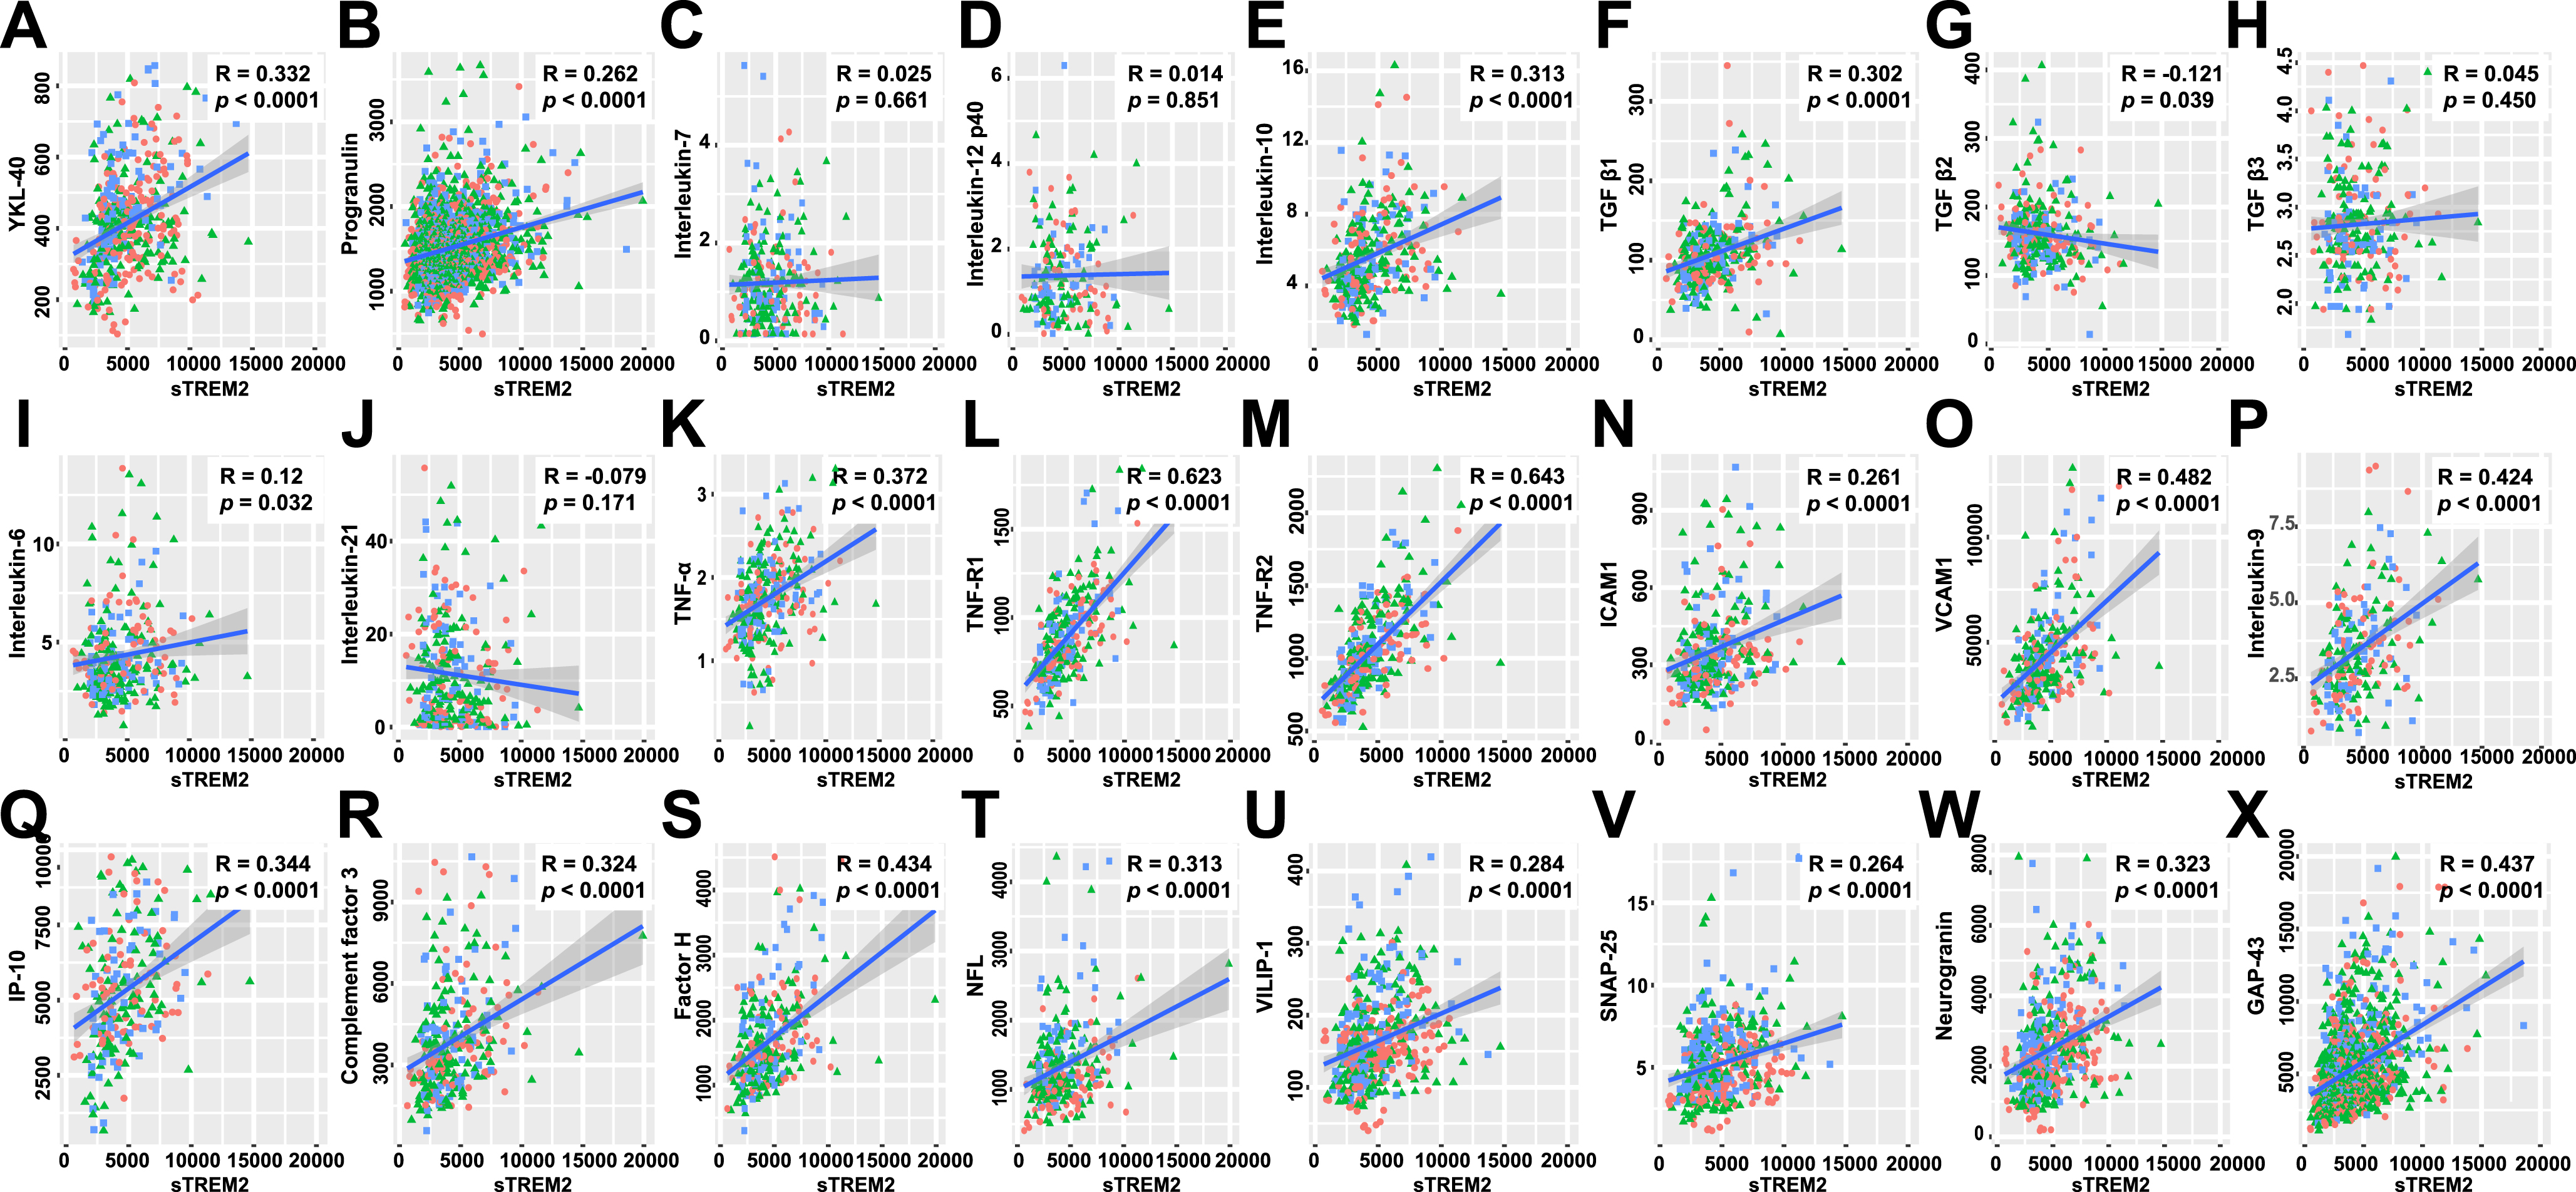
Correlations with non-Aβ and non-tau CSF biomarkers. The analysis was performed in the subgroups of participants with different diagnoses. The red circles, green triangles, and blue squares refer to the NC, MCI, and dementia groups, respectively. Pearson correlation analyses were performed between CSF sTREM2 levels and CSF inflammation-related factors, including YKL-40 (A), progranulin (B), IL-7 (C), IL-12 p40 (D), IL-10 (E), TGF β1 (F), TGF β2 (G), TGF β3 (H), IL-6 (I), IL-21 (J), TNF-α (K), TNF-R1 (L), TNF-R2 (M), ICAM1 (N), VCAM1 (O), IL-9 (P), and IP-10 (Q); CSF complement factors 3 (R) and H (S); and CSF neuronal damage markers, including NFL (T), VILIP-1 (U), SNAP-25 (V), neurogranin (W), and GAP-43 (X). Notably, some participants in the progranulin (B) and GAP-43 (X) analyses had follow-up data. The correlation coefficients and p values are listed. Aβ, amyloid-β; CSF, cerebrospinal fluid; NCs, cognitively normal controls; MCI, mild cognitive impairment; sTREM2, soluble triggering receptor expressed in myeloid cells 2; YKL-40, chitinase-3-like protein 1; IL, interleukin; TGF, transforming growth factor; TNF, tumor necrosis factor; TNF-R1/2, soluble tumor necrosis factor receptor 1/2; ICAM1, intercellular adhesion molecule 1; VCAM1, vascular cell adhesion molecule 1; IP-10, interferon γ-induced protein 10; NFL, neurofilament light; VILIP-1, visinin-like protein 1; SNAP-25, synaptosomal-associated protein 25; GAP-43, growth-associated protein 43.
Longitudinal analyses
Some of the participants had longitudinal CSF sTREM2 data at the 12th, 24th, 36th, and 48th months (Table 1). The corresponding observed levels in the different diagnostic groups are shown in Fig. 4A (by cognitive status) and 4B (by “T” status). In the linear mixed-effects models, we found that the increase rate of sTREM2 levels was not different between the NC, MCI, and dementia groups (Fig. 4C) and between the T–and T+ groups (Fig. 4D). Furthermore, we found that sTREM2 levels were positively and significantly correlated with p-tau (Fig. 4E–I; R = 0.220–0.380, p≤0.0089) and Aβ levels at different time points (Fig. 4J–L and 4N; R = 0.107–0.216, p≤0.0433; except for the 36th month in 4M), reinforcing the abovementioned results.
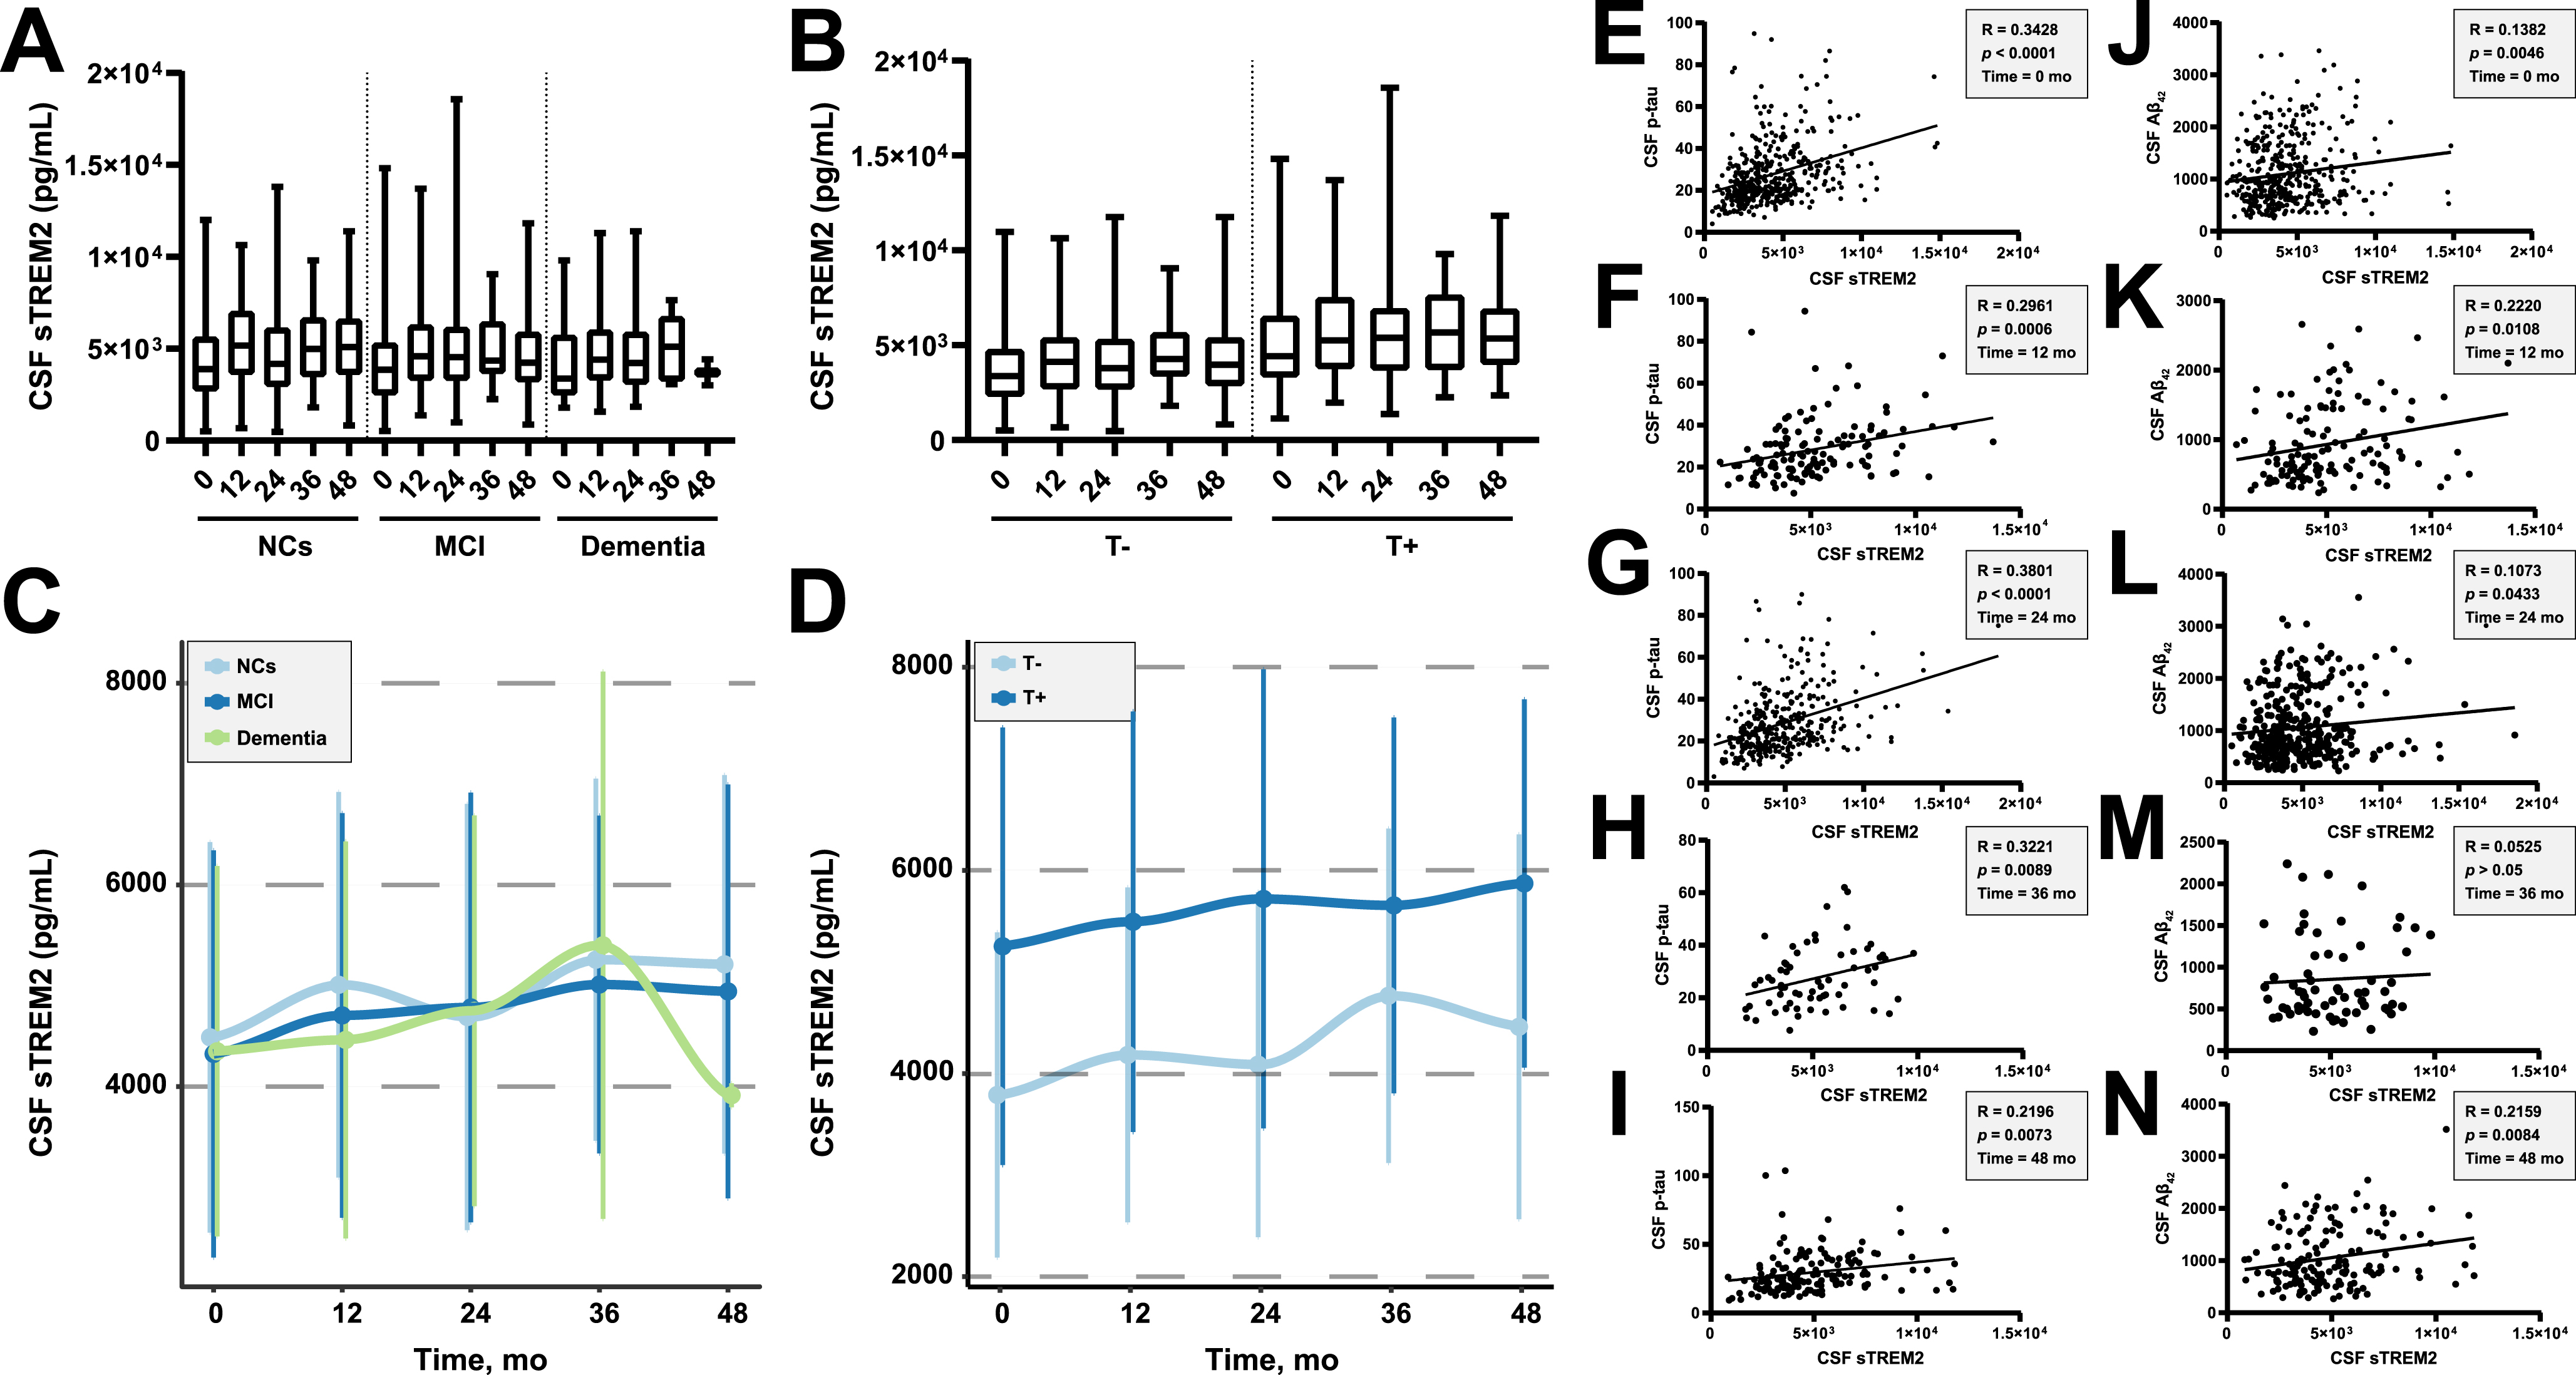
Longitudinal analyses. We set the cutoff value at 27 pg/mL for p-tau to select participants with fibrillar tau (>27 pg/mL; T+). A, B) Observed CSF sTREM2 levels in the different diagnostic groups longitudinally. C, D) Estimated means and SDs of CSF sTREM2 levels in the different diagnostic groups, with results from a linear mixed-effects model adjusted for age, sex, educational level, and APOE ɛ4 status. The trajectories were curvilinear fitted, and there were no differences in the slopes between the groups (p > 0.05). E–I) In participants with longitudinal data, we performed Pearson correlation analyses between CSF sTREM2 and CSF p-tau levels at baseline (E) and at different follow-up points (F–I). J–N) In participants with longitudinal data, we performed Pearson’s correlation analyses between CSF sTREM2 and CSF Aβ42 levels at baseline (J) and at different follow-up points (K–N). CSF, cerebrospinal fluid; sTREM2, soluble triggering receptor expressed in myeloid cells 2; NCs, cognitively normal controls; MCI, mild cognitive impairment; SD, standard deviation; p-tau, phosphorylated tau; Aβ, amyloid-β.
DISCUSSION
In this study, we comprehensively analyzed the application of CSF sTREM2 levels in patients with AD using a large public database. More specifically, age and AD CSF core biomarkers (Aβ and tau), but no cognitive status, significantly correlated with CSF sTREM2 levels. Further analyses showed that CSF sTREM2 levels were not correlated with neuropsychological scale scores, brain metabolism reflected by 18F-FDG-PET, and regional morphological parameters reflected by MRI, but were significantly and positively correlated with various non-Aβ and non-tau CSF biomarkers, such as inflammation or neurodegeneration-related cytokine levels. Moreover, CSF sTREM2 levels could not predict cognitive decline and brain atrophy over a period of 1 or 2 years and had no role in predicting clinical deterioration among individuals without dementia. Additionally, the longitudinal analysis indicated that the increase rate of CSF sTREM2 levels did not change among the groups.
As the diagnostic criteria for AD evolve, the exploration of sTREM2 has become more in-depth. Several recent studies have grouped individuals according to the profiles of AD core biomarkers and reached consistent conclusions [12, 28]; that is, CSF sTREM2 levels were usually higher in T+ groups than in T–groups, which was also observed in individuals with A–T+ biomarker profiles. However, conflicting results have been reported regarding the effects of Aβ. Compared with individuals with normal levels of Aβ and tau, individuals with pure Aβ pathology have shown reduced CSF sTREM2 levels [25, 27]; however, this result has not been replicated [12, 28]. In our study, the inter-group comparisons suggested that CSF sTREM2 levels were not affected by cognitive status, even under the same biomarker profile, and were likely to be influenced only by tau pathology. Using linear regression analyses, we found that sTREM2 levels were not only positively correlated with the severity of tau pathology but also negatively correlated with the severity of Aβ pathology. We believe that the results are reliable owing to the following reasons. First, the regression analyses were corrected for important confounding factors, including age and APOE ɛ4 status. Second, the results did not change when broken down by diagnostic groups, indicating robustness. Third, focusing only on individuals with follow-up data, we found that the correlations were still significant at different time points (except for the 36th month for Aβ, probably owing to the small sample size). Fourth, the abovementioned studies with negative results are worth considering because the authors had already obtained a difference that nearly reached statistical significance [20, 28] or had performed statistical analysis in a small sample [12, 28]. Severe Aβ pathology decreases CSF sTREM2 level, while severe tau pathology increases it. Although confusing, our results make previous inconsistent findings interpretable. Specifically, without considering the pathological states, we and other researchers all found that it was difficult to obtain group differences in sTREM2 levels [18, 21] and that making diagnoses using biomarkers usually yields differences [11, 23]. In addition, when limiting cognitive function to the same level, different combinations of “A” and “T” make sTREM2 elusive [25, 27]. Amyloid deposition usually does not increase significantly after patients enter the dementia stage [1]; however, the neurodegeneration is persistent, suggesting that the peak of sTREM2 levels likely occurs in the middle or late stages of dementia. Individuals have different degrees of Aβ and tau pathologies concurrently, and these pathologies combined with other factors, such as age [3, 23], jointly determine CSF sTREM2 levels and therefore lead to complexity.
As the diagnostic criteria for AD evolve, the exploration of sTREM2 has become more in-depth. Several recent studies have grouped individuals according to the profiles of AD core biomarkers and reached consistent conclusions [12, 28]; that is, CSF sTREM2 levels were usually higher in T+ groups than in T–groups, which was also observed in individuals with A–T+ biomarker profiles. However, conflicting results have been reported regarding the effects of Aβ. Compared with individuals with normal levels of Aβ and tau, individuals with pure Aβ pathology have shown reduced CSF sTREM2 levels [25, 27]; however, this result has not been replicated [12, 28]. In our study, the inter-group comparisons suggested that CSF sTREM2 levels were not affected by cognitive status, even under the same biomarker profile, and were likely to be influenced only by tau pathology. Using linear regression analyses, we found that sTREM2 levels were not only positively correlated with the severity of tau pathology but also negatively correlated with the severity of Aβ pathology. We believe that the results are reliable owing to the following reasons. First, the regression analyses were corrected for important confounding factors, including age and APOE ɛ4 status. Second, the results did not change when broken down by diagnostic groups, indicating robustness. Third, focusing only on individuals with follow-up data, we found that the correlations were still significant at different time points (except for the 36th month for Aβ, probably owing to the small sample size). Fourth, the abovementioned studies with negative results are worth considering because the authors had already obtained a difference that nearly reached statistical significance [20, 28] or had performed statistical analysis in a small sample [12, 28]. Severe Aβ pathology decreases CSF sTREM2 level, while severe tau pathology increases it. Although confusing, our results make previous inconsistent findings interpretable. Specifically, without considering the pathological states, we and other researchers all found that it was difficult to obtain group differences in sTREM2 levels [18, 21] and that making diagnoses using biomarkers usually yields differences [11, 23]. In addition, when limiting cognitive function to the same level, different combinations of “A” and “T” make sTREM2 elusive [25, 27]. Amyloid deposition usually does not increase significantly after patients enter the dementia stage [1]; however, the neurodegeneration is persistent, suggesting that the peak of sTREM2 levels likely occurs in the middle or late stages of dementia. Individuals have different degrees of Aβ and tau pathologies concurrently, and these pathologies combined with other factors, such as age [3, 23], jointly determine CSF sTREM2 levels and therefore lead to complexity.
CSF sTREM2 is considered a biomarker of microglial activation [3], which is the brain’s major immune response to Aβ plaques in patients with AD [1]. Multidimensional evidence has shown that sTREM2 can attenuate Aβ accumulation [29, 47]. In addition, viral expression of sTREM2 in the AD mouse brain reversed deficits in spatial memory and long-term potentiation [47]. However, the protective effects of sTREM2 in patients with AD remain unclear. Although some studies have found that a higher CSF sTREM2 level delayed cognitive decline to some extent [32, 33], our results suggest that sTREM2 levels could not predict clinical deterioration with actual clinical parameters like AD CSF core biomarkers. Identical results were also obtained in a study where researchers did not detect significant effects of CSF sTREM2 on MCI progression [48], and the negative association between the ratio of sTREM2 to p-tau and the risk of clinical progression was likely to be mediated by p-tau. The failure of clinical trials on amyloid-targeting monoclonal antibodies also explains these results, indicating that simple inhibition of Aβ cannot prevent disease progression [49]. Moreover, neither baseline cognitive function, neuroimaging indicators, nor their longitudinal changes were correlated with CSF sTREM2 levels, further strengthening the abovementioned results.
Besides sTREM2, microglial activation is accompanied by the release of other inflammatory factors [50]. We found that sTREM2 was correlated not only with pro-inflammatory cytokines (e.g., ICAM1 and IP-10) but also with anti-inflammatory cytokines (e.g., IL-10 and IL-9), suggesting that neuroinflammation is a complex regulatory process. TREM2 appears to counterbalance the pro-inflammatory activity of microglia [51], and its role in maintaining the neuroinflammatory balance may be concretized in sTREM2. TNF-α is a key factor in AD pathogenesis [50]; it should be noted that TNF-α, its inhibitory soluble receptors, and its downstream effectors all significantly correlated with sTREM2, suggesting an interrelation between TNF-α-mediated inflammatory pathways and sTREM2. Meanwhile, sTREM2 may also be involved in other pathways, such as the regulation of T helper cell 9 and regulatory T cells, through its association with IL-9, IL-10, and TGF β1 [52, 53]. Although sTREM2 levels were not correlated with hippocampal volume, they were correlated with neurodegeneration-related factors, including NFL and VILIP-1. We speculate that changes in cytokine levels may be more sensitive than structural changes, and the causes of structural changes are likely to be more complex. The association between sTREM2 and α-syn has also been verified in a recent study [54], further indicating that sTREM2 production is a downstream event under the influence of many pathological factors and participates in many different pathways [55]. Probably owing to the slow changes in pathologies [56] and the potential dynamic equilibrium of AD core biomarkers, we found that the increase rate of CSF sTREM2 levels was not influenced by the groups.
Our study has some limitations. First, independent data as validation sets were not used and are thus required in the future. Second, the number of samples in the A–dementia group was relatively small; there were less follow-up sTREM2 data, especially in the dementia group; and only some participants were tested for other CSF markers. Third, considering its rarity, we did not screen for mutations in TREM2. Fourth, CSF sTREM2 is not a specific biomarker, and diseases leading to neuronal damage may all lead to an increase in its level [57]; however, we did not include other neurodegenerative diseases to further prove that sTREM2 levels are not affected by phenotypes. Fifth, other characteristic pathological proteins, including TDP-43, may independently affect sTREM2 levels. Finally, some current results may be affected by the selection of cutoff values for AD core biomarkers.
In conclusion, based on a large sample of well-characterized participants with biomarker evidence of AD pathology, we proved that CSF sTREM2 levels were affected by both Aβ and tau pathologies; the mutual effects of these pathologies resulted in complex and variable CSF sTREM2 levels at different stages of AD. Additionally, we found that CSF sTREM2 levels could not predict cognitive deterioration or neurodegeneration. No one biomarker will fit all needs; as a non-specific biomarker, sTREM2 was correlated with various non-Aβ and non-tau CSF biomarkers, further proving its role in reflecting the microglia state.
Footnotes
ACKNOWLEDGMENTS
Data collection and sharing for this project was funded by the Alzheimer’s Disease Neuroimaging Initiative (ADNI) (National Institutes of Health Grant U01 AG024904) and DOD ADNI (Department of Defense award number W81XWH-12-2-0012). ADNI is funded by the National Institute on Aging, the National Institute of Biomedical Imaging and Bioengineering, and through generous contributions from the following: AbbVie, Alzheimer’s Association; Alzheimer’s Drug Discovery Foundation; Araclon Biotech; BioClinica, Inc.; Biogen; Bristol-Myers Squibb Company; CereSpir, Inc.; Cogstate; Eisai Inc.; Elan Pharmaceuticals, Inc.; Eli Lilly and Company; EuroImmun; F. Hoffmann-La Roche Ltd. and its affiliated company Genentech, Inc.; Fujirebio; GE Healthcare; IXICO Ltd.; Janssen Alzheimer Immunotherapy Research & Development, LLC.; Johnson & Johnson Pharmaceutical Research & Development LLC.; Lumosity; Lundbeck; Merck & Co., Inc.; Meso Scale Diagnostics, LLC.; NeuroRx Research; Neurotrack Technologies; Novartis Pharmaceuticals Corporation; Pfizer Inc.; Piramal Imaging; Servier; Takeda Pharmaceutical Company; and Transition Therapeutics. The Canadian Institutes of Health Research is providing funds to support ADNI clinical sites in Canada. Private sector contributions are facilitated by the Foundation for the National Institutes of Health (![]() ). The grantee organization is the Northern California Institute for Research and Education, and the study is coordinated by the Alzheimer’s Therapeutic Research Institute at the University of Southern California. ADNI data are disseminated by the Laboratory for Neuro Imaging at the University of Southern California.
). The grantee organization is the Northern California Institute for Research and Education, and the study is coordinated by the Alzheimer’s Therapeutic Research Institute at the University of Southern California. ADNI data are disseminated by the Laboratory for Neuro Imaging at the University of Southern California.