





Abstract
Background:
Virtually all adults with Down syndrome (DS) develop Alzheimer’s disease (AD) pathology, but research gaps remain in understanding early signs of AD in DS.
Objective:
The goal of the present study was to determine if unintentional weight loss is part of AD in DS. The specific aims were to: 1) examine relation between chronological age, weight, AD pathology, and AD-related cognitive decline were assessed in a large cohort of adults with DS, and 2) determine if baseline PET amyloid-β (Aβ) and tau PET status (–versus+) and/or decline in memory and mental status were associated with weight loss prior to AD progression.
Methods:
Analyses included 261 adults with DS. PET data were acquired using [11C] PiB for Aβ and [18F] AV-1451 for tau. Body mass index (BMI) was calculated from weight and height. Direct measures assessed dementia and memory. Clinical AD status was determined using a case consensus process. Percent weight decline across 16–20 months was assessed in a subset of participants (n = 77).
Results:
Polynomial regressions indicated an 0.23 kg/m2 decrease in BMI per year beginning at age 36.5 years, which occurs alongside the period during which Aβ and tau increase and memory and mental status decline. At a within-person level, elevated Aβ, decline in memory and mental status were associated with higher percent weight loss across 16–20 months.
Conclusion:
Unintentional weight loss occurs alongside Aβ deposition and prior to onset of AD dementia, and thus may be a useful sign of AD in DS.
INTRODUCTION
Individuals with Down syndrome (DS), or trisomy 21, are genetically at risk for Alzheimer’s disease (AD) [1]. The triplication of the amyloid precursor protein (APP) gene located on chromosome 21 results in a lifelong overproduction of amyloid-β (Aβ), which aggregates into extracellular plaques in the brain [2] and is associated with a cascade of pathology that likely causes AD [3, 4]. The median age of clinical onset of AD dementia in DS is in the early fifties [5, 6], and there is a 90% lifetime incidence of AD in DS [7, 8]. Studies have documented the natural history of AD in DS, including the presence of biomarkers of AD pathology [9, 10] such as positron emission tomography (PET) Aβ plaques by the fourth and fifth decade of life [11, 12] and neurofibrillary tangles of tau in the fifth decade [13, 14]. Studies have also identified the timing and sequence of AD-related cognitive decline, beginning with subtle memory declines and progressing to mild cognitive impairment (MCI-DS) and eventually dementia [15, 16]. Investigations of non-cognitive AD symptomology and signs, however, have been less studied. Unintentional weight loss has been reported with AD dementia outside of DS [17–20]; however, it is not known if unintentional weight loss is also part of AD in DS, and if so, the timing of this loss in relation to AD pathology or cognitive decline.
Weight has connections with AD in autosomal dominant and sporadic late-onset AD [17, 18]. In midlife, being overweight and/or obese is associated with an increased risk of AD [19, 20]. In contrast, unintentional weight loss (i.e., not due to intentional efforts) occurs in the years prior to AD dementia [21–23]. Buchman and others [24] reported that a one unit/year decline in body mass index (BMI) is associated with a 35% higher risk of AD dementia within 5 to 6 years. Such findings have led to the view that unintentional weight loss is part of preclinical AD, when pathological change is underway but dementia is not yet evident [25, 26]. Indeed, weight loss is associated with a lower ratio of Aβ42/Aβ40 in cerebrospinal fluid and higher PET Aβ and tau prior to AD dementia in samples from the general population [27–29]. Relatedly, Cova et al. [30] found that weight loss was associated with a 2.3 to 2.5 year earlier onset of AD dementia in older adults with MCI.
Obesity is highly prevalent in adults with DS, such that 83–85% of adults with DS are overweight (BMI 25–29.9 kg/m2) or obese (BMI > 30 kg/m2) [31, 32]. In small-scale studies, adults with DS with AD dementia had a lower BMI and evidenced greater weight loss across time than those without dementia [16, 33], suggesting that unintentional weight loss may have associations with AD in DS. However, it is not clear when weight loss occurs in the time course of cognitive decline and AD pathology and in DS.
The goal of the current study was to evaluate the relation between weight and cognitive decline and AD pathology in a large cohort (N = 261) of adults with DS from the Alzheimer’s Biomarker Consortium –Down Syndrome (ABC-DS). The aims were to: 1) describe the association between age and BMI and its relation to Aβ PET and tau PET and memory impairments and mental status at baseline; 2) examine the effect of baseline Aβ PET and tau PET status (–versus+) and clinical AD status (cognitively stable versus MCI-DS or AD dementia) on percent weight change from baseline to cycle 2 (16–20 months); and 3) determine if baseline Aβ PET and tau PET status (–versus+) and/or decline in memory and mental status was associated with percent weight loss prior to MCI-DS or AD dementia. For aim 1, age was hypothesized to be negatively associated with BMI coinciding with the timing of increases in PET Aβ and tau and decline in memory and mental status. For aim 2, elevated PET Aβ and tau (+versus –) and a clinical status of MCI-DS or AD dementia (versus cognitively stable) were expected to be associated with greater percent weight loss across the 16–20 months. For aim 3, elevated baseline PET Aβ and tau and decline in memory and mental status were predicted to be associated with greater percent weight loss prior to prodromal AD (i.e., those without MCI-DS or AD dementia).
METHODS
Participants
Analyses included 261 adults with DS aged 25–65 years from ABC-DS [34] who had two time points of BMI data. Inclusion criteria included: aged≥25 years, no conditions contraindicative for imaging (e.g., metal in the body), and no untreated medical or psychiatric conditions that alter cognition. Internal Review Boards at the local ABC-DS sites approved the study. Consent and/or assent were obtained. Table 1 provides sample socio-demographics.
Participant characteristics and mean and standard deviation for study variables at baseline
M, mean; SD, standard deviation; ID, intellectual disability; DSMSE, Down Syndrome Mental Status Examination; mCRT, modified Cued Recall Test; SUVr, standard update value ratio. *Adjusted sample sizes: Karyotype (n = 249), APOE ɛ4 (n = 254), Race (n = 256), Height (n = 251), Weight (n = 251), Body mass index (n = 251), Amyloid-β (n = 116), Tau Composite (n = 106), DSMSE (n = 258), Cued Recall (n = 251).
Procedure
Adults with DS completed multi-day visits at one of seven research sites at baseline and 16–20 months later (cycle 2). At both time points, a cognitive battery was administered, and caregivers reported on the adult with DS’s cognitive and adaptive functioning, medical, and psychiatric history. At baseline, blood was drawn to determine apolipoprotein E (APOE) status and conduct karyotyping (if medical records did not include this information). Participants at four sites underwent MRI and PET imaging. Physical (e.g., height and weight) and neurological exams were completed at both time points.
Socio-demographics
Date of birth was used to calculate age (years) at baseline. Intellectual level prior to MCI-DS or AD dementia was based on IQ and adaptive behavior testing at baseline or historical medical records and coded mild (1), moderate (2) or severe/profound (3) [34]. Karyotyping determined trisomy type (trisomy = 1, mosaic = 2, or translocation = 3) and genotyping determined APOE allele status (1 =ɛ4 present, 2 =ɛ4 absent). Caregivers reported biological sex at birth (female = 1, male = 2), and race/ethnicity, which was coded not Hispanic = 1 versus Hispanic = 2 for analyses. Caregivers reported on the prevalence of medical conditions including hypothyroidism, which was coded as 1 = present and 0 = absence.
Weight
BMI was calculated as weight in kilograms divided by height in meters squared. BMI was used in aim 1 to adjust for height differences when estimating the effect of age on BMI at baseline. For aims 2 and 3, percent weight loss was used to measure within-person weight change across the two data collection time points. Percent weight loss, rather than simply weight loss, was used to adjust for different baseline weights. Percent weight change was calculated by subtracting the participant’s weight at baseline from the participant’s weight at follow-up before dividing it by the baseline weight and multiplying by 100.
Clinical AD status
Clinical AD status was based on a case consensus process that involved a psychologist, physician, and other staff, blinded to genetic, biofluid, and imaging data. This process involved review of caregiver-reported and direct cognitive measures, adaptive functioning, and behavior and considered premorbid intellectual disability, medical and psychiatric history, and life events [34]. The AD clinical status groups followed the recommendations of the American Association on Mental Retardation and the International Association for the Scientific Study of Intellectual Disability Working Group for the Establishment of Criteria for the Diagnosis of Dementia in Individuals with Developmental Disabilities [35, 36]. Statuses were: 0 = cognitively stable, indicating no cognitive or functional decline; 1 = MCI-DS, indicating mild cognitive and/or functional decline; 2 = AD dementia, indicating marked cognitive and functional decline; and 3 = unable to determine. Participants (n = 5) with unable to determine status were excluded from the analyses.
Cognitive functioning
The modified Cued Recall Test (mCRT) [37] was used to assess episodic memory and involves learning and remembering pictures of objects across three trials. The total score is the number of correctly recalled objects during free and cued trials and is a correlate of cognitive decline and PET Aβ in DS [38, 39]. The Down Syndrome Mental Status Examination (DSMSE) [40] assessed mental status and is sensitive to MCI-DS and AD dementia in DS [41]. The mCRT and DSMSE were administered at baseline and cycle 2. A≥5% within-person change on the mCRT and DSMSE across the two time points was used as an indicator of meaningful cognitive decline, in line with estimates for the expected decline on these measures in adults with DS transitioning to AD [15, 41].
MRI and PET
PET data were acquired using [11C] PiB for Aβ and [18F] AV-1451 for tau quantification, and MRI was used for spatial registration [11]. Tracers were administered as 20–30 s bolus injections and saline flush. Data were reconstructed using iterative methods and corrected for deadtime, attenuation, scatter, and radioactive decay. Images were acquired in 5-min frames and inspected and corrected for motion on a frame-by-frame basis. Time-averaged images were 50–70 min post injection for [11C] PiB and 80–100 min for [18F] AV-1451.
PET Aβ and tau processing
PiB PET scans were analyzed with the centiloid method [42] using SPM8 software. The 50–70-min PET images were registered to corresponding T1 MR images. The MR scan was deformed to match the 152-subject template of the Montreal Neurological Institute [MN152] included with SPM8 and corresponding PET images were co-warped using the determined parameters. PiB radioactivity concentration was extracted for the centiloid standard global region and whole cerebellum [42], defined on the MNI152 template. Global SUVr was the ratio of tracer concentration in the global region to that of whole cerebellum. This tissue ratio was converted to centiloid values using linear+constant transformation specified for [11C] PiB [42].
The 80–100 min [18F] AV-1451 tau images were registered to T1 MRI and processed by FreeSurfer (FS) 5.3 to parcellate regions [43]. Tracer concentrations were extracted from the registered PET. Mayo-composite [43] SUVr was determined using volume weighted average of select FS-based components divided by the cerebellar cortex concentration.
The Aβ centiloid value and tau Mayo-composite SUVr were used to classify participants as Aβ+/–(threshold value 19) and tau+/–(threshold value 1.21) [44]. Three groups were created: Aβ-/tau -, Aβ+/tau-, and Aβ+/tau+. Three participants did not fall into these groups (Aβ-/tau+) and were removed as this profile may indicate non-AD pathology.
Data analysis
Descriptive statistics, boxplots, and correlations were used to examine variable distributions, identify outliers and associations. Analyses for aim 1 included baseline data. Linear and polynomial regressions were conducted in R Core Team version 4.2.0 [45] to examine the association between age and BMI on AD pathology (PET Aβ and tau) and cognitive decline (DSMSE and mCRT). First, the adjusted R squared for the crude effect of age on each outcome was compared using linear and polynomial regressions up to a degree of 5. The highest adjusted R squared defined the starting model. A forward stepwise regression was then used to determine the final models. Baseline socio-demographics (i.e., sex, ethnicity, clinical AD status, premorbid intellectual disability level, karyotype, and APOE ɛ4 status) were added one at a time and kept if the adjusted R squared increased, did not reduce sample size by > 50 observations, and was either significant (p < 0.05) or altered the age coefficients by≥5%. The final model had the highest adjusted R squared from the stepwise regressions.
Analyses for aim 2 and 3 examined percent of weight loss from baseline to cycle 2. Pearson correlations and chi-square statistics were used to examine the association between weight loss and baseline socio-demographics (i.e., sex, ethnicity, clinical AD status, premorbid intellectual level, karyotype, and APOE ɛ4 allele status). To test aim 2, percent weight loss was compared across the baseline PET Aβ and tau (Aβ-/tau-, Aβ+/tau -, and Aβ+/tau+), clinical AD status (cognitively stable versus MCI-DS or AD dementia), and cognitive decline status (≥5% decrease on mCRT and DSMSE versus < 5% decrease) groups. To do this, chi-square tests and one-way analyses of covariance (ANCOVAs) compared percent weight loss across the biomarker, clinical, and cognitive status groups when controlling for age and socio-demographics associated with percent weight loss. For aim 3, adults with a clinical status of MCI-DS or AD dementia were removed. A linear regression examined the effect of baseline PET Aβ and tau and cognitive decline status on percent weight loss. PET Aβ and tau and cognitive decline statuses were dummy coded and simultaneously entered into the regression with age and socio-demographics associated with percent weight loss. Interactions between PET Aβ and tau status and cognitive decline were tested and if significant retained.
RESULTS
Preliminary analyses
Table 1 presents the mean and standard deviation for study variables. Age, sex, BMI, premorbid intellectual disability level, mCRT, DSMSE, APOE ɛ4 allele, and PET Aβ were all normally distributed and contained no outliers. Tau (skew: 2.903; kurtosis: 8.045) had a positive skew. In addition, not all participants underwent imaging scans at baseline; PET Aβ and tau were available for 116 and 106 participants, respectively (n = 104 had both PET Aβ and tau). Of these participants, 77 (74%) participants had BMI and cognitive and clinical status data at baseline and cycle 2 and were included in analyses for aim 2 and 3. Participants were between the ages of 25 and 63 years with a mean age of 44.72 years (SD = 9.16). Most were White, non-Hispanic (95.8%), half were female (n = 127, 49%), and most had a mild (n = 144, 55%) or moderate (n = 90, 34%) premorbid level of intellectual disability. The majority of participants had full trisomy (n = 225, 90%); however, eight (3.2%) were mosaic and sixteen (6.4%) had translocation of chromosome 21. One-quarter of participants (n = 64, 25%) had the APOE ɛ4 allele. Mean BMI at baseline was 31.46 (SD = 7.07), with the majority being obese (n = 135, 51.7%) or overweight (n = 73, 28%). At baseline, 192 (73.6%) participants were cognitively stable, 40 (15.3%) had MCI-DS, and 29 (11.1%) had AD dementia. The majority of participants had a diagnosis of hypothyroidism (n = 159, 61%), nearly all of whom (n = 195, 97%) were taking thyroid replacement medication. There was a significant positive correlation between hypothyroidism and BMI (r = 0.219, p = 0.001). However, hypothyroidism was not significantly associated with age, AD clinical status, Pet Aβ, tau PET, DSMSE, or mCRT (r = –0.043 to 0.083, p > 0.05). Given these insignificant associations, the presence of hypothyroidism was not included in regression models.
Effect of age on BMI, PET Aβ and tau, and cognitive decline
Table 2 shows the polynomial regressions examining the effect of age on BMI and AD pathology (PET Aβ and tau) and cognitive decline (mCRT and DSMSE). Age (β= –21.2, p = 0.002), age2 (β= –14.0, p = 0.038), and age3 (β= 14.8, p = 0.027) were significantly associated with BMI using a 3rd order polynomial regression (n = 239, Adjusted R2 0.1224). This was similar to PET Aβ (age β= 308.0, p < 0.001; age2 β= 89.1, p = 0.018) in a 2nd order polynomial regression (n = 116, adjusted R2 0.6243) and PET tau (age β= 3.9, p < 0.001; age2 β= 3.6, p < 0.001; age3 β= 2.5, p < 0.001; age4 β= 1.0, p = 0.019) in a 4th order polynomial regression (n = 105; adjusted R2 = 0.6104). DSMSE and mCRT were estimated using 4th and 3rd order polynomial regressions, respectively, with only the 1st (DSMSE: age β= –49.1, p < 0.001; mCRT: age β= –34.2, p < 0.001) and 3rd (DSMSE: age3 β= 22.3, p = 0.034; mCRT: age3 β= 17.0, p = 0.02) degree age coefficients significantly associated with cognitive scores (DSMSE: n = 258, adjusted R2 0.5333; mCRT: n = 239, adjusted R2 0.5748). In the polynomial regression estimating the effect of age on BMI, there was a significant effect of sex (β= 2.6, p = 0.003) and ethnicity (β= –4.6, p = 0.037) on BMI with females (versus males) and non-Hispanic (versus Hispanic) participants having higher BMI. The mosaic karyotype was significantly associated with higher PET tau compared to those with full trisomy (β= 0.2, p = 0.045). Clinical AD status of MCI-DS and AD dementia was significantly associated with higher PET Aβ (β= 28.5, p < 0.001 and β= 63.7, p < 0.001, respectively) and tau (β= 0.4, p < 0.001 and β= 0.4, p < 0.001, respectively) and lower mCRT (β= –11.0, p < 0.001 and β= –21.0, p < 0.001, respectively) and DSMSE (β= –5.9, p = 0.004 and β= –21.6, p < 0.001, respectively) scores relative to cognitively stable. Premorbid level of moderate and severe intellectual disability were significantly associated with lower mCRT (β= –2.7, p = 0.006 and β= –7.8, p < 0.001, respectively) and DSMSE (β= –9.5, p < 0.001 and β= –24.8, p < 0.001, respectively) scores relative to mild intellectual disability.
Polynomial Regressions for the effect of age on BMI, PET Aβ, tau, Down Syndrome Mental Status Exam (DSMSE), and modified Cued Recall Test (mCRT)
Variables reported in the table include those that were significant (p < 0.05) and left in the final model. CI, confidence interval; AD, Alzheimer’s disease; ID, intellectual disability; MCI-DS, Mild Cognitive Impairment –Down syndrome; BMI, body mass index; Aβ, amyloid β; DSMSE, Down Syndrome Mental Status Examination; mCRT, modified Cued Recall Test. Final Adjusted R-squared values were 0.1224 (BMI), 0.6243 (PET Aβ), 0.6104 (PET tau), 0.5333 (DSMSE), 0.5748 (mCRT). Polynomial regression sample sizes: BMI (n = 239), PET Aβ (n = 116), PET tau (n = 105), DSMSE (n = 258), mCRT (n = 239).
Figure 1 displays the crude effect of age on each outcome: BMI, PET Aβ and tau, and cognitive decline (mCRT and DSMSE)— using the best fitting polynomial regression. To include all outcomes on a single plot, outcomes were scaled (i.e., value subtracted from mean and divided by SD). Vertical lines were added to represent the mean age of participants with MCI-DS and AD dementia and the PET Aβ and tau cut-points. Finally, the polynomial regression equation was used to identify when age becomes negatively associated with BMI (age 36.5 years) and was also represented as a vertical line.
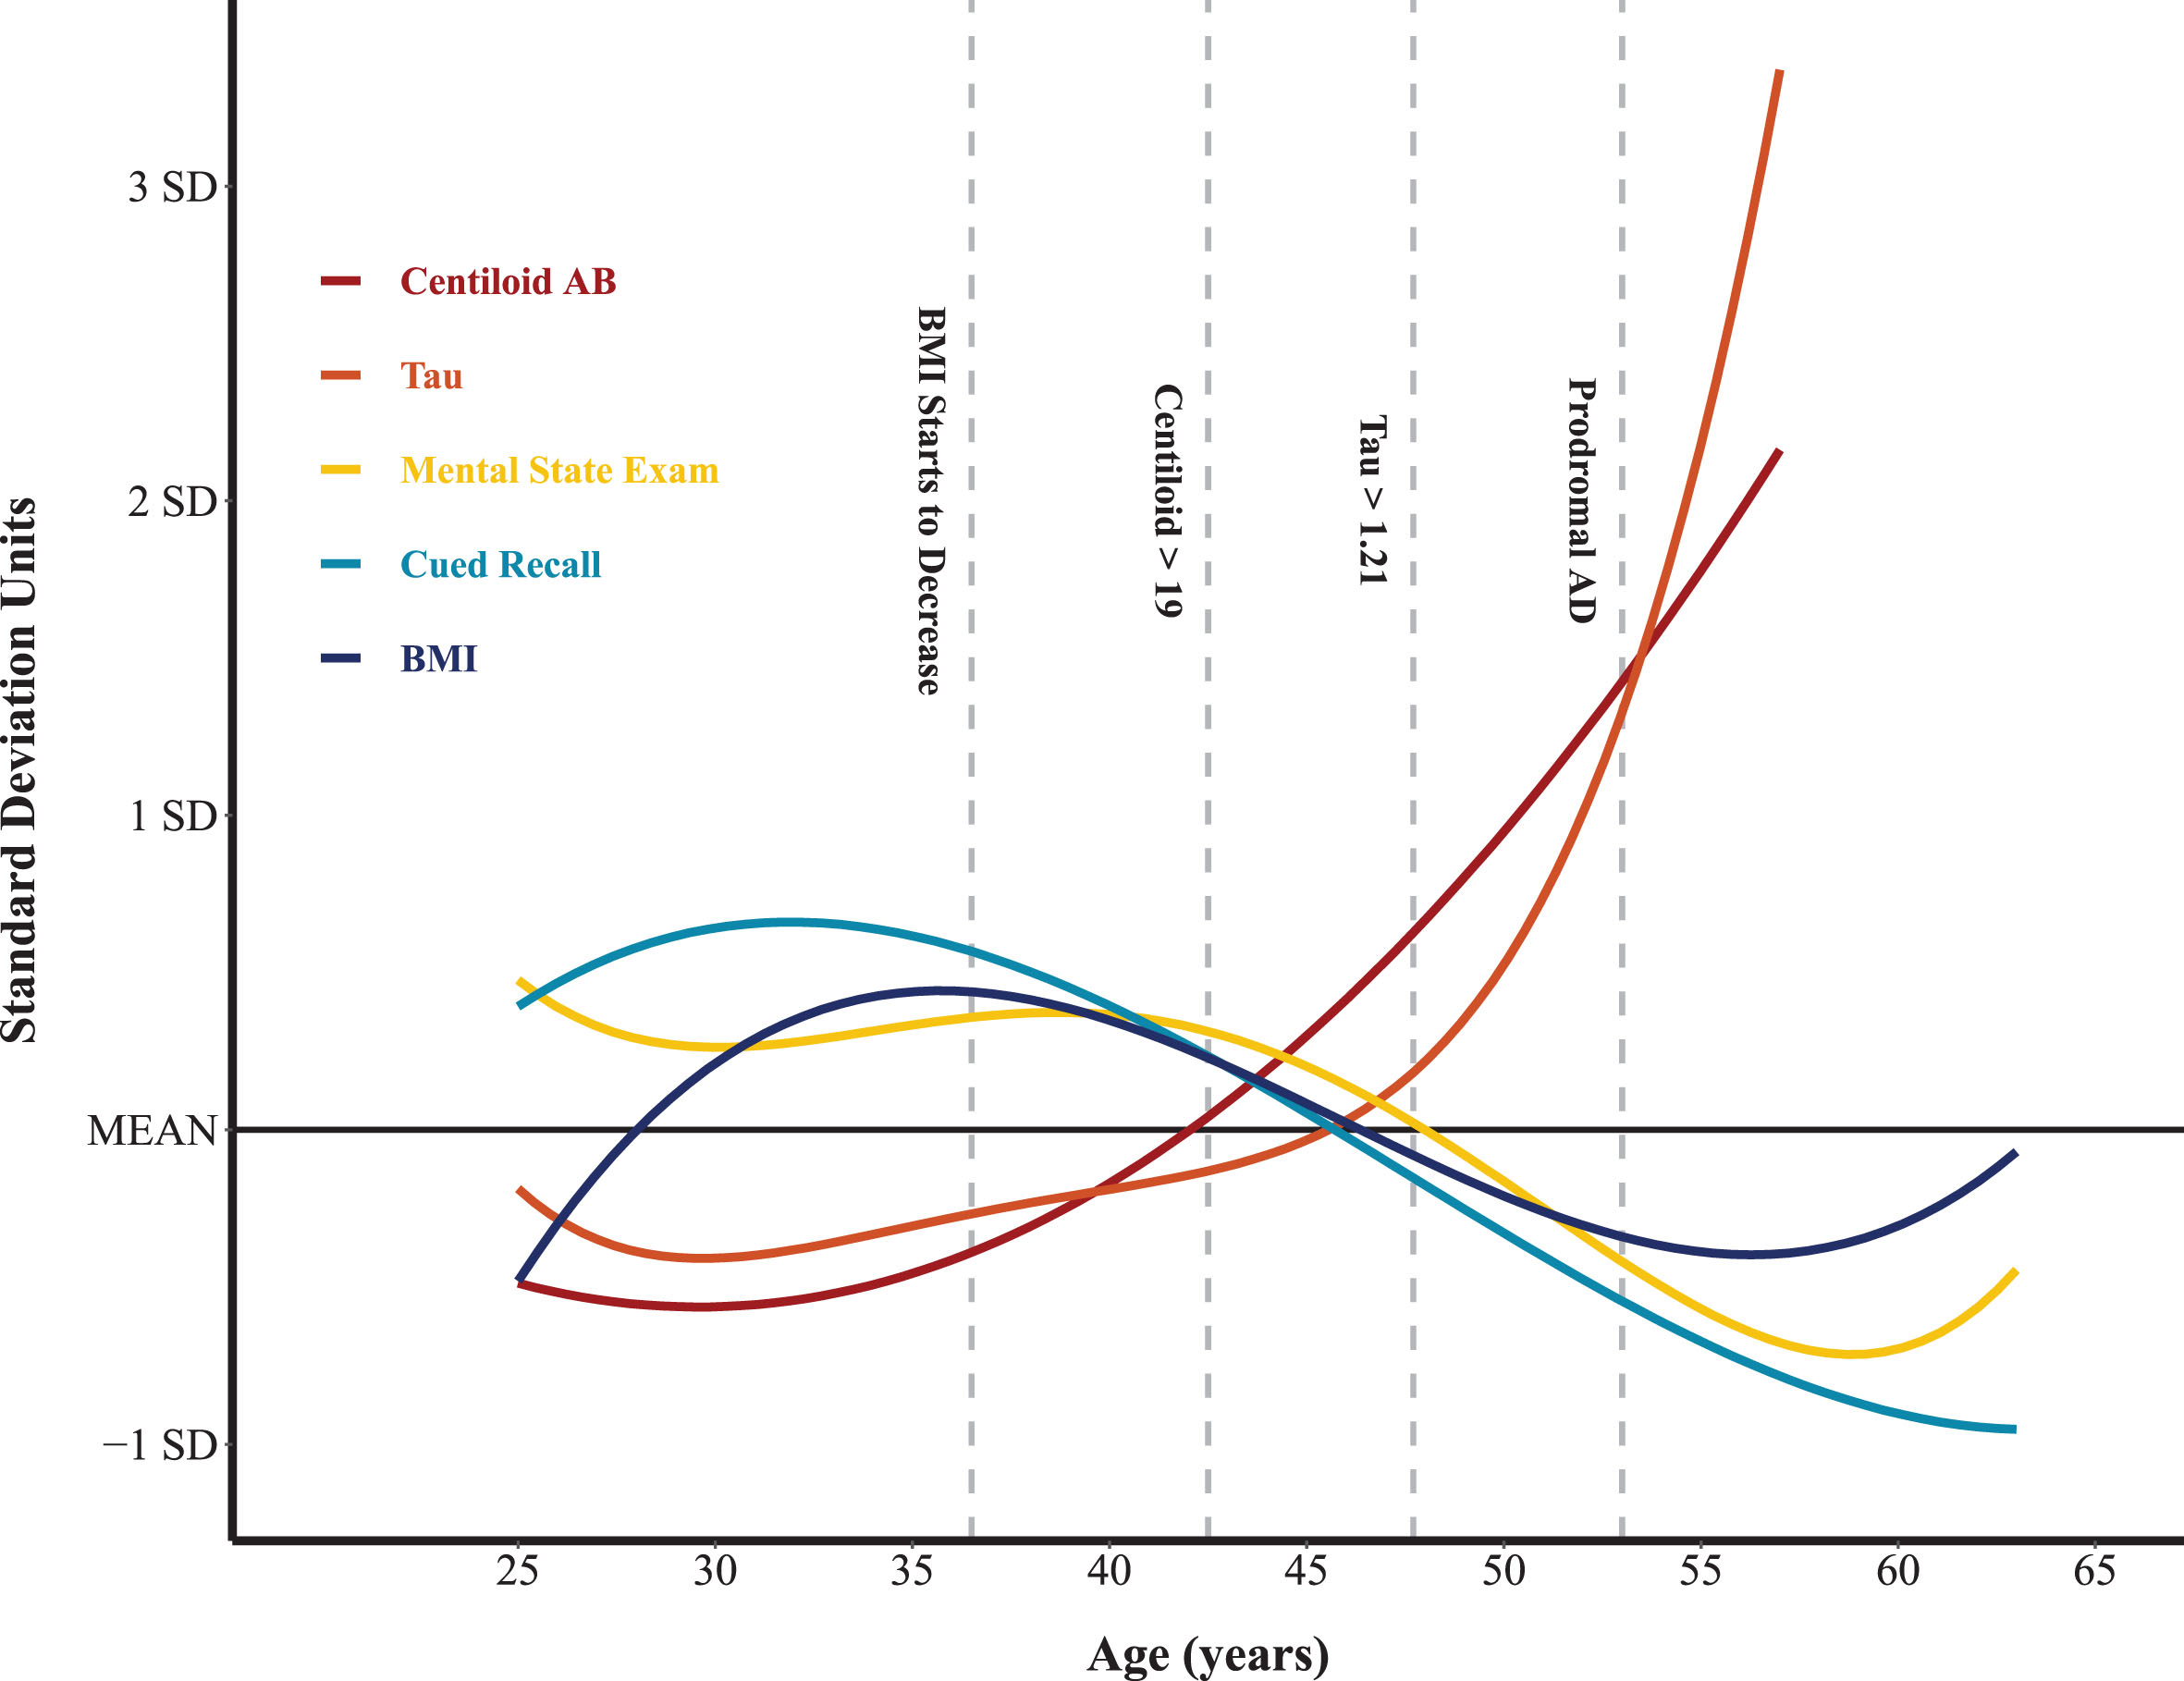
Polynomial effect of age on body mass index (BMI), Alzheimer’s disease (AD) pathology, and cognitive decline.
Percent weight loss: Baseline to cycle 2
From baseline to cycle 2, 70 (29.3%) participants had≥3% weight loss and 46 (19.2%) had≥5% weight loss. Overall, 66 (27.6%) experienced≥3% weight gain and 41 (17.2%) had≥5% weight gain. The mean weight change was –0.51% (SD = 7.37). Percent weight loss was not significantly associated with biological sex (χ2 = 0.001, p = 0.978), ethnicity (χ2 = 0.687, p = 0.407), premorbid intellectual disability level (χ2 = 5.441, p = 0.066), trisomy type (χ2 = 0.747, p = 0.688), or APOE ɛ4 status (χ2 = 2.287, p = 0.130), but was positively associated with age (r = 0.161, p = 0.010).
Figure 2 shows a boxplot of mean percent weight loss from baseline to cycle 2 by PET Aβ and tau status. A one-way ANCOVA controlling for age indicated a significant difference in percent weight loss by PET biomarker status (F (2,75) = 5.00, p = 0.009). Follow-up Bonferroni-corrected comparisons indicated that the PET Aβ-/tau- group (M = +1.40, SD = 6.16) had less weight loss than the Aβ+/tau+group (M = –5.25, SD = 6.35), with the Aβ+/tau- group (M = –1.00, SD = 1.52) not significantly different from either group. Only 18% (n = 11) of adults with DS in the Aβ-/tau- group had≥3% weight loss from baseline to cycle 2. In contrast, 27% (n = 4) of adults with DS in the Aβ+/tau- group and 56% (n = 5) of those in the Aβ+/tau+group had≥3% weight loss during this period (χ2 = 6.24, p = 0.044).
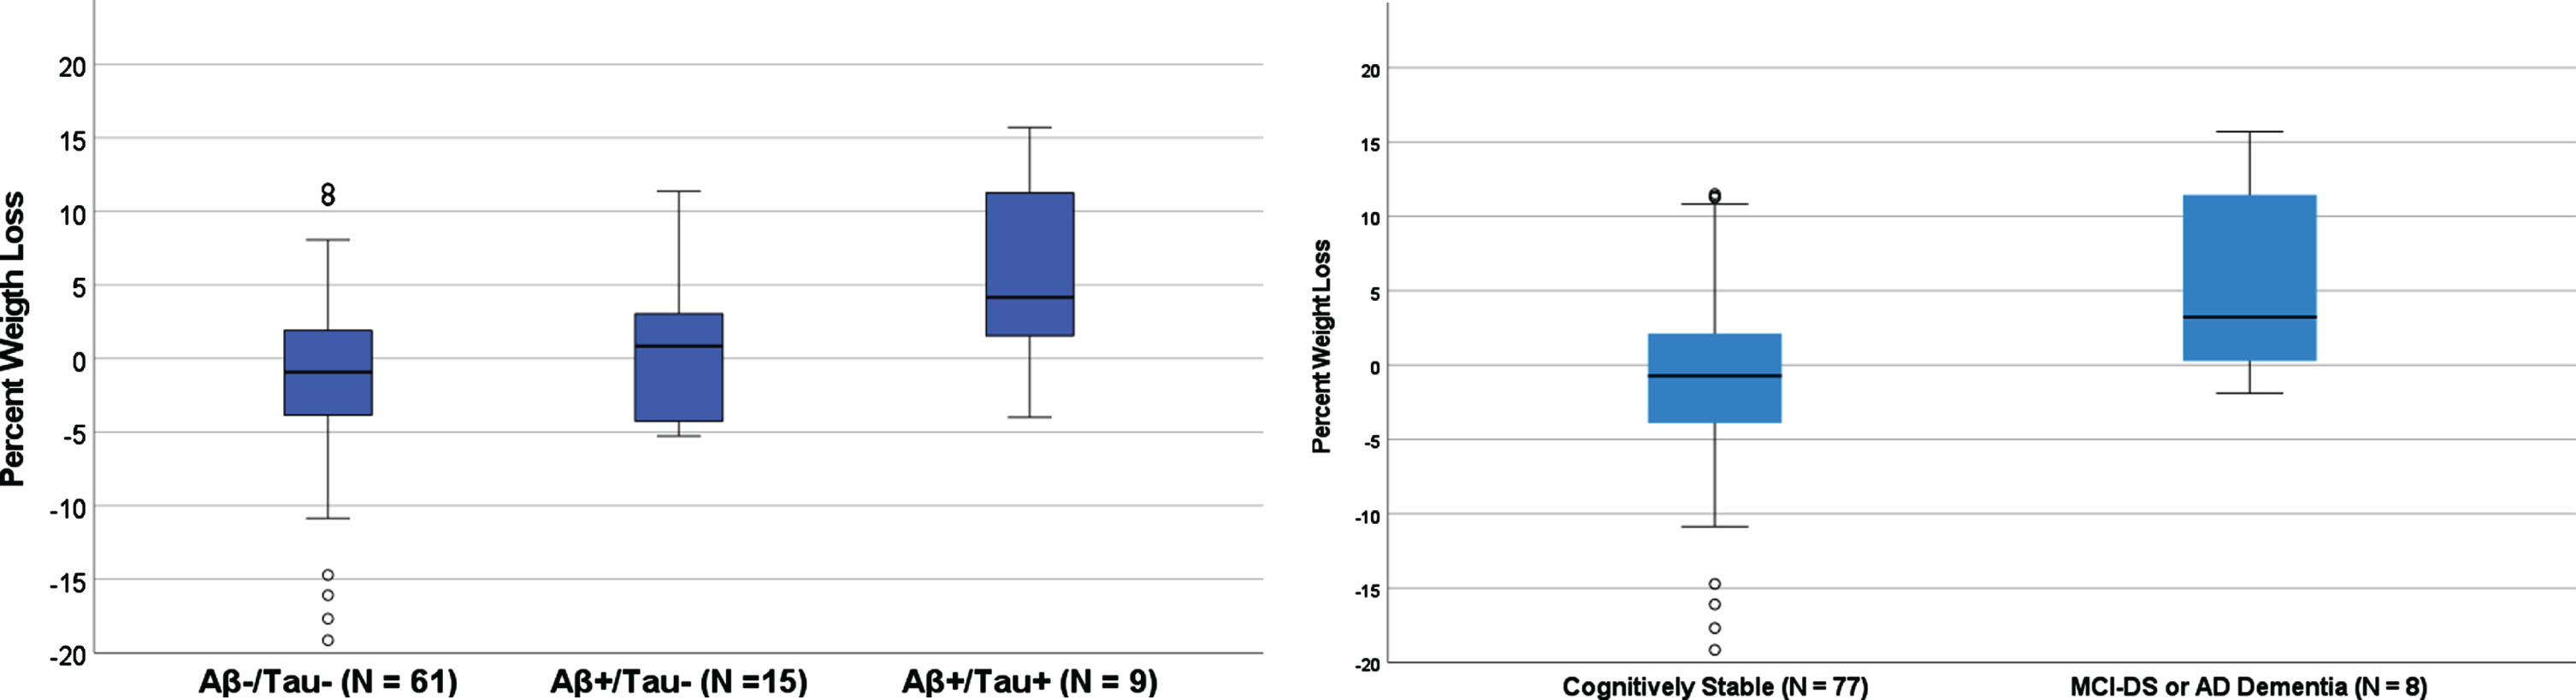
Percent weight loss by PET Biomarker Status (left) and by clinical status (right).
Figure 3 shows a boxplot of the mean percent weight loss from baseline to cycle 2. There was a significant difference in percent weight loss by clinical AD status. Only 25% (n = 45) of adults with DS in the cognitively stable group had≥3% weight loss in comparison to 40% (n = 25) of adults with MCI-DS or AD dementia (χ2 = 4.921, p = 0.027). In the ANCOVA controlling for age, there was a trend-level difference in percent weight loss from baseline to cycle 2 by clinical status group, with the cognitively stable group (M = 0.12, SD = 6.89) trending toward having less percent weight loss than adults with DS with a clinical status of MCI-DS or AD dementia (M = 1.93, SD = 8.53) (F (1,76) = 3.13, p = 0.078).
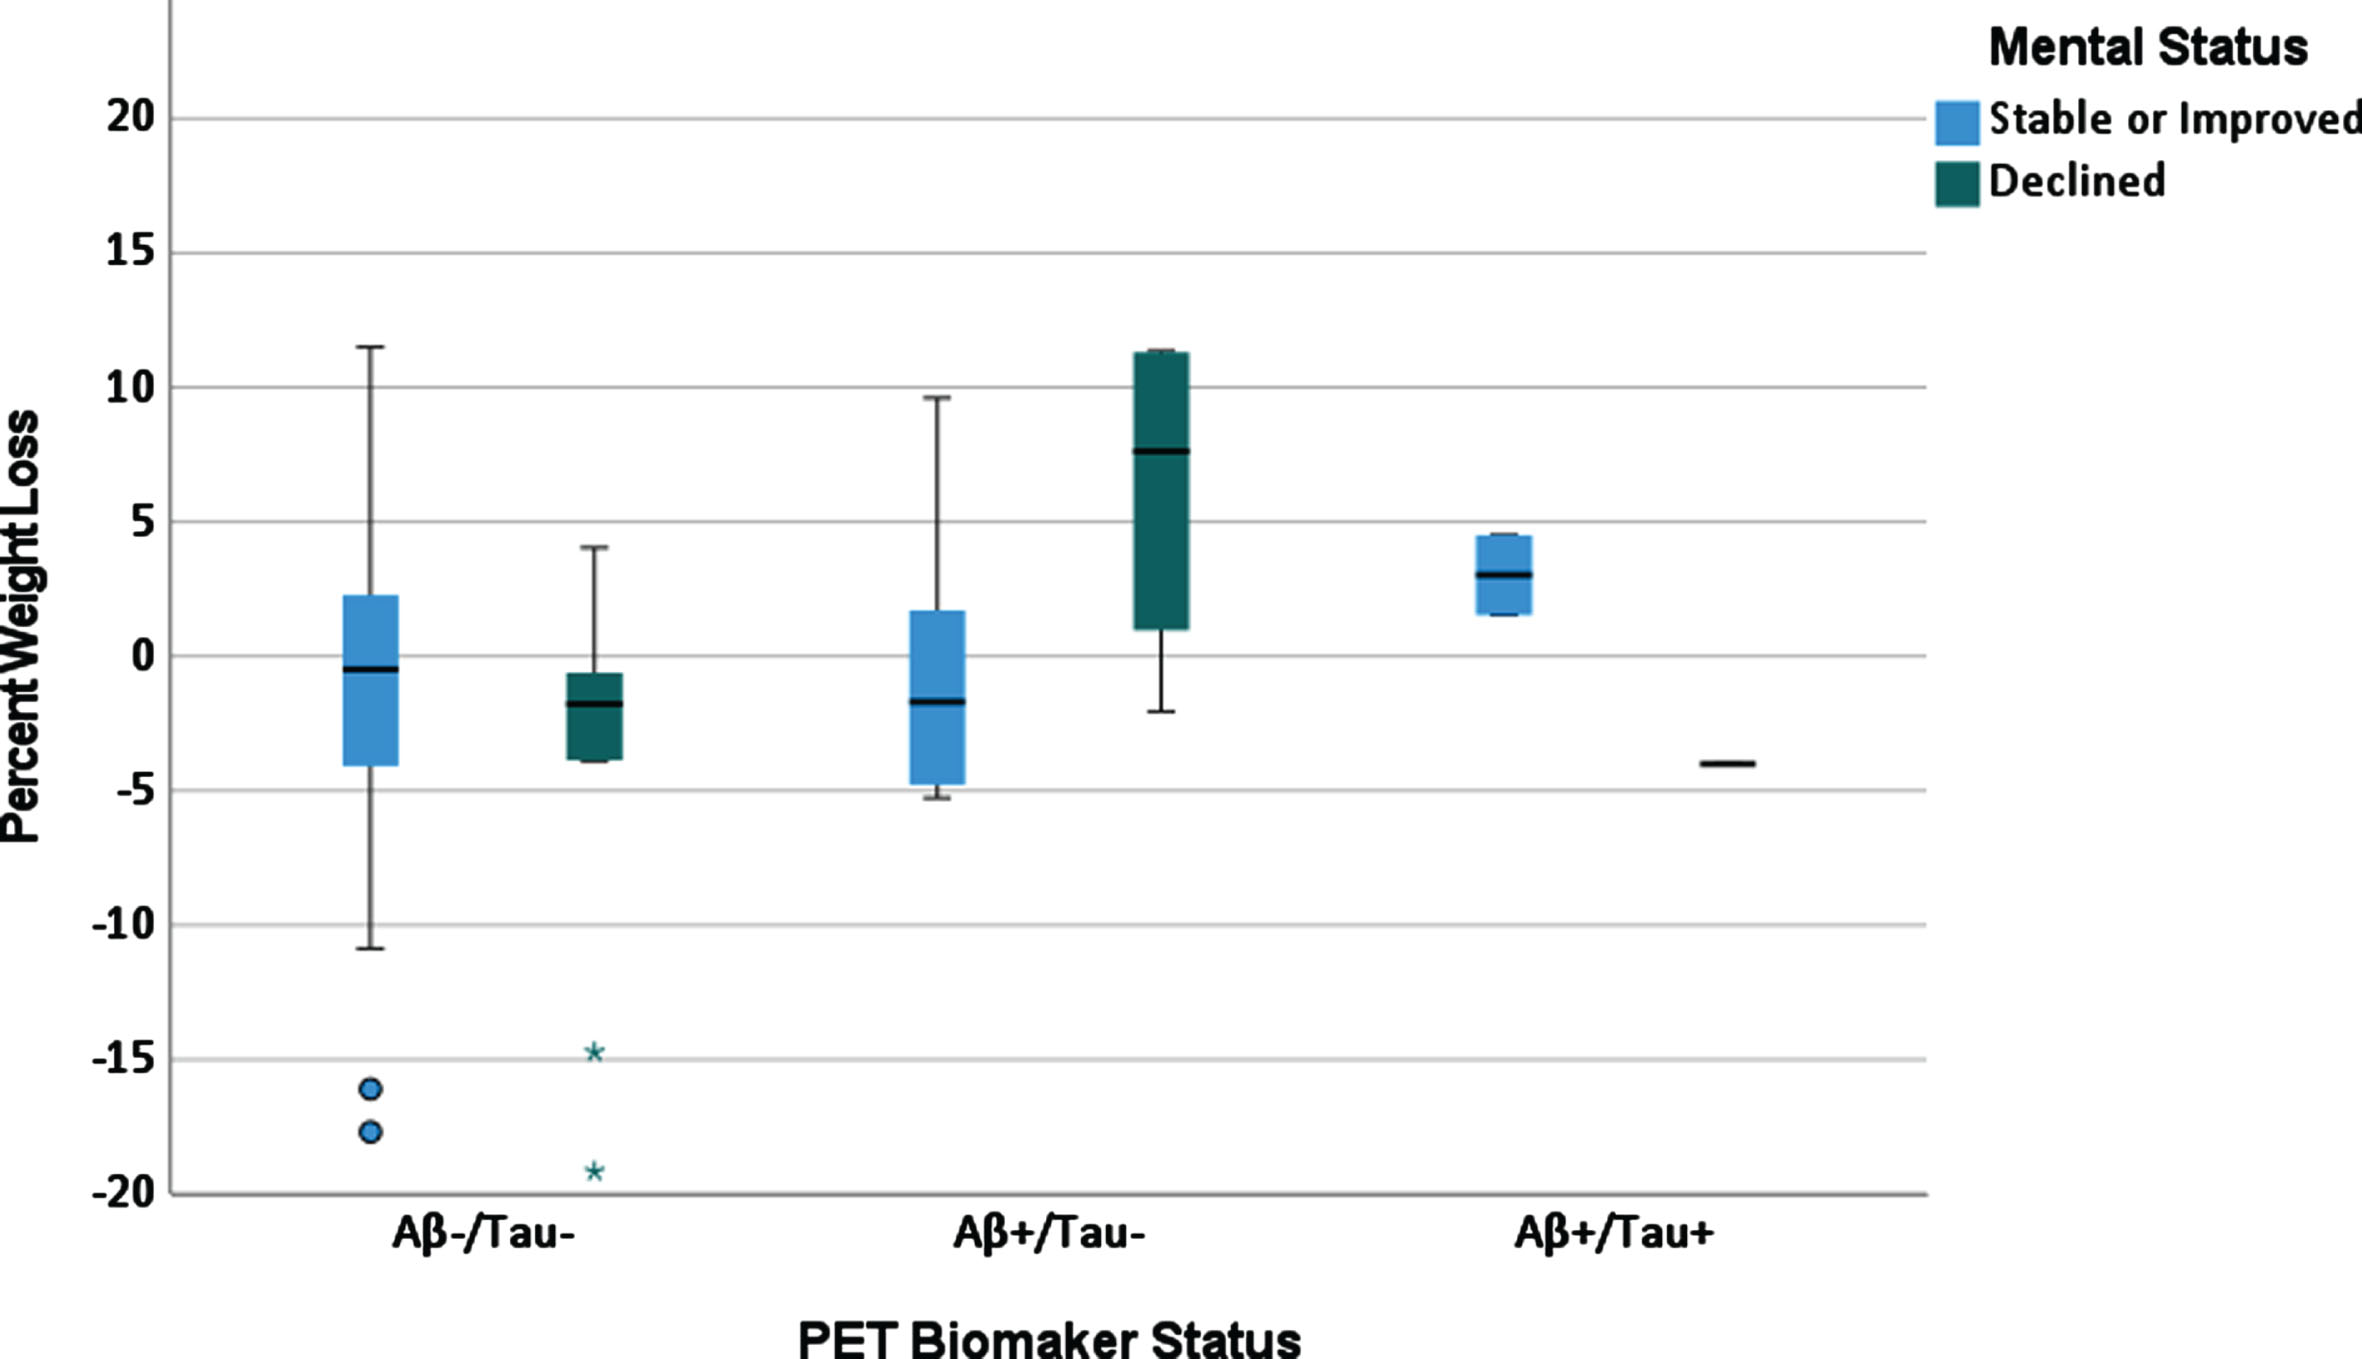
Percent weight loss by PET biomarker status and change in mental status in cognitively stable adults with Down syndrome.
Table 3 shows the linear regression model examining the association between PET Aβ/tau status, cognitive decline, and age on percent weight loss from baseline to cycle 2. There was a significant positive effect of age (β= 0.24, t = 3.12, p = 0.002) and interaction of DSMSE decline by PET Aβ-/tau- status (β= –0.21, t = 2.26, p = 0.025) on percent weight loss. The interaction is shown in Fig. 3. In the Aβ-/tau- group, percent weight loss did not differ between those who did (green bar) versus did not (blue bar) evidence DSMSE decline. In contrast, in the Aβ+/tau- group, those who had greater percent weight loss (versus no weight loss or who increased in percent weight) evidenced greater decline on the DSMSE.
Regression model predicting percent weight loss in cognitively stable adults with Down syndrome (N = 77)
Analyses included participants that had two time points of body mass index and biomarker data (N = 77). Aβ, amyloid β; mCRT, modified Cued Recall Test; DSMSE, Down Syndrome Mental Status Examination. Aβ+ = Centiloid > 19; Tau+ = Composite > 1.21.
DISCUSSION
As the field of DS prepares for clinical AD intervention trials there is an urgent need to understand clinical or biomarker changes that predict conversion to AD. Unintentional weight loss precedes cognitive decline and/or AD dementia in autosomal dominant and sporadic late onset AD populations [17, 18]. To our knowledge, this study is the first to examine the association between weight, AD pathology and cognition across adulthood in adults with DS.
In our large cohort of adults with DS, beginning at age 36.5 years, age was negatively associated with BMI. Following this age, there was an estimated 0.23 kg/m2 decrease in BMI per year; thus, the average BMI at age 50 years was 3.20 kg/m2 lower than at age 40 years. These findings suggest that unintentional weight loss may occur alongside early AD pathology, particularly beginning during the period of Aβ accumulation, which has been previously [9, 10] reported to occur in the 30 s and 40 s, consistent with current findings. This estimated age-trajectory suggests that unintentional weight loss begins prior to increases in tau, previously reported [11, 12] to occur in the 40 s and 50 s, which is consistent with findings in the current study. This age-trajectory would also mean that unintentional weight loss begins 10 or more years prior to the MCI-DS or AD dementia, which have a mean age of 53 years in the current study, consistent with previous research on other samples [5].
A higher percent of within-person weight loss across 16–20 months was associated with elevated PET Aβ and tau. Only 18% of adults with DS who were Aβ-/tau- had≥3% weight loss compared to 27% of those who were Aβ+/tau- and 56% of those who were Aβ+/tau+. These differences between the AD biomarker status groups remained when controlling for age. In line with early reports [16], adults with DS who had MCI-DS or AD dementia (40% ≥3% weight loss) had greater percent weight loss than those who were cognitively stable (25% ≥3% weight loss). However, this difference fell to a trend-level when age was controlled for in models. It is possible that unintentional weight loss most closely aligns with the timing of Aβ accumulation rather than the timing of the transition to MCI-DS or AD dementia. For example, a subset of the adults with DS with a clinical status of cognitively stable had elevated Aβ and thus may already be experiencing unintentional weight loss. Among cognitively stable adults with DS, percent weight loss across the 16–20 months was associated with cognitive decline for those with Aβ accumulation (Aβ+) but not without (Aβ–); thus, unintentional weight loss may indicate imminent AD dementia in DS as it appears to coincide with the timing of Aβ accumulation. The presence of elevated tau in addition to elevated Aβ (Aβ+/tau+) was not associated with greater percent weight loss or greater cognitive decline across the 16–20 months. The small number of adults with DS in this biomarker status group may have obscured effects. Alternatively, it is possible that unintentional weight loss is more closely aligned in time with increases in Aβ, as opposed to increases in tau. Longitudinal studies with larger sample sizes are needed to investigate these possibilities.
Our findings align with non-DS research studies such as the Alzheimer and Families study [46] and Alzheimer’s Disease Neuroimaging Initiative [47] which also reported that lower BMI and/or weight loss precede AD dementia and are linked to Aβ deposition [27]. Outside of DS, AD researchers have proposed several field biological pathways that could cause a link between unintentional weight loss and early AD pathology. One hypothesis is the Aβ plaques cause metabolic dysregulation and cachexia by increasing proton leakage within mitochondria and by activating astrocytes and microglia to increase circulating cytokine levels, which then trigger loss of fat and muscle [29, 48]. The accumulation of Aβ has also been posited to alter hypothalamus-related hormonal processes (e.g., leptin) to cause weight loss [49, 50]. It is possible that these pathways also drive a connection between the timing of unintentional weight loss and Aβ and early cognitive decline in DS, as leptin has been found to be altered in DS [51].
This study should be interpreted in light of its strengths and limitations. A strength of aim 1 was the large cohort of adults with DS spanning a large age range of adulthood. The study also included objective measures of BMI and used validated measures of cognitive functioning in DS. However, conclusions about the time-course between age, BMI, and PET Aβ and tau and cognitive decline are limited by concurrent data and when within-person change in weight was examined, this was limited to change across 16–20 months. Longer-term longitudinal studies are needed. It is possible that Aβ deposition contributes to unintentional weight loss. In contrast, unintentional weight loss could contribute to AD pathology and cognitive decline and/or a third variable could drive both. It is also possible that co-occurring medical and psychiatric conditions, or medications for these conditions contributed to weight loss in some cases. In the current sample, the majority (61%) of adults with DS had hypothyroidism. However, and the presence of hypothyroidism did not differ by age nor was it associated with AD pathology or cognitive decline. Thus, that hypothyroidism did not account for the association between reduced BMI with increased age or the connection between weight loss and Aβ or cognitive decline. Future studies should investigate the potential role of other medical and psychiatric conditions. For example, outside of DS, depression is associated with both unintentional weight loss and AD [52, 53]. It is also important for future research to report on larger cognitive batteries to determine which cognitive domains most closely align with weight loss in DS. Larger samples are also needed to determine if weight loss, or its association with AD, differs by trisomy type, as the current sample included only a small number of mosaic (n = 8) and translocation (n = 16) individuals, and thus clear conclusions cannot be made. Finally, while our focus was on unintentional weight loss, we did not collect information on cause of weight loss; it is possible that weight loss was intentional for some adults with DS
In summary, unintentional weight loss appears to occur alongside of Aβ deposition and early cognitive decline, but prior to the transition to MCI-DS and AD dementia in DS. Unintentional weight loss may thus be a useful predictor of prodromal AD in the following years for clinical practice and interventions. Future longitudinal studies are needed to identify whether unintentional weight loss has causal links with AD pathology, and especially Aβ accumulation, or if these processes occur during the same time period but are driven by different biological mechanisms.
Footnotes
ACKNOWLEDGMENTS
The authors have no acknowledgments to report.
FUNDING
The research was funded by the National Institute of Aging (R01 AG031110, U01 AG051406; R01 AG070028; U19 AG068054) and the National Institute on Child Health and Human Development (U54 HD09025; P50HD105353)
The second author of this manuscript was also supported by a Clinical and Translational Science Award (CTSA) from National Center for Advancing Translational Sciences (NCATS) awarded to the University of Kansas for Frontiers: University of Kansas Clinical and Translational Science Institute (Grant No. TL1TR002368).
CONFLICT OF INTEREST
The authors have no conflict of interest to report.
