






Abstract
Background:
Identification of older individuals with increased risk for cognitive decline can contribute not only to personal benefits (e.g., early treatment, evaluation of treatment), but could also benefit clinical trials (e.g., patient selection). We propose that baseline resting-state electroencephalography (rsEEG) could provide markers for early identification of cognitive decline.
Objective:
To determine whether rsEEG theta/beta ratio (TBR) differed between mild cognitively impaired (MCI) and healthy older adults.
Methods:
We analyzed rsEEG from a sample of 99 (ages 60–90) consensus-diagnosed, community-dwelling older African Americans (58 cognitively typical and 41 MCI). Eyes closed rsEEGs were acquired before and after participants engaged in a visual motion direction discrimination task. rsEEG TBR was calculated for four midline locations and assessed for differences as a function of MCI status. Hemispheric asymmetry of TBR was also analyzed at equidistant lateral electrode sites.
Results:
Results showed that MCI participants had a higher TBR than controls (p = 0.04), and that TBR significantly differed across vertex location (p < 0.001) with the highest TBR at parietal site. MCI and cognitively normal controls also differed in hemispheric asymmetries, such that MCI show higher TBR at frontal sites, with TBR greater over right frontal electrodes in the MCI group (p = 0.003) and no asymmetries found in the cognitively normal group. Lastly, we found a significant task aftereffect (post-task compared to pre-task measures) with higher TBR at posterior locations (Oz p = 0.002, Pz p = 0.057).
Conclusion:
TBR and TBR asymmetries differ between MCI and cognitively normal older adults and may reflect neurodegenerative processes underlying MCI symptoms.
Keywords
INTRODUCTION
Although the incidence and prevalence of Alzheimer’s disease (AD) is greater in the African American community than the Caucasian community [1, 2], African Americans remain under-represented in clinical research in the United States [3–5]. There is a need to develop more accessible AD screening measures which are cost-effective, efficient, and reliable. Here we report the results of an analysis of previously reported data [6, 7] in community-dwelling African Americans. Previously, we demonstrated that compared to controls, people with MCI showed greater reductions in resting state power in delta, theta, alpha, and beta bands after performing a motion direction discrimination task [6]. We also showed that pre-task frontal asymmetries in resting state electroencephalography (rsEEG), specifically frontal alpha asymmetry (FAA) and frontal beta asymmetry (FBA) were significant predictors of mild cognitive impairment (MCI) [7]. In this report, we extend this analysis to another index of cognitive functioning that has not been common in AD or MCI research, the theta/beta ratio (TBR).
MCI is considered to be a transitional stage between normal aging and dementia. It is characterized by problems with one or more of memory, language, thinking or judgment that, together, do not rise to the level of severe disruption of general adaptive abilities. The rate of transition to AD is higher in people diagnosed with MCI than the general population [8, 9], which has led some to suggest that it may be an early expression of the disease [10]. Recent decades have seen an increase in work on psychophysiological correlates of both MCI and AD, but much remains unknown.
While it is well known that MCI and AD result from widespread but subtle damage to neurons and their interconnections, and this should lead to changes in brain activity measured by EEG, the relationship between the neurodegeneration and scalp electrical potentials is not well understood. Without a well-established theory explaining brain waves in terms of factors known to be affected by AD (synaptic density, myelination, circuits involving hippocampus), it is currently difficult to predict which features of EEG or event-related potential (ERP) waveforms should be affected and thus may serve as reliable markers of underlying neuropathology. For example, frontal theta is associated with working memory [11] and working memory problems are characteristic of AD and some subtypes of MCI, but theta is also known to increase with age (see below), so it would be difficult to know a priori if AD/MCI would be associated with increased, decreased, or no change in theta.
Empirically, several EEG and ERP correlates of MCI and AD are known [12, 13], but their functional significance remains unclear. One of the more robust findings relating rsEEG to AD is that in healthy aging there is an increase in slow waves delta and theta relative to alpha and beta [14], and this phenomenon is exaggerated in AD [15–17]. Relative to neurologically intact controls, AD and MCI participants show higher levels of delta, lower alpha, and less alpha reactivity [18]. Missonnier et al. [19] reported less theta synchronization in progressive MCI compared to stable MCI. Contradicting this broad trend, however, several studies have reported lower theta power in rsEEG in MCI and AD [20, 21], and Babiloni et al. [22, 23] reported less alpha in amnesic MCI participants relative to controls.
Although our focus here is on rsEEG, there is an extensive literature on ERP correlates of AD, some evoked response potential correlates of AD/MCI are also relevant. Reduced auditory P1 amplitude [24], reduced and delayed visual P2 in the presence of intact visual P1 [25] and reduced and delayed P3 [26] have been observed in AD relative to neurologically intact controls. The P3 even distinguished AD from those with Korsakoff’s Syndrome [27]. The P600 marker of episodic encoding has been found to be reduced in MCI and early AD [28, 29]. In cognitively intact young adults, within-subject differences in P600 amplitude are associated with differences in evoked beta power [30], although this difference is in the opposite of the intuitive direction, in that decreased beta power was associated with increased P600 amplitude, whereas people with AD/MCI have reduced levels of both. Güntekin et al. [31] observed lower levels of evoked beta in response to target vs. non-target stimuli in MCI relative to control participants. Similar reductions in auditory event-related delta oscillations have also been reported [32].
Theta/beta ratio (TBR)
The ratio of amplitudes in the theta frequency band (around 4–7 Hz) relative to the beta band (around 13–30 Hz) has long been hypothesized to reflect cognitive functioning, particularly in attention-deficit hyperactivity disorder [33]. Originally, Lubar [33] proposed that it reflected trait arousal. Subsequent research has complicated this picture [34, 35], but in cognitively normal participants it has been associated with executive functioning, particularly attentional control [36–38], and cognitive processing capacity [39]. Both executive function and cognitive processing capacity are compromised in MCI and AD [40–42], so to the extent that TBR reflects these constructs, we would expect a higher TBR in MCI than neurologically intact controls.
To reiterate, in normal aging there is an increase in the amplitude of slow waves and decrease in fast waves, this trend is exaggerated in MCI, the TBR is presumably influenced by both phenomena, and TBR is associated with several cognitive functions compromised in MCI. Despite these indications that TBR would likely distinguish cognitively normal aging from MCI, there have been few investigations of TBR specifically in AD or MCI. Brayet et al. [43] investigated a closely related measure of slow (delta and theta) to fast (alpha and beta) waves and found that this slow/fast ratio discriminated between MCI and control participants, particularly when derived from a sleeping state. Schmidt et al. [44] found that the ratio of alpha to theta distinguished participants with probable AD from control participants. Miao et al. [45] similarly observed greater TBR for MCI and AD relative to controls which persisted across spectral decompositions computed in time windows of various widths. Dimitraidis et al. [46] studied a dietary intervention for MCI and found that TBR was reduced in people who showed improvements on neuropsychological evaluations.
Theta/beta ratio asymmetry (TBRA)
The majority of the studies of hemispheric asymmetries in EEG frequency bands have focused on the alpha frequency band and frontal region [47]. Higher-order cognitive processes are not only lateralized to different hemispheres (e.g., verbal processing to left hemisphere and visuospatial processing to the right hemisphere) but are also related to hemispheric asymmetries of the EEG spectral alpha and beta power when EEG is recorded during the performance of attentional, working, and long-term memory and learning tasks. Ray and Cole [48] found that parietal beta asymmetry was associated with cognitive demands, while temporal beta asymmetry was associated with the emotional valence of a task. Papousek et al. [49] showed that changes of working memory performance were related to changes of cortical asymmetry in resting conditions before the execution of tasks. Such findings are consistent with the idea that spontaneously occurring alterations of cortical asymmetry obtained in resting conditions can predict changes in lateralized cognitive performance.
It has been empirically validated that the beta frequency band may be more important in studies on the lateralization of cognitive processes than alpha asymmetry [48–51]. It also has been suggested that EEG beta power directly reflects activity of cortical regions effectively involved in higher-order cognitive processes [48, 52].
While TBR has been under-researched in MCI, TBRA has not been researched in any prior study of cognitive performance, using either a convenience sample of college students or a clinical population, to our knowledge. Wang et al. [53] investigated TBR laterally and found that left frontal TBR (measured at F3) but not right frontal TBR (F4) was predicted by negative emotion differentiation. Therefore, there are good reasons to wonder if resting state TBRA might serve as a meaningful index of brain health.
From a neuropathological perspective, neurodegeneration is not typically symmetric, although which hemisphere degenerates more rapidly is idiographic [54]. However, the side of greater degeneration is predictive of deficits [55, 54]. Assumptions that AD neuropathology is uniform across the brain and across the individuals was shown to be incorrect by a recent study [56]. They showed that during asymptomatic, preclinical AD, older adults, early tau deposition follows multiple trajectories and may involve different cortical regions. These authors reported about three main subtypes: asymmetrical left, precuneus predominant, and asymmetrical right. Results showed that preclinical AD participants with these three cortical tau PET patterns were younger and showed worse executive functioning than participants with preclinical AD and typical medial temporal lobe PET pattern.
Previous work has highlighted the potential importance of functional comparisons between MCI and normal groups through comparison of pre- to post-task aftereffects [6] and frontal asymmetry [7]. Here, we extend this analysis to an index of cognitive and emotional functioning that has been relatively under-investigated in MCI, the TBR and hemispheric asymmetries in TBR. The following hypotheses were tested:
Hypothesis 1: TBR is higher in MCI than in cognitively normal controls.
Hypothesis 2: TBR is more asymmetric in MCI than in cognitively normal controls.
METHODS
Details of the methods and results of the main study are given in [7]. Here, the results of an exploratory secondary analysis are reported.
Participants
The institutional review board of Wayne State University approved all procedures. Participants were recruited from the volunteer pool of Healthier Black Elders Center (HBEC), which is a collaboration between the Institute of Social Research at Wayne State Institute of Gerontology and at the University of Michigan and from the Michigan Alzheimer’s Disease Research Center (MADRC). Members of HBEC who self-reported a recent change in memory on a screening questionnaire were recruited into the study. A total of 99 participants met all inclusion criteria in the final sample. Forty-one (35 female, 6 male) were diagnosed with MCI (see below) and the remaining 58 (53 female, 5 male) serving as cognitively normal controls. The mean age for participants with MCI was 73.7 (s = 7.2) years, while for controls it was 71.1 (s = 6.2) years. This difference was not statistically significant, t(97) = 1.95, p = 0.103.
Diagnosis of MCI was by consensus conferences that included neurologists, neuropsychologists, nurses, and technicians, who reviewed neuropsychological assessments that included the National Alzheimer’s Disease Cooperating Centers (NACC) standardized evaluation battery and the Unified Dataset (UDS) [57]. Diagnoses excluded seizure disorders, psychiatric or sleep disorders, AIDS, learning disability, head injury with loss of consciousness exceeding 30 minutes, previous diagnosis of dementia, radiation therapy of the brain in the past year, history of substance use disorder, or major medical illness in the previous five years. Of those diagnosed with MCI, 13 were diagnosed as non-amnesic and 28 as amnesic, but all analyses reported here collapse across that distinction because these group sizes are unlikely to provide adequate statistical power to make distinctions between them. Everyone scored at or above 25 on the MMSE.
Neuropsychological evaluation
Participants were tested with the National Alzheimer’s Disease Coopering Centers (NACC) Unified Dataset (UDS) test battery [57]. A consensus conference that included neurologists, neuropsychologists, nurses, and technicians then reviewed UDS results. Diagnoses were made after applying exclusion criteria, including no other psychiatric or sleep disorders, head injury with loss of consciousness greater than 30 min, seizure disorder, learning disability, AIDS, radiation therapy of the brain in the past year, diagnosis of dementia, history of substance use disorder, or major medical illness in the previous five years.
EEG recording
EEG data were recorded with a Brain Vision Inc. 64-channel amplifier and Acti Cap (active electrode) system with modified International 10–20 System placement of electrodes. Online data were sampled at 500 Hz (32-bit resolution) with a 0.1–70 Hz bandpass filtering, 12 dB roll-off per octave on each side, referenced to location FCz and grounded at AFz. Impedances were kept below 10 kΩ and balanced over all channels within 5 kΩ.
Participants were seated in a chair adjusted for height, facing a computer in a dimly lit room. Resting state EEG was measured for a minimum of 3 min with eyes open and 3 min with eyes closed, with time extending up to half a minute beyond 3 min only if noisy epochs were observed, to ensure the availability of sufficient rsEEG data to obtain a minimum of 60 artifact-free 2-s epochs. This was done twice, once before and once after a motion direction discrimination task.
The motion direction discrimination task is the same one previously reported [6]. Participants indicated the direction of dots moving left or right with a button press of left or right index fingers.
EEG processing and frequency analysis
The rsEEG data were analyzed with Brain Vision Software Analyzer 2.2.2 (Brain Products GmbH, 2021). Offline inspection was used to remove epochs with excessive noise, saturation, or other obvious artifacts. The EEG was current-source density (CSD) transformed [58, 59]. CSD transforms, which are independent of reference, may be especially useful for studying frontal asymmetries [60]. In particular, Kayser & Tenke [59] demonstrate that CSD derived topographies in the frequency domain agree with referenced potential topographies in terms of location of peak power and relative power across bands but provide a sharper spatial resolution and are free of frequency-domain artifacts such as absent power bands in electrodes near references (i.e., nose or linked mastoid references that lead to flat spectra in nearby electrodes). Relative to average reference montages, CSD transformed montages give better signal-to-noise ratios. Data were segmented in 2-s epochs using a Hanning window, with automatic rejection of epochs exceeding 100 mV on any channel. This resulted in approximately 90 epochs for each participant, ranging between 64 and 115. Fast Fourier Transforms were then used to extract measures of power (area under the curve) in the delta (2–4 Hz), theta (4–8 Hz), alpha (8–12 Hz), and beta (12–30) Hz bands. We excluded frequencies above 30 Hz to avoid muscle artifacts [61].
TBRs were calculated for each channel as the ratio of power in the theta band divided by power in the beta band. Although TBR is traditionally evaluated at electrode Fz (e.g., [33]) or Cz (e.g., [62]), in this exploratory application of TBR to MCI we evaluated TBR at four points along the midline, including Fz, Cz, Pz, and Oz. We calculated TBR asymmetry as ln(RIGHT TBR) – ln(LEFT TBR) in keeping with the alpha asymmetry literature [63], using the following pairs: F3-F4, C3-C4, P3-P4, O1-O2.
Data analysis
Data analyses were conducted with SPSS 28 (IBM, Inc.). Plots were generated in JASP [64]. The multivariate approach to repeated measures was used in all ANOVAs [65]. This approach does not assume sphericity, instead taking advantage of correlations among repeated measures to increase the statistical power to detect differences between repeated conditions [66]. Analyses for both TBR and TBR asymmetry were 2 (group)×2 (timepoint)×4 (location) mixed ANOVAs. To follow up an unpredicted interaction between timepoint and location, we performed two post-hoc contrasts of the effect size of timepoint at different locations. Specifically, we compared the effect of timepoint on Oz to the average effect at Fz and Cz, and similarly the effect of timepoint on Pz to the effect at Fz and Cz. We chose this approach rather than the more common approach of testing the effect of timepoint separately at each electrode, because a pattern of significant and non-significant effects may not itself be significant [67] and therefore may not explain an interaction, but the contrasts directly test whether the effect size of one variable differs as a function of the other variable [68]. We followed this up with a parallel evaluation of TBR asymmetry.
RESULTS
TBR along the central axis
Figure 1 illustrates the topography of TBR across the scalp, separated by MCI status and timepoint. Table 1 gives cell means and confidence intervals for TBR. Figure 2A illustrates the mean TBR along the midline as a function of MCI status. There was a main effect of MCI status, F(1,95) = 4.44, p = 0.038,
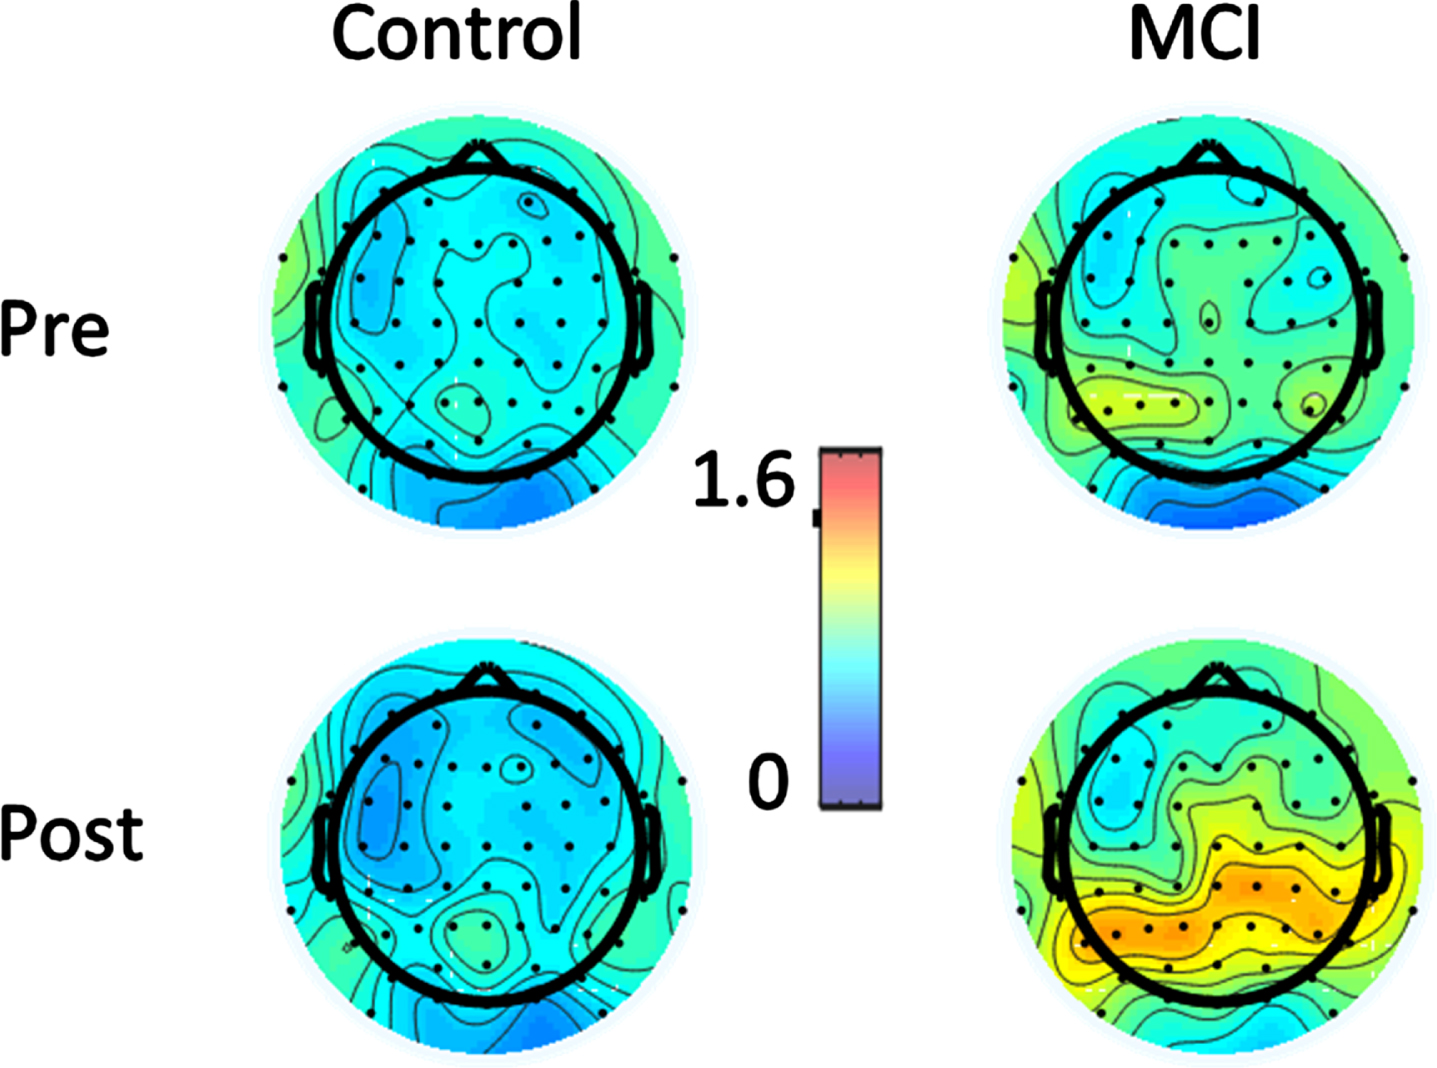
Topography of TBR as a function of MCI status and timepoint. The topographies show a higher TBR overall in MCI relative to controls, as well as an increased TBR over posterior regions post-task in both groups. Although this task after-effect appears most obvious for the MCI pre-post topographies, the interaction between MCI status and timepoint was not significant, indicating that any difference in the size of this effect as a function of MCI status is not reliable.
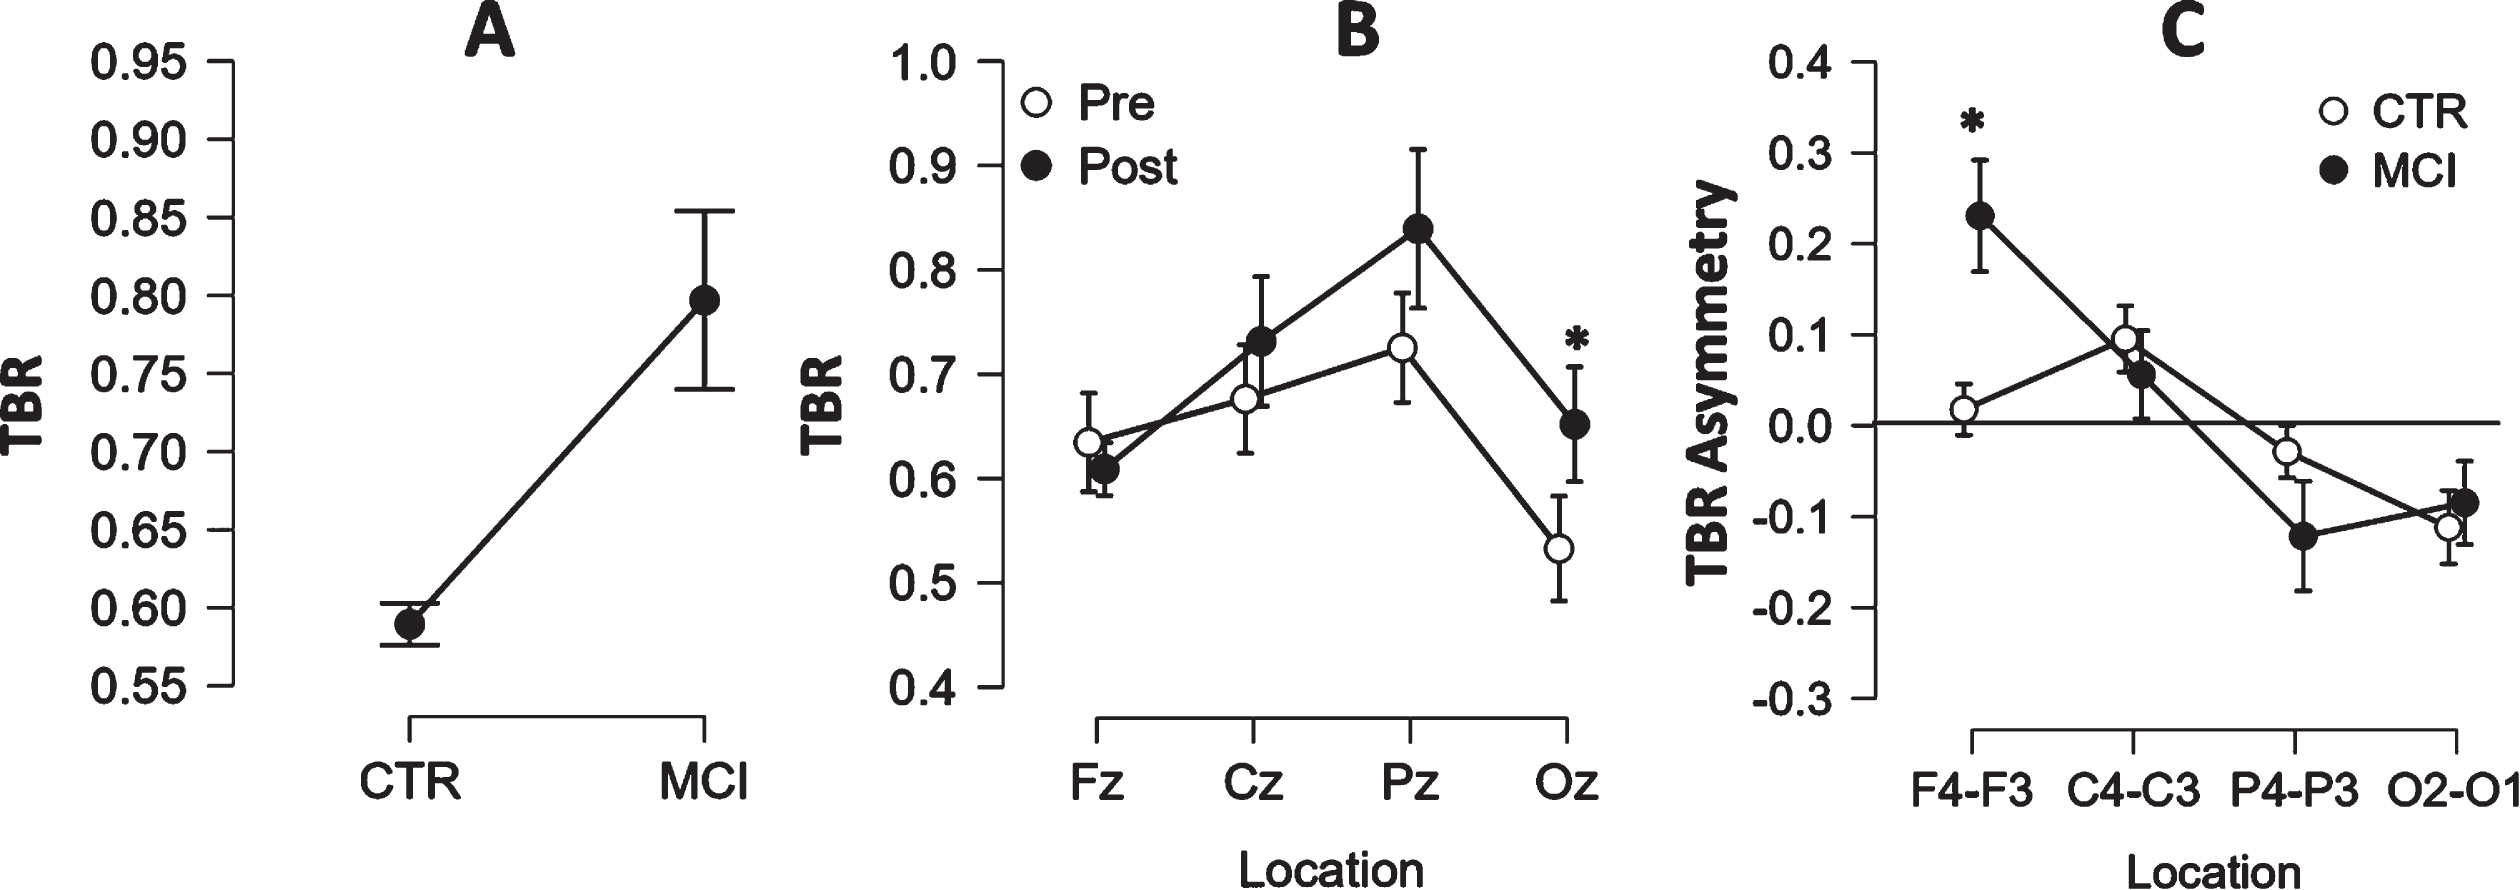
Illustration of main effects and interactions. A) The main effect of MCI status on TBR. B) The main effect of location on TBR. Significant differences between timepoints are marked with an asterisk. C) The main effect of location on TBRA. Significant differences between groups are marked with an asterisk. Bars represent standard errors. CTR, neurologically intact controls; MCI, mild cognitive impairment.
Cell means for the analysis of TBR
Cell means, standard errors, and confidence limits for the 2 (MCI status) X 2 (timepoint) X 4 (location) mixed ANOVA of TBR.
We collapsed across categories of MCI (amnesic, N = 28, and non-amnesic, N = 13) because these sample sizes were not adequate to distinguish between them. However, concern that this distinction might be driving the hemispheric asymmetries led us to re-run this analysis excluding non-amnesic MCI (naMCI) participants. The pattern of results was the same, with the same significant main effects and interaction, indicating that this asymmetry was not driven predominantly by naMCI participants.
TBR asymmetry
Figure 2C presents means for the analysis of TBR asymmetry. Cell means for the ANOVA analyzing TBR asymmetry are presented in Table 2. There was a main effect of location, F(3,93) = 8.744, p < 0.001,
Cell means for the analysis of TBR asymmetry
Cell means, standard errors, and confidence limits for the 2 (MCI status) X 2 (timepoint) X 4 (location) mixed ANOVA of TBR asymmetry. Positive scores indicate greater TBR on the right, while negative scores indicate greater TBR on the left.
DISCUSSION
This study sought to investigate TBR and hemispheric TBR asymmetry measured in rsEEG both before and after a cognitive task as a marker of MCI status in this sample of community-dwelling African American adults. Differences between those with MCI and cognitively-normal controls were observed both in the magnitude of the TBR as well as in topographic distribution and asymmetry.
We found that TBR, which was originally proposed as a marker for attention-deficit hyperactivity disorder [33], is higher in older people diagnosed with MCI than neurologically intact older individuals, independent of timepoint or scalp location. This is consistent with a rich and growing literature on increased power in the slow frequency bands delta and theta and decreased power in the faster bands alpha and beta, found in normal aging and exaggerated in MCI/AD [13–16], but ties this phenomenon to a specific metric commonly used in investigations of other pathologies and in normal cognitive performance in intact (usually college student) participants.
The growing interest in TBR is evident in recent studies examining the diagnostic utility of this metric in several clinical conditions beyond attention-deficit hyperactivity disorder, including encephalopathy in individuals with diabetes and end-stage renal disease [69], differentiating dementia from depression [70], and even the effects of screen time on attention years later [71]. A recent intervention study of participants with MCI found that decreases in TBR occur in concert with improvements in executive function and working memory domains [72], further reinforcing the role of TBR in attentional processes and related domains. Because TBR is a relatively straight forward measure and has well-established AD classification parameters, TBR can be calculated in short periods of time making it an ideal measure for compact, real-time assessment in a clinical setting [35].
To better understand the complex relationships between the frequency bands, different analytical techniques have been attempted. When examining TBR and interactions between other frequency bands, Maturana-Candelas and colleagues [73] used an additional, third-order transformation of power spectra data and obtained similar results: increased power of slower delta and theta with decreased alpha and beta were found in AD, and the discrepancy increased with disease severity. Using a different analytical technique in an intervention trial, Dimitraidis et al. [46] found that theta/beta effect size ratios were reduced in cases with corresponding improvements in neuropsychological evaluations. Although these alternative evaluation methodologies may provide additional and compelling information, they represent a departure from the established clinical norms and may be not yet appropriate for a diagnostic application.
We also found that MCI differ from controls in hemispheric asymmetry of TBR. At both pre-test and post-task, frontal TBR is right-skewed (greater on the right) in MCI but not in healthy controls, while for both groups it is greater on the left at posterior locations. Asymmetries in neurodegeneration and hypometabolism are known to occur in AD, although no consistent pattern has been identified [54, 55], which makes this pattern challenging to interpret. The most straightforward interpretation is that in this sample the right frontal lobe was relatively more advanced in its decline in the MCI subjects, but we are aware of no similar pattern reported using other measures, such as PET, MRI, or fMRI.
We also found that the TBR increases at posterior sites, but not frontal or central sites, in both groups, after about twenty minutes of engagement with a motion direction discrimination task. This may reflect the relatively active processing required in visual areas V1, V3a, and V5/MT+ by the task, and therefore suggests that TBR might be a candidate for tracking a return to baseline resting state after cognitive engagement [6].
Limitations
This was a secondary analysis of correlational data, so it has all the usual limitations of correlational data. Additionally, because this was a secondary analysis, the new phenomena we report here should be replicated in an independent sample before they are given high confidence. Furthermore, some authors have questioned the utility of TBR or any ratio between frequency bands on the grounds that it is a less-precise measure of aperiodic activity [35]. Nonetheless, TBR has been well-established as a reliable diagnostic marker in conditions like attention-deficit hyperactivity disorder and even excessive electronic screen time in infants [71], which could improve TBR’s appeal for use in a clinical setting.
Finally, our sample consisted of community-dwelling African American older adults, a group under-represented in AD/MCI research. While we have no reason to suspect that findings from this study would differ in other racial or ethnic groups, we cannot be certain about the generalizability of these findings until our methods are replicated in other populations.
Conclusions
Despite the limitations of this study, the results suggest that TBR indexes important parameters of brain functioning in healthy aging that differ in mild cognitive impairment. With further validation in large and diverse samples, TBR offers a compelling opportunity for clinical evaluation following previously established methodologies in attention-deficit hyperactivity diagnostic applications. It would be beneficial to our understanding if future research was able to tie structural and metabolic brain data to differences in TBR between MCI and healthy controls.
Footnotes
ACKNOWLEDGMENTS
The authors have no acknowledgments to report.
FUNDING
This research was in part supported by grants from NIA/NIH, 1R21AG046637-01A1, 1R01AG054484-01A1, Alzheimer’s Association Award HAT-07-60437 grant, in part by the Slovenian Research Agency (research program P1-0285 and research projects N1-0062, J1-9110, J1-9187, J1-1694, N1-0159, J1-2451, N1-0209) to RP, and a grant from the Slovenian Research Agency, P3-0366/2451 to VK and by partial support for KK & BG from NIH/NIA grant P30AG053760 to the Michigan Alzheimer’s Disease Research Center (MADC).
CONFLICT OF INTEREST
The authors have no conflict of interest to report.
DATA AVAILABILITY
The data will be made publicly available upon completion of this research project.