






Abstract
Background:
Altered glutamatergic neurotransmission may contribute to impaired default mode network (DMN) function in Alzheimer’s disease (AD). Among the DMN hub regions, frontal cortex (FC) was suggested to undergo a glutamatergic plasticity response in prodromal AD, while the status of glutamatergic synapses in the precuneus (PreC) during clinical-neuropathological AD progression is not known.
Objective:
To quantify vesicular glutamate transporter VGluT1- and VGluT2-containing synaptic terminals in PreC and FC across clinical stages of AD.
Methods:
Unbiased sampling and quantitative confocal immunofluorescence of cortical VGluT1- and VGluT2-immunoreactive profiles and spinophilin-labeled dendritic spines were performed in cases with no cognitive impairment (NCI), mild cognitive impairment (MCI), mild-moderate AD (mAD), or moderate-severe AD (sAD).
Results:
In both regions, loss of VGluT1-positive profile density was seen in sAD compared to NCI, MCI, and mAD. VGluT1-positive profile intensity in PreC did not differ across groups, while in FC it was greater in MCI, mAD, and sAD compared to NCI. VGluT2 measures were stable in PreC while FC had greater VGluT2-positive profile density in MCI compared to sAD, but not NCI or mAD. Spinophilin measures in PreC were lower in mAD and sAD compared to NCI, while in FC they were stable across groups. Lower VGluT1 and spinophilin measures in PreC, but not FC, correlated with greater neuropathology.
Conclusion:
Frank loss of VGluT1 in advanced AD relative to NCI occurs in both DMN regions. In FC, an upregulation of VGluT1 protein content in remaining glutamatergic terminals may contribute to this region’s plasticity response in AD.
INTRODUCTION
Alzheimer’s disease (AD) is a chronic neurodegenerative disorder associated with a complex clinical-pathological spectrum [1, 2]. It is characterized neuropathologically by extracellular deposits of fibrillar amyloid-β (Aβ) peptides in the brain parenchyma (plaques) and intracellular neurofibrillary tangles composed of hyperphosphorylated tau proteins. These AD hallmark lesions are accompanied by a variety of coexisting pathologies [3–5] as well as impairments in synaptic structure and loss of synaptic proteins [6–11]. Loss of synapses is a well-established biopathological correlate of impaired cognition and dementia in AD [12–17], while the relative contributions of amyloid and tau lesions to cognitive impairment is less clear. Although there is loss of total synapse number [10, 18–20] and general markers of pre- and post-synaptic elements [11, 21–24] in AD, co-occurring synaptic changes in specific neurotransmitter systems and their association with neuropathology burden and cognitive status during the progression of AD are not well understood.
Impaired synaptic transmission in glutamatergic neuronal circuits is believed to play a key role in the etiology of AD and contribute to the onset of dementia [25–31]. Synaptic availability and release of glutamate, the principal excitatory neurotransmitter in the central nervous system [32] is, in part, regulated by its uptake into presynaptic vesicles by vesicular glutamate transporter (VGluT) proteins [33]. Two major subtypes of VGluT proteins are type 1 (VGluT1) and type 2 (VGluT2) that define glutamatergic presynaptic terminals in cortico-cortical and thalamo-cortical circuitry, respectively [34–42]. Although a reduction of VGluT proteins is postulated as a mechanistic link between glutamate dysfunction and neuropathology in AD [43–45], findings are inconsistent possibly due to differences in brain areas examined, the stages of disease represented in the population, and the method of detection (e.g., protein measurements or bouton counts). For example, biochemical studies have reported a loss of VGluT1 in lateral parietal (BA39) and occipital (BA17) [44] and dorsolateral prefrontal (BA9) cortex [46] in AD, while changes in VGluT2 were more variable. Reduced VGluT2 protein levels have been reported in AD frontal cortex [46] but others have shown stable measures in frontal, temporal, parietal, and occipital cortex [44, 47] in AD. While biochemical analyses of brain tissue homogenates can detect changes in synaptic protein levels, immunohistochemical methods provide the cellular specificity, resolution, and topographic localization needed to analyze disease related changes in synaptology in specific cortical regions and cell layers. In this regard, a light microscopic study found a reduction of VGluT1-immunoreactive profiles in lamina III-IV of parietal and occipital cortex in AD compared to controls [44]. Using quantitative VGluT1 immunohistochemistry, another study reported that VGluT1-immunoreactive presynaptic bouton density in lamina III of the dorsolateral prefrontal cortex (BA 46/9) was lower in clinically mild and severe AD cases and paradoxically higher in prodromal AD (mild cognitive impairment, MCI) [43] compared to cognitively intact subjects, suggesting a transient early upregulation of glutamatergic synapses. The latter finding adds to the wealth of information supporting plasticity within the frontal hub of the default mode network (DMN) connectome that undergoes neuropathologic, metabolic, and connectivity changes early in AD [48–62]. Whether VGluT2 containing presynaptic bouton alterations mimic those related to VGluT1 in the frontal cortex, and the status of VGluT1 and VGluT2 in other hubs of the DMN including the precuneus cortex, remains under-investigated despite showing a high pathology burden early in AD [63–65] and that 60–70% of presynaptic terminals in the precuneus are glutamatergic, with a smaller proportion containing both VGluT1 and VGluT2[66].
The present study used confocal microscopy combined with an unbiased stereological design to quantify VGluT1- and VGluT2-immunofluorescent profiles, markers of cortico-cortical/intra-cortical and thalamo-cortical presynaptic glutamatergic synapses, respectively, in lamina III of the precuneus cortex. Postmortem tissue was obtained from clinically and neuropathologically well-characterized NCI, MCI, and early AD participants in the Rush Religious Order Study (RROS) [67–70], and severe AD cases from the University of Pittsburgh Alzheimer’s Disease Research Center (ADRC) [71]. We hypothesized that VGluT1-positive terminals in the precuneus cortex are diminished, while VGluT2-positive terminals remain stable across the clinical-pathological stages of AD. In the same diagnostic groups, we also quantified densities of spinophilin-positive postsynaptic dendritic spines in the precuneus and determined the status of VGluT1- and VGluT2-positive terminals and spinophilin-positive postsynaptic dendritic spines in the frontal cortex, the region reported to display an upregulation of VGluT1 in MCI [43].
METHODS
Standard protocol approvals and patient consents
Rush University Medical Center and the University of Pittsburgh’s Committee for Oversight of Research and Clinical Training Involving Decedents approved this study. Written informed consent for research and brain autopsy was obtained for all subjects.
Subjects
A total of 80 cases were examined that included 60 participants from the RROS, a longitudinal clinicopathologic study of aging and AD in retired Catholic clergy [67–70] and 20 cases from the University of Pittsburgh ADRC [71]. The demographic, clinical, and neuropathological characteristics of the cases contributing precuneus and frontal cortex samples are summarized in Tables 1 and 2, respectively. Of the 60 RROS cases, 20 contributed precuneus only, 24 contributed frontal cortex only, and 16 contributed samples from both cortical regions. Of the 20 University of Pittsburgh ADRC cases, 10 cases contributed precuneus and 10 cases contributed frontal cortex tissue. The diagnosis of AD was made using standard diagnostic criteria [72]. The diagnosis of MCI was defined as impairment on neuropsychological testing, but without diagnosis of dementia by the examining neurologist, the criteria also used at other centers [73, 74]. Based on these criteria, and the last clinical evaluation within 12 months before death, the RROS cases were assigned to three clinical diagnostic groups: NCI (Mini-Mental State Exam, MMSE range 25–30), MCI (MMSE range 19–29), and mild to moderate AD (mAD, MMSE range 17–27). The AD cases from the University of Pittsburgh ADRC were clinically classified as moderate to severe AD (sAD, MMSE range 1–18). The neuropathology evaluation included immunohistochemical analyses of Aβ, phosphorylated tau, α-synuclein, and transactive response DNA-binding protein (TDP-43), as well as routine hematoxylin and eosin and Bielschowsky silver staining [75, 76]. Cases with stroke, Parkinson’s disease or hippocampal sclerosis were excluded from the study. Neuropathologic diagnosis was based on the National Institute on Aging (NIA)– Reagan Institute (RI) criteria (NIA-RI) [77], recommendations of the Consortium to Establish a Registry for Alzheimer’s Disease (CERAD) [78], and Braak staging of neurofibrillary tangles [79]. Application of the new NIA-Alzheimer’s Association guidelines [80, 81] to the examined cohorts is currently ongoing. All cases were de-identified and randomly assigned a unique 8-digit identifier that was used throughout the study. Investigators were blinded to case demographics and diagnosis throughout the experiment.
Tissue preparation
The precuneus (medial BA7) and dorsolateral frontal cortex (BA9) were dissected at autopsy and immersion fixed in 4% paraformaldehyde made in 0.1 M (pH 7.2) phosphate buffer (PB) for 48–72 h at 4°C. Following fixation, samples were cryoprotected in 10% glycerol with 2% dimethyl sulfoxide (DMSO) in 0.1 M phosphate buffer at 4°C for two days, followed by immersion in a solution of 20% glycerol and 2% DMSO. Tissue samples were cut on a freezing sliding microtome at 40μm thickness and sections were stored in cryoprotectant at –20°C until processed further.
Immunohistochemistry for vesicular glutamate transporters 1 and 2 and spinophilin
To minimize potential variations across multiple sets of tissue sections processed using the immunofluorescence procedure, each of three batches of processed tissue sections included an equal number of cases from each clinical diagnostic group. Sections from select cases were included in all batches to monitor chemical batch-to-batch variation. Immunofluorescence using antibodies generated against VGluT1 or VGluT2 was performed on two sections per case, as described previously [82]. Free-floating tissue sections were washed in PB for 5 min three times to remove the cryoprotection solution. Antigen retrieval was performed by heating the sections in 10 mM sodium citrate buffer (pH 8.6) at 80°C for 75 min. The sections in the antigen retrieval solution were then cooled first at room temperature followed by immersion in an ice bath (approximately 7°C), each for 5 min. After cooling, the sections were removed from the antigen retrieval solution and incubated in the blocking solution “A” (5% goat serum, 5% human serum, 0.5% Triton X-100, 0.1% lysine, and 0.1% glycine made in PB) for 3 h at room temperature. Sections were then rinsed in the blocking solution “B” (1% donkey serum, 1% human serum, 0.3% Triton X-100, 0.1% lysine, and 0.1% glycine made in PB) for 5 min three times. Sections were then incubated in a cocktail of a guinea pig anti-VGluT1 IgG (AB5905, Millipore, Billerica, MA), and a rabbit anti-VGluT2 IgG (V2514, HY-19; Sigma-Aldrich, St. Louis, MO) made in blocking solution B for 96 h. The specificity and labeling patterns of these antibodies have been reported previously [82]. Following primary antibody incubation, sections were rinsed in blocking solution B for 5 min three times and then incubated for 24 h at 4°C in a cocktail of donkey anti-guinea pig Alexa Fluor 594-conjugated (1:500; ThermoFisher, Waltham, MA, #A-11076) and donkey anti-rabbit Alexa Fluor 647-conjugated (1:500; ThermoFisher, #A-31573) secondary antibodies diluted in blocking solution B.
Spinophilin immunofluorescence was performed on two sections of frontal cortex per case, using tissue sections adjacent to those analyzed for VGluT profiles as previously detailed for the precuneus [83]. Briefly, free-floating tissue sections were incubated in a polyclonal rabbit anti-spinophilin antibody (Millipore, Temecula, CA, #AB5669) [83] for 96 h at 4°C. The specificity and selectivity of the spinophilin antibody was described in a previous publication [83]. Following primary antibody incubation, sections were incubated for 24 h at 4°C in biotinylated donkey anti-rabbit secondary antibody (1:200; Jackson, West Grove, PA, #711-066-152), followed by a 24-h incubation at 4°C with a Cy5-streptavidin conjugate (1:500; Jackson, #016-170-084).
A fluorescent counterstain for Nissl substance (Neurotrace, ThermoFisher, #N21480) was used to delineate cortical lamina III [84]. Sections were mounted onto charged slides (Superfrost Plus, ThermoFisher), coverslipped with ProLongtrademark Diamond Antifade Mountant (ThermoFisher, # P36970) and sealed with Sally Hansen nailhardener.
Cyano-PiB and X-34 histofluorescence procedure and percent area analysis of fibrillar Aβ and tau burden
Tissue sections adjacent to those processed using VGluT1, VGluT2, and spinophilin immunofluorescence were stained separately with cyano-PiB, a marker of fibrillar Aβ in amyloid plaques [85, 86], and the fluorescent Congo red derivative X-34, a pan-amyloid marker of fibrillar Aβ and tau aggregates [87, 88]. For cyano-PiB staining, sections were incubated in 10 mM cyano-PiB for 45 min, dipped three times in potassium phosphate buffer (PBK, 0.1 M, pH 7.4), followed by a 1-min differentiation in PBK, and coverslipped with Fluoromount G (Electron Microscopy Services, Hatfield, PA) [86]. For X-34 staining, sections were washed in PBK three times followed by a 10-min incubation in X-34 (100μM) solution, then dipped five times in tap water before incubating sections in 0.2% NaOH made in 80% unbuffered ethanol for 2 min. Sections were then rinsed in tap water for 10 min and coverslipped with Fluoromount G [88]. Percent area coverage for cyano-PiB- and X-34-labeled Aβ plaques was determined in three randomly spaced microscopic fields (using a 10× objective) in each of two sections from the same cases used for VGluT1, VGluT2, and spinophilin quantification. Percent area values were obtained by dividing cyano-PiB and X-34 labeled area by total area sampled. To assess the relationship of VGluT1 and VGluT2 immunoreactive profiles with amyloid dye-labeled plaques, a separate set of sections double-immunostained for VGluT1 and VGluT2 were subsequently stained with cyano-PiB.
Confocal sampling and image collection
Image collection was performed as previously described [84]. Briefly, image stacks were acquired using an Olympus BX51WI upright microscope (Olympus, Center Valley, PA) equipped with an Olympus DSU spinning disk confocal, an ORCA-R2 CCD camera (Hamamatsu, Bridgewater, NJ), an MBF CX9000 front-mounted digital camera (MBF Bioscience, Williston, VT) and a BioPrecision2 XYZ motorized stage with linear XYZ encoders (Ludl Electronic Products, Ltd., Hawthorne, NY). The microscope was controlled using Stereo Investigator (MBF Bioscience) and SlideBook software (Intelligent Imaging Innovations, Denver, CO). Using Stereo Investigator software, the borders of cortical lamina III were defined and 14 sites per case were identified within the laminar borders for analysis using systematic uniform random sampling. At each sampling site, tissue thickness was measured. Image stacks were collected using a 60×, N.A. 1.4, super-corrected objective, with a step size of 0.25μm between Z-axis planes, starting from 4μm below the tissue surface closest to the cover glass and stepping up until the tissue surface was reached, yielding a 4μm thick (Z-axis depth) stack comprised of 16 individual two-dimensional planes. Image planes were 512×512-pixels (approximately 55×55μm). Exposure time during image stack acquisition was optimized for each site, and differences in exposure were normalized during analysis. Guard zones of 10 pixels were applied around all edges in the X and Y dimensions of each stack, and ten Z-axis planes starting four planes below the cover glass were included in analysis, as antibody penetration was uniform (profile counts and intensities were uniform, not shown) across these Z-axis depths (four planes x 0.25μm step size = 1μm disector height). In our quantitative analysis, sampling sites were automatically selected through systematic uniform random sampling using Stereo Investigator and therefore blind to cyano-PiB plaque burden status, preventing the potential bias of selecting only cyano-PiB-positive or only cyano-PiB-negative microscopicfields.
Post-processing and quantification of vesicular glutamate transporters VGluT1 and VGluT2 and spinophilin immunoreactive profiles
Image stacks were post-processed using SlideBook and Automation Anywhere software (Automation Anywhere, Inc., San Jose, CA) as previously described [82]. Images were then processed using a blind deconvolution algorithm (AutoQuant; Media Cybernetics, Rockville, MD). To improve edge detection during image segmentation, for each image stack two new channels were made by convolving the VGluT1 and VGluT2 channels with a Gaussian function of standard deviations σ= 2 and σ= 0.7. The channel transformation with the larger standard deviation (σ= 2) was then subtracted from the one with the smaller standard deviation (σ= 0.7) to make new channels. Intensity segmentation was then coupled with morphological selection using an iterative masking approach [89] where the Otsu algorithm was used to determine the intensity threshold for the first iteration. After each segmentation step, mask objects were size gated to select immunoreactive profiles (0.1 to 2μm3 for VGluT1, 0.05 to 2μm3 for VGluT2, and 0.03 to 0.5μm3 for spinophilin) and merged with the mask generated in the prior segmentation step. Profile mean intensity was extracted from these image stacks through the generated mask to identify objects of interest and normalized to the exposure time for that stack. The density of VGluT1- and VGluT2-immunoreactive boutons as well as spinophilin-immunoreactive dendritic spines was determined by dividing the total number of masked objects counted per each case (Q) by the total volumes, which is the product of the number of sampling sites per case (CF), the area of the counting frame at each site in μm2 (2,823), and the disector height (1μm) multiplied by the microtome block advance (40μm) divided by the measured tissue section thickness at each site (tq) to correct for tissue shrinkage [90] asfollows:
Cortical thickness estimation
The thickness of precuneus and dorsolateral frontal cortex cortical lamina III in each case was measured on low magnification images (1.25× objective) from sections stained with Neurotrace using the calibrated measuring tool in ImageJ (ImageJ, U. S. National Institutes of Health, Bethesda, Maryland, USA). Two sections per case were used for quantification.
Statistical analysis
The Kruskall-Wallis test was used to test group differences for cyano-PiB, X-34, protein immunoreactivity measures, and cognitive measures. Chi-square analysis was used to determine if sex, APOE ɛ4 allele, and pathology group frequencies differed between clinical groups. Spearman correlation was used to assess associations between protein immunoreactivity measures as well as cyano-PiB- and X-34-labeled pathological burden, and cognitive measures. Statistically significant correlations were analyzed using robust regression models that adjusted for age at death, sex, education, and APOE ɛ4 carrier status. A secondary analysis of VGluT immunoreactivity was performed after dividing the NCI group into Low Pathology (LP-NCI) and High Pathology (HP-NCI) subgroups. LP-NCI cases were defined as having a NIA-RI diagnosis of No AD or Low Likelihood of AD, CERAD rating of No or Possible AD, and Braak stages 0–III for neurofibrillary tangles. HP-NCI cases were defined as having a NIA-RI diagnosis of Moderate or High Likelihood of AD, CERAD rating of Probable or Definite AD, or Braak stage IV–VI for neurofibrillary tangles. False Discovery Rate was used to correct for multiple comparisons among correlations and robust regression models, VGluT1 density, VGluT1 intensity, VGluT2 density, VGluT2 intensity were considered as dependent variables in the analyses. Statistically significance was set at p < 0.05.
RESULTS
Case demographic, clinical, and neuropathological characteristics
Cases contributing precuneus samples
Demographic, clinical, and neuropathological classification data for NCI, MCI, mAD, and sAD groups are shown in Table 1. Among the four groups, years of education, postmortem interval, sex, and APOE ɛ4 carrier frequency were not significantly different; however, sAD cases were significantly younger than the mAD group (Kruskall-Wallis statistic = 8.776, p = 0.0324; Dunn’s multiple comparisons, p = 0.0346) (Table 1).
Demographic, clinical, and neuropathological characteristics across clinical-pathological diagnostic groups for cases contributing precuneus samples to the study
aKruskal-Wallis one-way analysis of variance; bChi-square analysis. AD, Alzheimer’s disease; ANOVA, one-way analysis of variance; CERAD, Consortium to Establish a Registry for Alzheimer’s Disease; MCI, mild cognitive impairment; mAD, mild to moderate AD; NIA-RI, National Institute on Aging-Reagan Institute; NCI, no cognitive impairment; PMI, postmortem interval; sAD, moderate to severe AD; SD, standard deviation. *APOE ɛ4 data not available for one case.
There were significant group differences in the MMSE scores (Kruskall-Wallis statistic = 32.87, p < 0.001): the mAD group performed worse than the NCI group (Dunn’s multiple comparisons, p = 0.0148) and the sAD group performed worse than the NCI group and the MCI group (Dunn’s multiple comparisons, p < 0.001 and p = 0.0051, respectively).
The four clinical groups differed significantly by CERAD diagnosis (Kruskall-Wallis statistic = 24.19, p < 0.001; NCI, MCI < sAD, Dunn’s multiple comparisons, p < 0.001 and p = 0.0123, respectively), Braak stage (Kruskall-Wallis statistic = 23.54, p < 0.001; NCI, MCI, mAD < sAD, Dunn’s multiple comparisons, p < 0.001, p = 0.0091, and p = 0.0496, respectively), and likelihood of AD by the NIA-Reagan Institute (NIA-RI) criteria (Kruskall-Wallis statistic = 26.32, p < 0.001; NCI, MCI < sAD, Dunn’s multiple comparisons, p < 0.001 and p = 0.0085, respectively) (Table 1).
Spearman rank order correlation analysis revealed statistically significant associations between lower MMSE scores with higher Aβ pathology burden determined by cyano-PiB staining (rs = –0.6087, p < 0.0001) and with higher total amyloid burden using X-34 staining (rs = –0.6000, p < 0.0001) (both determined in precuneus sections adjacent to those used for VGluT analyses) as well as greater severity of AD neuropathology according to the NIA-RI criteria (rs = –0.6954, p < 0.0001), CERAD diagnosis (rs = –0.6053, p < 0.0001) and Braak stage (rs = –0.7030, p < 0.0001). Robust regression analysis controlling for demographic and biological variables revealed statistically significant correlations between MMSE and Aβ pathology burden quantified by cyano-PiB (β= –1.73, 95% CI (–2.23, –1.23), p < 0.001) and total amyloid burden quantified by X-34 (β= –1.48, 95% CI (–2.10, –0.87), p < 0.001), but not with NIA-RI criteria (β= –2.62, 95% CI (–6.18, 0.93), p = 0.16), CERAD diagnosis (β= –1.48, 95% CI (–3.54, 0.59), p = 0.17), or Braak stage (β= –1.36, 95% CI (–2.81, 0.10), p = 0.08).
Cases contributing frontal cortex tissue
Demographic, clinical, and neuropathological classification data for NCI, MCI, mAD, and sAD groups are shown in Table 2. As observed for the precuneus cases, years of education, postmortem interval, sex, and APOE ɛ4 carrier frequency were not significantly different among the four clinical diagnostic groups, but the sAD cases were significantly younger than the mAD and MCI cases (Kruskall-Wallis statistic = 17.22, p < 0.001, Dunn’s multiple comparisons, p = 008 and p = <0.001, respectively) (Table 2).
Demographic, clinical, and neuropathological characteristics across clinical-pathological diagnosis for cases contributing frontal cortex samples to the study
aKruskal-Wallis one-way analysis of variance; bChi-square analysis. AD, Alzheimer’s disease; ANOVA, one-way analysis of variance; CERAD, Consortium to Establish a Registry for Alzheimer’s Disease; MCI, mild cognitive impairment; mAD, mild to moderate AD; NIA-RI, National Institute on Aging-Reagan Institute; NCI, no cognitive impairment; PMI, postmortem interval; sAD, moderate to severe AD; SD, standard deviation.
Like the precuneus analysis, clinical and neuropathological variables were significantly different among the four case groups that formed the frontal cortex samples (Table 2). There were significant group differences in the MMSE scores (Kruskall-Wallis statistic = 36.61, p < 0.001): the mAD and sAD groups performed worse than the NCI group (Dunn’s multiple comparisons, p = 0.002 and p < 0.001, respectively) and the sAD group also performed worse than the MCI group (Dunn’s multiple comparisons, p = 0.001). The four clinical groups also differed significantly by CERAD diagnosis (Kruskall-Wallis statistic = 25.36, p < 0.001; NCI, MCI < sAD and NCI < mAD, Dunn’s multiple comparisons, p < 0.001, p = 0.0042 and 0.0059, respectively), Braak stage (Kruskall-Wallis statistic = 33.29, p < 0.001; NCI, MCI, mAD < sAD, Dunn’s multiple comparisons, p < 0.001, p = 0.0061 and p = 0.0317, respectively), and likelihood of AD by the NIA-Reagan Institute criteria (Kruskall-Wallis statistic = 28.36, p < 0.001; NCI, MCI < sAD and NCI < mAD, Dunn’s multiple comparisons, p < 0.001, p = 0.0040 and p = 0.0191 respectively) (Table 2).
Spearman rank order correlation revealed statistically significant associations between MMSE with cyano-PiB-labeled amyloid plaque burden (rs = –0.5467, p < 0.0001) and with X-34-labeled total amyloid burden (rs = –0.5627, p < 0.0001) (both determined in frontal cortex sections adjacent to those used for VGluT and spinophilin analyses) as well as severity of AD neuropathology by NIA-RI criteria (rs = –0.7126, p < 0.0001), CERAD diagnosis (rs = –0.6163, p < 0.0001) and Braak stage (rs = –0.7322, p < 0.0001). Robust regression analysis controlling for demographic and biological factors showed that the associations with MMSE remained significant for the three neuropathological diagnostic measures (NIA-RI criteria, p < 0.001; Braak stage, p < 0.001; CERAD criteria, p = 0.005) and X-34 total amyloid burden (p = 0.03), but not for the cyano-PiB plaque load (p = 0.07) in the frontal cortex.
Precuneus synaptic profile analyses
VGluT protein immunoreactivity in precuneus lamina III
VGluT1 and VGluT2 immunofluorescence appeared as well-defined bright puncta that were co-distributed across the imaged areas within lamina III of the precuneus in the NCI cases (Fig. 1A–C). Similar qualitative patterns of VGluT1 and VGluT2 immunofluorescence were observed in the precuneus from MCI (not shown) and mAD cases (Fig. 1D–F). The sAD group had markedly fewer VGluT1-labeled profiles (Fig. 1G, I), but not VGluT2-labeled profiles (Fig. 1H, I), compared to the other three groups. Both transporter proteins were scarce within cyano-PiB labeled amyloid plaques (Fig. 1J–L). Unbiased quantitative analysis of precuneus VGluT1-immunoreactive profile densities confirmed the lack of significant differences among the NCI, MCI, and mAD groups, while a significantly lower density of VGluT1-positive profiles was detected in sAD compared to the other three groups (Fig. 2A, Table 3). The four groups did not differ statistically when compared for intensity of VGluT1-immunoreactive profiles, a surrogate measure of relative protein level (Fig. 2B, Table 3), or density and intensity of VGluT2-immunoreactive profiles (Fig. 2C, D, Table 3) in the precuneus. The thickness of lamina III of the precuneus was not different among the four clinical groups (not shown).
Spinophilin protein immunoreactivity in precuneus lamina III
Unbiased quantitative analysis showed statistically lower densities of spinophilin-immunoreactive profiles in the mAD and sAD groups compared to the NCI, and in the sAD group compared to MCI, as well as statistically significantly lower intensity of spinophilin-immunoreactive profiles in the mAD and sAD groups compared to NCI and MCI (Table 3) previously [84].
Clinical group differences for vesicular glutamate transporter and spinophilin immunoreactivity measures obtained in the precuneus cortex
aKruskal-Wallis one-way analysis of variance. *These data were published previously [84]. AD, Alzheimer’s disease; ANOVA, one-way analysis of variance; NCI, no cognitive impairment; MCI, mild cognitive impairment; mAD, mild to moderate AD; sAD, moderate to severe AD; SD, standard deviation; VGluT, vesicular glutamate transporter.

Vesicular glutamate transporter 1 (VGluT1) immunoreactive (red fluorescence, precuneus: A, D, G, J; red fluorescence, frontal cortex: A’, D’, G’, J’) and VGluT2 immunoreactive (green fluorescence, precuneus: B, E, H, K; green fluorescence, frontal cortex: B’, E’, H’, K’) profiles in precuneus lamina III from a case with no cognitive impairment (NCI, precuneus: A, B, C; frontal cortex: A’, B’, C’), a case with mild AD (mAD, precuneus: D, E, F; frontal cortex: D’, E’, F’) and a case with severe Alzheimer’s disease (sAD, precuneus: G, H, I and J, K, L; frontal cortex G’, H’, I’ and J’, K’, L’). Scale bar = 15μm (A–L); 18μm (A’–L’). References to colors refer to the online version of the manuscript.
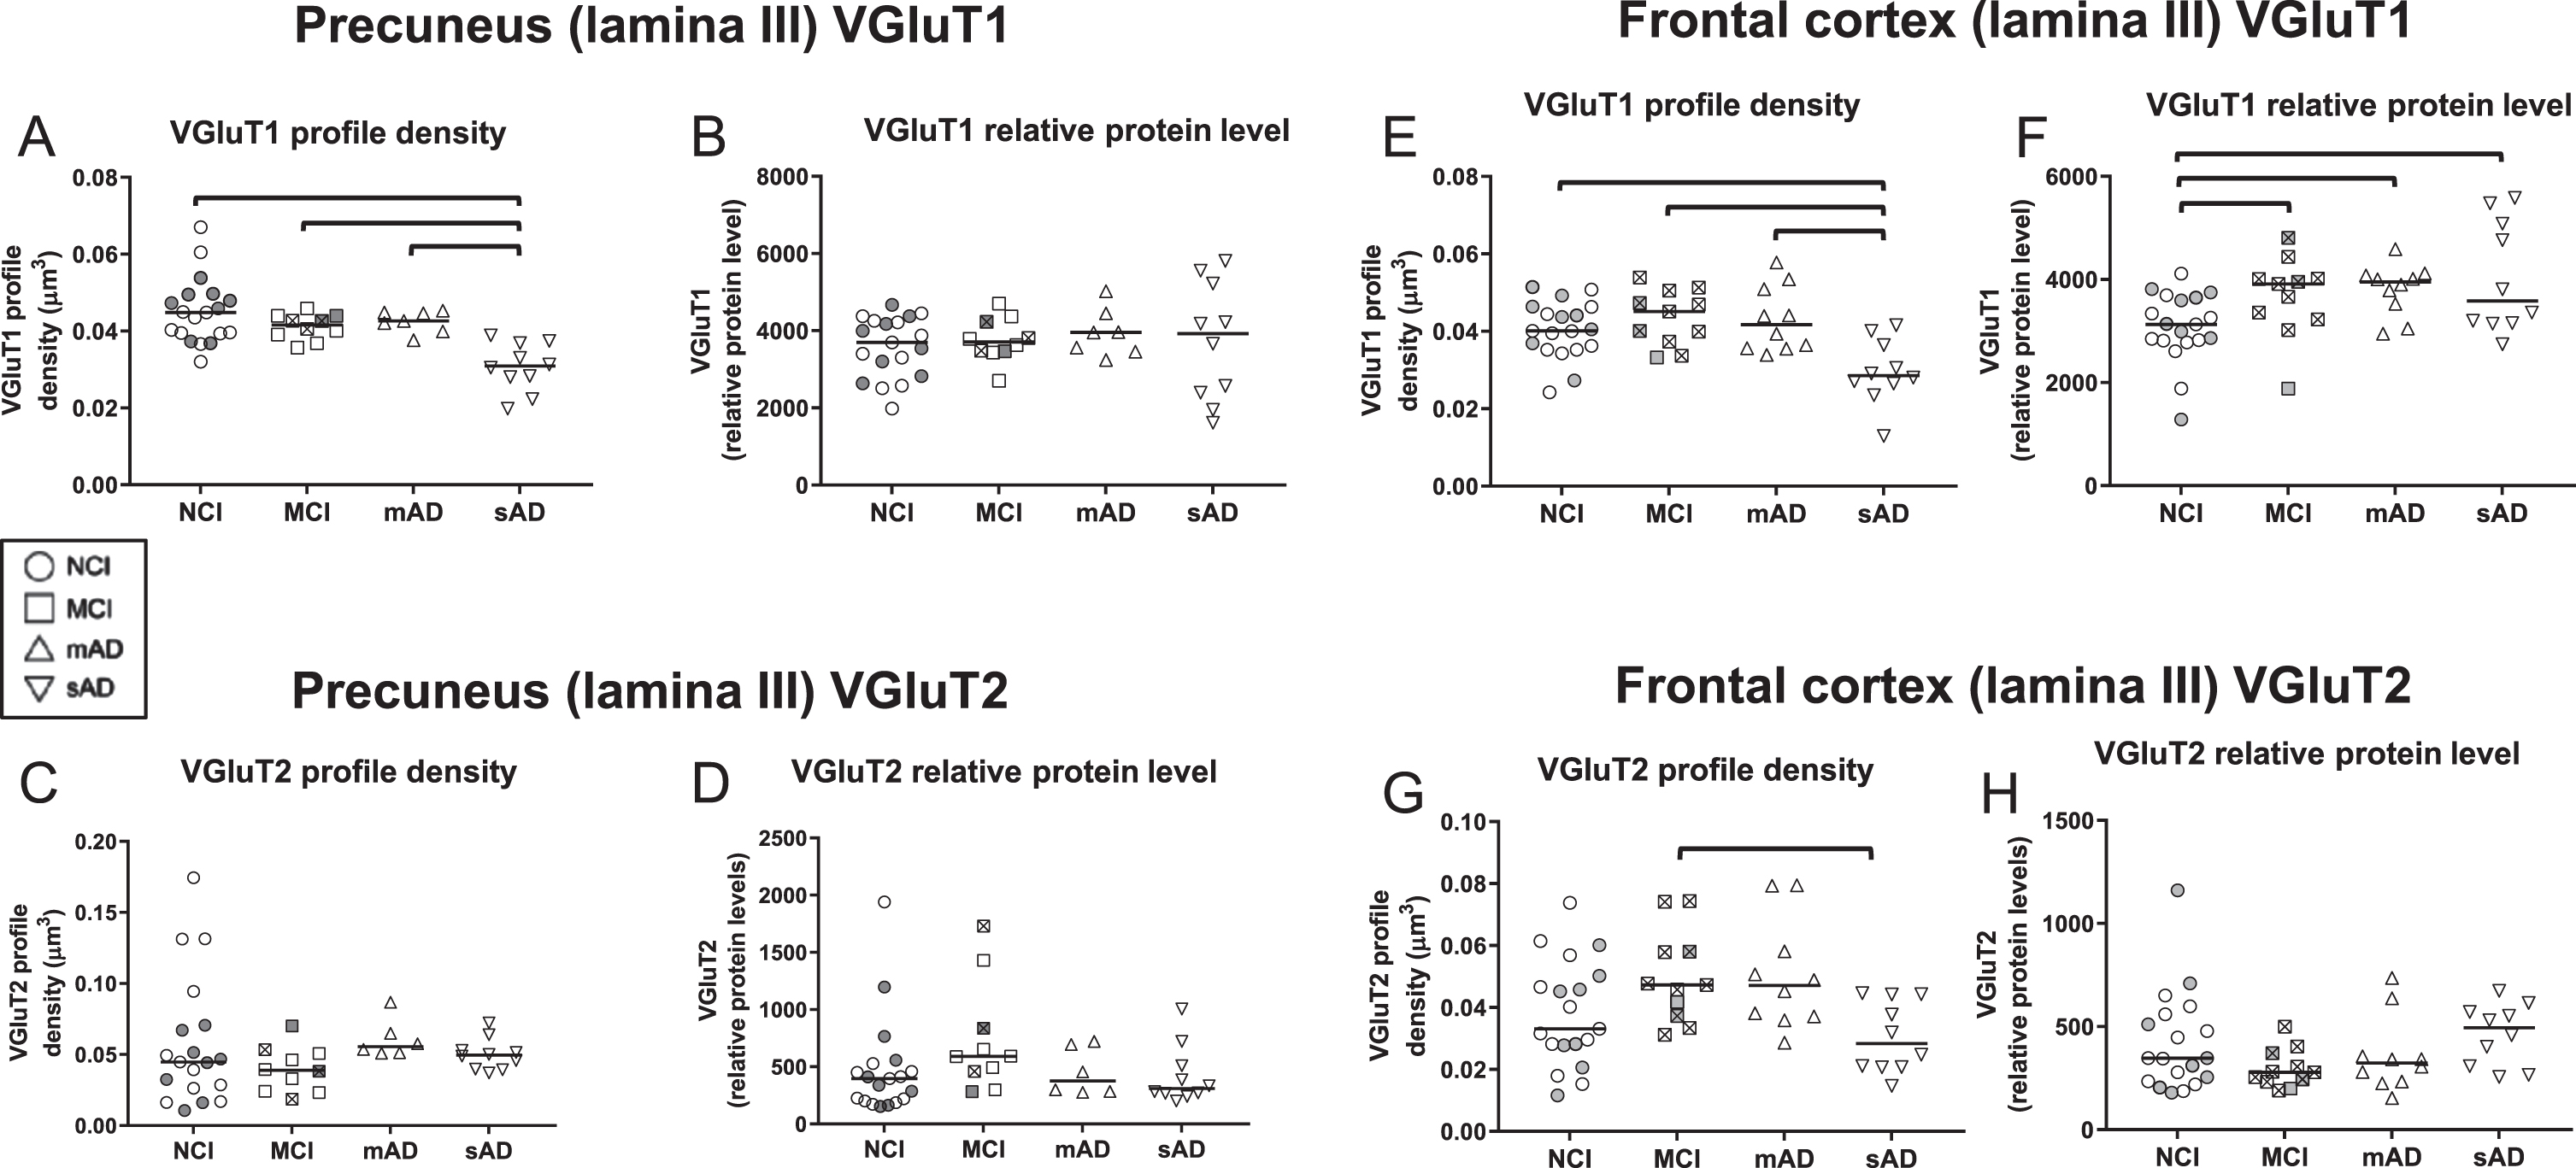
Quantitative measures of vesicular glutamate transporter 1 (VGluT1) immunoreactive profile densities (precuneus, A; frontal cortex, E) and relative protein levels (intensity) (precuneus, B; frontal cortex, F) and vesicular glutamate transporter 2 (VGluT2) immunoreactive profile densities (precuneus, C; frontal cortex, G) and relative protein levels (intensity) (precuneus, D; frontal cortex, H) from cases with no cognitive impairment (NCI), mild cognitive impairment (MCI), mild to moderate Alzheimer’s disease AD (mAD) and moderate to severe AD (sAD). In each clinical diagnostic group, cases with a CERAD diagnosis of No AD/Possible AD (“low pathology”) are identified by shaded symbols and cases with CERAD diagnosis of Probable AD/Definite AD (“high pathology”) are identified by empty symbols. Within the MCI groups, symbols for data points of amnestic cases contain the symbol “×”. The single solid line in each plot indicates the median value. Brackets in panel A indicate statistically significant groupwise differences (p < 0.05) determined by the Kruskall-Wallis analysis of variance and Dunn’s multiple comparisons test.
Frontal cortex synaptic profile analyses
VGluT protein immunoreactivity in frontal cortex lamina III
VGluT1 and VGluT2 immunofluorescent profile appearance and distribution in the dorsolateral frontal cortex lamina III (hereafter referred to as the frontal cortex) was similar in NCI (Fig. 1A’–C’), MCI (not shown), and mAD cases (Fig. 1D’–F’). Cases with sAD had markedly fewer immunoreactive VGluT1 (Fig. 1G’, I’), but not VGluT2 profiles (Fig. 1H’, I’) compared to the other three groups. Both transporter proteins were scarce within cyano-PiB labeled amyloid plaques (Fig. 1J’–L’). Unbiased quantitative analysis of frontal cortex VGluT1-immunoreactive profile densities confirmed the lack of significant differences among the NCI, MCI, and mAD groups, while a statistically significantly lower density of VGluT1-immunoreactive profiles was detected in sAD compared to the other three groups (Fig. 2E, Table 4). In contrast to the data from precuneus, the mean VGluT1-immunoreactive profile intensity (relative VGluT1 protein level) in the frontal cortex was significantly higher in MCI, mAD, and sAD compared to the NCI group (Fig. 2F, Table 4). VGluT2-immunoreactive profile density in the frontal cortex was significantly lower in sAD than MCI (Fig. 2G, Table 4), while no group differences were detected for VGluT2-immunoreactive profile intensity (Fig. 2H, Table 4). The thickness of lamina III of the frontal cortex was not different among the four clinical groups (not shown).
Clinical group differences for vesicular glutamate transporter and spinophilin immunoreactivity measures obtained in the frontal cortex
aKruskal-Wallis one-way analysis of variance. AD, Alzheimer’s disease; ANOVA, one-way analysis of variance; NCI, no cognitive impairment; MCI, mild cognitive impairment; mAD, mild to moderate AD; sAD, moderate to severe AD; SD, standard deviation; VGluT, vesicular glutamate transporter.
Spinophilin protein immunoreactivity in frontal cortex lamina III
The appearance of frontal cortex spinophilin-immunoreactive profiles was like that observed in the precuneus [84]. Unbiased quantitative analysis showed that spinophilin-immunoreactive density or intensity measures did not differ across the four clinical diagnostic groups (Table 4).
Precuneus and the frontal cortex synaptic profiles in NCI cases with low and high neuropathology burden
We divided NCI cases into two subgroups of Low Pathology NCI (LP-NCI) and High Pathology NCI (HP-NCI or “preclinical AD”) cases based on their neuropathology status according to NIA-RI diagnosis (not AD and low likelihood = LP-NCI; moderate and high likelihood of AD = HP-NCI), CERAD diagnosis (CERAD 0, 1 = LP-NCI; CERAD 2, 3 = HP-NCI), or Braak stage for neurofibrillary tangles (Braak 0–III = LP-NCI, Braak IV–VI = HP-NCI). None of these classifications resulted in statistically significant differences in VGluT1, VGLuT2, or spinophilin measures between the LP-NCI and HP-NCI subgroups in either cortical region (not shown).
Correlations between VGluT and spinophilin measures with quantitative amyloid plaque pathology, neuropathology severity, and MMSE
Precuneus cortex
Cyano-PiB-labeled Aβ amyloid burden and X-34-labeled pan-amyloid (Aβ and tau) burden of the precuneus showed statistically significant group differences (Kruskall-Wallis statistic = 19.77 and 18.84, p = 0.0002 and 0.0003, respectively), with sAD displaying a significantly higher amyloid pathology burden than the NCI (Dunn’s multiple comparisons, cyano-PiB: p = 0.0002; X-34: p = 0.0001) and MCI (Dunn’s multiple comparisons, cyano-PiB: p = 0.0024; X-34: p = 0.0178) groups but not the mAD group (Fig. 3A, B). Spearman rank order correlation analysis across all cases showed a statistically significant correlation between greater burden of cyano-PiB positive amyloid plaques and lower density of VGluT1-immunoreactive profiles in the precuneus (rs = –0.4306, p = 0.0028) (Fig. 3C). Lower density of VGluT1 immunoreactive profiles also correlated significantly with greater X-34-labeled total amyloid pathology burden in the precuneus (rs = –0.4216, p = 0.0035) (Supplementary Table 1) and with more severe neuropathology based upon CERAD (rs = –0.5681, p < 0.0001) (Fig. 3D), likelihood of AD by NIA-RI criteria (rs = –0.5018, p = 0.0004) (Supplementary Table 1) or Braak stage (rs = –0.4227, p = 0.0034) (Supplementary Table 1). Robust regression analyses controlling for demographic factors and APOE ɛ4 allele frequency confirmed that VGluT1 density was associated with quantitative measures of cyano-PiB amyloid plaques (β= –0.001, 95% CI (–0.002, –0.0007), p < 0.001) and X-34 labeled total amyloid pathology (β= –0.0006, 95% CI (–0.0001, –0.0002), p = 0.009), Braak stage (β= –0.002, 95% CI (–0.0003, –0.0009), p < 0.001), NIA-RI criteria (β= –0.0005, 95% CI (–0.0006, –0.003), p < 0.001), but not CERAD diagnosis (β= –0.004, 95% CI (–0.009, 0.001), p = 0.16). Precuneus VGluT1 intensity as well as VGluT2 density and intensity measures did not correlate with neuropathology data.
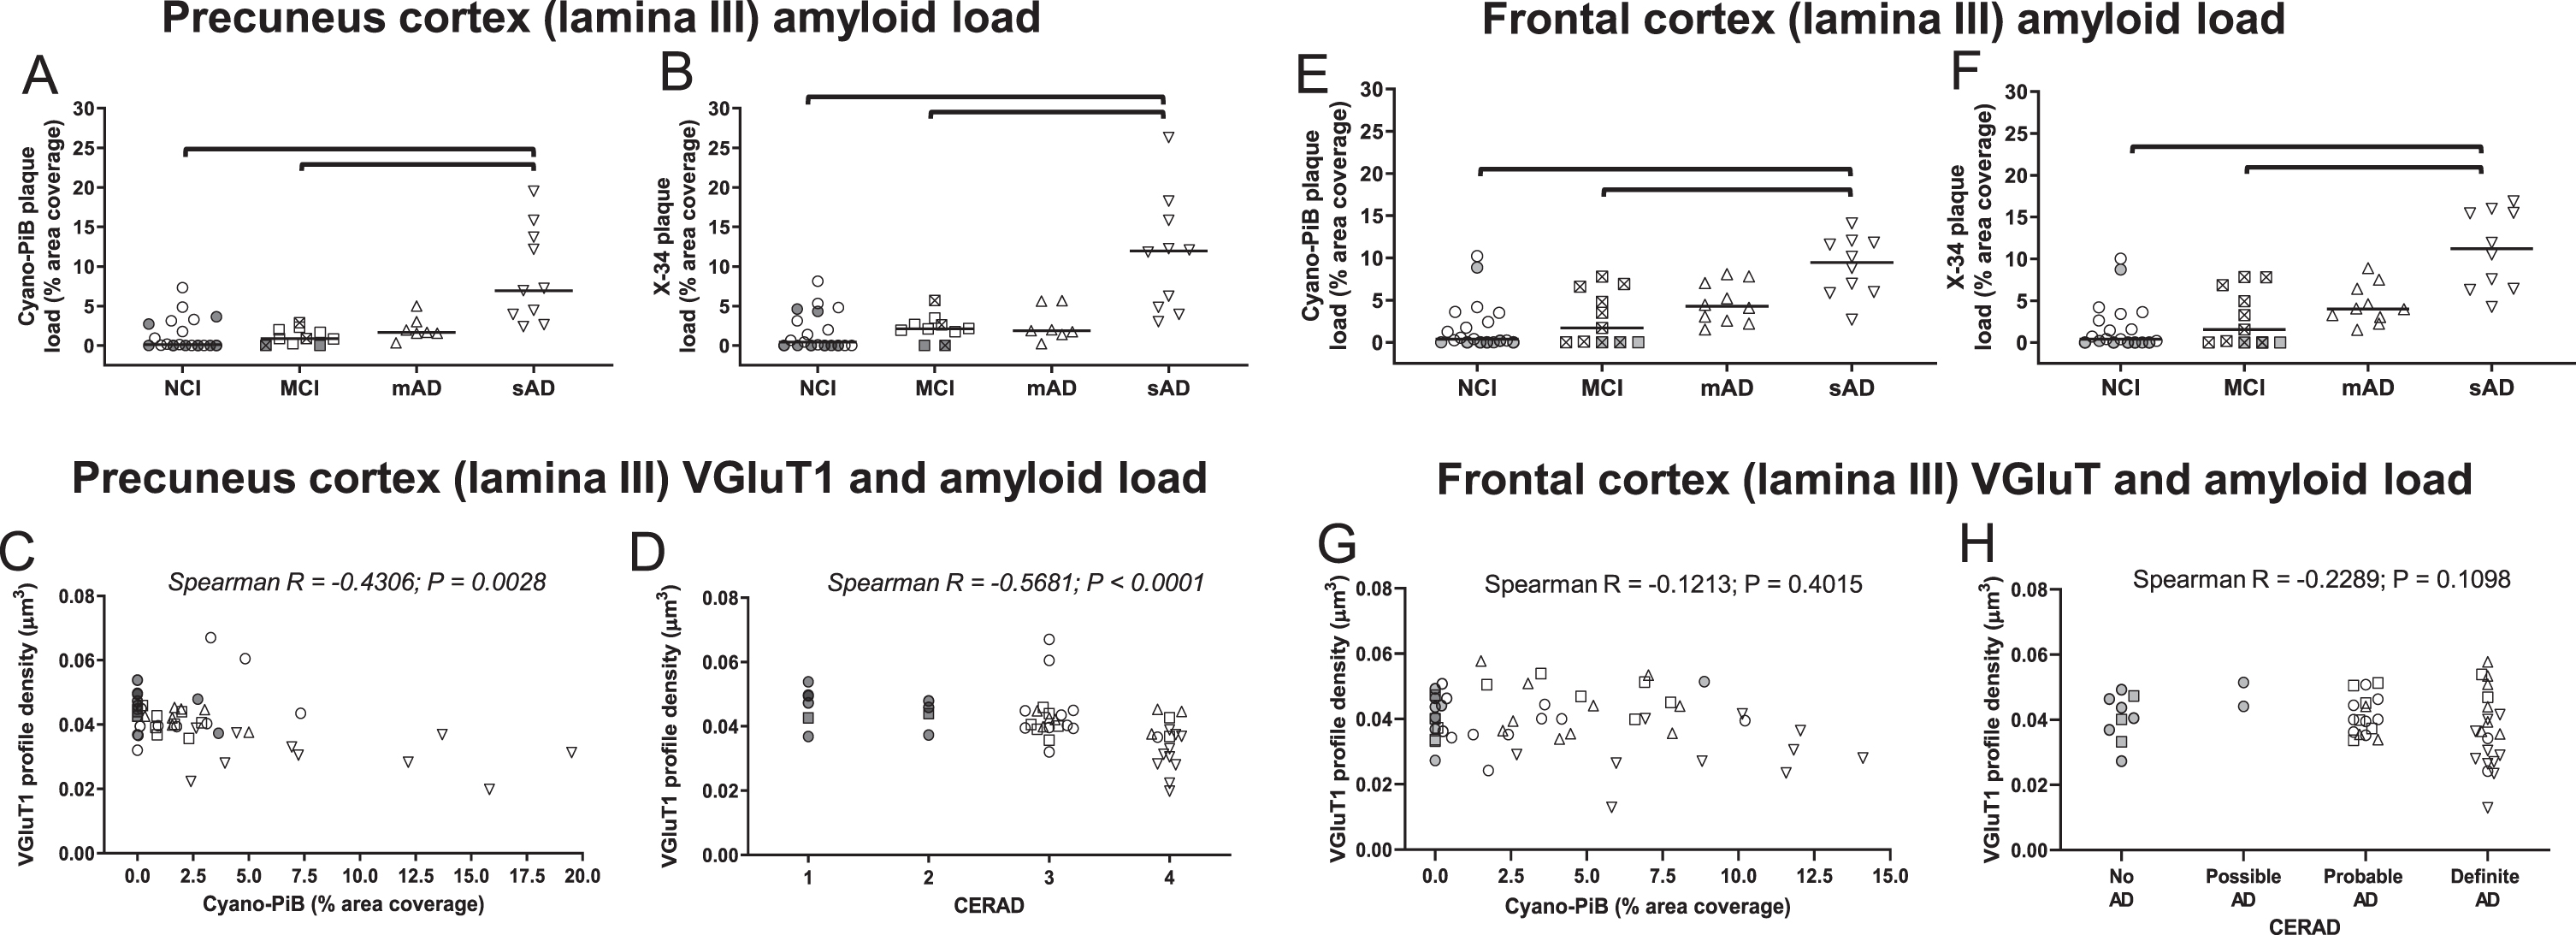
Quantitative measures of cyano-Pittsburgh compound B (cyano-PiB)-labeled amyloid plaque load (precuneus, A; frontal cortex, E) and X-34-labeled total amyloid load (amyloid plaques and neurofibrillary pathology) (precuneus, B; frontal cortex, F) in clinical groups of no cognitive impairment (NCI), mild cognitive impairment (MCI), mild to moderate Alzheimer’s disease (mAD), and moderate to severe AD (sAD). Correlations between VGluT1 immunoreactive profile densities and cyano-PiB (precuneus, C; frontal cortex, G) and VGluT1 immunoreactive profile densities and CERAD diagnosis (precuneus, D; frontal cortex, H). In each group, cases with a CERAD diagnosis of No AD/Possible AD (“low pathology”) are identified by shaded symbols and cases with CERAD diagnosis of Probable AD/Definite AD (“high pathology”) are identified by open symbols. In the clinical group comparison panels, symbols for data points of amnestic MCI cases contain the symbol “×”. The single solid line in each plot indicates the median value. Brackets indicate statistically significant groupwise differences (p < 0.05) determined by the Kruskall-Wallis analysis of variance and Dunn’s multiple comparisons test. Scatter plots illustrating associations of vesicular glutamate transporter 1 (VGluT1) immunoreactive profile densities with cyano-PiB-labeled amyloid plaque pathology burden (precuneus, C; frontal cortex, G) and with CERAD diagnosis (precuneus, D; frontal cortex, H) in clinical diagnostic groups of NCI, MCI, mAD, and sAD.
Spearman rank order correlation revealed a significant association between lower precuneus VGluT1 density and lower MMSE scores (rs = 0.5205, p = 0.0002). However, after controlling for demographic variables the association between VGluT1 density and MMSE was no longer significant (β= 239.02 (95% CI (–48.08, 526.13), p = 0.11). No associations were observed when MMSE scores were plotted against VGluT2 density or with intensity of VGluT1 or VGluT2 in the precuneus (not shown).
Spearman rank order correlation analysis across all cases showed a statistically significant association between greater burden of cyano-PiB positive amyloid plaques and X-34-labeled total amyloid pathology and lower spinophilin density and intensity measures (cyano-PiB and spinophilin density: rs = 0.4980, p < 0.0001; cyano-PiB and spinophilin intensity: rs = –0.5733, p = 0.0072; X-34 and spinophilin density: rs = –0.5710, p = 0.0008; X-34 and spinophilin intensity: rs = –0.4136, p = 0.0207) in the precuneus (Fig. 3E; Supplementary Table 1). Lower precuneus spinophilin-immunoreactive profile densities and intensities were associated with higher Braak stage (Supplementary Table 1) (spinophilin density and Braak: rs = –03768, p = 0.0361; spinophilin intensity and Braak: rs = –0.5353, p = 0.0015) and greater likelihood of AD by NIA-RI criteria (spinophilin density and NIA-RI: rs = –0.4762, p = 0.0015; spinophilin intensity and NIA-RI: rs = –0.5943, p = 0.0015) (Supplementary Table 1). Lower spinophilin-immunoreactive profile density, but not intensity was associated with worse CERAD diagnosis (Fig. 3F) (spinophilin density and CERAD: rs = –0.5561, p = 0.0005).
Spearman rank order correlation analysis showed a statistically significant correlation between higher precuneus spinophilin density or intensity measures and higher MMSE scores (rs = 0.8027, p < 0.0001; rs = 0.6884, p < 0.0001, respectively) as well as with higher precuneus VGluT1-immunoreactive profile density (rs = 0.6466, p < 0.0001; rs = 0.5635, p = 0.0010) and VGluT2-immunoreactive profile intensity (rs = 0.6565, p < 0.0001; rs = 0.4309, p = 0.0174 measures (Supplementary Table 1).
Frontal cortex
Cyano-PiB-labeled Aβ amyloid burden and X-34-labeled pan-amyloid (Aβ and tau) burden within the frontal cortex showed statistically significant group differences (Kruskall-Wallis statistic = 19.75 and 21.47, p = 0.0002 and p < 0.001, respectively), with sAD having statistically significantly higher amyloid burden than NCI (Dunn’s multiple comparisons, cyano-PiB: p = 0.0002; X-34: p < 0.001) and MCI (Dunn’s multiple comparisons, cyano-PiB p = 0.0055; X-34 p = 0.0034) but not mAD (Fig. 3G, H). Of the VGluT measures in the frontal cortex, lower VGluT1 density was associated with higher Braak stage (rs = –0.2888, p = 0.0419), while no significant associations were detected with other neuropathology measures including cyano-PiB (Fig. 3I) and CERAD diagnosis (Fig. 3J). In contrast, higher VGluT1 intensity was associated with higher cyano-PiB amyloid plaque burden (rs = 0.2815, p = 0.0477), higher likelihood of AD by the NIA-RI criteria (rs = 0.3056, p = 0.0309), and higher Braak stage (rs = 0.3265, p = 0.0206) (Supplementary Table 2). When robust regression analysis controlling for demographic factors and APOE allele frequency was performed, these associations were no longer significant between VGluT1 density and Braak stage (p = 0.43) or between VGluT1 intensity and cyano-PiB plaque burden (p = 0.16), likelihood of AD (p = 0.16), and Braak stage (p = 0.59). VGluT2 density and intensity measures in the frontal cortex did not correlate with neuropathology data. Higher VGluT1 intensity was associated with lower MMSE scores in the frontal cortex (r = –0.43, p = 0.002). This association remained significant after controlling for age, sex, education, and APOE ɛ4 carrier status (B = –0.002, 95% CI: (–0.004, –0.001), p < 0.001).
Spearman rank order correlation analysis showed that higher spinophilin-immunoreactive density in the frontal cortex was associated with higher VGluT1- and VGluT2-immunoreactive density measures (rs = 0.3130, p = 0.0269; rs = 0.2895, p = 0.0414) (Supplementary Table 2). Spinophilin-immunoreactivity measures were not associated with cyano-PiB- or X-34-labeled amyloid pathology or NIA-RI, CERAD, or Braak stage (Supplementary Table 2). No associations were observed between spinophilin-immunoreactive density or intensity measures and MMSE scores.
DISCUSSION
Glutamatergic neurotransmitter dysfunction occurs in the AD brain [25–29], and recent reports support a role for altered cortical vesicular glutamate transporter (VGluT) proteins in this process [43–47, 66]. However, only a few studies have examined alterations in cortical lamina-specific and cell-compartment localization (i.e., synapses) of VGluT proteins [43, 44] in AD. The present study used an unbiased stereological design combined with high-resolution confocal microscopy to quantify neocortical VGluT1- and VGluT2-containing synaptic profile density and immunosignal intensity (the latter a measure of relative protein level within synaptic profiles) in cases that had a premortem clinical diagnosis of NCI, MCI, mAD, or sAD and received a detailed postmortem neuropathological evaluation. Here, we focused on two hubs of the DMN, the precuneus and the frontal cortex, which display neuropathology early in AD [48–52, 92]. The frontal cortex has been reported to display neuroplastic changes in glutamatergic [43] and cholinergic [93] neuronal circuits.
The main finding of this study is that VGluT1-immunoreactive profile density measures in precuneus and frontal cortex were stable from NCI to MCI to mAD but were significantly lower in sAD cases compared to the other three groups. Our observation of VGluT1-immunoreactive synaptic terminal loss in precuneus is similar to that seen in other areas of cortex examined in AD cases [43, 44]. On the other hand, another study reported an upregulation of VGluT1-containing synaptic terminals in frontal cortex lamina III from MCI compared to NCI, mAD, and sAD cases [43]. This discrepancy could be due to differences in staining methods as we used confocal immunofluorescence microscopy compared to chromogen-based immunohistochemistry [43]. In addition, our NCI cases were selected based upon their last premortem clinical evaluations performed within a year of death, regardless of postmortem neuropathology assessment. Sixty percent of our NCI cases had CERAD diagnosis of probable AD, and one had a CERAD diagnosis of definite AD (see Tables 1 and 2). Similarly, most of our NCI cases were Braak stage III-VI and were classified as having an intermediate likelihood of AD by the NIA-RI criteria. NCI cases were not statistically significantly different from MCI cases either by these neuropathological diagnostic measures (Tables 1 and 2) or by their regional amyloid burden determined by cyano-PiB and X-34 stains (see Fig. 3). In contrast, the other study [43] commented that their NCI cases rarely displayed Aβ plaques and were excluded from analyses of VGluT1 profiles in relation to plaques, but neuropathology data were not provided. NCI cases displaying substantial AD lesions are commonly present in clinical pathological cohorts including the RROS autopsy collection [67, 94–97]. Whether synaptic markers differ in AD pathology-burdened compared to pathology-free NCI cases is an ongoing area of investigation. For example, Perez-Nievas and colleagues [24] reported that general presynaptic (synaptophysin) and postsynaptic (PSD95) measures in the temporal lobe were not significantly different between two subgroups of nondemented cases with low probability or high probability of AD by the NIA-RI criteria (the latter termed “resilient”) [24]. Similarly, our LP-NCI and HP-NCI NCI cases, regardless of the neuropathological criteria used for their designation (i.e., by NIA-RI, CERAD, or Braak stage), did not differ in VGluT terminal measurements in the precuneus or frontal cortex.
Several findings in the current study provide support for the idea that unlike precuneus, the frontal cortex displays glutamatergic synaptic terminal changes suggestive of a plasticity response to the progression of AD neuropathology. In both regions, significantly lower VGluT1 profile density was detected in sAD compared to NCI, but only in the frontal cortex was this loss paralleled by a significantly higher VGluT1 intensity (a measure of relative synaptic protein abundance) in sAD compared to NCI (Fig. 2). Thus, a decrement in cortical glutamatergic input may be associated with higher levels of VGluT1 protein content in remaining synaptic terminals in the frontal cortex but not the precuneus. That the VGluT1 intensity measures in the MCI and mAD cases were higher than in the NCI also suggests possible synaptic changes occurring early in the disease course. We also observed that lower VGluT2 profile densities were associated with higher VGluT2 profile intensities in both regions, suggesting a significant, albeit weaker, compensatory response for VGluT2. Complementary analyses of spinophilin-immunoreactive dendritic spines in lamina III showed that precuneus spinophilin-immunoreactive profile density and intensity were lower in mAD and sAD than NCI and MCI, while in the frontal cortex both measures were stable across clinical groups. Additionally, while lower precuneus spinophilin-immunoreactive profile densities associated with more severe regional and diagnostic neuropathology, similar associations were not observed in the frontal cortex. The strong correlations of VGluT1, but not VGluT2, and spinophilin with neuropathology measures in precuneus, but not frontal cortex, further support the concept of selective regional vulnerability in AD. Perhaps a loss of postsynaptic dendritic spines in the precuneus cortex marks an early stage of AD, when presynaptic VGluT1 terminals are stable, while loss of both postsynaptic dendritic spines and presynaptic cortico-cortical and intra-cortical excitatory VGluT1 terminals in precuneus and frontal cortex designate more advanced AD. However, with clinical AD progression relative protein levels of VGluT1 in synaptic terminals appear to upregulate in the frontal cortex, but not precuneus (see Fig. 2F). Collectively, our data support the concept that compared to the frontal cortex, synaptic profiles in the precuneus cortex are more vulnerable to AD neuropathology, and that this region lacks a sustainable plasticity response.
The degree to which hallmark AD lesions, or the consequences of these lesions, directly affect synapses in the AD brain is not well understood. In the present study, both VGluT1- and VGluT2-immunoreactive profiles were scarce within amyloid plaques in the precuneus and frontal cortex, while amyloid plaque-free neuropil displayed a loss of VGluT1-immunoreactive profiles only in advanced AD. Whether in amyloid plaque-burdened areas VGluT-immunoreactive profiles are affected by fibrillar Aβ, Aβ oligomers, tau-containing dystrophic neurites, or neuroinflammation (e.g., gliosis) associated with amyloid [98–100] remains to be determined.
The present study used a rigorous unbiased quantitative design and statistical analyses. Study limitations include: (i) NCI, MCI, and mAD cases were aging clergy participants in the RROS [67–70], while the sAD group consisted of patients enrolled in the UPitt ADRC. Previous studies have discussed the RROS cohort in comparison to the general population and clinic cohorts [75, 101], and we have reported similar alterations in cortical cholinergic change and changes in neurotrophic factor receptors levels, among others, using tissue from the RROS compared to a general clinic population in AD and individuals with Down syndrome [93, 102–108]. Although the early and advanced AD cases from the RROS and UPitt ADRC, respectively, did not differ by years of education, the RROS early AD subjects were older than the ADRC patients with advanced AD. (ii) The MCI group contributing frontal cortex was 91% (10/11) amnestic, while for the precuneus sample MCI were not as homogeneous, with only 30% (3/10) amnestic. Amnestic MCI (aMCI) is believed more likely to progress to AD than non-aMCI [109, 110], but whether the aMCI subjects in this study would develop AD had they lived longer is an untestable hypothesis. However, it should be noted that VGluT1 densities were clustered tightly in the entire MCI group, and the aMCI cases did not differ appreciably from the non-aMCI cases (see Fig. 2A). (iii) The current analyses focused on cortical lamina III based upon several observations: (a) lamina III of the neocortex displays both VGluT1 and VGluT2 profiles [38], (b) lamina III cortico-cortical neuronal projections are components of higher order cortical circuits that interconnect the precuneus and frontal cortex [111], (c) lamina III projection neurons are selectively vulnerable and develop tau pathology in AD [112–116], and (d) the focus on lamina III also allowed for more relevant comparisons to the study by Bell and colleagues who analyzed the same cortical layer of frontal cortex [43]. Lastly, (iv) due to brain tissue availability overlap of cases was limited which prevented within-case comparisons of VGluT measures between the two brainregions.
In summary, the current study demonstrates differences in VGluT1- and VGluT2-immunoreactive glutamatergic terminal change within layer III of the precuneus and frontal cortex at different clinical-pathological stages of AD. Of particular interest are findings that VGluT1 loss is associated with neuropathology progression in the precuneus, but not frontal cortex, and that a decremental change in frontal cortical VGluT1 terminal density is paralleled by an upregulation of VGluT1 protein content in remaining terminals of frontal but not precuneus cortex. The latter change may signal a preclinical neuroplasticity response. Thus, drugs aimed at preservation of cortical glutamatergic excitatory synaptic function and enhancement of neuroplasticity mechanisms, when combined with other currently available symptomatic and lesion modifying therapies, likely will prove beneficial in treating people who are at the early stages of AD clinical-pathological change.
Footnotes
ACKNOWLEDGMENTS
The authors are indebted to the Catholic nuns, priests, and lay brothers who participated in the Rush Religious Orders Study and patients in the University of Pittsburgh’s Alzheimer’s Disease Research Center. We are grateful to Ms. Lan Shao, Ms. Violetta Pivtoraiko, and Dr. Jason T. Newman for expert technical assistance, and to Dr. William Klunk and Dr. Chester Mathis for providing cyano-PiB and X-34. The content of the manuscript is solely the responsibility of the authors and does not necessarily represent the official views of the Department of Veterans Affairs or the United States Government.
FUNDING
This study was supported by grants P01AG014449, P30AG10161, P30AG066468, R01AG052528, and P01AG025204 from the National Institute on Aging, and R01MH116046 and R01MH096985 from the National Institute of Mental Health, National Institutes of Health.
CONFLICT OF INTEREST
ZM, EEA, AYR, MM-A, JKK, KNF, RAS, VLV, and JAS declare no conflict of interest.
EJM has served as consultant to NeuroPhage Pharmaceuticals, Inc., and is an Editorial Board Member of this journal, but was not involved in the peer-review process nor had access to any information regarding its peer-review.
MDI has served as consultant to and received research grants from GE Healthcare
DATA AVAILABILITY
The datasets generated during and/or analyzed during the current study are available from the corresponding author on reasonable request.
