
Abstract
Background:
Alzheimer’s disease (AD) is a neurodegenerative disorder characterized by amyloid-β peptide (Aβ) deposition. Aβ accumulation induces oxidative stress, leading to mitochondrial dysfunction, apoptosis, and so forth. Octadecaneuropeptide (ODN), a diazepam-binding inhibitor (DBI)-derived peptide, has been reported to have antioxidant properties. However, it is unclear whether ODN has neuroprotective effects in AD.
Objective:
To profile the potential effects of ODN on AD.
Methods:
We established a mouse model of AD via microinjection of Aβ in the lateral ventricle. Utilizing a combination of western blotting assays, electrophysiological recordings, and behavioral tests, we investigated the neuroprotective effects of ODN on AD.
Results:
DBI expression was decreased in AD model mice and cells. Meanwhile, ODN decreased Aβ generation by downregulating amyloidogenic AβPP processing in HEK-293 cells stably expressing human Swedish mutant APP695 and BACE1 (2EB2). Moreover, ODN could inhibit Aβ-induced oxidative stress in primary cultured cells and mice, as reflected by a dramatic increase in antioxidants and a decrease in pro-oxidants. We also found that ODN could reduce oxidative stress-induced apoptosis by restoring mitochondrial membrane potential, intracellular Ca2+ and cleaved caspase-3 levels in Aβ-treated primary cultured cells and mice. More importantly, intracerebroventricular injection of ODN attenuated cognitive impairments as well as long-term potentiation in Aβ-treated mice.
Conclusion:
These results suggest that ODN may exert a potent neuroprotective effect against Aβ-induced neurotoxicity and memory decline via its antioxidant effects, indicating that ODN may be a potential therapeutic agent for AD.
INTRODUCTION
Alzheimer’s disease (AD) is the most prevalent form of dementia that currently affects more than 50 million individuals worldwide [1]. One of AD’s main neuropathological features is senile plaques formed by extracellular amyloid-β (Aβ) deposition [2, 3]. Aβ is generated from sequential cleavage of amyloid-β protein precursor (AβPP) by β-secretase and γ-secretase, and is cleared by neprilysin (NEP) and insulin-degrading enzyme (IDE). The imbalance between Aβ generation and clearance causes Aβ deposition, which increases reactive oxygen species (ROS) and induces oxidative stress [4]. Oxidative stress is considered to be a bridge connecting Aβ-induced neurotoxicity, including mitochondrial dysfunction, apoptosis, and inflammatory responses, among others [5]. The brain depletes high levels of oxygen, however, its antioxidants are low. Accordingly, the brain is more susceptible to oxidative stress. Oxidative stress is caused by an imbalance between the production and scavenging of oxygen free radicals. Therefore, inhibition of ROS by increasing antioxidants or decreasing pro-oxidants may be a therapeutic strategy for AD [6].
Benzodiazepines have been extensively utilized clinically for their anxiolytic, amnestic, sedative-hypnotic and anticonvulsant, while diazepam binding inhibitors (DBI) function as an “endozepine” that displaces trinitrazepam from its receptors [7]. Octadecaneuropeptide (ODN) is one of the major fragment peptides generated from DBI in the brain. Previous studies have shown that hydrogen peroxide (H2O2)-induced oxidative stress increases ODN expression in astrocytes [8]. Meanwhile, there is a growing body of evidence that ODN is able to stimulate the activity of antioxidant enzymes and neutralize H2O2 [8, 9], 6-hydroxydopamine (6-OHDA) [10, 11] and 1-methyl-4-phenyl-1,2,3,6-tetrahydropyridine (MPTP)-induced [12] ROS in neurons and glial cells. Furthermore, it was discovered ODN had a potent protective effect against the oxidative stress-induced death of cultured astrocytes. Additionally, ODN can prevent apoptosis by suppressing proapoptotic protein overexpression, elevating anti-apoptotic protein expression and inhibiting mitochondrial dysfunction. Conversely, silencing ODN or knocking down ODN precursor expression increases the susceptibility to oxidative stress-induced cell death [8]. Consistently, DBI knockout mice increased brain sensitivity to MPTP toxicity, indicating a neuroprotective effect of ODN on neurons [12]. However, the mechanism of ODN underlying AD remains elusive. In this study, we examined the role of ODN in neuroprotection against Aβ-induced neurotoxicity in vitro and in vivo.
MATERIALS AND METHODS
Animals and drugs
6-8-week-old C57BL/6 male mice were purchased from Beijing Vital River Laboratory Animal Technology Co., Ltd. The human Swedish APP751 mutant gene is inserted downstream of a Thy1.2 promoter specific to neurons to create the APP23 transgenic mice. The G384A mutant presenilin-1 linked with familial AD in humans is overexpressed in PS45 transgenic mice. The two transgenic mice are crossed to create the APP23/PS45 double transgenic mice. They were housed in a temperature- and humidity-controlled room under a 12-h light–dark cycle starting at 7:00 AM with free access to water and food. All procedures were performed in accordance with the Chongqing Science and Technology Commission guidelines for animal research and approved by the Children’s Hospital of Chongqing Medical University Animal Care Committee.
Aβ1 - 42 peptides (A9810, Sigma, USA) were dissolved in hexafluoroisopropanol (HFIP) (Sigma, USA) and left at room temperature for 60 min. The bottle was opened in a fume hood to evaporate peptides to Aβ peptide film. The peptide film was dissolved to 1 mM with DMSO (Sigma, USA), and then diluted to 100μM with phosphate buffer saline (PBS) and incubated at 4°C for 48 h to form oligomers. The Aβ mentioned below are Aβ oligomers, unless specifically mentioned. ODN (GL Biochem, China) was diluted to 10 ng/μl with PBS.
Aβ microinjection
Intracerebroventricular (i.c.v.) injection of Aβ1 - 42 in mice is a common AD model mice to mimic pathological and behavioral characterizations of AD [3]. After anesthetization with isoflurane gas, the hair on the top of the mouse’s head was shaved and the head was fixed on a stereotaxic device with the brain in a horizontal position. The scalp was disinfected with a povidone-iodine solution, and the skin was incised along the midline to expose the skull. 2.5μl of Aβ1 - 42 (100μM) and 1μl of ODN (10 ng/μl) were co-microinjected into the lateral ventricle with a drilled hole at a rate of 0.5μl/min (–0.5 mm posterior, +1.1 mm lateral and 3.0 mm ventral relative to bregma). The needle was left for 5 min to allow the fluid to diffuse sufficiently. After removing the syringe and suturing the scalp, the mice were placed back in their cages. Seven days later, 1μl of ODN (10 ng/μl) was microinjected again at the same location.
Morris water maze test
Two weeks after Aβ microinjection, mice were subjected to the Morris water maze task. The Morris water maze test was performed in a circular pool with a diameter of 150 cm and a height of 50 cm. The pool was filled with water (21–22°C) made opaque with non-toxic white paint and the water surface was 1 cm above the platform. The camera was located above the center of the pool. A light blue curtain around the pool and 3 distal visual cues are fixed to the curtain. On the day before spatial training, the mice were put into the water for 120 s of free swimming. Then the mice were tested for 5 consecutive days, with 4 trials per day. During each trial, when the mice failed to find the platform within 120 s, the mice were guided to the hidden platform for 20 s. One day after the last acquired training, the platform was removed and the mice were subjected to a 120-s probe test. All trials were recorded by ANY-maze tracking system (Stoelting, USA).
Western blot assay
The brain tissues and cells were homogenized in lysis buffer (10 mM Tris-HCl, 150 mM NaCl, 1 mM ethylenediamine tetraacetic acid, 1% Triton X-100) and centrifuged (4°C, 12,000 rpm, 15 min) to collect the supernatant. Protein samples were assessed by a Bicinchoninic Acid Protein Assay Kit (Thermo Fisher Scientific, USA) and boiled in 5×loading buffer at 95°C for 10 min. Equivalent protein samples were separated on 16% SDS-PAGE gels and transferred onto polyvinylidene fluoride (PVDF) membranes. The membranes were blocked with 5% non-fat milk at room temperature for 2 h and then incubated with primary antibodies to DBI (1:1000, A13293, Abclonal, China), IDE (1:1000, ab32216, Abcam, USA), APP (obtained from GL Biochem Ltd, China), BACE1 (1:1000, 5606S, CST, USA), PS1 (1:1000, ab76083, Abcam, USA), or β-actin (1:1000, ab8226, Abcam, USA) at 4°C overnight. The membranes were washed with Tris buffered saline containing 0.1% Tween-20 and incubated with a horseradish peroxidase-conjugated secondary antibody (1:3000, Abcam, USA) for 2 h at room temperature. The proteins were observed with an image analysis system (Bio-Rad, USA) using ECL western blotting substrate (Bio-Rad, USA). The relative level of the target protein is expressed as the percentage between the intensity of the target protein and that of the marker protein, β-actin.
Primary cultured cells
The heads of newborn C57BL/6 mice within one day after birth were placed in 75% ice-cold alcohol and then the heads were transferred to HBSS dissection buffer (HyClone, USA). After dissection of the meninges, the cerebral cortex and hippocampus were placed in 0.25% Trypsin-EDTA (Gibco, USA) at 37°C for 10 min. The cells were then rinsed twice with DMEM containing 10% fetal bovine serum and resuspended in DMEM (with 10% FBS) media, seeded into culture dishes coated with poly-D-lysine and cultured at 37°C in 5% CO2 atmosphere. After 4 h, the cells were cultured in an altered medium containing 50 ml of Neurobasal media (Gibco, USA), 1 ml B27 supplement (Invitrogen, USA), 0.5 ml Penicillin-Streptomycin Liquid (Gibco, USA) and 125μl GlutaMAXTM Supplement (Gibco, USA). Half of the medium was replaced every 3 days until the cells were ready for experiments.
Cell viability assay
2EB2 cells were seeded in 96-well plates and incubated for 48 h after the addition of different concentrations of ODN. Then 10μl of Cell Counting Kit-8 (MCE, USA) solution was added to each well for 2 h in the dark. Cell viability was measured at 450 nm using a microplate reader (Thermo Fisher Scientific, USA).
Oxidative stress analysis
Antioxidant activity including total antioxidant capacity (T-AOC), glutathione reductase (GR) and pro-oxidants including ROS, total nitric oxide synthase (T-NOS), and inducible nitric oxide synthase (i-NOS) were measured in primary cultured cells and mouse brain tissues according to the manufacturer’s instructions (Nanjing Jiancheng Bioengineering Institute, China). Briefly, for ROS detection, the primary cultured cells or single-cell suspensions prepared from mouse brain tissues were incubated with serum-free medium containing 10μM DCFH-DA for 30 min at 37°C in the dark. Then the cells were collected by centrifugation at 1,000 rpm for 5 min and washed twice with PBS. The fluorescence microplate reader was used at the excitation wavelength of 485 nm and the emission wavelength of 550 nm.
For T-AOC, GR, T-NOS, and i-NOS detections, primary cultured cells and mouse brain tissues were collected and mixed with the reagents R1 and R2 and incubated at 37°C for 30 min. Then R3 and R4 were added to the mixture and incubated for 10 min at room temperature. Afterward, a microplate reader (Thermo Fisher Scientific, USA) was used to record the absorbance at 520 nm.
Mitochondrial membrane potential (MMP) assay
The primary cultured cells and single-cell suspensions prepared from mouse brain tissues were incubated in serum-free medium containing 5μg/ml Rhodamine 123 (Aladdin, China) for 30 min at 37°C in the dark. After incubation, the cells were collected by centrifugation at 2,000 rpm (5 min) and washed twice with PBS. MMP was measured by the relative intensity of the Rh123 fluorescence using a fluorescence microplate reader (Thermo Fisher Scientific, USA).
Ca2+ concentration assay
The primary cultured cells and single-cell suspensions prepared from mouse brain tissues were incubated with 5μM Fluo-4 AM (Beyotime, China) at 37°C for 30 min in the dark. After washing the cells with PBS three times, the intracellular calcium concentration was measured using a fluorescence microplate reader (Thermo Fisher Scientific, USA).
Electrophysiological recordings
Mice were anesthetized with urethane (1.5 g/kg, i.p.) and the brains were decapitated after heart perfusion with sucrose slice liquid (in mM: KCl 3.0, NaH2PO4.H2O 1.25, NaHCO3 26, Na-vitamin C 0.4, Pyruvate-Na 2.0, Na-lactate 2.0, D-glucose 10.0, sucrose 220, CaCl2 0.1, MgCl2 2.0 and MgSO4 4.0, pH = 7.4). Brain slices were cut into 400μm in sucrose solution by vibrating microtome (VT1200S, Leica Microsystems, Germany). The slices were incubated in the artificial cerebral spinal fluid (ACSF) (in mM: NaCl 124, KCl 2.8, NaH2PO4.H2O 1.25, CaCl2 2.0, MgSO4 1.2, Na-vitamin C 0.4, NaHCO3 26, Na-lactate 2.0, Pyruvate-Na 2.0, and D-glucose 10.0, pH = 7.4) with 95% O2 and 5% CO2 at 35°C for 2 h. The bipolar platinum wire stimulation electrode was placed on the Schaffer collaterals emanating from the CA3 area of the hippocampus, and the glass recording electrode filled with ACSF was placed on the dendritic layer of the pyramidal cells in the CA1 area. The excitatory postsynaptic potentials (EPSPs) were recorded after 0.2 ms square wave stimulation (0.05 Hz). The stimulus intensity of 50% of the maximum EPSPs slope was used as the basal stimulus intensity. Steady recording was performed for 30 min as baseline. Then high-frequency stimulation was used to induce LTP. Data were collected using the PatchMaster v2.73 software (HEKA, Germany).
Statistical analysis
All statistical data were expressed as means±SEM and were analyzed by using SPSS software (Version 20.0). The results were evaluated by Student’s t-test or one-way ANOVA. The significance level was set at p < 0.05.
RESULTS
Reduced expression of DBI in the brains of AD model mice
To detect whether there is an alteration of DBI levels in AD, the cortex and hippocampus of APP23/PS45 double transgenic mouse model of AD were analyzed. The results showed that the expression of DBI was markedly decreased in the cortex (n = 5, 32.55±3.66%, p = 0.014; Fig. 1A) and hippocampus (n = 5, 61.95±11.33%, p = 0.030; Fig. 1B) of AD mice at 4.5 months old relative to their wild-type littermates (n = 5). We further examined DBI expression in 2EB2 cells stably expressing human Swedish mutant APP695 and BACE1. Similar to the findings in AD mice, DBI expression was significantly decreased in 2EB2 cells (n = 5, 76.32±5.85%, p = 0.016; Fig. 1C) compared with non-Swedish mutant APP695 and BACE1 expressing cells (n = 5). To determine whether the DBI reduction in AD is attributed to Aβ, primary cultured cells were treated with different concentrations of Aβ1 - 42 for 24 h. The results showed that the DBI expression was markedly decreased with Aβ treatment at a concentration of 5μM (1μM: 69.56±9.31%, p = 0.328; 2.5μM: 66.51±12.72%, p = 0.450; 5μM: 56.02±3.77%, p = 0.032; 10μM: 64.70±8.71%, p = 0.231; 20μM: 60.23±4.46%, p = 0.054; n = 3 in each group; Fig. 1D), while there was no noticeable difference at other concentrations, relative to 0 M. These results clearly indicate that DBI expression is reduced in AD, as observed in a mouse model of AD and cells expressing the AD-associated mutant APP and BACE1 gene and primary cultured neurons with Aβ treatment.
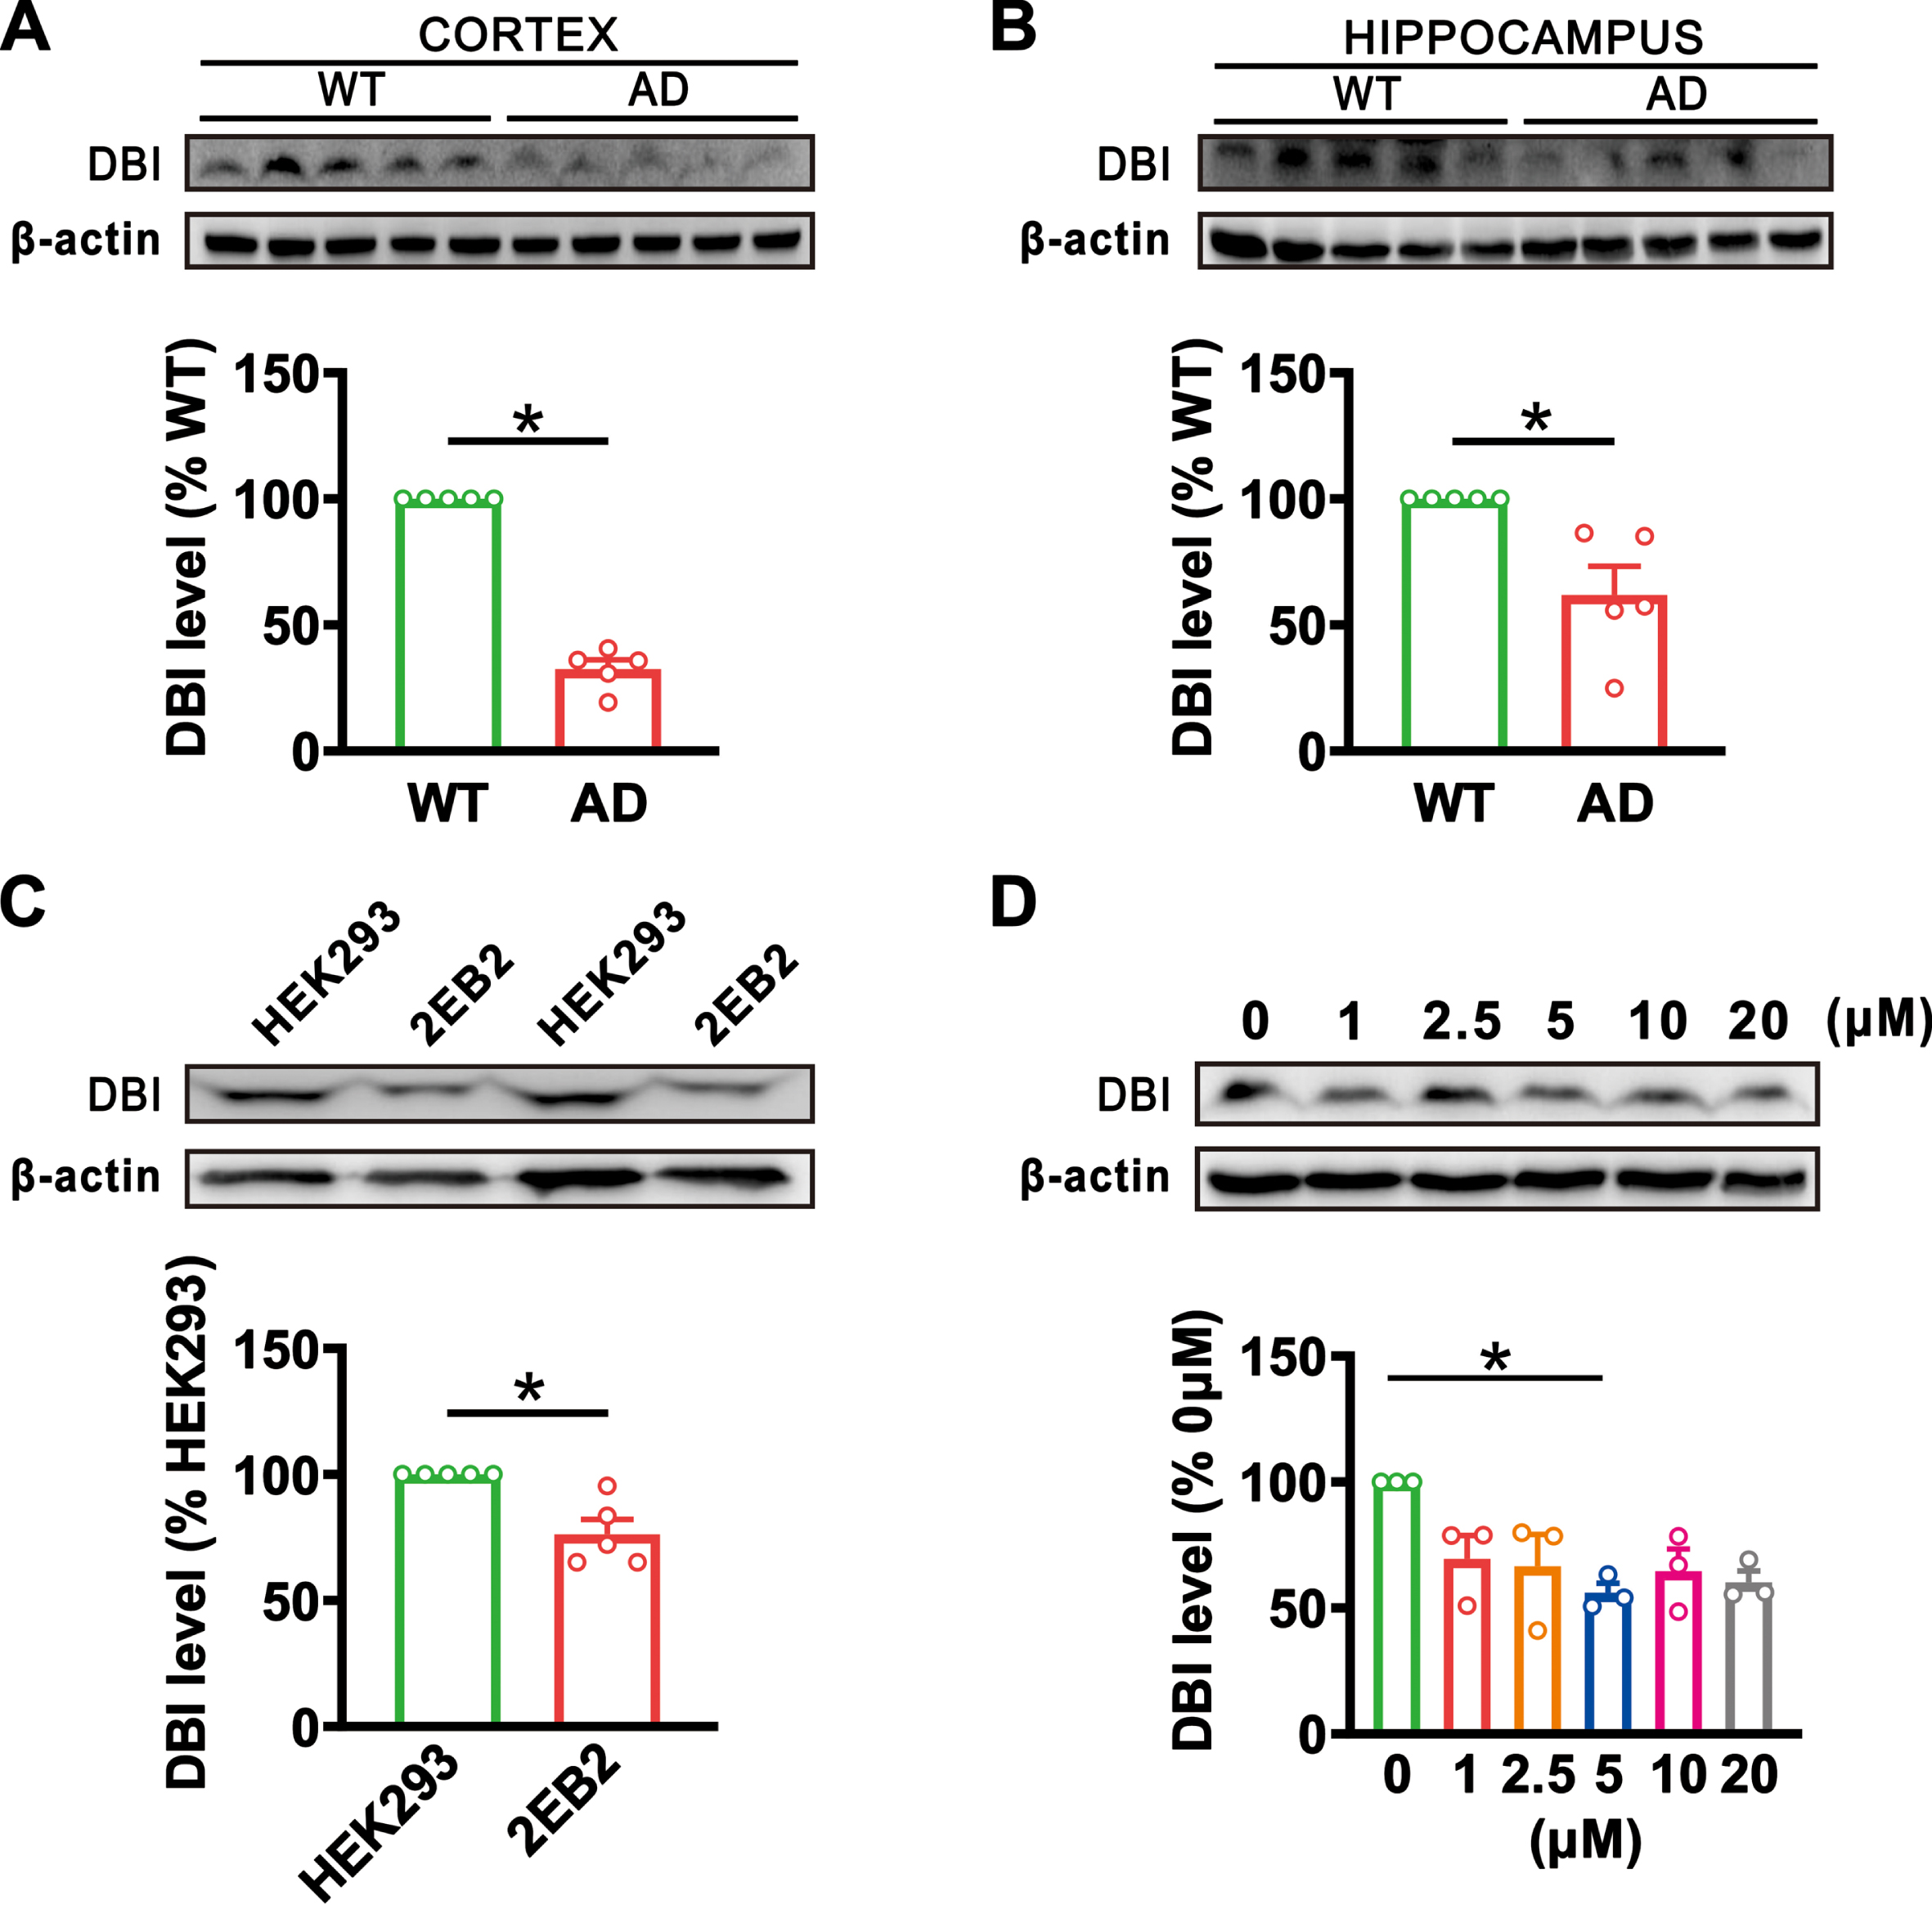
The DBI expression was decreased in AD models. A, B) The protein levels of DBI in the cortex (A) and hippocampus (B) of 4.5-month-old wild-type (WT) and APP23/PS45 transgenic AD model mice (p = 0.014 in the cortex; p = 0.030 in the hippocampus; n = 5 in each group). C) The expression of DBI in HEK293 and 2EB2 cells (p = 0.016; n = 5 in each group). D) The expression of DBI in primary cultured cells treated with Aβ at concentrations ranging from 0 to 20μM for 24 h (1μM: p = 0.328 versus 0μM; 2.5μM: p = 0.450 versus 0μM; 5μM: p = 0.032 versus 0μM; 10μM: p = 0.231 versus 0μM; 20μM: p = 0.054 versus 0μM; n = 3 in each group). Data are expressed as mean±SEM, *p < 0.05, **p < 0.01, ***p < 0.001.
ODN inhibits the amyloidogenic AβPP processing in 2EB2 cells
ODN is one of the major fragment peptides produced by DBI, which plays a similar function to DBI in the brain. For better application in the treatment of AD, we synthesized ODN peptides. To examine the effect of ODN on cell survival, 2EB2 cells were treated with ODN at different concentrations from 10–18 to 10–4 M for 48 h, and then cell survival was determined using the CCK-8 assay. The results showed that ODN had no effect on the cell viability at all different concentrations (10–18 M: 104.97±4.62%, p = 1.000; 10–16 M: 102.99±6.71%, p = 1.000; 10–14 M: 97.52±6.93%, p = 1.000; 10–12 M: 113.88±7.11%, p = 0.808; 10–10 M: 100.26±7.09%, p = 1.000; 10–8 M: 103.19±4.76%, p = 1.000; 10–6 M: 109.64±7.37%, p = 0.971; 10–4 M: 113.72±7.29%, p = 0.817; n = 6 in each group; Fig. 2A). Our study has demonstrated that the expression of DBI is decreased in the brain tissues of AD mice. To further explore whether ODN affects AβPP processing and Aβ generation, 2EB2 cells were treated with different concentrations of ODN from 10–18 to 10–4 M for 48 h. ODN treatment at concentration of 10–14 M decreased the protein levels of BACE1 (10–18 M: 71.88±7.08%, p = 0.227; 10–16 M: 86.38±14.02%, p = 0.996; 10–14 M: 71.65±3.42%, p = 0.033; 10–12 M: 74.62±15.59%, p = 0.875; 10–10 M: 87.05±23.28%, p = 1.000; 10–8 M: 85.97±24.96%, p = 1.000; 10–6 M: 84.24±15.85%, p = 0.995; 10–4 M: 85.02±20.35%, p = 1.000; n = 4 in each group; Fig. 2D) and PS1 (10–18 M: 108.75±27.05%, p = 1.000; 10–16 M: 109.68±22.76%, p = 1.000; 10–14 M: 60.85±3.17%, p = 0.011; 10–12 M: 125.49±26.61%, p = 0.996; 10–10 M: 62.08±8.74%, p = 0.185; 10–8 M: 124.65±55.83%, p = 1.000; 10–6 M: 88.32±20.10%, p = 1.000; 10–4 M: 109.19±32.28%, p = 1.000; n = 4 in each group; Fig. 2E). Meanwhile, C99 (10–18 M: 76.97±9.39%, p = 0.572; 10–16 M: 69.76±7.80%, p = 0.240; 10–14 M: 56.16±5.40%, p = 0.035; 10–12 M: 70.19±10.27%, p = 0.433; 10–10 M: 46.21±5.37%, p = 0.019; 10–8 M: 58.13±8.07%, p = 0.119; 10–6 M: 56.92±8.31%, p = 0.119; 10–4 M: 64.08±14.78%, p = 0.579; n = 4 in each group; Fig. 2F) and C89 (10–18 M: 86.95±14.06%, p = 0.997; 10–16 M: 91.29±13.53%, p = 1.000; 10–14 M: 52.32±5.18%, p = 0.025; 10–12 M: 76.75±13.62%, p = 0.848; 10–10 M: 52.51±4.65%, p = 0.018; 10–8 M: 54.22±17.68%, p = 0.526; 10–6 M: 76.14±6.44%, p = 0.265; 10–4 M: 78.91±21.16%, p = 0.995; n = 4 in each group; Fig. 2G) were reduced with ODN treatment at concentrations of 10–14 M and 10–10 M. Additionally, treatment with all concentrations of ODN did not affect the expression of IDE (10–18 M: 122.06±16.67%, p = 0.998; 10–16 M: 116.72±25.26%, p = 1.000; 10–14 M: 84.94±24.46%, p = 1.000; 10–12 M: 98.30±20.92%, p = 1.000; 10–10 M: 112.56±26.14%, p = 1.000; 10–8 M: 113.45±17.69%, p = 1.000; 10–6 M: 103.08±20.07%, p = 1.000; 10–4 M: 138.07±30.98%, p = 0.939; n = 3 in each group; Fig. 2H) and AβPP (10–18 M: 108.86±4.56%, p = 0.999; 10–16 M: 101.94±6.35%, p = 1.000; 10–14 M: 118.92±3.80%, p = 0.877; 10–12 M: 108.79±6.31%, p = 0.999; 10–10 M: 120.64±15.40%, p = 0.819; 10–8 M: 121.76±9.06%, p = 0.774; 10–6 M: 104.90±11.62%, p = 1.000; 10–4 M: 121.28±14.87%, p = 0.794; n = 4 in each group; Fig. 2C). These data demonstrate that ODN inhibits APP cleavage to amyloid-producing pathway.
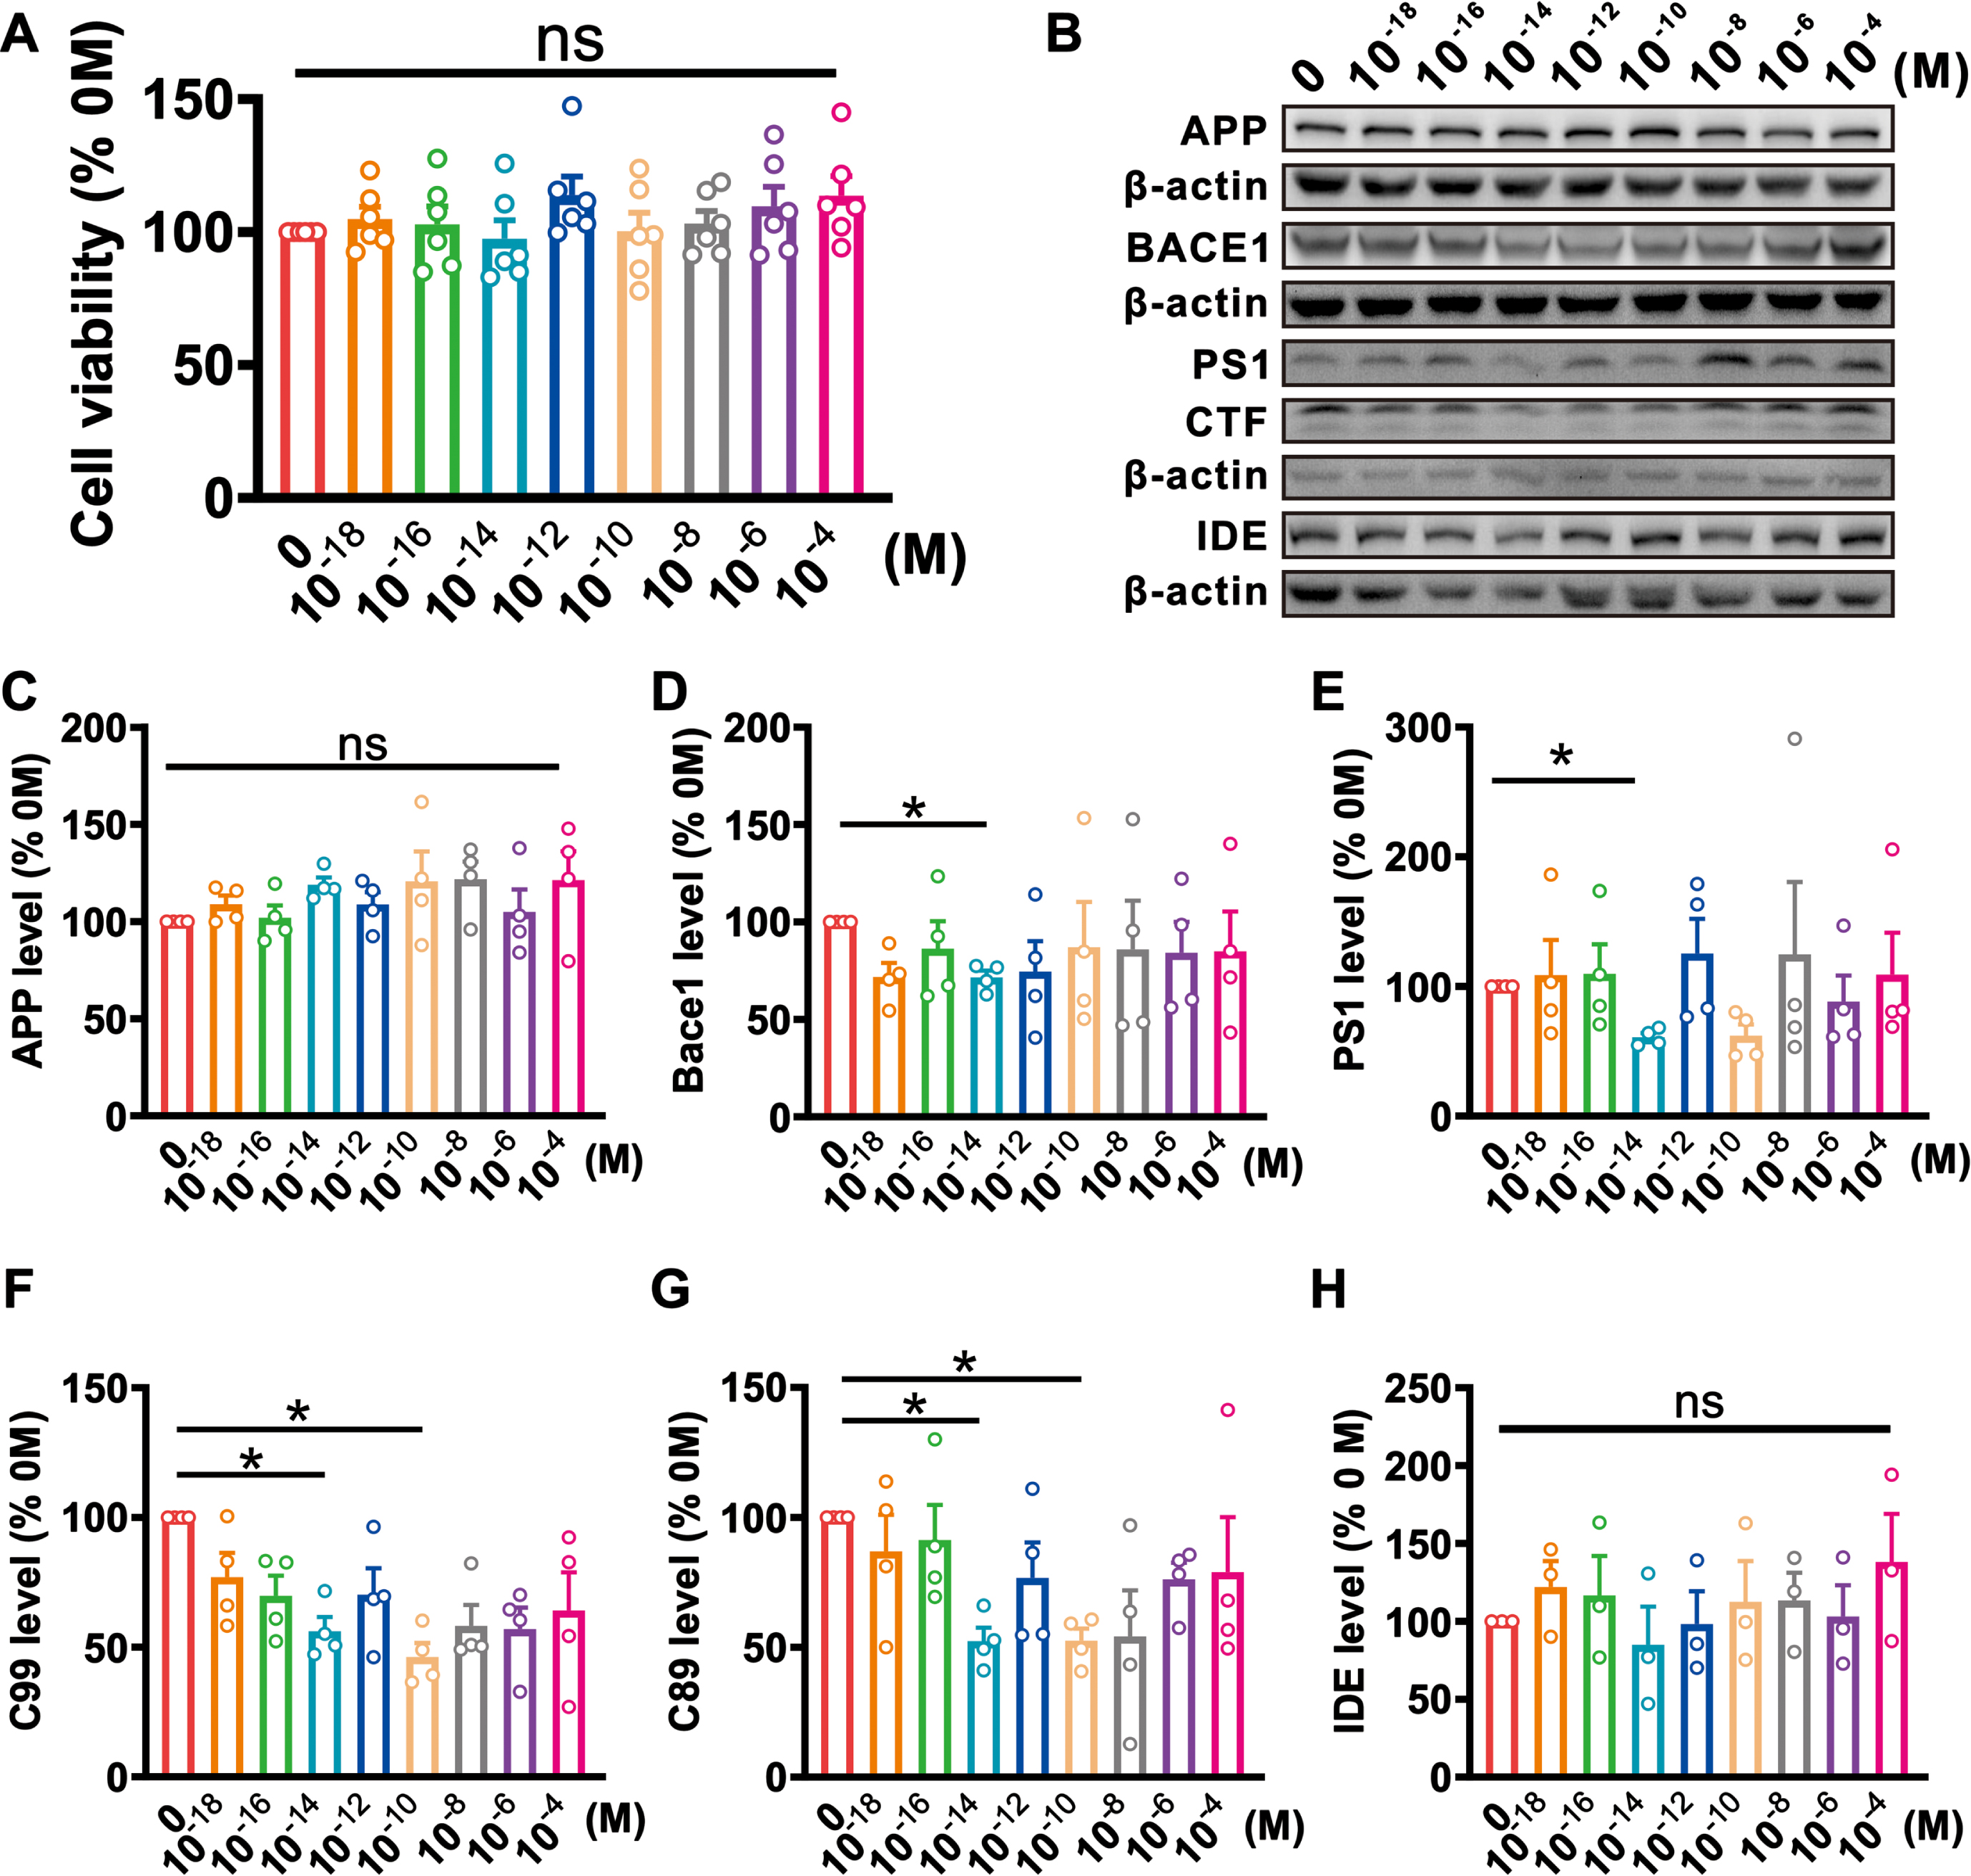
ODN treatment inhibits AβPP processing in 2EB2 cells. A. Treatment of 2EB2 cells with different concentrations of ODN (0–10–4 M) for 48 h had no effect on cell viability (10–18 M: p = 1.000 versus 0 M; 10–16 M: p = 1.000 versus 0 M; 10–14 M: p = 1.000 versus 0 M; 10–12 M: p = 0.808 versus 0 M; 10–10 M: p = 1.000 versus 0 M; 10–8 M: p = 1.000 versus 0 M; 10–6 M: p = 0.971 versus 0 M; 10–4 M: p = 0.817 versus 0 M; n = 6). The cell viability is normalized by non-treatment with ODN (0 M). B-H) The relative protein levels of AβPP (C), BACE1 (D), PS1 (E), C99 (F), C89 (G), and IDE (H), are normalized by 0 M (AβPP: 10–18 M: p = 0.999 versus 0 M, 10–16 M: p = 1.000 versus 0 M, 10–14 M: p = 0.877 versus 0 M, 10–12 M: p = 0.999 versus 0 M, 10–10 M: p = 0.819 versus 0 M, 10–8 M: p = 0.774 versus 0 M, 10–6 M: p = 1.000 versus 0 M, 10–4 M: p = 0.794 versus 0 M; BACE1: 10–18 M: p = 0.227 versus 0 M, 10–16 M: p = 0.996 versus 0 M, 10–14 M: p = 0.033 versus 0 M, 10–12 M: p = 0.875 versus 0 M, 10–10 M: p = 1.000 versus 0 M, 10–8 M: p = 1.000 versus 0 M, 10–6 M: p = 0.995 versus 0 M, 10–4 M: p = 1.000 versus 0 M; PS1: 10–18 M: p = 1.000 versus 0 M, 10–16 M: p = 1.000 versus 0 M, 10–14 M: p = 0.011 versus 0 M, 10–12 M: p = 0.996 versus 0 M, 10–10 M: p = 0.185 versus 0 M, 10–8 M: p = 1.000 versus 0 M, 10–6 M: p = 1.000 versus 0 M, 10–4 M: p = 1.000 versus 0 M; C99: 10–18 M: p = 0.572 versus 0 M, 10–16 M: p = 0.240 versus 0 M, 10–14 M: p = 0.035 versus 0 M, 10–12 M: p = 0.433 versus 0 M, 10–10 M: p = 0.019 versus 0 M, 10–8 M: p = 0.119 versus 0 M, 10–6 M: p = 0.119 versus 0 M, 10–4 M: p = 0.579 versus 0 M; C89: 10–18 M: p = 0.997 versus 0 M, 10–16 M: p = 1.000 versus 0 M, 10–14 M: p = 0.025 versus 0 M, 10–12 M: p = 0.848 versus 0 M, 10–10 M: p = 0.018 versus 0 M, 10–8 M: p = 0.526 versus 0 M, 10–6 M: p = 0.265 versus 0 M, 10–4 M: p = 0.995 versus 0 M; IDE: 10–18 M: p = 0.998 versus 0 M, 10–16 M: p = 1.000 versus 0 M, 10–14 M: p = 1.000 versus 0 M, 10–12 M: p = 1.000 versus 0 M,10–10 M: p = 1.000 versus 0 M, 10–8 M: p = 1.000 versus 0 M, 10–6 M: p = 1.000 versus 0 M, 10–4 M: p = 0.939 versus 0 M; n = 3-4 in each group). Data are expressed as mean±SEM, *p < 0.05, **p < 0.01, ***p < 0.001.
ODN decreases pro-oxidants and increases antioxidants in Aβ-treated primary cultured neurons
It is well known that oxidative stress damage plays an important role in the pathogenesis of AD. Therefore, we next explored the effect of ODN on Aβ-induced oxidative stress. After 4 h of pretreatment with 5μM Aβ1 - 42, the primary cultured cells were treated with ODN for 48 h in the presence of Aβ1 - 42. The results showed that a significant increase in the production of pro-oxidants including ROS (n = 4, 154.85±12.34%, p = 0.002; Fig. 3A) and i-NOS (n = 6, 118.35±3.44%, p = 0.008; Fig. 3C) was observed with Aβ treatment, which could be rescued by ODN treatment (ROS: n = 4, 118.00±4.98%, p = 0.020; Fig. 3A; i-NOS: n = 6, 91.21±6.48%, p = 0.019; Fig. 3C) and there was no difference of T-NOS among these groups. Furthermore, treatment with Aβ decreased the production of antioxidants, including GR (n = 4, 29.71±9.29%, p = 0.006; Fig. 3D) and T-AOC (n = 4, 72.09±5.47%, p = 0.002; Fig. 3E); however, ODN treatment significantly increased the activities of GR (n = 4, 87.89±18.30%, p = 0.017; Fig. 3D) and T-AOC (n = 4, 87.62±3.76%, p = 0.044; Fig. 3E). These results suggest that ODN had strong antioxidant capacity in AD.

ODN treatment diminishes ROS by increasing antioxidants and decreasing pro-oxidants in Aβ-treated primary cultured cells. A–E) ROS (A), pro-oxidants activities, including T-NOS (B) and i-NOS (C) and antioxidants, including GR (D), T-AOC (E) (ROS: for CTR, p = 0.002 versus Aβ, p = 0.273 versus Aβ + ODN, for Aβ, p = 0.020 versus Aβ + ODN; T-NOS: for CTR, p = 0.998 versus Aβ, p = 0.987 versus Aβ + ODN, for Aβ, p = 0.975 versus Aβ + ODN; i-NOS: for CTR, p = 0.008 versus Aβ, p = 0.502 versus Aβ + ODN; for Aβ, p = 0.019 versus Aβ + ODN; GR: for CTR, p = 0.006 versus Aβ, p = 0.757 versus Aβ + ODN; for Aβ, p = 0.017 versus Aβ + ODN; T-AOC: for CTR, p = 0.002 versus Aβ, p = 0.110 versus Aβ + ODN; for Aβ, p = 0.044 versus Aβ + ODN; n = 4–6 in each group). Data are expressed as means±SEM, *p < 0.05, **p < 0.01, ***p < 0.001.
ODN inhibits Aβ-induced apoptosis in primary cultured neurons
Mitochondrial dysfunction is a major feature in early AD [13], and the homeostasis of the MMP and intracellular Ca2+ are hallmark events in the progression of apoptosis [14]. To investigate the effect of ODN on the cell apoptosis, we detected MMP and intracellular Ca2+ concentration. We found a significant decrease of MMP in primary cultured neurons treated with Aβ1 - 42 (n = 4, 77.01±5.15%, p = 0.049; Fig. 4A) and ODN treatment was able to restore MMP (n = 4, 103.27±4.82%, p = 0.027; Fig. 4A). The Ca2+ concentration was elevated in Aβ-treated primary cultured neurons (n = 6, 165.61±13.61%, p < 0.001; Fig. 4B), which could be rescued by ODN treatment (n = 6, 126.46±8.29%, p = 0.023; Fig. 4B). In addition, cleaved caspase-3, an executor of apoptosis [15], was explored and an increase in Aβ-treated primary cultured neurons (n = 5, 168.81±15.36%, p = 0.028; Fig. 4E) was observed. ODN treatment, however, inhibited the increase of cleaved caspase-3 (n = 5, 95.82±14.30%, p = 0.023; Fig. 4E) and the total caspase-3 showed no difference in these groups.
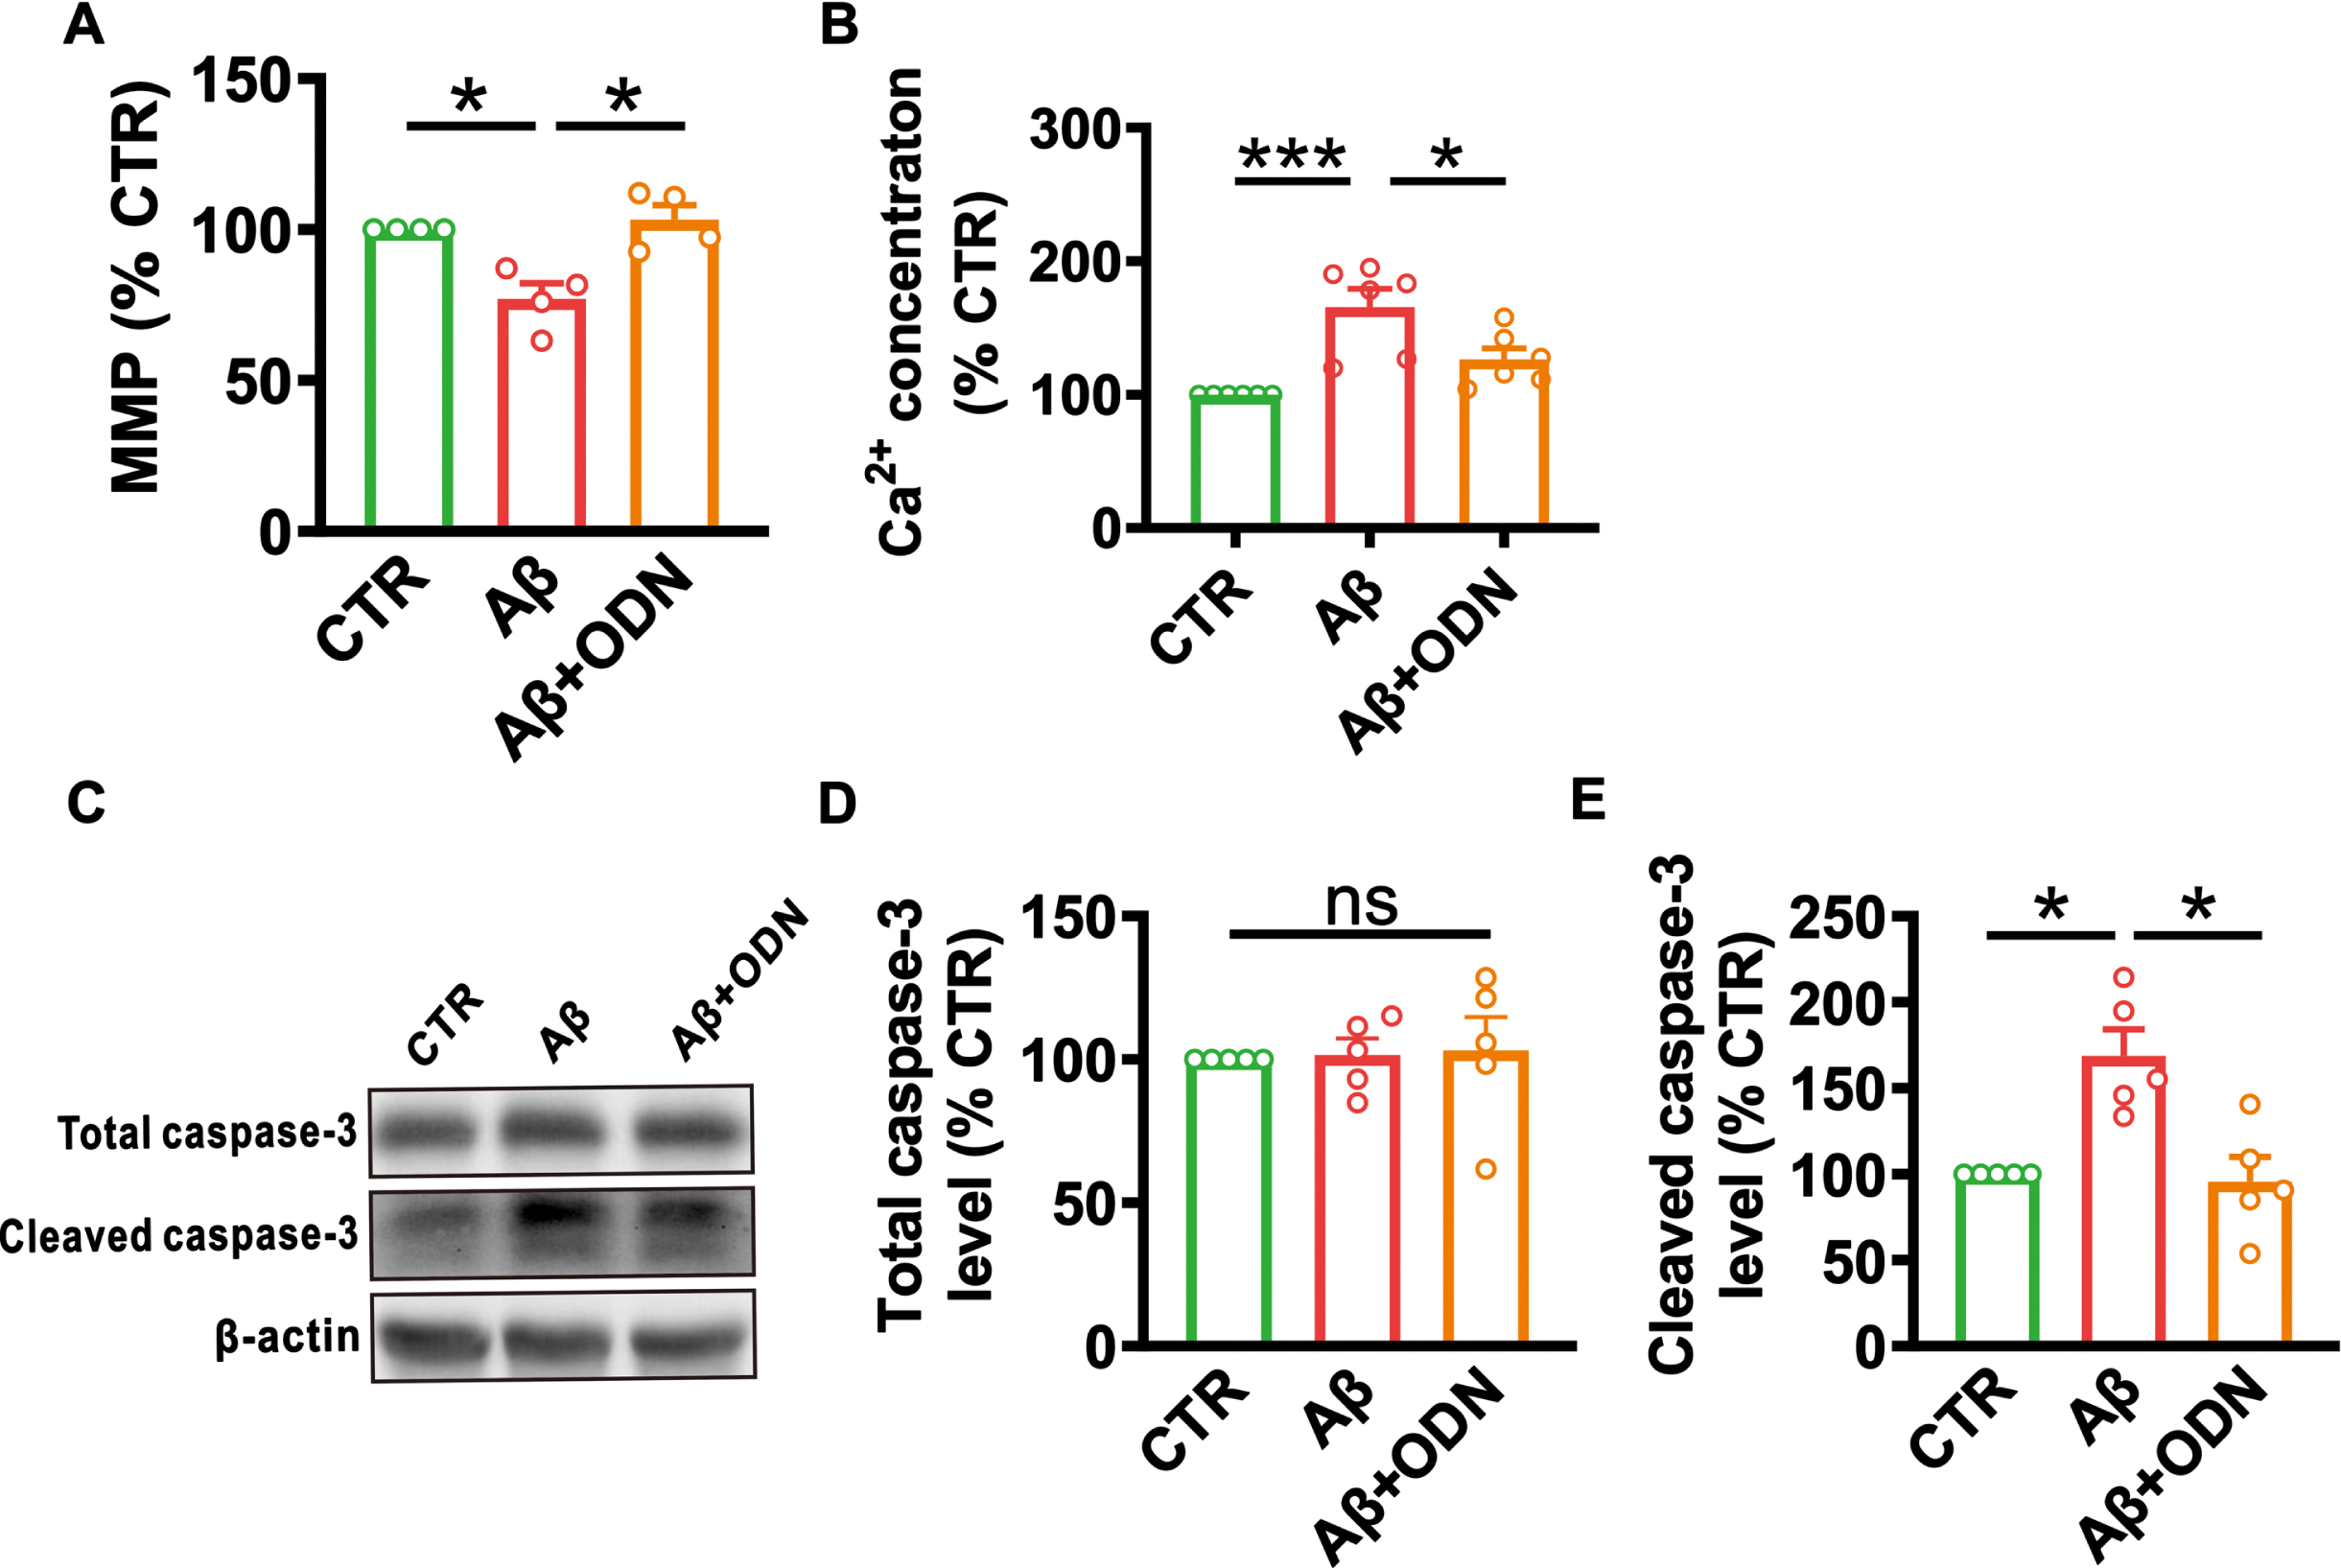
ODN treatment inhibits apoptosis in Aβ-treated primary cultured cells. A) MMP (for CTR, p = 0.049 versus Aβ, p = 0.869 versus Aβ + ODN; for Aβ, p = 0.027 versus Aβ + ODN; n = 4 in each group). B) Ca2+ concentration (for CTR, p < 0.001 versus Aβ, p = 0.138 versus Aβ + ODN; for Aβ, p = 0.023 versus Aβ + ODN; n = 6 in each group). C–E) The relative protein levels of total caspase-3 (D) and cleaved caspase-3 (E) (total caspase-3: for CTR, p = 0.987 versus Aβ, p = 0.989 versus Aβ + ODN, for Aβ, p = 0.999 versus Aβ + ODN; cleaved caspase-3: for CTR, p = 0.028 versus Aβ, p = 0.986 versus Aβ + ODN, for Aβ, p = 0.023 versus Aβ + ODN; n = 5 in each group). Data are expressed as mean±SEM, *p < 0.05, **p < 0.01, ***p < 0.001.
ODN rescues learning and memory deficits in Aβ-treated mice
We have reported that ODN inhibits AβPP processing, to test whether ODN affects the cognition of AD mice, we performed lateral ventricular administration of Aβ1 - 42 in WT mice (a common AD model) and injected ODN twice into the lateral ventricles on days 0 and 7 after Aβ1 - 42 administration. After two weeks of Aβ1 - 42 administration, the Morris water maze test was conducted. During the adaptation period, there was no significant difference in mean speed between the groups (PBS: 0.168±0.006 m/s; ODN: 0.168±0.011 m/s; Aβ: 0.153±0.019 m/s; Aβ + ODN: 0.170±0.012 m/s; p > 0.05; n = 6–8 in each group; Fig. 5A), indicating that the motor function of each group was not impaired. Meanwhile, we found that Aβ-treated mice exhibited significant spatial learning impairment due to the longer escape latency in finding hidden platform (p = 0.002 versus PBS; p = 0.011 versus ODN; Fig. 5B). However, the escape latency was markedly shortened with ODN treatment compared to Aβ-treated mice (p = 0.003 versus Aβ; Fig. 5B). In the probe test, the time spent in the hidden platform-located quadrant was much shorter in the Aβ-treated mice (PBS: 58.00±3.35 s; ODN: 41.04±5.80 s, p = 0.109 versus PBS; Aβ: 20.44±6.01 s, p < 0.001 versus PBS, p = 0.047 versus ODN; n = 6–8 in each group; Fig. 5D). However, ODN treatment significantly spent more time in the target zone compared to Aβ-treated mice (Aβ+ODN: 50.62±6.03 s, p = 0.004 versus Aβ; n = 6–8 in each group; Fig. 5D). These results demonstrate that ODN ameliorates the cognitive impairments in Aβ-treated mice.
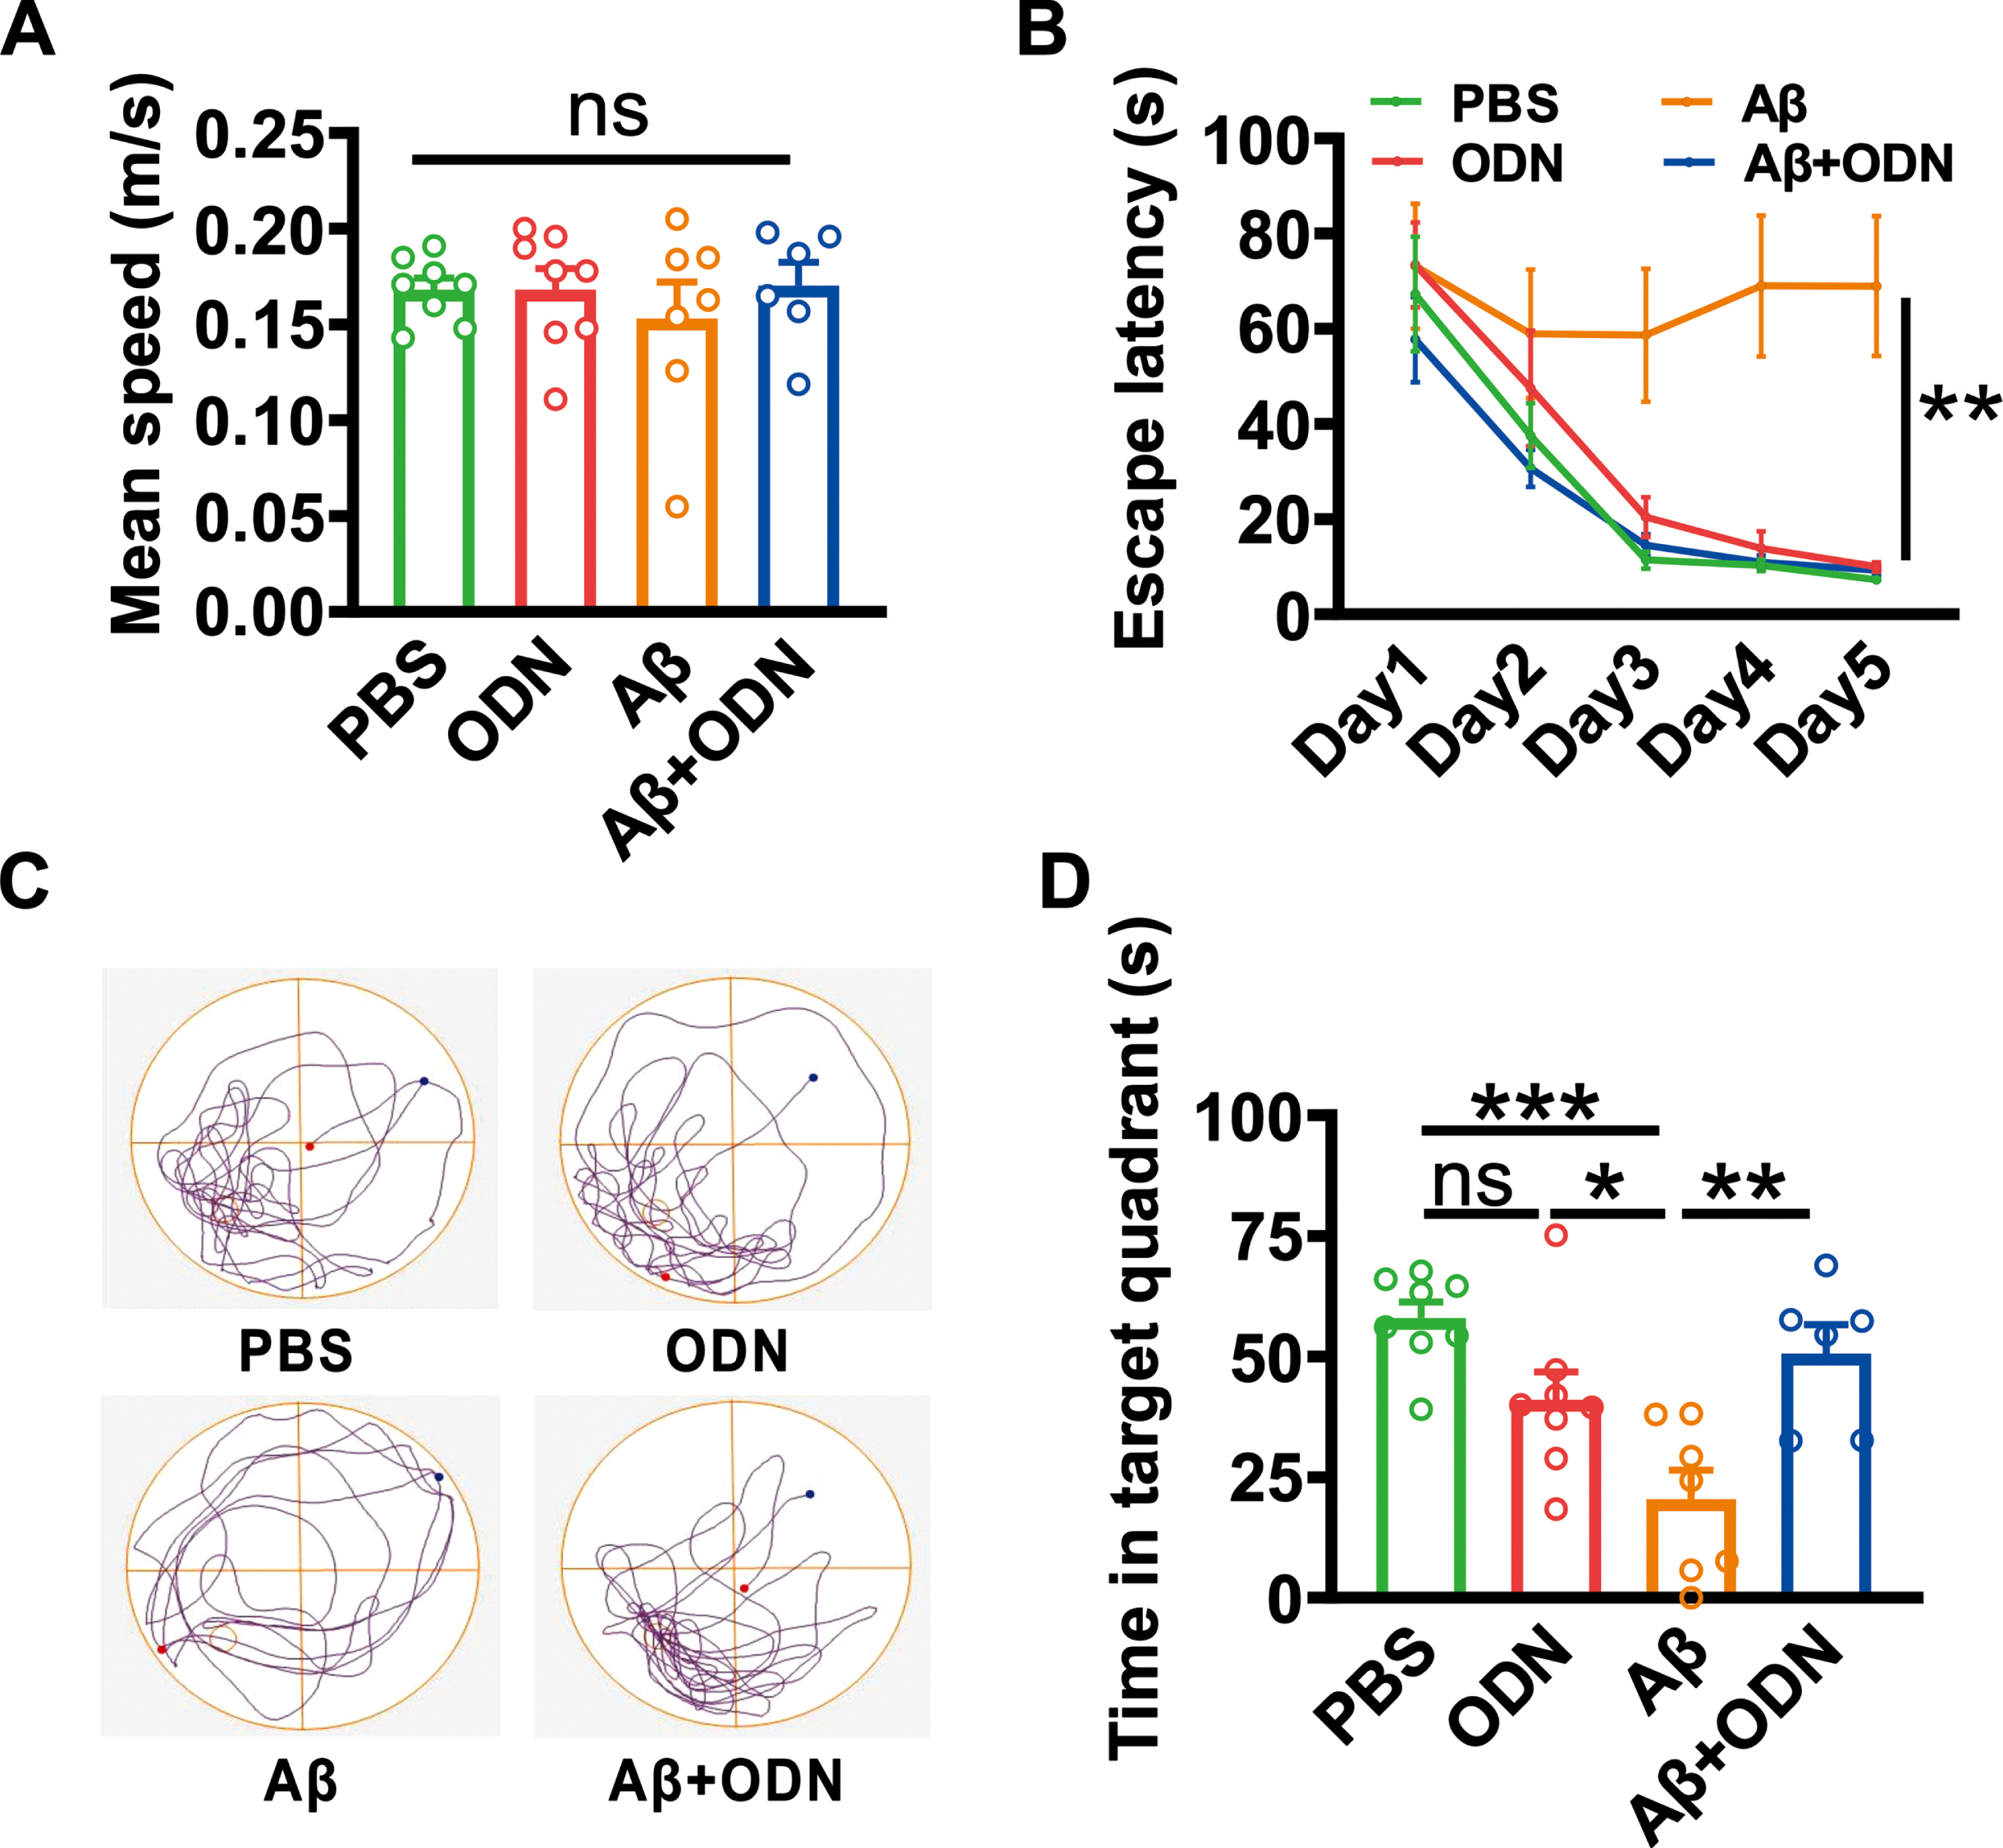
ODN treatment alleviates Aβ-induced spatial learning and memory decline. A) Mean speed travelled during the adaptation period (PBS: p = 1.000 versus ODN, p = 0.821 versus Aβ, p = 0.999 versus Aβ + ODN; ODN: p = 0.818 versus Aβ, p = 1.000 versus Aβ + ODN; Aβ: p = 0.795 versus Aβ + ODN; n = 6–8 in each group). B) The escape latency to the hidden platform during spatial learning during the Morris water maze test (PBS: p = 0.903 versus ODN, p = 0.002 versus Aβ, p = 0.996 versus Aβ + ODN; ODN: p = 0.011 versus Aβ, p = 0.833 versus Aβ + ODN; Aβ: p = 0.003 versus Aβ + ODN; n = 6–8 in each group). C) Representative track plot in the probe test. D) During the probe test, the time spent in the hidden platform-located quadrant (PBS: p = 0.109 versus ODN, p < 0.001 versus Aβ, p = 0.776 versus Aβ + ODN; ODN: p = 0.047 versus Aβ, p = 0.609 versus Aβ + ODN; Aβ: p = 0.004 versus Aβ + ODN; n = 6–8 in each group). Data are expressed as mean±SEM, *p < 0.05, **p < 0.01, ***p < 0.001.
ODN rescues hippocampal CA1 LTP in Aβ-treated mice
Synaptic plasticity is considered a major cellular mechanism underlying learning and memory [16]. We then detected the effect of ODN on hippocampal LTP in Aβ-treated mice after the behavioral test. The results showed that the LTP was impaired in Aβ-treated mice (133.09±7.20% versus 179.38±7.68% in PBS group to baseline, p = 0.001 versus PBS; Fig. 6A–C), while ODN treatment restored the impairment of LTP (Aβ+ODN: 167.58±8.30% to baseline, p = 0.018 versus Aβ; Fig. 6A–C).
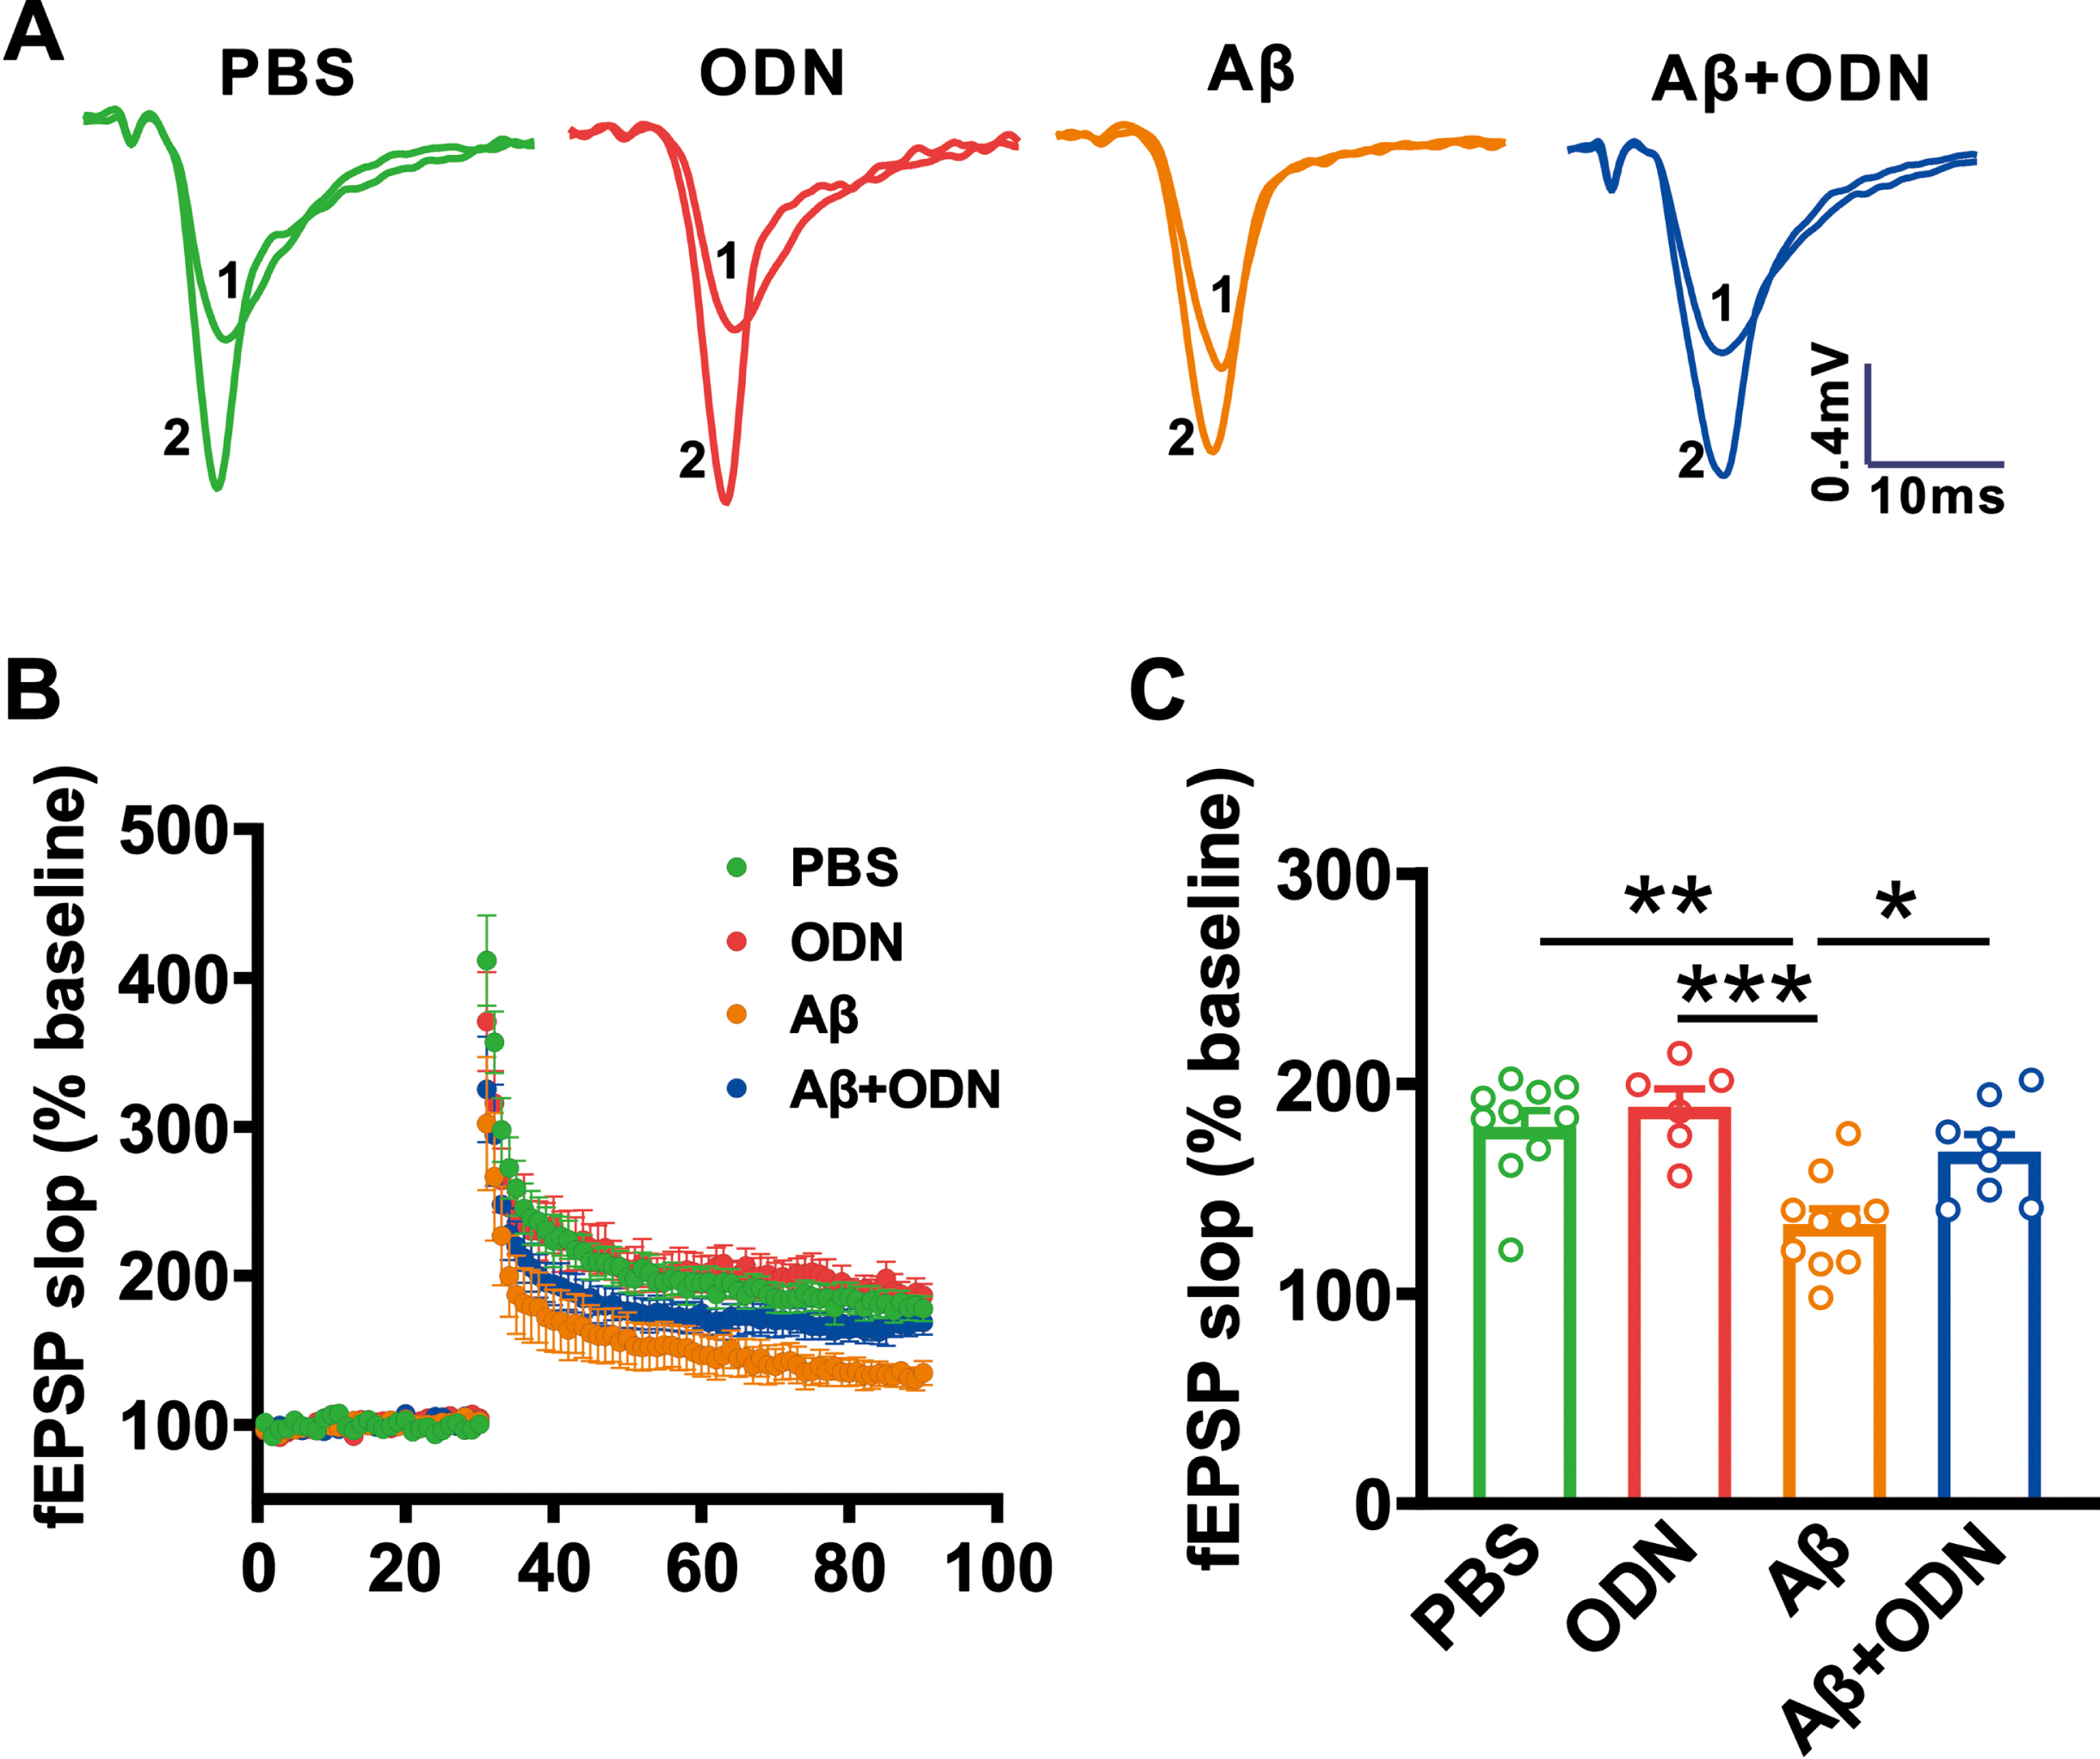
ODN restores hippocampal CA1 LTP in Aβ-treated mice. A, B) Representative traces of fEPSP, and the plots of the normalized slopes of the fEPSP 5 min before and 55 min after TBS delivery. C) Bar graphs of the average percentage changes in the fEPSP slope 55–60 min after TBS delivery (PBS: p = 0.854 versus ODN, p = 0.001 versus Aβ, p = 0.706 versus Aβ + ODN; ODN: p < 0.001 versus Aβ, p = 0.336 versus Aβ + ODN; Aβ: p = 0.018 versus Aβ + ODN; n = 6–10 slices from 3–5 mice in each group). Data are expressed as means±SEM, *p < 0.05, **p < 0.01, ***p < 0.001.
ODN rescues oxidative stress and apoptosis in Aβ-treated mice
We have previously demonstrated that ODN could inhibit oxidative stress and apoptosis in Aβ-treated primary cells, and then we wanted to further examine whether ODN inhibits oxidative stress and apoptosis in vivo. The results showed that the pro-oxidants, such as ROS (219.08±16.72%, p = 0.002 versus PBS, Fig. 7A) and i-NOS (256.97±8.10%, p < 0.001 versus PBS, Fig. 7C) levels were increased and the amount of antioxidants including GR (27.97±3.97%, p < 0.001 versus PBS, Fig. 7D) and T-AOC (T-AOC: 38.31±1.77%, p < 0.001 versus PBS, Fig. 7E) were decreased in Aβ treated mice. However, ODN restored the increase of pro-oxidants (for ROS: 132.07±13.66%, p = 0.009 versus Aβ, Fig. 7A; for i-NOS: 108.14±20.89%, p = 0.005 versus Aβ, Fig. 7C) and the decreased of antioxidants (for GR: 100.34±4.42%, p < 0.001 versus Aβ, Fig. 7D; for T-AOC: 77.91±4.10%, p < 0.001 versus Aβ, Fig. 7E) and there was no difference in T-NOS among all groups.
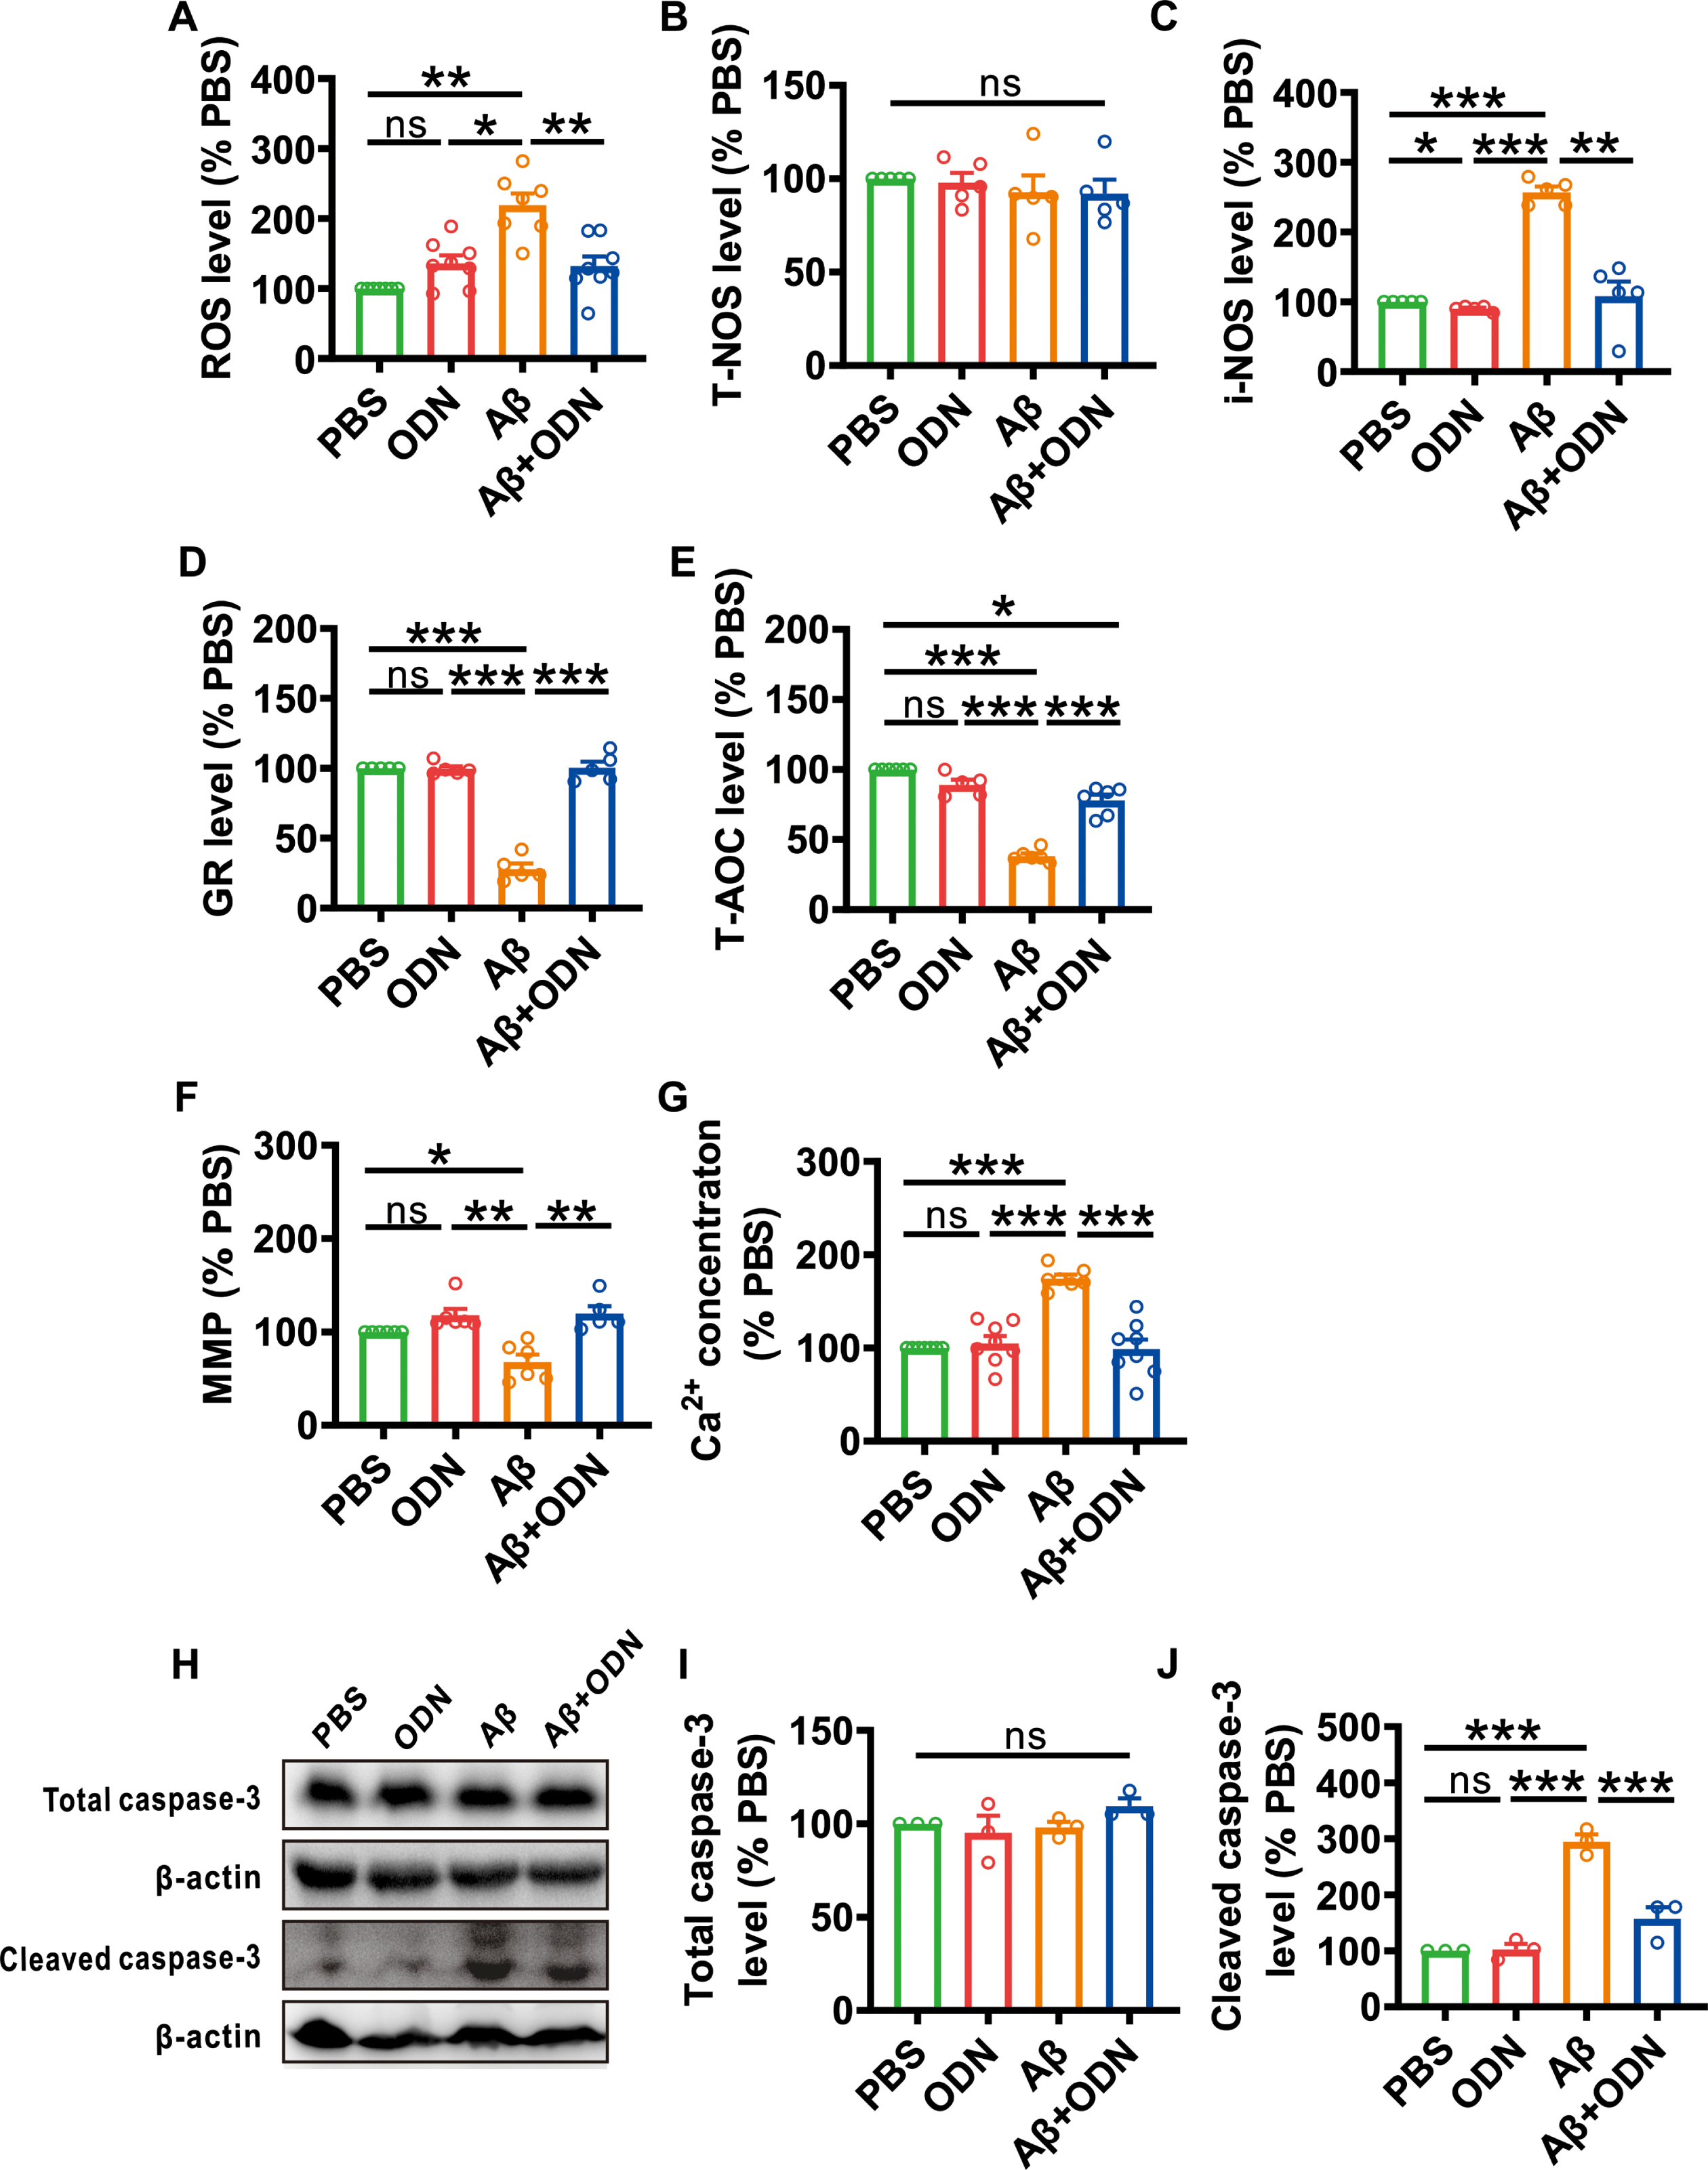
ODN rescues oxidative stress and apoptosis in Aβ-treated mice. A) ROS (PBS: p = 0.073 versus ODN, p = 0.002 versus Aβ, p = 0.225 versus Aβ + ODN; ODN: p = 0.010 versus Aβ, p = 1.000 versus Aβ + ODN; Aβ: p = 0.009 versus Aβ + ODN; n = 7-8 in each group). B) T-NOS (PBS: p = 0.996 versus ODN, p = 0.855 versus Aβ, p = 0.818 versus Aβ + ODN; ODN: p = 0.940 versus Aβ, p = 0.915 versus Aβ + ODN; Aβ: p = 1.000 versus Aβ + ODN; n = 5 in each group). C) i-NOS (PBS: p = 0.015 versus ODN, p < 0.001 versus Aβ, p = 0.998 versus Aβ + ODN; ODN: p < 0.001 versus Aβ, p = 0.925 versus Aβ + ODN; Aβ: p = 0.005 versus Aβ + ODN; n = 5 in each group). D) GR (PBS: p = 1.000 versus ODN, p < 0.001 versus Aβ, p = 1.000 versus Aβ + ODN; ODN: p < 0.001 versus Aβ, p = 1.000 versus Aβ + ODN; Aβ: p < 0.001 versus Aβ + ODN; n = 5 in each group). E) T-AOC (PBS: p = 0.147 versus ODN, p < 0.001 versus Aβ, p = 0.014 versus Aβ + ODN; ODN: p < 0.001 versus Aβ, p = 0.300 versus Aβ + ODN; Aβ: p < 0.001 versus Aβ + ODN; n = 5-6 in each group). F) MMP (PBS: p = 0.198 versus ODN, p = 0.048 versus Aβ, p = 0.277 versus Aβ + ODN; ODN: p = 0.005 versus Aβ, p = 1.000 versus Aβ + ODN; Aβ: p = 0.008 versus Aβ + ODN; n = 5-6 in each group). G) Ca2+ concentration (PBS: p = 0.986 versus ODN, p < 0.001 versus Aβ, p = 1.000 versus Aβ + ODN; ODN: p < 0.001 versus Aβ, p = 0.997 versus Aβ + ODN; Aβ: p < 0.001 versus Aβ + ODN; n = 7-8 in each group). H–J) The relative protein levels of total caspase-3 (I) and cleaved caspase-3 (J) (total caspase-3: PBS: p = 0.910 versus ODN, p = 0.993 versus Aβ, p = 0.606 versus Aβ + ODN; ODN: p = 0.978 versus Aβ, p = 0.291 versus Aβ + ODN; Aβ: p = 0.463 versus Aβ + ODN; cleaved caspase-3: PBS: p = 0.999 versus ODN, p < 0.001 versus Aβ, p = 0.068 versus Aβ + ODN; ODN: p < 0.001 versus Aβ, p = 0.081 versus Aβ + ODN; Aβ: p < 0.001 versus Aβ + ODN; n = 3 in each group). Data are expressed as mean±SEM, *p < 0.05, **p < 0.01, ***p < 0.001.
MMP, intracellular Ca2+ concentration, and cleaved-caspase-3 were examined to detect the level of apoptosis. The results showed that the MMP was decreased in Aβ-treated mice (67.72±8.11%, p = 0.048 versus PBS, Fig. 7F), which could be rescued by ODN treatment (119.57±8.19%, p = 0.008 versus Aβ, Fig. 7F). Intracellular Ca2+ concentration and cleaved caspase-3 levels showed a notable rise in Aβ-treated mice (for Ca2+ concentration: 174.40±4.24%, p < 0.001 versus PBS, Fig. 7G; for cleaved caspase-3: 294.74±13.34%, p < 0.001 versus PBS, Fig. 7J), and these increases could be recovered by ODN treatment (for Ca2+ concentration: 98.61±10.40%, p < 0.001 versus Aβ, Fig. 7G; for cleaved caspase-3: 156.88±21.05%, p < 0.001 versus Aβ, Fig. 7J). The total caspase-3 showed no difference among these groups. These results further authenticate the potent antioxidant and anti-apoptotic ability of ODN.
DISCUSSION
In this current study, we find that DBI expression is decreased in AD model mice and cells and ODN treatment alleviates AβPP processing by decreasing the expression of BACE1, PS1, and CTF. We also report that ODN inhibits oxidative stress-induced apoptosis and ultimately ameliorates learning and memory impairment and long-term potentiation in Aβ-treated mice. The present data confirm that ODN might be a potential therapeutic agent for AD.
Given its high levels of energy and oxygen requirements, the brain is particularly vulnerable to oxidative damage, especially in AD. AD brains have been observed to contain neuronal Cu2+ and Zn2+ levels that are approximately three times higher than normal samples. These positive ions can attach to the Aβ’s hydrophilic N terminus, undertake redox reactions and generate substantial levels of ROS. As a result, there appears to be a positive feedback cycle of elevated oxidation and excessive ROS generation [17]. ROS is considered to be one of the pivotal factors in the pathogenesis of AD, as it is associated with Aβ accumulation. ROS may be enhanced in patients in the early stages of AD due to the accumulation of Aβ, while low levels of antioxidants and their enzymes have been found in AD patients. Furthermore, it was observed that imperfections related to the defense mechanisms of antioxidants led to high levels of ROS, which further enhanced the production of Aβ [18, 19]. Actually, the aggregation of ROS-induced Aβ protein in AD leads to lysosomal membrane degradation and eventually cell death, thus leading to cognitive impairment [20]. It is apparent that oxidative stress is critical in AD and may be considered an essential central factor in the etiology of the disease.
ODN, a short 18-amino acid peptide, as well as its precursor DBI binds to the benzodiazepine site of the GABAAR where they serve as xenobiotic neuromodulators [7, 21]. In this study, we found that the DBI expression was decreased in AD model mice and cells as well as in Aβ-treated primary cultured cells. In contrast, some studies have shown that serum expression of DBI is increased in AD patients [22], perhaps due to the inability of DBI or ODN to cross the blood-brain barrier [10], the expression of DBI in brain and blood may be different.
Previous studies have shown that ODN scavenges the ROS accumulation by stimulating antioxidant enzymes including superoxide dismutase, catalase, and increasing glutathione in 6-OHDA and H2O2-induced cultured astrocytes [11, 23]. In line with these findings, we found that ODN decreased the production of pro-oxidants such as ROS and i-NOS while increasing the level of the antioxidant activity including T-AOC and GR in Aβ-treated primary cells and mice.
There is increasing evidence that cell death can be inhibited by reducing ROS, while ODN has also been noted to suppress cell apoptosis via promoting the Bcl-2 and inhibiting the Bax as well as preventing a decrease in MMP and inhibiting caspase-3 [11, 24]. ODN is also a ligand for G protein-coupled receptors (GPCR), and ODN can protect against oxidative stress-induced apoptosis by activating GPCR [25, 26]. Consistent with these studies, in the present study, intracellular Ca2+ concentration and cleaved-caspase-3 were elevated and MMP was decreased in Aβ-treated primary cells and mice, which could be rescued by ODN treatment. However, ODN not only inhibits apoptosis but also promotes neurogenesis. Several studies have shown that DBI regulates the balance between conserving the stem cell pool and neurogenesis in subventricular zone [27] and hippocampal subgranular zone by reducing GABA signaling [28] through ODN. Nevertheless, the underlying regulatory mechanism of ODN in AD needs to be further investigated in the future.
The imbalance between Aβ generation and clearance is considered to be the main cause of AD [29]. Aβ is derived from AβPP, which is sequentially cleaved by BACE1 and γ-secretase, whereas, the clearance of Aβ is mediated by microglial phagocytosis and proteolytic degradation by enzymes such as NEP and IDE [30]. It has been well documented that inhibiting ROS can inhibit Aβ accumulation. Similarly in this study, ODN at a low concentration of 10–14 M decreased the expression of BACE1, PS1, and CTF [31], while it had no effect on AβPP and IDE. A growing body of evidence suggests that reduction of Aβ, either by inhibiting AβPP processing to produce Aβ or by activating NEP or IDE to degraded Aβ is able to rescue the cognitive impairments in AD. Meanwhile, DBI knockout mice were more susceptible than wild-type animals to MPTP neurotoxicity [12]. A recent study also demonstrated that ODN could rescue the learning and memory in HIBD rats [32]. Consistent with the protective effect of ODN on cognition, in our studies, ODN rescued learning and memory deficits and synaptic plasticity in Aβ-treated mice.
In summary, our results suggest that ODN can inhibit oxidative stress-induced apoptosis in Aβ-treated primary cultured cells and mice, and ultimately alleviate Aβ-induced cognitive impairments, indicating that ODN is a potential therapeutic agent for AD.
Footnotes
ACKNOWLEDGMENTS
We are grateful to the other members of our lab for their technical support and helpful suggestions.
FUNDING
This work was supported by the National Natural Science Foundation of China (82071395 and 82001158), the Natural Science Foundation of Chongqing (cstc2020jcyj-zdxmX0004, cstc2021ycjh-bgzxm0186 and 2022NSCQ-LZX0018), the Science and Technology Research Program of Chongqing Municipal Education Commission (KJZD-K201900403), Innovation Research Group at Institutions of Higher Education in Chongqing (CXQTP19034), CQMU Program for Youth Innovation in Future Medicine (W0044).
CONFLICT OF INTEREST
The authors have declared that no conflict of interest exists. Zhifang Dong is an Editorial Board Member of this journal but was not involved in the peer-review process nor had access to any information regarding its peer-review.
DATA AVAILABILITY
The data supporting the findings of this study are available within the article and/or its supplementary material.