
Abstract
Background:
Objective measurement of regional cortical atrophy in individual patients would be a highly desirable adjunct for diagnosis of degenerative dementias.
Objective:
We hypothesized that increasing the resolution of magnetic resonance scans would improve the sensitivity of cortical atrophy detection for individual patients.
Methods:
46 participants including 8 semantic-variant primary progressive aphasia (svPPA), seven posterior cortical atrophy (PCA), and 31 cognitively unimpaired participants underwent clinical assessment and 3.0T brain scans. SvPPA and PCA were chosen because there is overwhelming prior knowledge of the expected atrophy pattern. Two sets of T1-weighted images with 0.8 mm3 (HighRes) and conventional 1.0 mm3 (ConvRes) resolution were acquired. The cortical ribbon was segmented using FreeSurfer software to obtain surface-based thickness maps. Inter-sequence performance was assessed in terms of cortical thickness and sub-cortical volume reproducibility, signal-to-noise and contrast-to-noise ratios. For clinical cases, diagnostic effect size (Cohen’s d) and lesion distribution (z-score and t-value maps) were compared between HighRes and ConvRes scans.
Results:
The HighRes scans produced higher image quality scores at 90 seconds extra scan time. The effect size of cortical thickness differences between patients and cognitively unimpaired participants was 15–20% larger for HighRes scans. HighRes scans showed more robust patterns of atrophy in expected regions in each and every individual patient.
Conclusions:
HighRes T1-weighted scans showed superior precision for identifying the severity of cortical atrophy in individual patients, offering a proof-of-concept for clinical translation. Studying svPPA and PCA, two syndromes with well-defined focal atrophy patterns, offers a method to clinically validate and contrast automated algorithms.
INTRODUCTION
Structural magnetic resonance imaging (MRI) is a routine investigation in suspected dementia [1, 2]; it is useful for evaluating vascular burden and excluding incidental pathology. Rating of regional cortical atrophy is potentially important for differential diagnosis in suspected dementia patients. Unfortunately, visual ratings are subjective, and may potentially lead to false-positive or false-negative reports [3]. Objective rating through the generation of cortical thickness maps in comparison to a healthy population has been proposed to mitigate this problem [4]. At a group level, cortical thickness has been linked with cognitive and behavioral functions in healthy populations [5, 6], preclinical Alzheimer’s disease (AD) [7], symptomatic AD [8, 9], and in frontotemporal dementia [10]. At a patient level, however, the reliability of cortical thickness to identify neurodegeneration for individual patients remains to be established in clinical practice [11–13]. Cortical thickness estimations, while highly reliable across scanners [14, 15], are often impacted by biological factors (including age [4] and sex [16]), and scanning parameters (spatial resolution, acquisition parameter variability, movement). One challenge is that standard “high-resolution” volumetric MRI for cortical thickness measurement typically employs T1-weighted (T1 W) images with voxel resolutions of around 1.0 mm3 whereas the cortical ribbon thickness itself varies between 1 to 4.5 mm across the brain [17]. In other words, the resolution of the scan is low compared to the anatomy it is measuring, in turn, making it difficult to accurately identify cortical thinning in individual patients. Increasing the spatial resolution to a sub-millimeter voxel size can improve thickness estimation by reducing the partial-volume effect (PVE), especially for thinner regions [18–21]. The reduced PVE may directly improve contrast-to-noise-ratio (CNR) which is essential for visual or automated cortical thickness estimation. However, higher resolution may negatively impact image quality in terms of reduced signal-to-noise (SNR) and increased motion from longer scan times. To overcome these limitations, various techniques have been employed including multi-echo averaging to create a super-resolution T1 W [19], motion correction [22, 23], and imaging at ultra-high field 7T scanners [18, 24]. To our knowledge, no prior study compared the impact of 3T cortical thickness estimation between conventional 1.0 mm3 and higher spatial resolution scans directly on the same patients with degenerative brain disease. We tested whether increasing the resolution of T1 W images at 3T could improve sensitivity to detect regional cortical thinning in dementia patients. To this end, we compared conventional (1.0×1.0×1.0 mm3) and high (0.8×0.8×0.8 mm3) resolution T1 W scans; as voxels are cubes, this higher resolution means the voxel volume is approximately halved (from 1 mm3 to 0.51 mm3). While the improved resolution may, intuitively, seem a positive step, it is possible that factors such as decreased SNR (the amount of signal from the tissue that contributes to each voxel decreases as the voxel size decreases while the amount of noise remains relatively constant) or increased motion artefacts from a longer acquisition could lead to a loss of sensitivity. Furthermore, our results can be interpreted as a comparison between anatomical MRI protocols proposed by the Human Connectome Project (HCP, 0.8 mm3) and Alzheimer’s Disease Neuroimaging Initiative (ADNI, 1.0 mm3) studies in the context of neurodegeneration.
Another major challenge to clinical validation is the absence of ground-truth, i.e., if the two scan types yield different results, how can one know which is the more accurate depiction of reality? We dealt with this issue by studying two uncommon clinical syndromes—semantic-variant primary progressive aphasia (svPPA) and posterior cortical atrophy (PCA)—in which there is overwhelming prior knowledge of the expected atrophy pattern. SvPPA is known to be associated with rostro-ventral temporal lobe degeneration [25–28] and PCA with occipital and caudal parieto-temporal degeneration [29–31]. Thus, we tested which scan resolution would most robustly detect the expected atrophy pattern in each patient. In addition, image quality was compared using cross-sectional and longitudinal data available on a subset of cognitively unimpaired (CU) participants, and the precision of cortical thickness estimation was compared using a group-wise analysis of patient groups versus CU (effect size and t-value metrics).
MATERIAL AND METHODS
Ethics statement
The study obtained approval from the Mater Misericordiae Ltd Human Research Ethics Committee (EC00332).
Participants
Eight patients with svPPA (62.1±5.0 years of age, three females) and seven with PCA (66.1±4.9 years of age, three females), along with 31 CU participants (67.1±7.3 years of age, 16 females) were included. All patients were diagnosed by an experienced cognitive neurologist (PJN) without any knowledge of MRI data. Dementia severity was assessed by the Mini-Mental State Examination (MMSE) [32] and Addenbrooke’s cognitive examination III (ACE-III) [33]. The characteristics of the patient population are summarized in Table 1. This table includes selected neuropsychological tests to highlight the characteristic deficits of the two syndromes, namely: copy and recall of the Rey-Osterreith Complex Figure (ROCF) [34]; cube analysis from the Visual Object and Space Perception (VOSP) battery [35]; and naming and semantic associative knowledge from the Sydney Language Battery (SYDBAT) [36].
Participant characteristics. CU, cognitively unimpaired; svPPA, semantic-variant primary progressive aphasia; PCA, posterior cortical atrophy; MMSE, mini-mental state examination; ACE III, Addenbrooke’s cognitive examination III; SYDBAT, Sydney Language Battery; ROCF, Rey-Osterreith Complex Figure; Cube analysis from the Visual Object and Space Perception (VOSP) battery
Four CU participants were excluded from the study due to motion artefacts (not included in the above CU count). In addition, for the longitudinal analysis of scan-rescan reproducibility, 10 of the CU participants (61.4±5.7 years of age, six female) were rescanned (17±7.8 months interval between baseline and follow-up acquisition).
MRI acquisition
Each participant underwent a neuroimaging session on a 3.0T Siemens Prisma scanner (Siemens Healthineers, Erlangen, Germany) with a 64-channel head coil (software version VE11). Each participant was positioned so that the isocenter of the scanner magnet was between the thalami, and each scan was oriented to the anterior commissure-posterior commissure (ac-pc) line in sagittal view and the inter-hemispheric fissure in coronal view (previously unpublished observations from our laboratory have found that these steps are particularly important for obtaining optimal results). Two sets of 3-Dimensional Magnetization-Prepared Rapid Gradient-Echo Imaging (MPRAGE) sequences same as HCP (0.8 mm3) and ADNI (1.0 mm3) studies were acquired. The higher resolution (HighRes) MPRAGE was acquired with 0.8 mm3 spatial resolution, repetition/echo/inversion times = 2500/2.22/1000 ms, flip angle 8°, field-of-view 256×240×166 mm, matrix size 320×300×208, bandwidth of 220 Hz/Px, IPAT2 with reference line phase encoding (PE) = 32 and total acquisition time of 6:54 minutes. The conventional resolution (ConvRes) MPRAGE was acquired with 1.0 mm3 spatial resolution, repetition/echo/inversion times = 2300/2.98/900 ms, flip angle 9°, field-of-view 256×256×192 mm, matrix size 256×256×192, bandwidth of 240 Hz/Px, IPAT2 with PE = 24 and total acquisition time of 5:21 minutes. The phase and slice partial Fourier were turned off for both sequences. The k-space data were stored for CU participants to calculate a pre-scan noise image. The HighRes and ConvRes scans, in that order, were always acquired at the same scanning session for each participant using the identical orientation as described above. To address the presence of motion in later scans, images were carefully inspected for motion artefacts and scans were only included in the study if both passed this quality check.
MRI processing
The FreeSurfer 7.2.0 software was used to automatically segment and parcellate T1 W scans and generate surface meshes. The standard processing script “recon-all” was run with default parameters along with “-cm” flag to conform volumes to the acquired resolution (particularly essential for 0.8 mm3 voxel size of HighRes scan). The surfaces were registered to the fsaverage standard space for surface-based thickness comparisons using “-qcache -measure thickness -fwhm 15” flag (for both ConvRes and HighRes). After reviewing the segmentation results by an expert neurologist, two datasets were identified with inaccurate boundaries in the temporal lobe. These datasets were manually edited by placing control points to specify several white-matter voxels. A surface-based smoothing operation with a full-width-half-maximum of 15 mm was applied to the cortical thickness maps prior to group comparison (“-fwhm 15”) [37].
Analysis
Diagnostic confidence
For the individual subject-level analysis, the 15 mm-smoothed cortical thickness maps were transformed into z-scores to generate a heat map of cortical thinning for each individual patient in comparison to the CU group. Maps were also created for each individual control participant using a leave-one-out approach. The vertex-wise z-score transformation was performed in semi-inflated fsaverage space using an in-house Python toolbox for mesh manipulation. For the presentation of results, only negative z-score values representing cortical thickness loss in the range of –1.5 to –6 standard deviation were shown.
In the group-wise analysis, regional thickness estimation was compared between each patient group and all 31 CU (only baseline acquisition) participants (svPPA versus CU and PCA versus CU). With the prior knowledge of the expected location of cortical thinning, Cohen’s d effect size was calculated as the magnitude of thickness difference between svPPA and CU in the temporal lobe and between PCA and CU in the occipital lobe. This statistical analysis was conducted using R software (version 3.2). Similarly, a vertex-wise t-test was performed between the groups using 15 mm-smoothed cortical thickness meshes (whole cortical ribbon) to provide a group-level atrophy pattern for each patient group. The significance level for this analysis was set to p = 1×10⁻⁵ corrected for multiple comparisons using a false discovery rate (FDR).
Quality and reproducibility analysis
For image quality assessment, SNR and CNR of gray-matter were calculated on both HighRes and ConvRes scans of 10 CU participants. For these participants, the raw k-space data were stored to create a pre-scan noise image (i.e., data acquired without RF pulse). This is a preferred approach for CNR and SNR calculation due to the high variability of noise in the background when parallel imaging is used [38].
To analyze the longitudinal reproducibility the intraclass correlation coefficient (ICC) was calculated (two-way mixed effect ICC model with fixed raters) using the follow-up scans for the 10 CU participants.
SNR, CNR, and ICC were calculated on the whole cortex (thickness), four cortical lobes (thickness), and two sub-cortical regions (volume) obtained from the FreeSurfer parcellation procedure. For the CNR, SNR, and ICC, a higher score means a higher quality image.
RESULTS
A comparison of individual z-score maps for svPPA and PCA patients showed more extensive and significant patterns of atrophy in the expected distribution with HighRes scans in all patients (Fig. 1). The t-map of thickness differences between patient and cognitively unimpaired (CU) groups (Fig. 2) demonstrated higher effect sizes for HighRes scans. The z-score maps generated for individual CU participants showed only minor, sporadic variations in cortical thickness (Supplementary Figure 1).
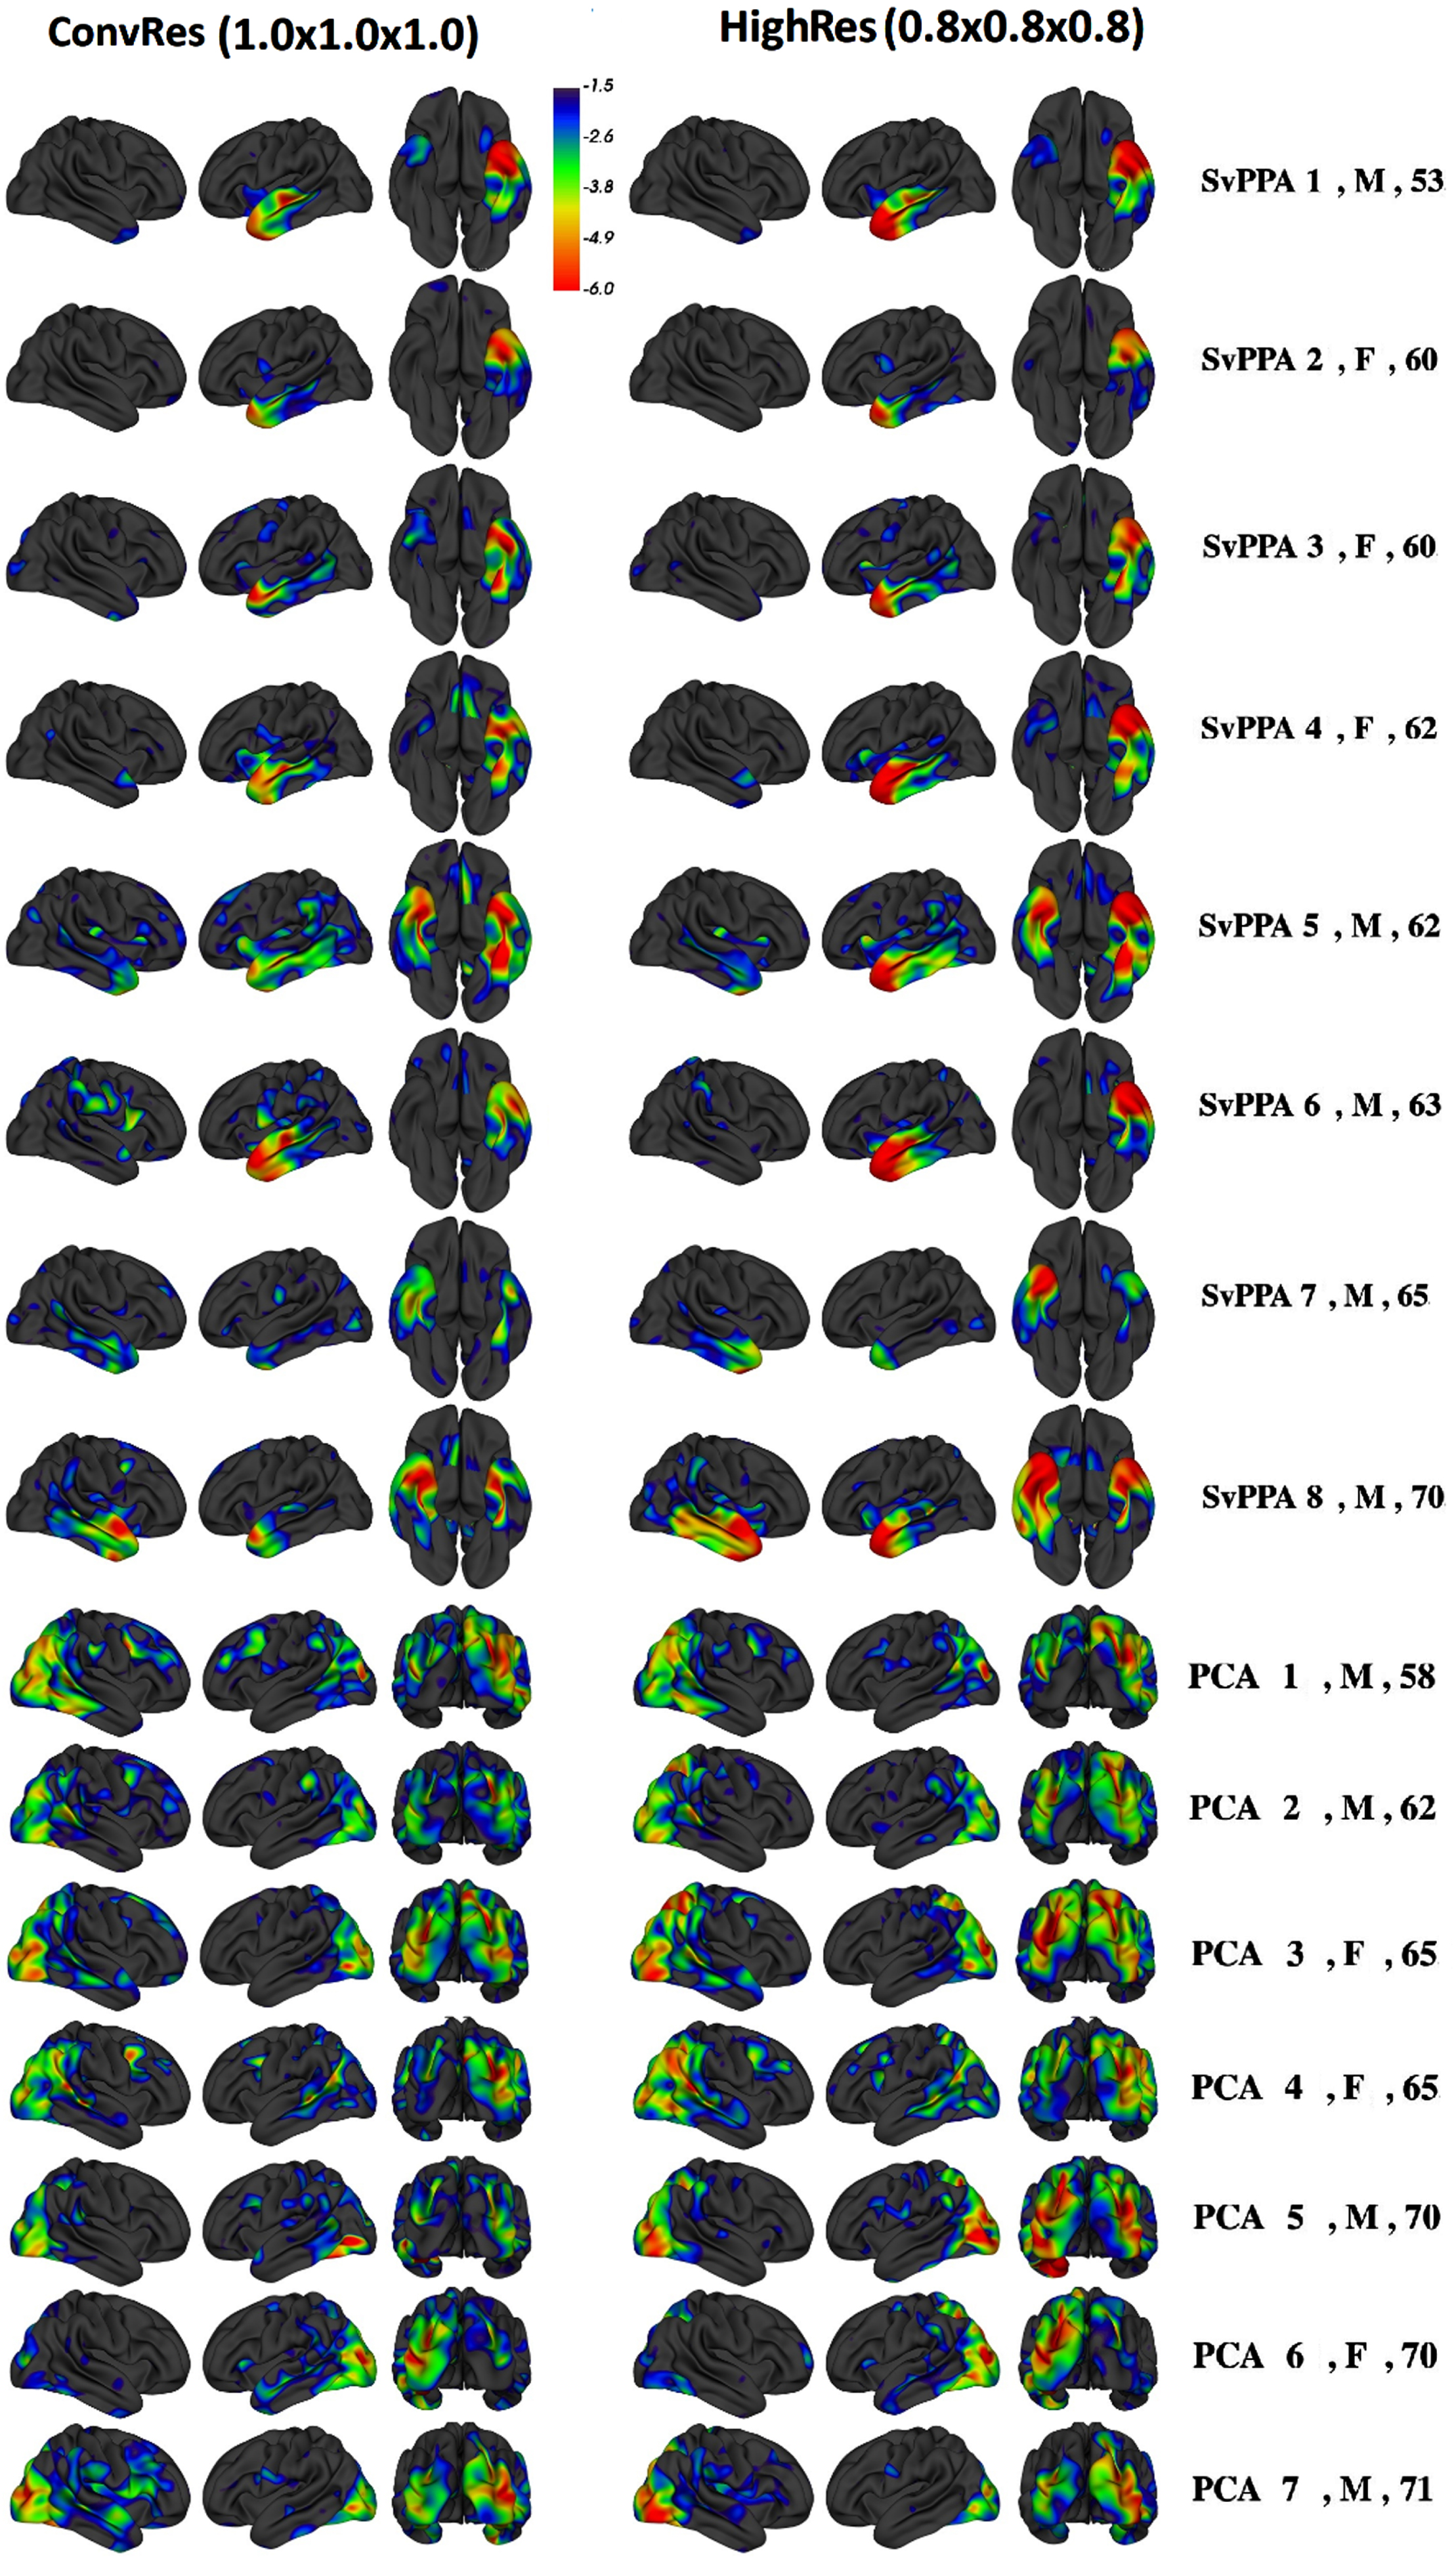
Patients’ z-score maps comparing 1.0×1.0×1.0 mm3 (ConvRes) and 0.8×0.8×0.8 mm3 (HighRes) MPRAGE scans (left and right hemispheres, along with an inferior view for svPPA and posterior view for PCA patients).
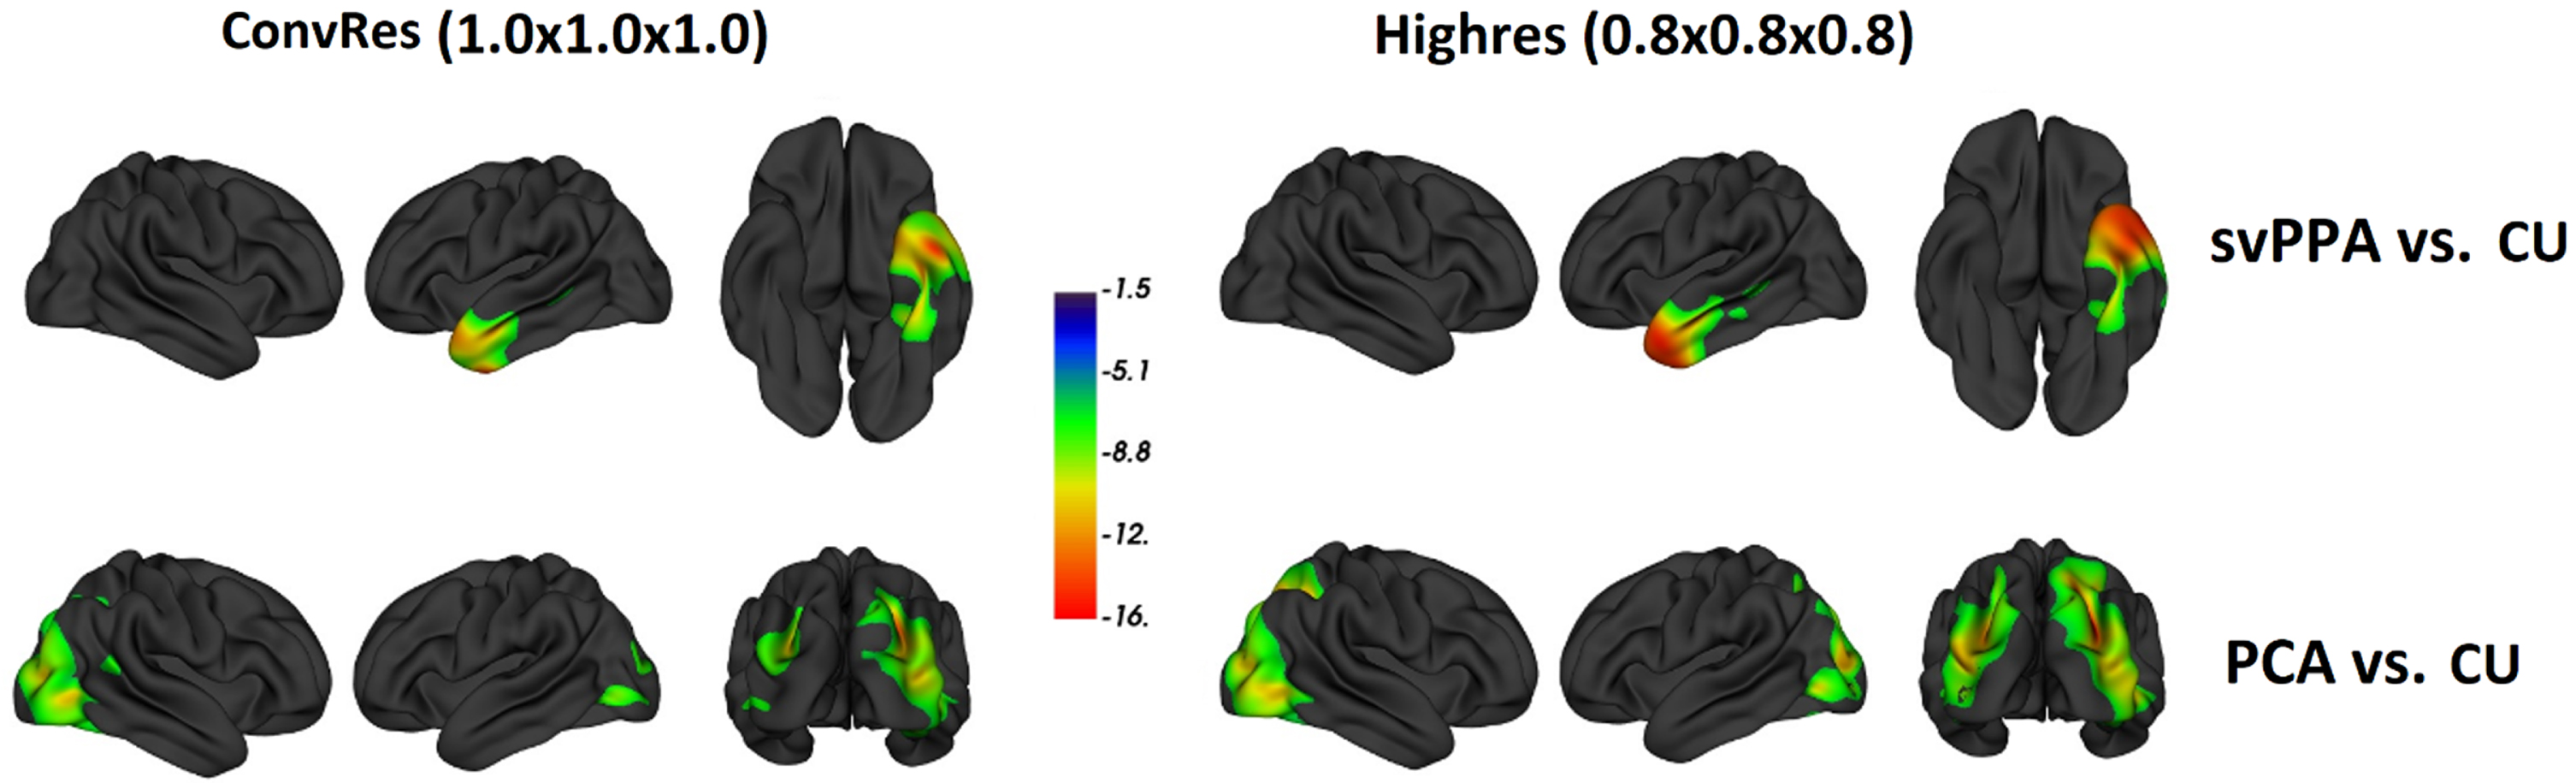
The t-map of thickness differences between patient and cognitively unimpaired (CU) groups. The t-values are obtained from a general linear model comparing the cortical thickness of the svPPA group with the CU group (top row) and the PCA group with the CU group (bottom row). The significance level for this analysis was set to p = 0.001 FDR corrected.
The cortical thickness estimation for CU, svPPA and PCA groups using ConvRes and HighRes scans are shown in Table 2. The HighRes scans produced thinner cortex in all groups compared to ConvRes scans and this difference was more pronounced in patients. Individual atrophy masks (defined by cut-off values using the 15th percentiles from the cortical thickness distribution in temporal and posterior regions) are shown in Supplementary Figures 2 and 3. The magnitude of temporal lobe thickness differences between svPPA and CU groups was higher for HighRes scans (Cohen’s d of 3.33) compared to ConvRes (Cohen’s d of 2.78). Similarly, Highres scans outperformed ConvRes for the PCA group in the occipital lobe (d = 4.71 compared to d = 4.15). A representative image of the cortex segmentation at each resolution is shown in Fig. 3.
Comparing cortical thickness (mm) in CU, svPPA and PCA patients (in terms of mean±std). the thickness difference is calculated as ConvRes subtracted from Highres values. CU, cognitively unimpaired; svPPA, semantic-variant primary progressive aphasia; PCA, posterior cortical atrophy
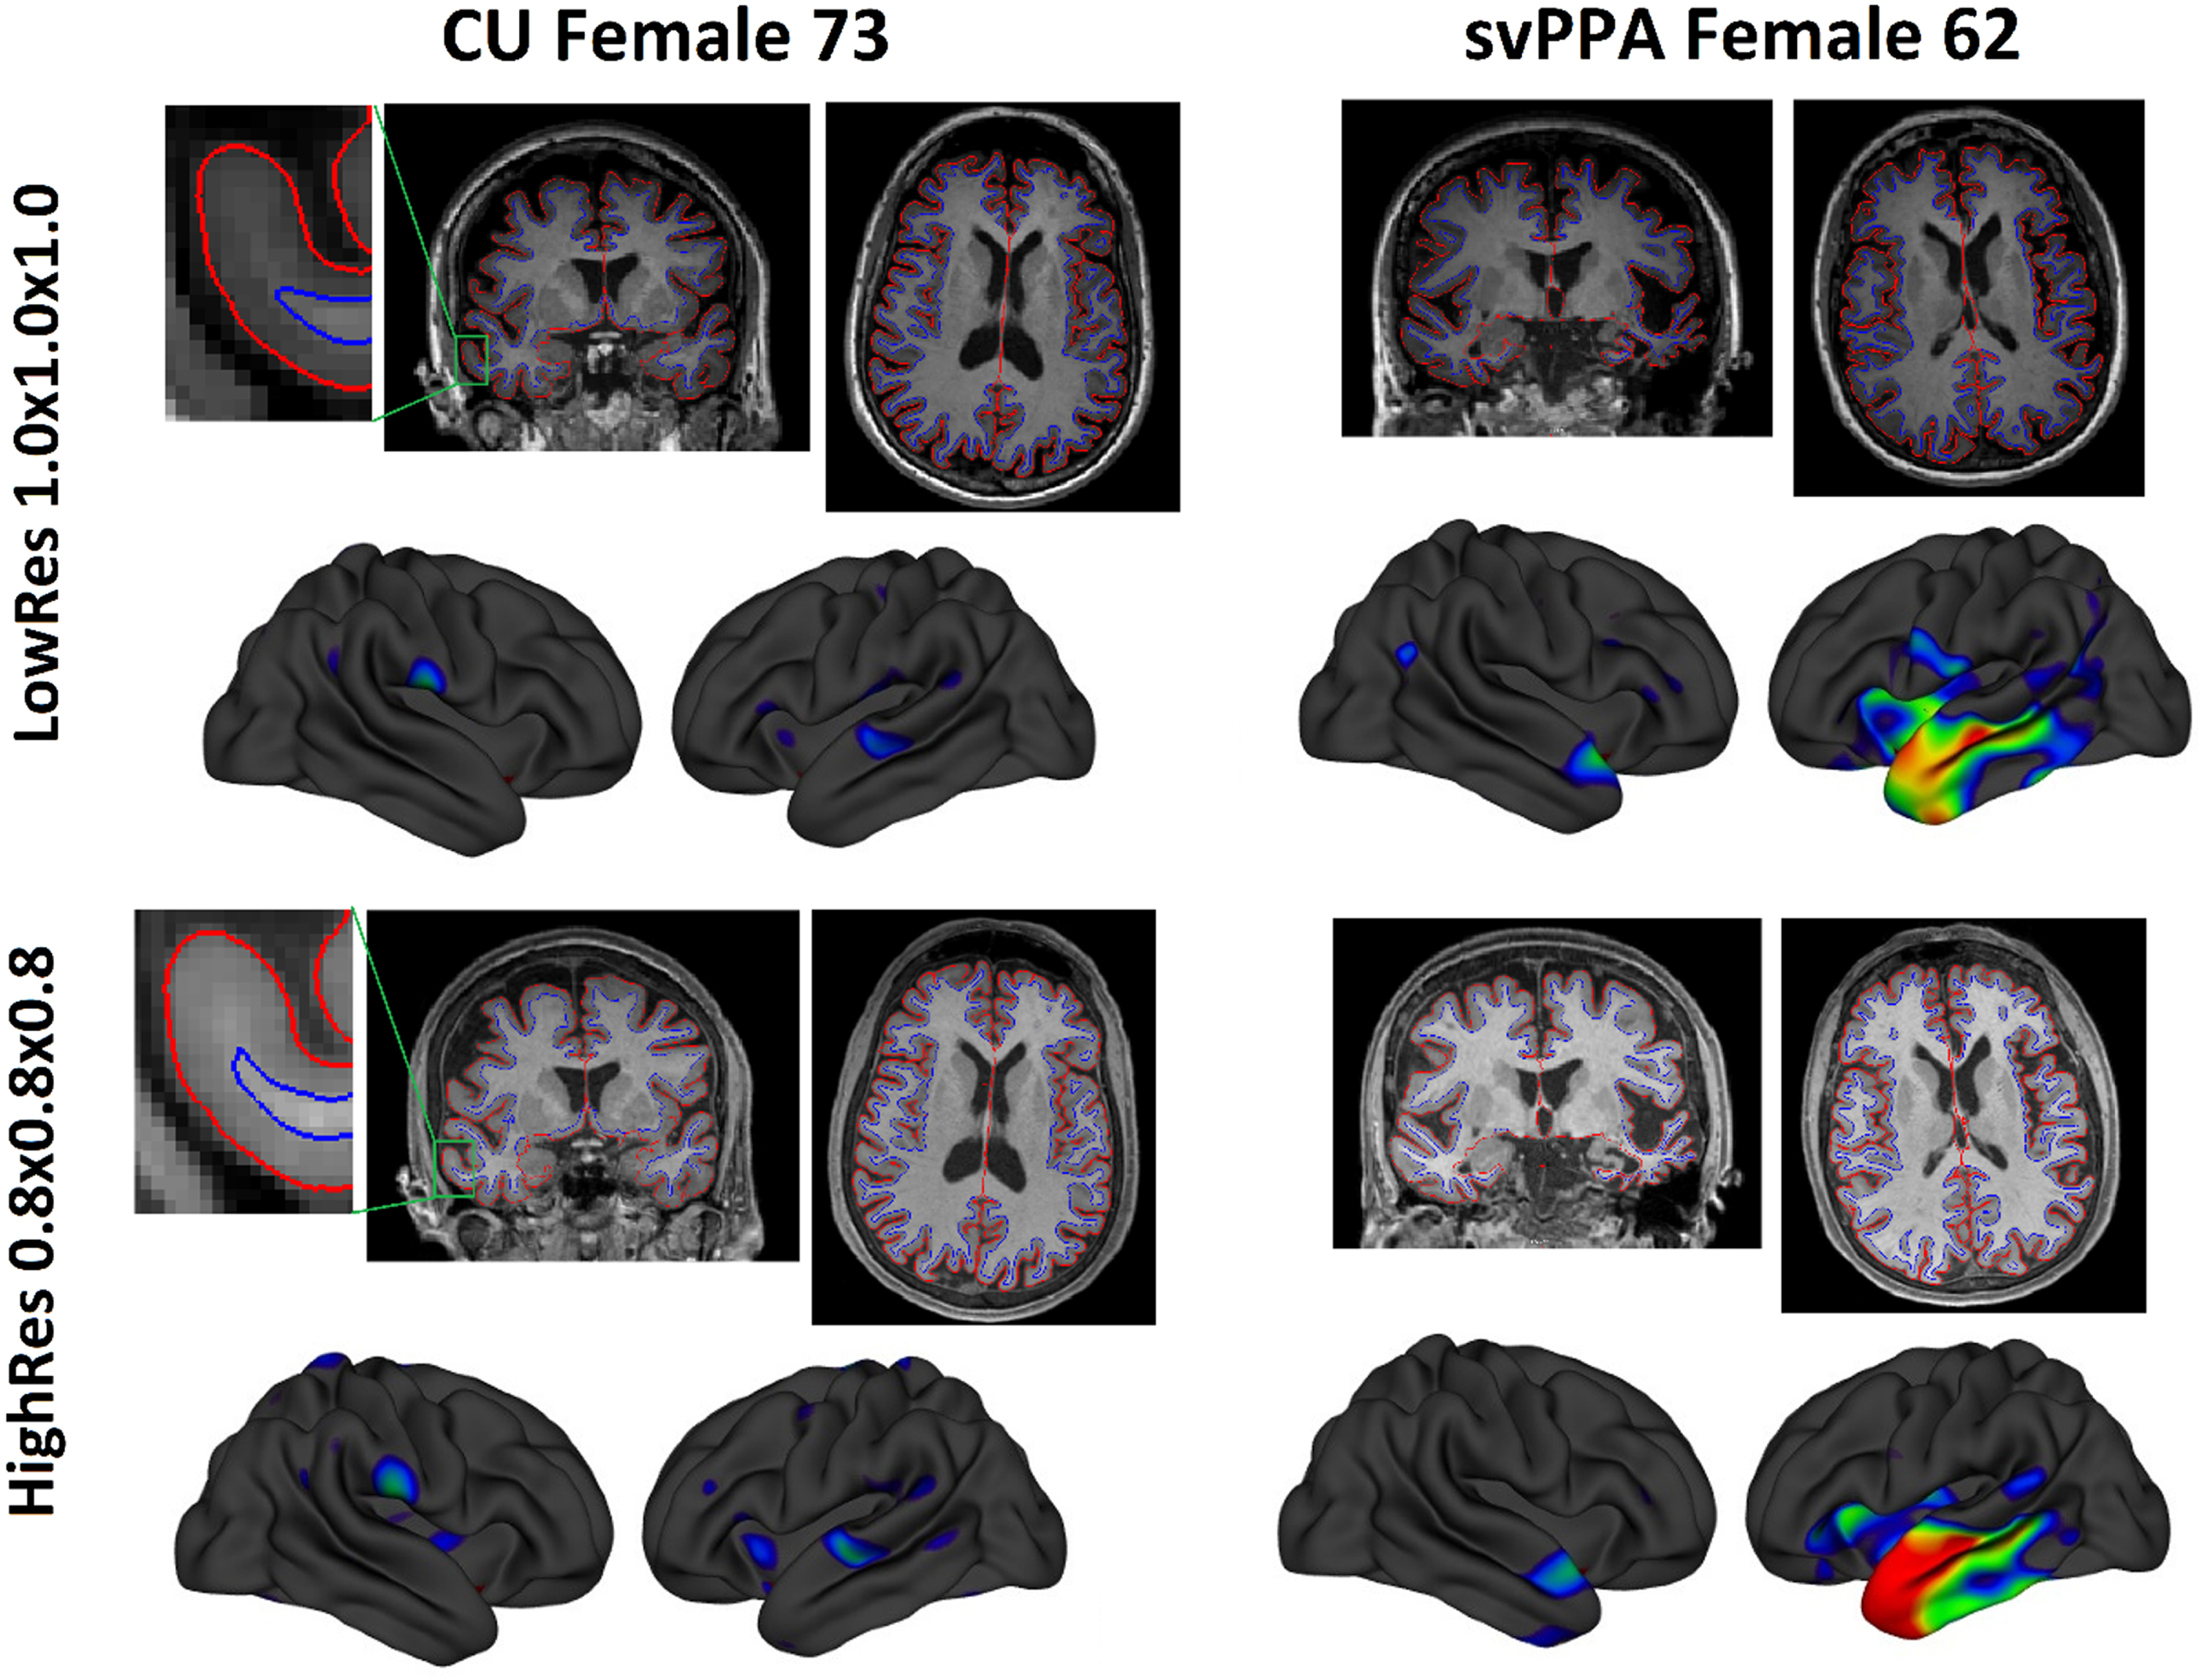
Visual comparison of anatomical MPRAGE sequences with 1.0×1.0×1.0 mm3 (ConvRes) and 0.8×0.8×0.8 mm3 (HighRes) resolutions along with the corresponding z-score maps. The pial and white-matter boundaries used to estimate cortical thickness are overlaid on coronal and axial image slices. For the participant on the left, focused views of the right temporal lobe show the effect of increased resolution.
The cortical and sub-cortical SNR and CNR values were higher for HighRes, and ICC showed highly reproducible measurements of above 90% for both HighRes and ConvRes scans (Table 3). Higher SNR and CNR in the occipital lobe did not translate into higher reproducibility. On visual inspection, HighRes scans showed more dura miss-segmentation in the lateral occipital lobe.
Image quality comparison in terms of signal-to-noise ratio (SNR), contrast-to-noise ratio (CNR) and Intraclass Correlation Coefficient (ICC) on 10 CU participants (Baseline scans used for SNR and CNR, and both baseline and follow-up scans were used for ICC). Several regions of interest in terms of thickness (whole cortex, Frontal, Parietal, Temporal, Occipital lobes) and volume (Hippocampus and Amygdala) were considered (
DISCUSSION
The study found that the HighRes imaging yielded more sensitive detection of the expected atrophy pattern in each and every individual patient along with stronger effect sizes at a group level. HighRes images achieved higher SNR and CNR compared to ConvRes while both methods obtained excellent longitudinal reproducibility.
Quantitative differences in patients with expected atrophy patterns were objectively identified using z-score maps of cortical thickness. Sensitive and objective measures of regional atrophy are a highly desirable addition to improve clinical diagnostic accuracy. Cortical thickness measures to map regional cortical atrophy, however, have yet to be incorporated into commercially approved clinical software tools [11]. This is likely, in part, due to a lack of clinical validation. The present approach which employed prior knowledge of regional degeneration in two uncommon but very well-characterized syndromes with known highly stereotyped atrophy patterns, offers a potential solution to the validation problem.
The likely mechanism by which HighRes images yielded more robust results was that doubling the voxel’s spatial resolution (from 1 mm3 to 0.51 mm3) improved the precision of delimiting gray-matter segmentation in tissue borders by reducing PVE. In addition, higher spatial resolution can help improve the CNR by reducing PVE, even though, generally speaking, increased resolution can cause a reduction in SNR. Taking advantage of the latest scanner technology, it has become possible to optimize the protocol (the lower acquisition bandwidth, optimal flip angle, and more k-space sampling as explained below) to achieve a better balance between resolution, SNR and scan time. Higher resolution when combined with minimal SNR degradation enables reduced PVE and improved CNR (less PVE as shown in Fig. 3).”
All participants (CU, SvPPA, and PCA) exhibited a thinner cortex when utilizing HighRes scans, which can be attributed to reduced PVEs (refer to Table 2). These findings are consistent with previous studies conducted at 7.0T, that highlighted cortex appears thinner with ultrahigh-resolution scanning [18]. Furthermore, the magnitude of thickness estimation reduction by HighRes scan is more pronounced in both patient groups compared to CU (svPPA in the temporal lobe: 0.08 mm versus 0.01 mm; and in PCA in the Occipital lobe: 0.07 mm versus 0.02 mm). In summary, therefore, the HighRes scans, yield a lower thickness estimation but a larger difference between patients and CU has led to improved effect size. This improvement in sensitivity was obtained at the cost of 90 seconds of additional scan time which appeared to have no significant impact in terms of tolerability or motion artefact.
Our results (Table 3) indicate that SNR and CNR of the HighRes sequence scored 1.45 times higher than that of images obtained using ConvRes. This could be due to the lower acquisition bandwidth, optimal flip angle and more k-space sampling of the HighRes sequence. However, superior HighRes image quality did not translate to superior longitudinal reliability as both sequences achieved excellent reproducibility (greater than 0.9).
Excess dura segmentation was observed in HighRes scans in the occipital region. Previous studies suggested that the temporal and occipital lobe regions are troublesome areas for FreeSurfer to measure accurately [39, 40]. The presence of either excess dura matter, closely adjacent temporal bone or cerebellum can potentially lead to segmentation errors. Future studies could incorporate T2-weighted or multi-echo MPRAGE sequences to remove the effect of dura miss-segmentation.
The size of the patient population (8 svPPA and 7 PCA patients) may appear a limitation in this study. Considering, however, that for each patient the chance level of one scan resolution outperforming the other is 0.5, the probability that each and every HighRes scan would outperform its ConvRes counterpart, as was found in this study, is p = 0.00004 (i.e., 0.515) suggesting these are very robust results. At the group level, the effect size of cortical thickness differences between patients and CU participants was also 15–20% larger for HighRes scans. Another factor that could influence the results are MRI parameter differences between the two scans. Parameters such as imaging matrix size, field-of-view, echo- and repetition time had to be optimized to reduce scanning time and could theoretically influence our comparison. The ultimate goal, however, is to generate reliable statistical maps of atrophy for use in clinical practice; with this goal in mind, the scan parameters were chosen to be optimal for each scan type thus giving each the best chance of success.
In conclusion, this proof-of-concept study using svPPA and PCA patients indicated cortical thickness maps can reliably delineate spatial patterns of atrophy at an individual patient level; more robust results can be obtained using HighRes (0.8 mm3) scans. This offers the potential to remove the subjectivity for regional cortical atrophy assessment. Furthermore, we propose that the highly stereotyped degeneration seen in svPPA and PCA make these syndromes ideal for testing further optimization experiments of individual patient atrophy measurements for translation into the clinic.
Footnotes
ACKNOWLEDGMENTS
We are grateful to Ms. Caitlin McElligott for assistance in recruitment; to the Mater Foundation; to the Australian Research Council (FT200100329), the scientific and technical assistance of the National Imaging Facility at the Centre for Advanced Imaging, University of Queensland; and to the participants and their caregivers.
FUNDING
This research was supported by a recruitment package to PJN and by the Mater Foundation.
CONFLICT OF INTEREST
The authors have no conflict of interest to report.
DATA AVAILABILITY
The datasets used and/or analyzed during the current study are available from the corresponding author upon reasonable request.