






Abstract
Background:
Cerebrospinal fluid (CSF) or blood biomarkers like phosphorylated tau proteins (p-tau) are used to detect Alzheimer’s disease (AD) early. Increasing studies on cognitive function and blood or CSF p-tau levels are controversial.
Objective:
Our study examined the potential of p-tau as a biomarker of cognitive status in normal control (NC), mild cognitive impairment (MCI), and AD patients.
Methods:
We searched PubMed, Cochrane, Embase, and Web of Science for relevant material through 12 January 2023. 5,017 participants from 20 studies—1,033 AD, 2,077 MCI, and 1,907 NC—were evaluated. Quantitative analysis provided continuous outcomes as SMDs with 95% CIs. Begg tested publication bias.
Results:
MCI patients had lower CSF p-tau181 levels than AD patients (SMD =−0.60, 95% CI (−0.85, −0.36)) but higher than healthy controls (SMD = 0.67). AD/MCI patients had greater plasma p-tau181 levels than healthy people (SMD =−0.73, 95% CI (−1.04, −0.43)). MCI patients had significantly lower p-tau231 levels than AD patients in plasma and CSF (SMD =−0.90, 95% CI (−0.82, −0.45)). MCI patients showed greater CSF and plasma p-tau231 than healthy controls (SMD = 1.34, 95% CI (0.89, 1.79) and 0.43, (0.23, 0.64)). Plasma p-tau181/231 levels also distinguished the three categories. MCI patients had higher levels than healthy people, while AD patients had higher levels than MCI patients.
Conclusions:
CSF p-tau181 and p-tau231 biomarkers distinguished AD, MCI, and healthy populations. Plasma-based p-tau181 and p-tau231 biomarkers for AD and MCI need further study.
Keywords
INTRODUCTION
Alzheimer’s disease (AD) is the most frequent form of dementia and is characterized by cognitive impairment, memory loss, altered behavioral patterns, and psychiatric symptoms [1–4]. The prevalence rate of AD is increasing, with approximately 50 million affected individuals, and it will triple to 150 million by 2050 globally, making it a major public health concern [5]. The prodromal phase of AD, known as mild cognitive impairment (MCI) medically, is characterized by declined cognitive performance of one or more domains while maintaining functional independence [6]. Thal, et al. have reported that approximately 10% to 15% of patients with MCI develop AD within a year [7].
The disease progression from MCI to AD involves cognitive decline and neuronal damage. Although the underlying mechanisms and driving factors are not fully understood, several contributing factors have been discovered: 1) the accumulation of aberrant proteins in the brain, such as tau tangles and amyloid plaques [8, 9]; 2) the onset of neurodegenerative processes, including loss of brain cells (neurons) and disrupted connections [10, 11]; 3) genetic factors: MCI patients carrying the APOE ɛ4 allele have a higher risk of developing AD [12]; and 4) neuroinflammation: Long-term inflammation in the brain is likely to contribute to the progression of MCI into AD [13]. Notably, this disease progression is not a linear process but varies significantly amongindividuals.
Some recent studies suggest that biomarkers can help diagnose and predict the risk of AD [14–17]. Elevated amyloid-β (Aβ) and phosphorylated tau (p-tau) are closely related to the onset of AD. Aβ may cause synaptic dysfunction and neurodegeneration, subsequently resulting in cognitive decline [18]. The degenerative process in AD patients typically starts 10–20 years prior to the symptom onset and contributes to cognitive decline and memory loss [19]. Tau protein is abundant in brain neurons, particularly in axons of the central nervous system, where it maintains the structural integrity of nerve cells by stabilizing microtubules [20–24]. Excessive phosphorylation of tau protein leads to its dissociation from microtubules and causes structural damage to nerve cells. High levels of total tau and p-tau have been found in the cerebrospinal fluid (CSF) in patients with AD [25–27]. Therefore, several studies attempt to explore the relationship between AD and p-tau in plasma or CSF [14, 28–32]. Numerous investigations have documented that over 50% of suspected individuals with AD had elevated levels of total tau and phosphorylated total tau in the CSF. A recent analysis also assessed plasma p-tau217 as a blood-based biomarker with the good specificity to identify AD [33]. However, prior studies showed that p-tau181 and p-tau231 were able to distinguish AD from Lewy body dementia and frontotemporal dementia. Therefore, several studies have been conducted to investigate p-tau181 and p-tau231, as possible biomarkers for AD [14, 34–36].
Furthermore, the levels of p-tau have been reported to be associated with cognitive impairment [37]. High CSF p-tau181 levels are linked to fast cognitive decline and hippocampal shrinkage in AD as well as rapid progression from MCI to AD [14, 22]. However, another study shows no significant difference in CSF p-tau 181 concentrations between the MCI group and the control group [38]. Similarly, no significant difference is found in p-tau231 levels between AD and MCI patients [39–41]. Hence, the current study aims to compare the p-tau 181 and p-tau 231 levels in CSF and plasma among AD, MCI, and healthy patients and identify their relationship with cognitive function.
MATERIALS AND METHODS
Protocol and registration
This study was conducted in accordance with the Preferred Reporting Items for Systematic Reviews and Meta-Analyses (PRISMA) guidelines [42] (Fig. 1). The study protocol has been registered and approved in the International Prospective Register of Systematic Reviews (PROSPERO; CRD42023392771).
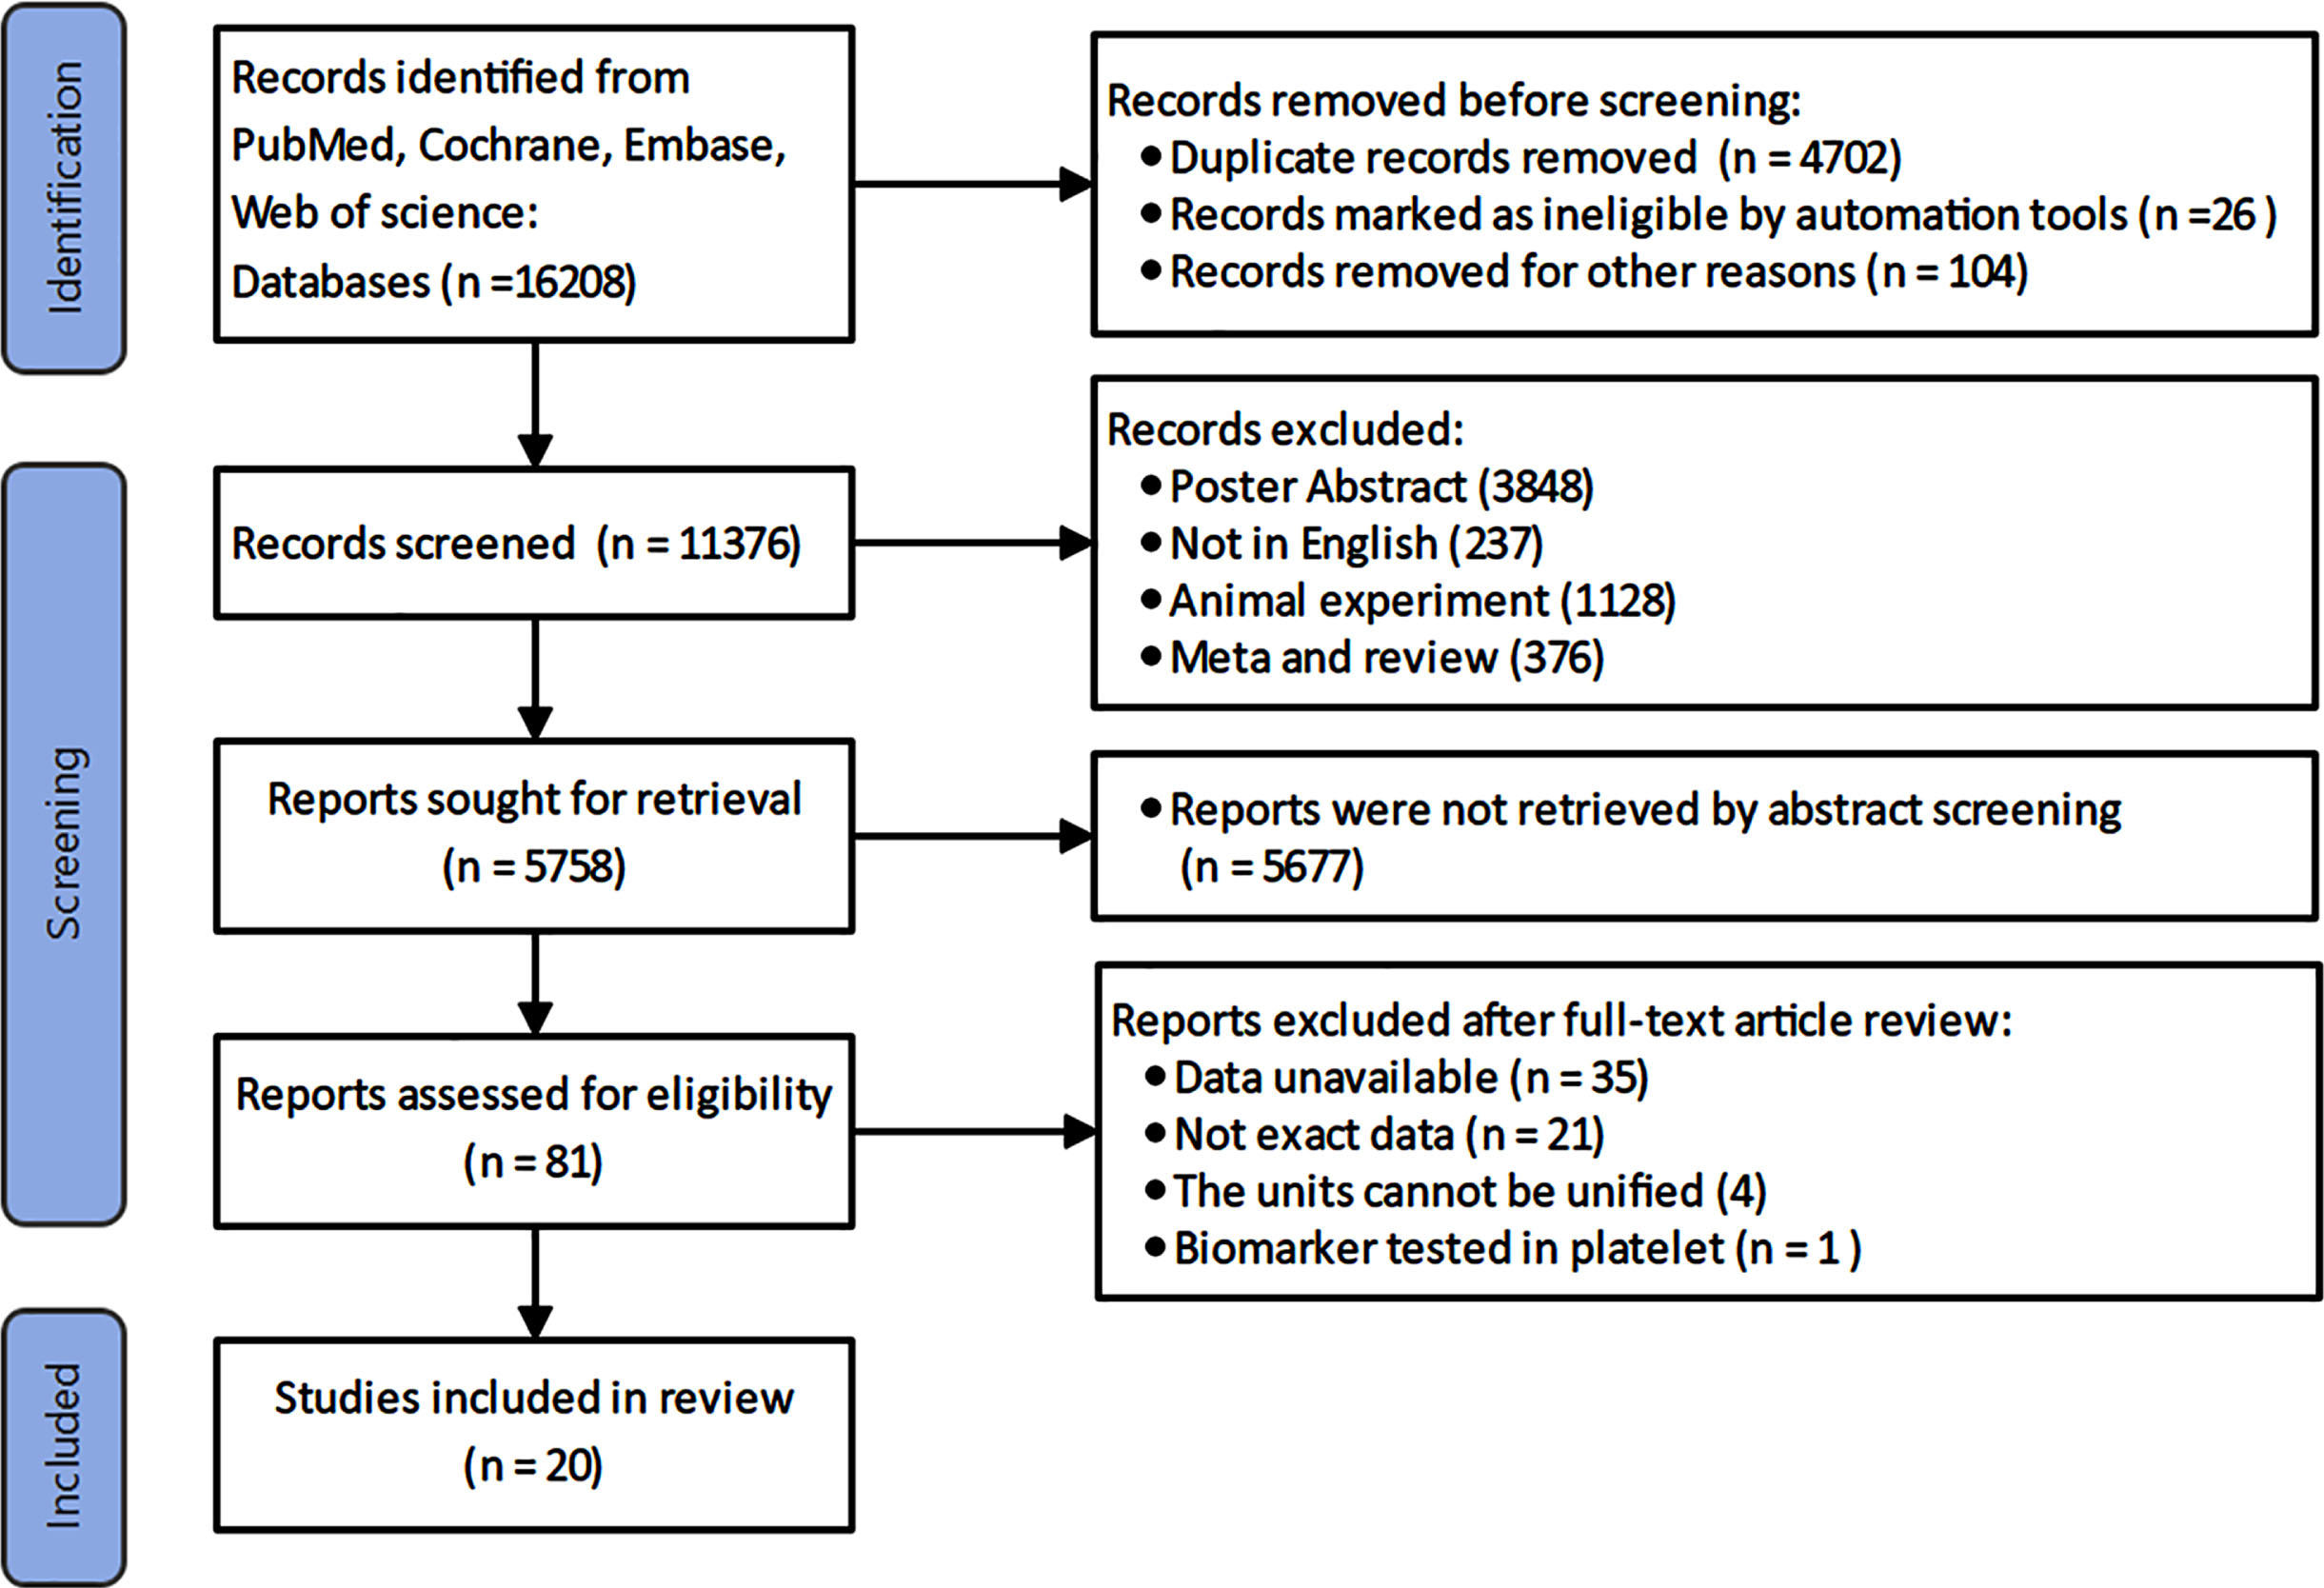
Flowchart of study selection.
Search strategy
Two researchers (Zhirui Li and Zixuan Fan) independently searched four databases, including PubMed, Cochrane, Embase, and Web of Science, to identify relevant articles until January 12, 2023. The search strategy was designed by combining Medical Subject Heading (MeSH) terms and free words. MeSH terms included AD, plasma, CSF, and phosphorylated tau 181/231. Free terms were derived from the MeSH terms and identified through searches of PubMed, Embase, and published meta-analyses and reviews. Based on the search strategy, truncation and wildcards were utilized to maximize the scope of retrieved articles. For example, in the PubMed database, if the MeSH term was “Alzheimer Disease,” the search string was formulated as: (((“Alzheimer Disease”[Mesh]) OR (((((((((((((Alzheimer[Title/Abstract]) OR (Alzeimers[Title/Abstract])) OR (Alzeimer’s[Title/Abstract])) OR (cortical sclerosis, diffuse[Title/Abstract])) OR (Dementia[Title/Abstract])) OR (Dementias[Title/Abstract])) OR (diffuse cortical sclerosis[Title/Abstract])) OR (traumatic brain injury[Title/Abstract])) OR (mild cognitive[Title/Abstract])) OR (FAD[Title/Abstract])) OR (ATD[Title/Abstract])) OR (AD[Title/Abstract])) OR (MCI[Title/Abstract]))). The detailed search strategy is shown in Supplementary Table 1.
Inclusion and exclusion criteria
The inclusion criteria were as follows: 1) patients who were diagnosed with MCI and/or AD; 2) CSF p-tau181, CSF p-tau231, plasma p-tau181, or plasma p-tau231 were reported, and cognitive tests, such as the Mini-Mental State Examination (MMSE) scale, was used to evaluate attention, memory, orientation, calculation, language, and construction abilities [43]. The exclusion criteria were as follows: 1) patients were not diagnosed with AD or MCI; 2) reviews, meta-analyses, case reports, animal studies, conference abstracts, book chapters, and letters; 3) studies published in languages other than English. Notably, across the original studies, the cutoff values of biomarkers may vary in the diagnosis and evaluation of AD and MCI. In addition to the MMSE, the short-form geriatric depression scale (GDS-S) and the Clinical Dementia Rating scale (CDR-SOB) were used to evaluate cognitive functions. Many studies employed biomarkers such as Aβ42, p-tau, T-tau, and the p-tau/Aβ42 ratio to AD from healthy people and MCI. Recently, tau PET neuroimaging has been increasingly used as an adjunctive measure. The inclusion criteria employed in our study were determined solely based on the discretion of the original research papers.
Study selection
The study selection was carried out in three steps by two independent researchers (Zhirui Li and Zixuan Fan). All retrieved articles were imported to Endnote. Duplicated articles were identified automatically and manually and then removed. Next, the titles and abstracts of the remaining articles were screened to exclude irrelevant studies. Finally, the full texts of the remaining studies were read to further determine eligible studies. Any disagreements were discussed with a third reviewer (Qian Zhang) to reach a consensus.
Data extraction
Two researchers (Zhirui Li and Zixuan Fan) manually extracted the following data using a prepared form: 1) basic information of the included studies: title, the name of the first author, publication year, study type, country, and the source of subjects: 2) basic characteristics of the research subjects: number of subjects, age, sex, and measurement methods of CSF and blood p-tau 181/231; and 3) outcomes of interest: CSF or plasma p-tau181 or p-tau231 levels, and cognitive test scores. Additionally, the diagnosis criteria for MCI and AD were also extracted, such as Cognitive Subscale (ADAS-Cog), MMSE, GDS-S, and CDR-SOB.
Quality assessment
The risk of bias in the included studies was assessed using the Newcastle-Ottawa Scale (NOS) [44]. NOS is commonly used to evaluate the methodology and quality of non-randomized trials, including cohort studies and case-control studies. NOS provides a well-organized and methodical framework for assessing the quality of research. This framework facilitates the identification of strengths and flaws in various studies, hence enhancing the credibility of our review process. The NOS scale comprises eight items in three domains: sample selection for the study group, comparability of the groups, and exposure. The overall score ranged from 0 (poor quality) to 9 (high quality). An NOS score of 7 to 9 indicated a high-quality study; an NOS score of 4 to 6 indicated a medium-quality study, and an NOS score of 3 or below indicated a low-quality study [45]. Any dissents were discussed between the authors to reach a consensus. The detailed NOS scores of the included studies are shown in Table 1.
Extracted and summarized details on subjects, study design, country, patients, sample size,
AD, Alzheimer’s disease; MCI, mild cognitive impairment; NC, normal control; F, female (n, %); Age Mean (SD).
Statistical analysis
Statistical analysis was performed using Stata software (version 15.0; StataCorp, College Station, TX). Continuous variables were expressed as standardized mean differences (SMDs) with 95% confidence intervals (CIs). The heterogeneity between studies was evaluated using the I-squared statistic (I2). If the I2 value was greater than 50%, a random-effects model was used for data analysis. Otherwise, a fixed-effects model was applied, and sensitivity analysis was employed by removing the included studies one by one to assess the reliability of the meta-analysis results. In addition, meta-regression was performed to determine the source of heterogeneity. The results were considered statistically significant if the p-value was less than 0.05. Publication bias was assessed using a funnel plot (if the outcome measure was reported in more than 8 studies) and Begg’s test. A p-value less than 0.05 was considered significant.
RESULTS
Study characteristics
Initially, 16,208 articles were identified through database searches, of which 4,832 duplicated articles were deleted. Then, 8,742 articles were discarded based on title and abstract screening, and 5,677 articles were further eliminated because of irrelevant topics or lack of the required data. Subsequently, the full texts of the remaining 81 articles were carefully read. Finally, 20 studies with 5,017 subjects (1,033 AD patients, 2,077 MCI patients, and 1,907 normal controls (NCs) were included [21, 46–62].
The majority of the included studies were longitudinal studies (n = 16) [21, 56–62], while others were cohort studies (n = 3) [46, 53], and cross-sectional studies (n = 1) [55]. These studies were published between 2002 and 2022, and were conducted in nine countries, including America, Sweden, the Netherlands, Japan, China, Italy, Germany, Canada, and Belgium. Three studies were sourced from two databases: the Alzheimer’s Disease Neuroimaging Initiative and the European Union and NeuroMed program. Furthermore, 18 studies adjusted for demographic variables such as age, sex, and education [21, 58–61], while two studies did not report gender characteristics [57, 62]. Of the 20 studies, one study reported both plasma and CSF p-tau181/231 levels [55]; one study reported plasma p-tau181/231 and CSF p-tau 181 [50]; one study reported CSF p-tau181 and 231 [51]; one study reported plasma p-tau181 and 231 [34]; nine studies only reported CSF p-tau181 [21, 62]; four studies only reported CSF p-tau231 [40, 60], and three studies [47, 54] only reported plasma p-tau181. No studies only reported plasma p-tau231.
Quality assessment
Based on the NOS assessment, the quality of the included studies was moderate to high. Specifically, 10 studies received 5 points [21, 62], six studies received 6 points [46, 60], and four studies received 7 points [47–50].
Meta-analysis
CSF p-tau181 levels in the NC, MCI, and AD groups
Twelve studies were included in the analysis. Among these studies, 11 studies compared CSF p-tau 181 levels between MCI (n = 1,140) and AD patients (n = 717) [21, 62] and 11 compared its levels between MCI patients (n = 1140) and NC groups (n = 1037) [21, 62].
A random-effects model was used for the meta-analysis of CSF p-tau181 levels between MCI and AD patients (Fig. 2A). The results showed that the CSF p-tau181 level in MCI patients was significantly lower than that in AD patients (SMD =−0.60, 95% CI [−0.85, 0.36]). Furthermore, subgroup analysis revealed that the nationality of participants might be the main source of heterogeneity (95% CI [0.06, 0.39], p < 0.05). The findings from the subgroup analysis, which considered the variables of publication year and research kind, did not yield statistically significant outcomes (p > 0.05). The Begg’s test and funnel plot indicated no significant publication bias (p = 0.822) (Supplementary Figure lA).
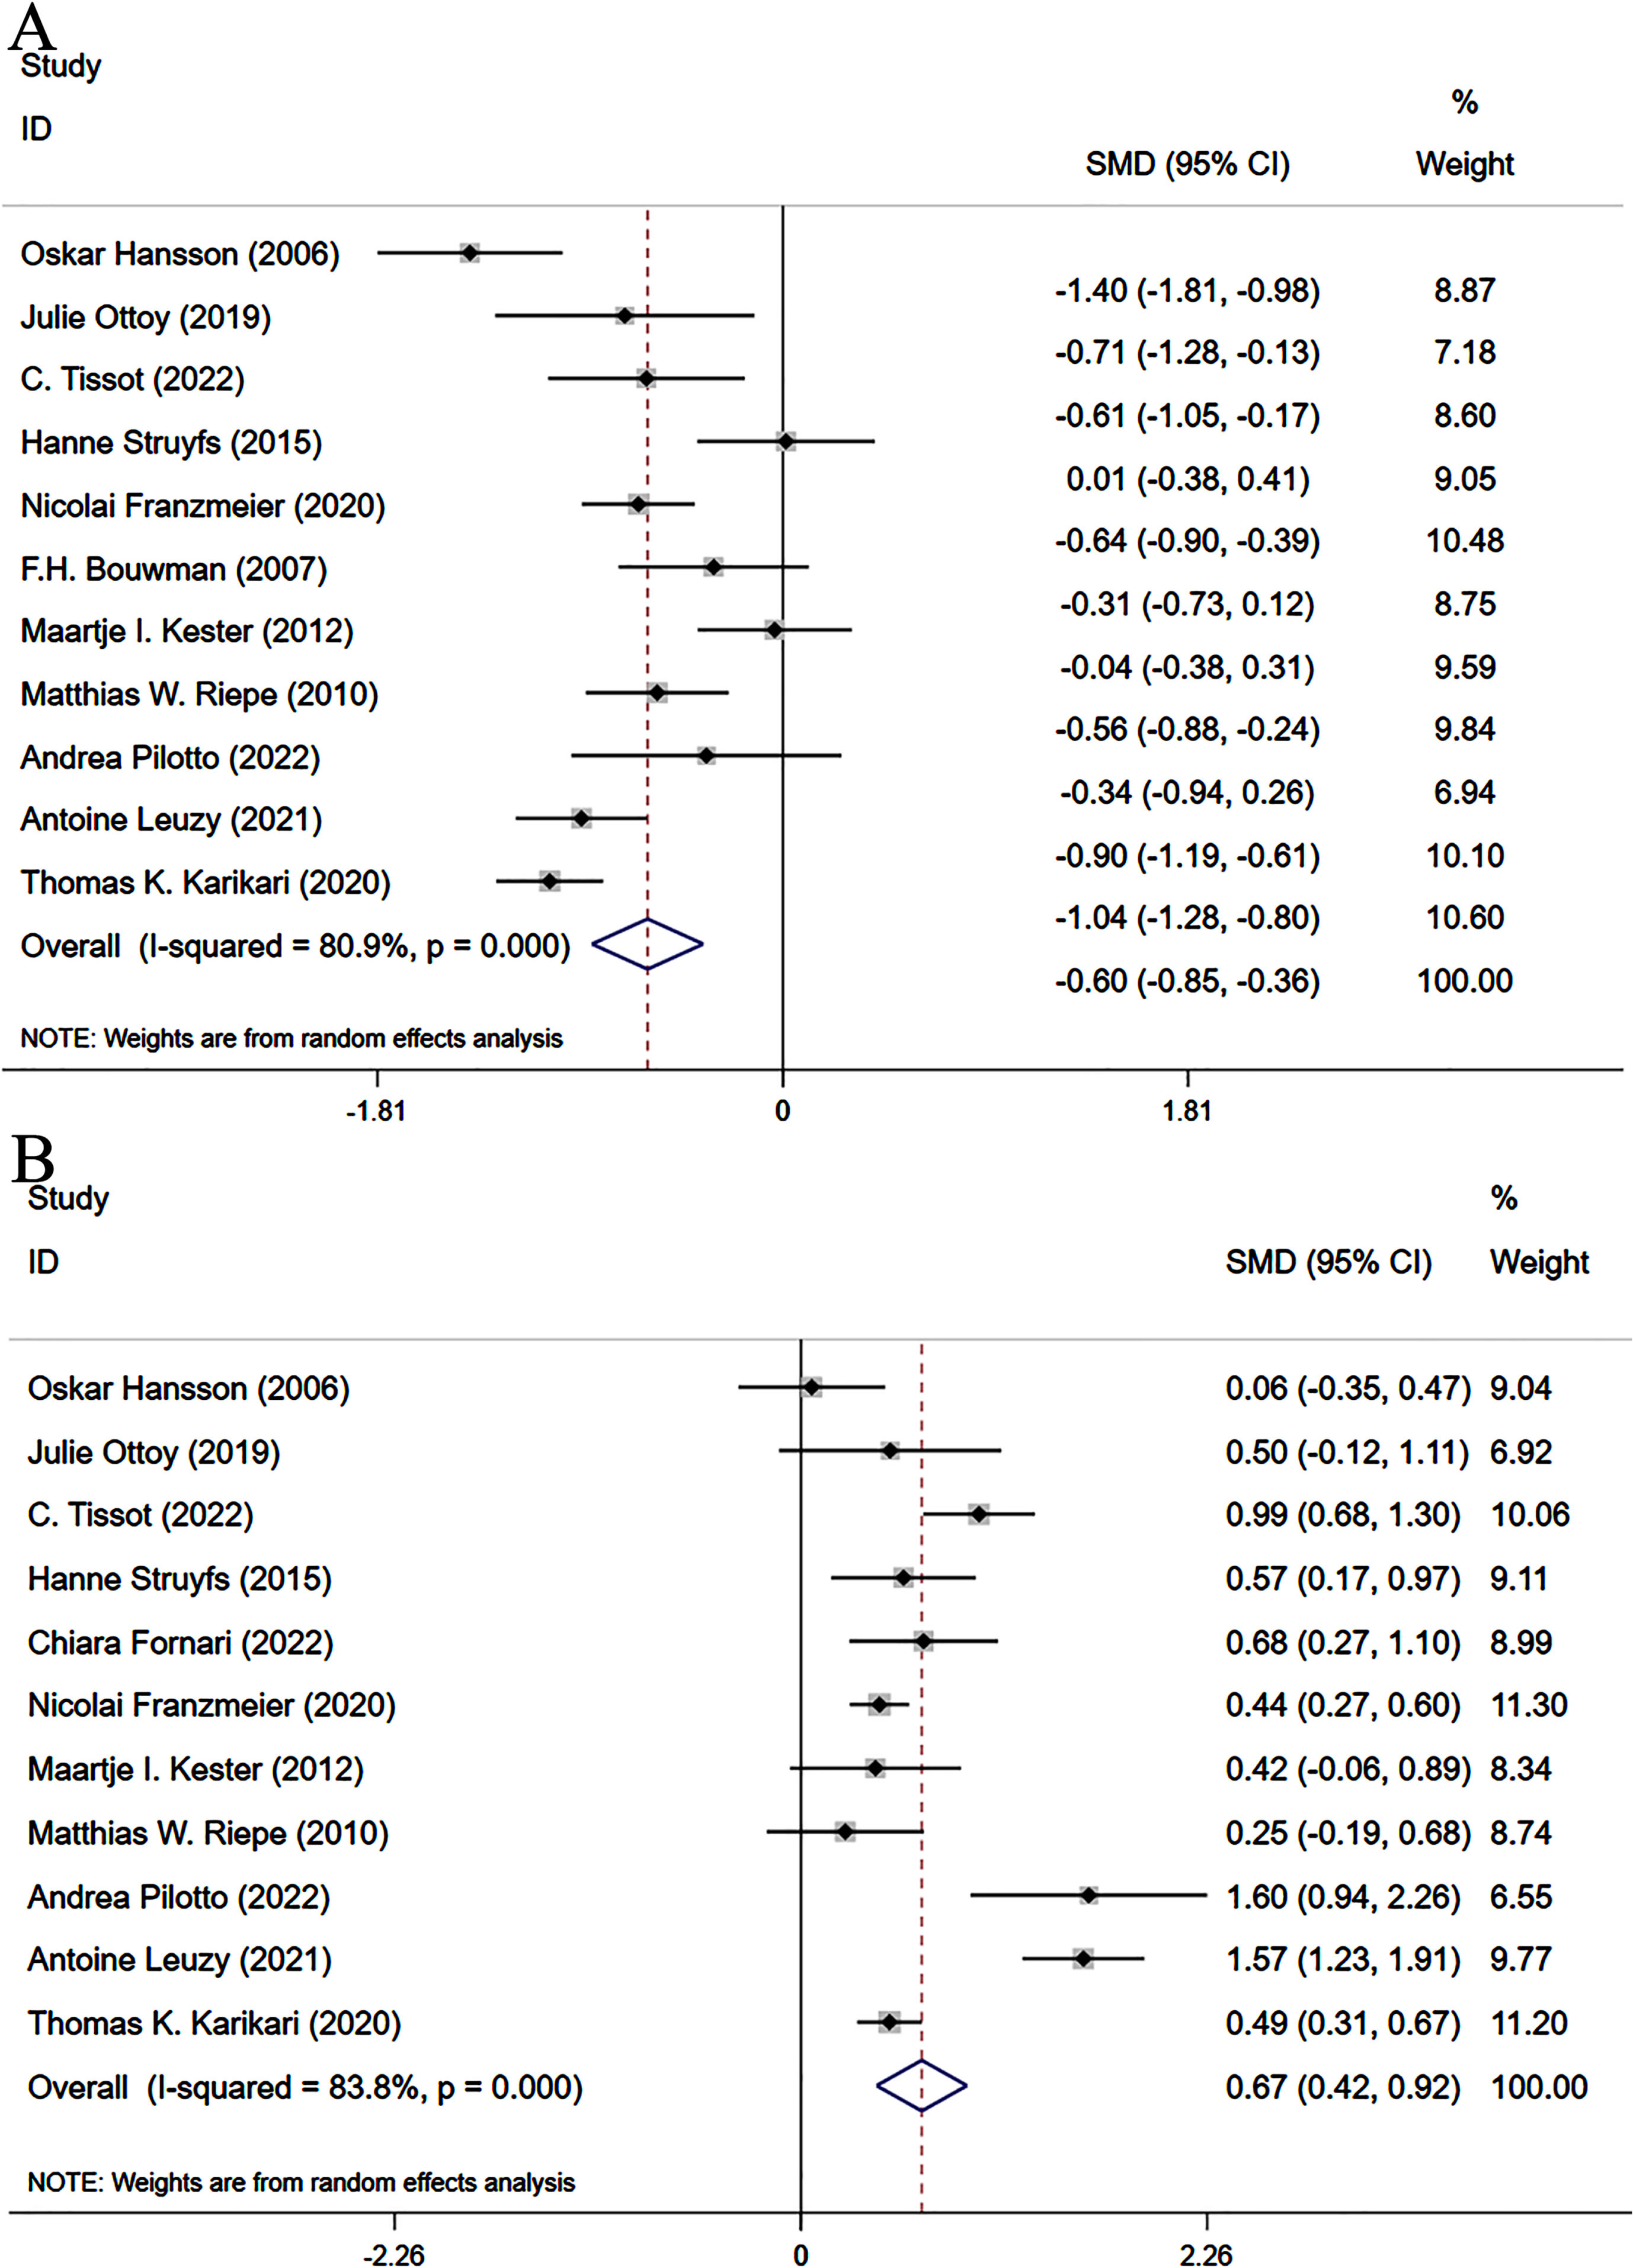
Forest plots for CSF p-tau181 levels in NC, MCI, and AD with a random effects model. A) MCI versus AD; B) MCI versus NC. NC, normal control; MCI, mild cognitive impairment; AD, Alzheimer’s disease.
Furthermore, MCI patients had significantly higher levels of CSF p-tau181 than the NC group (SMD = 0.67, 95% CI [0.42–0.92]), with high heterogeneity (I2 =83.8%). The source of heterogeneity was not identified even after controlling for publication year, international population, and study type (p > 0.05) (Fig. 2B). Begg’s test indicated no significant publication bias (p = 0.533) (Supplementary Figure 1B).
Plasma p-tau181 levels in the NC, MCI, and AD groups
Six eligible studies compared the plasma p-tau 181 levels between 474 MCI and 361 AD patients [21, 55], and 7 studies compared the plasma p-tau 181 levels between 1,078 MCI patients and 1,305 NC subjects [21, 55].
In this analysis, a random effect model was employed due to high heterogeneity (I2 = 74.4%). The analysis showed a significant difference in plasma p-tau181 levels between MCI and AD patients (SMD =−0.73, 95% CI=(−1.04–0.43)) as well as between MCI and NC groups (SMD = 0.65, 95% CI=(0.40–0.90)). The study sample size was entered as a covariate. Based on subgroup analysis results, the heterogeneity was influenced only by the study type of the AD group and MCI group (95% CI [0.82, 2.30], p < 0.005). The remaining subgroups had p-values greater than 0.05. No clear evidence of publication bias was found (Fig. 3A: p = 0.707; 3B: p = 0.133; Begg’s test: p = 0.707, p = 0.133).
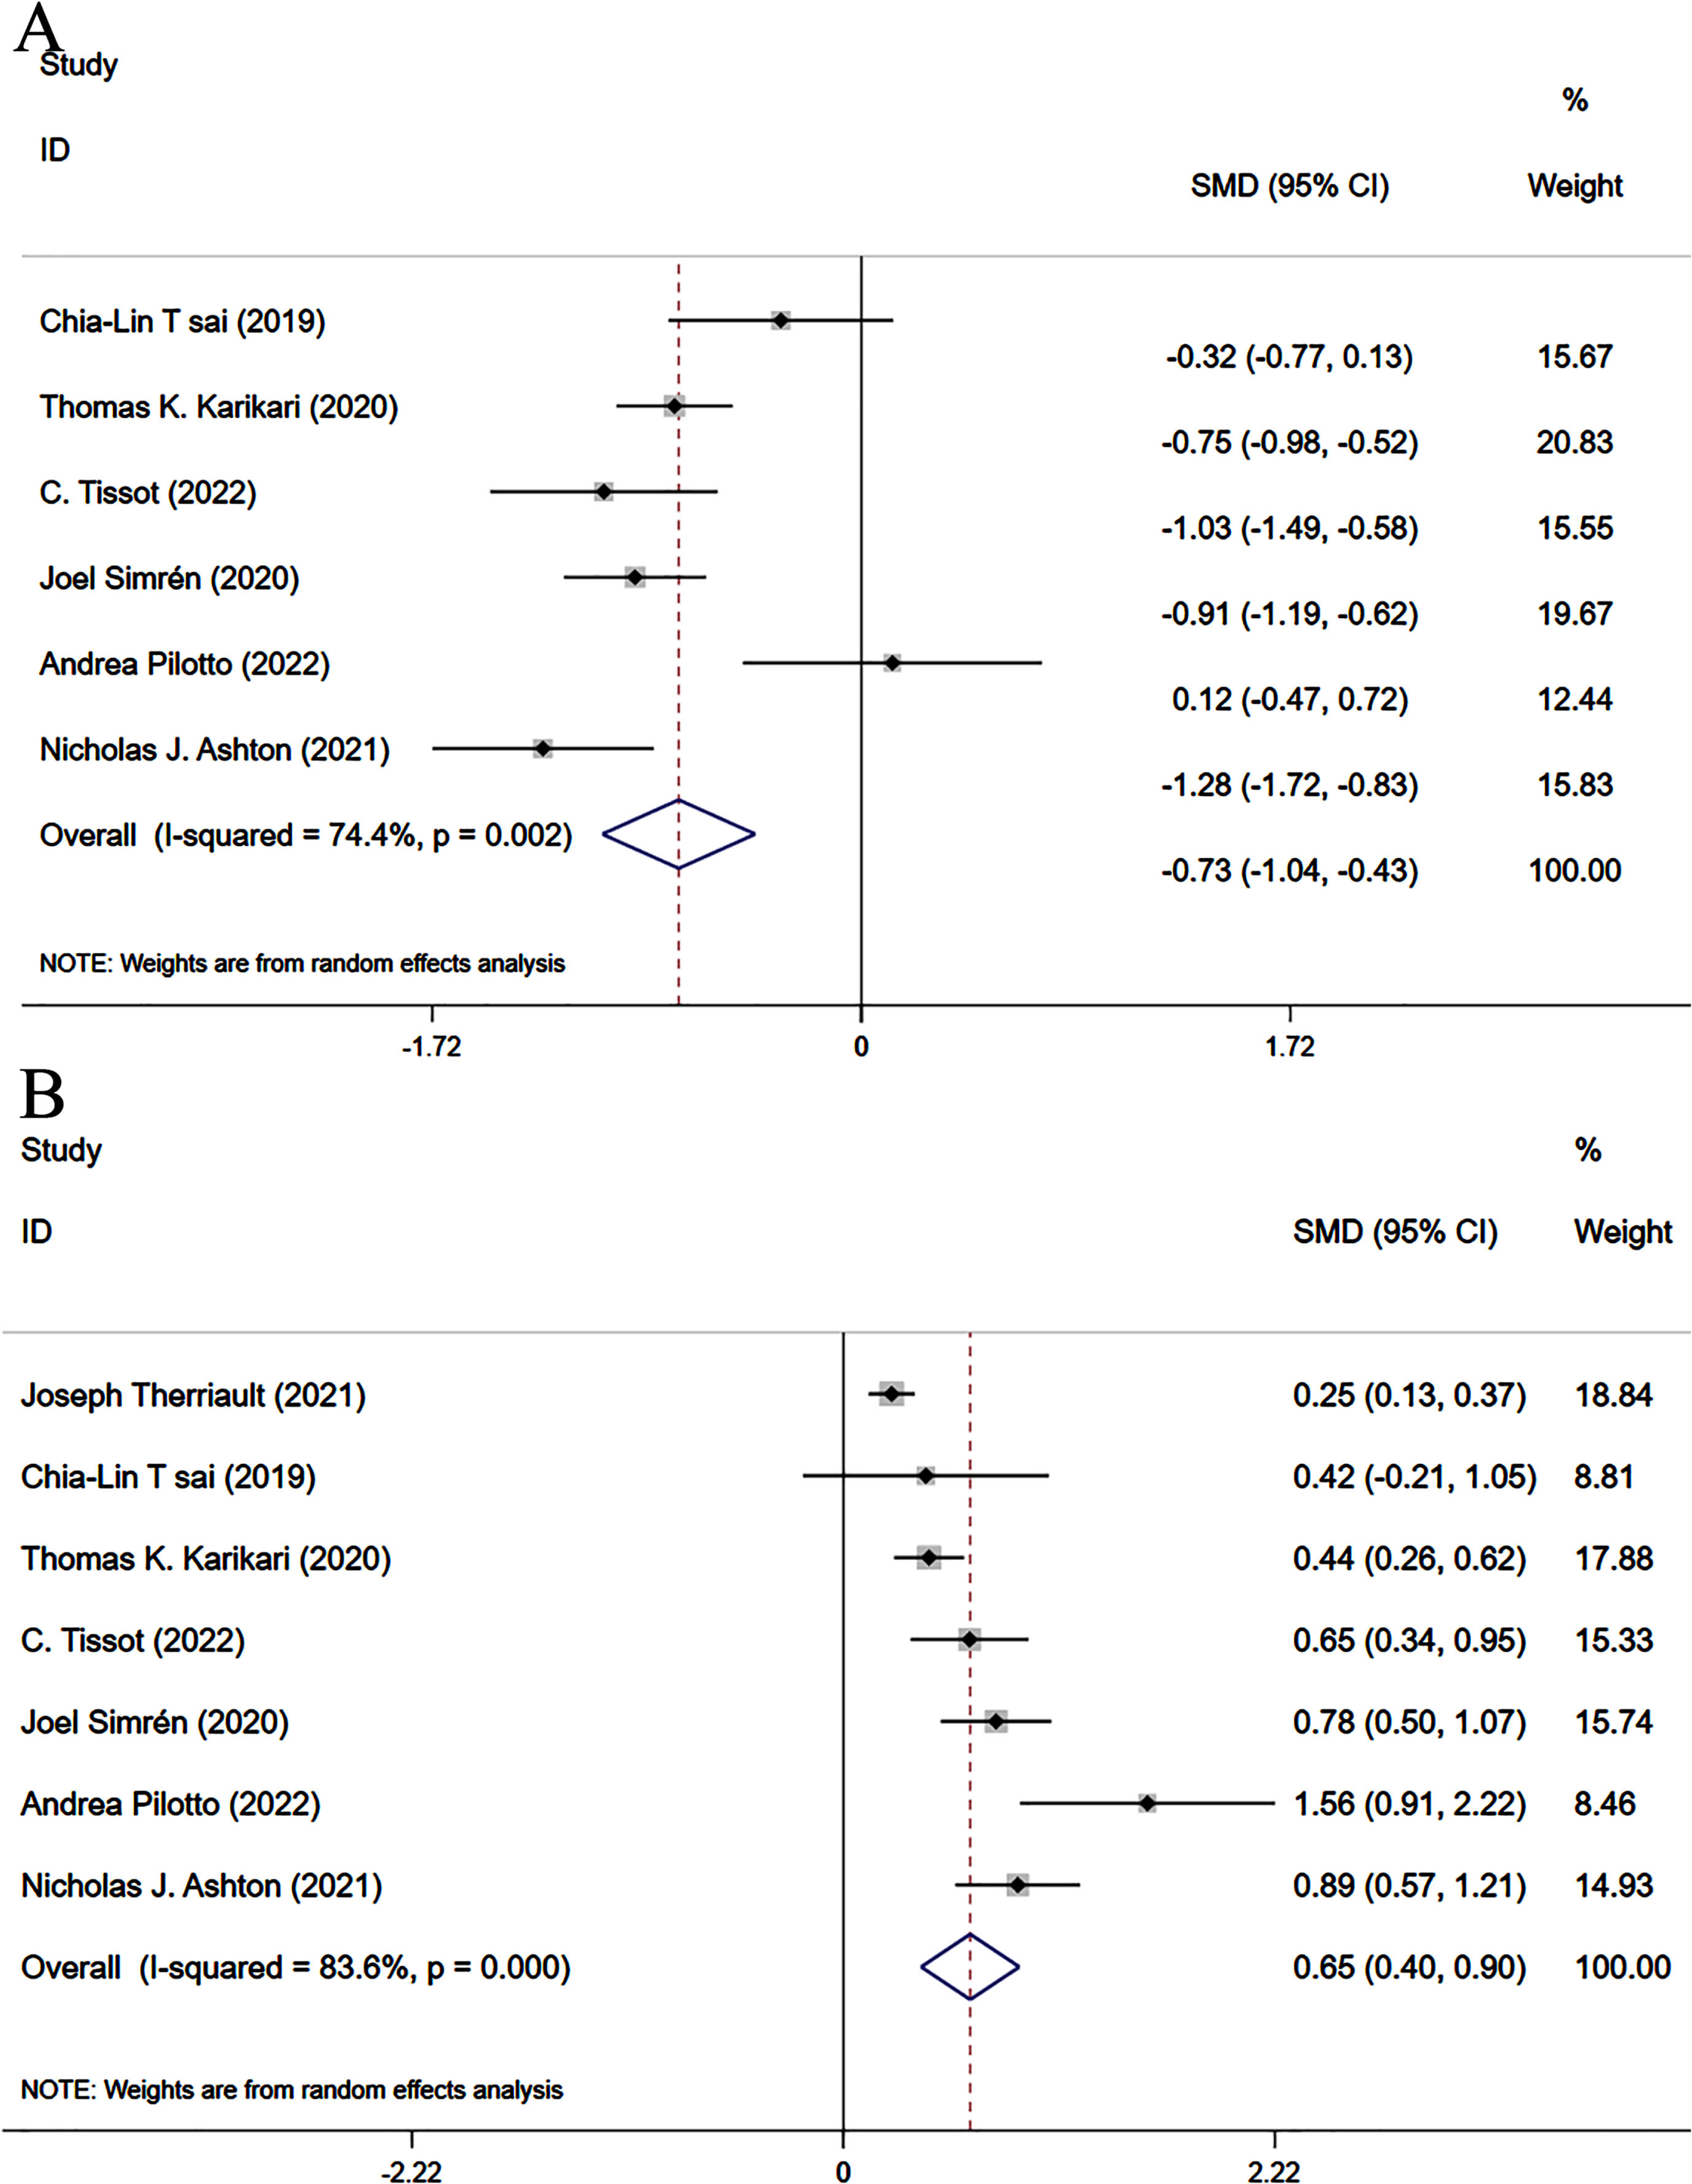
Forest plots for plasma p-tau181 levels in NC MCI and AD with random effects model. A) MCI versus AD; B) MCI versus NC. NC, normal control; MCI, mild cognitive impairment.
CSF p-tau 231 levels in the NC, MCI, and AD groups
This forest map (Fig. 4) shows the results of the meta-analysis of p-tau231 levels in CSF among the MCI, NC, and AD groups. Five studies [40, 60] comprising 230 MCI patients and 274 AD patients were assessed to compare p-tau231 levels in CSF between MCI and AD patients, and six studies [40, 60] including 238 MCI patients and 208 NC subjects were examined to compare p-tau231 levels in CSF between MCI patients and NC subjects.
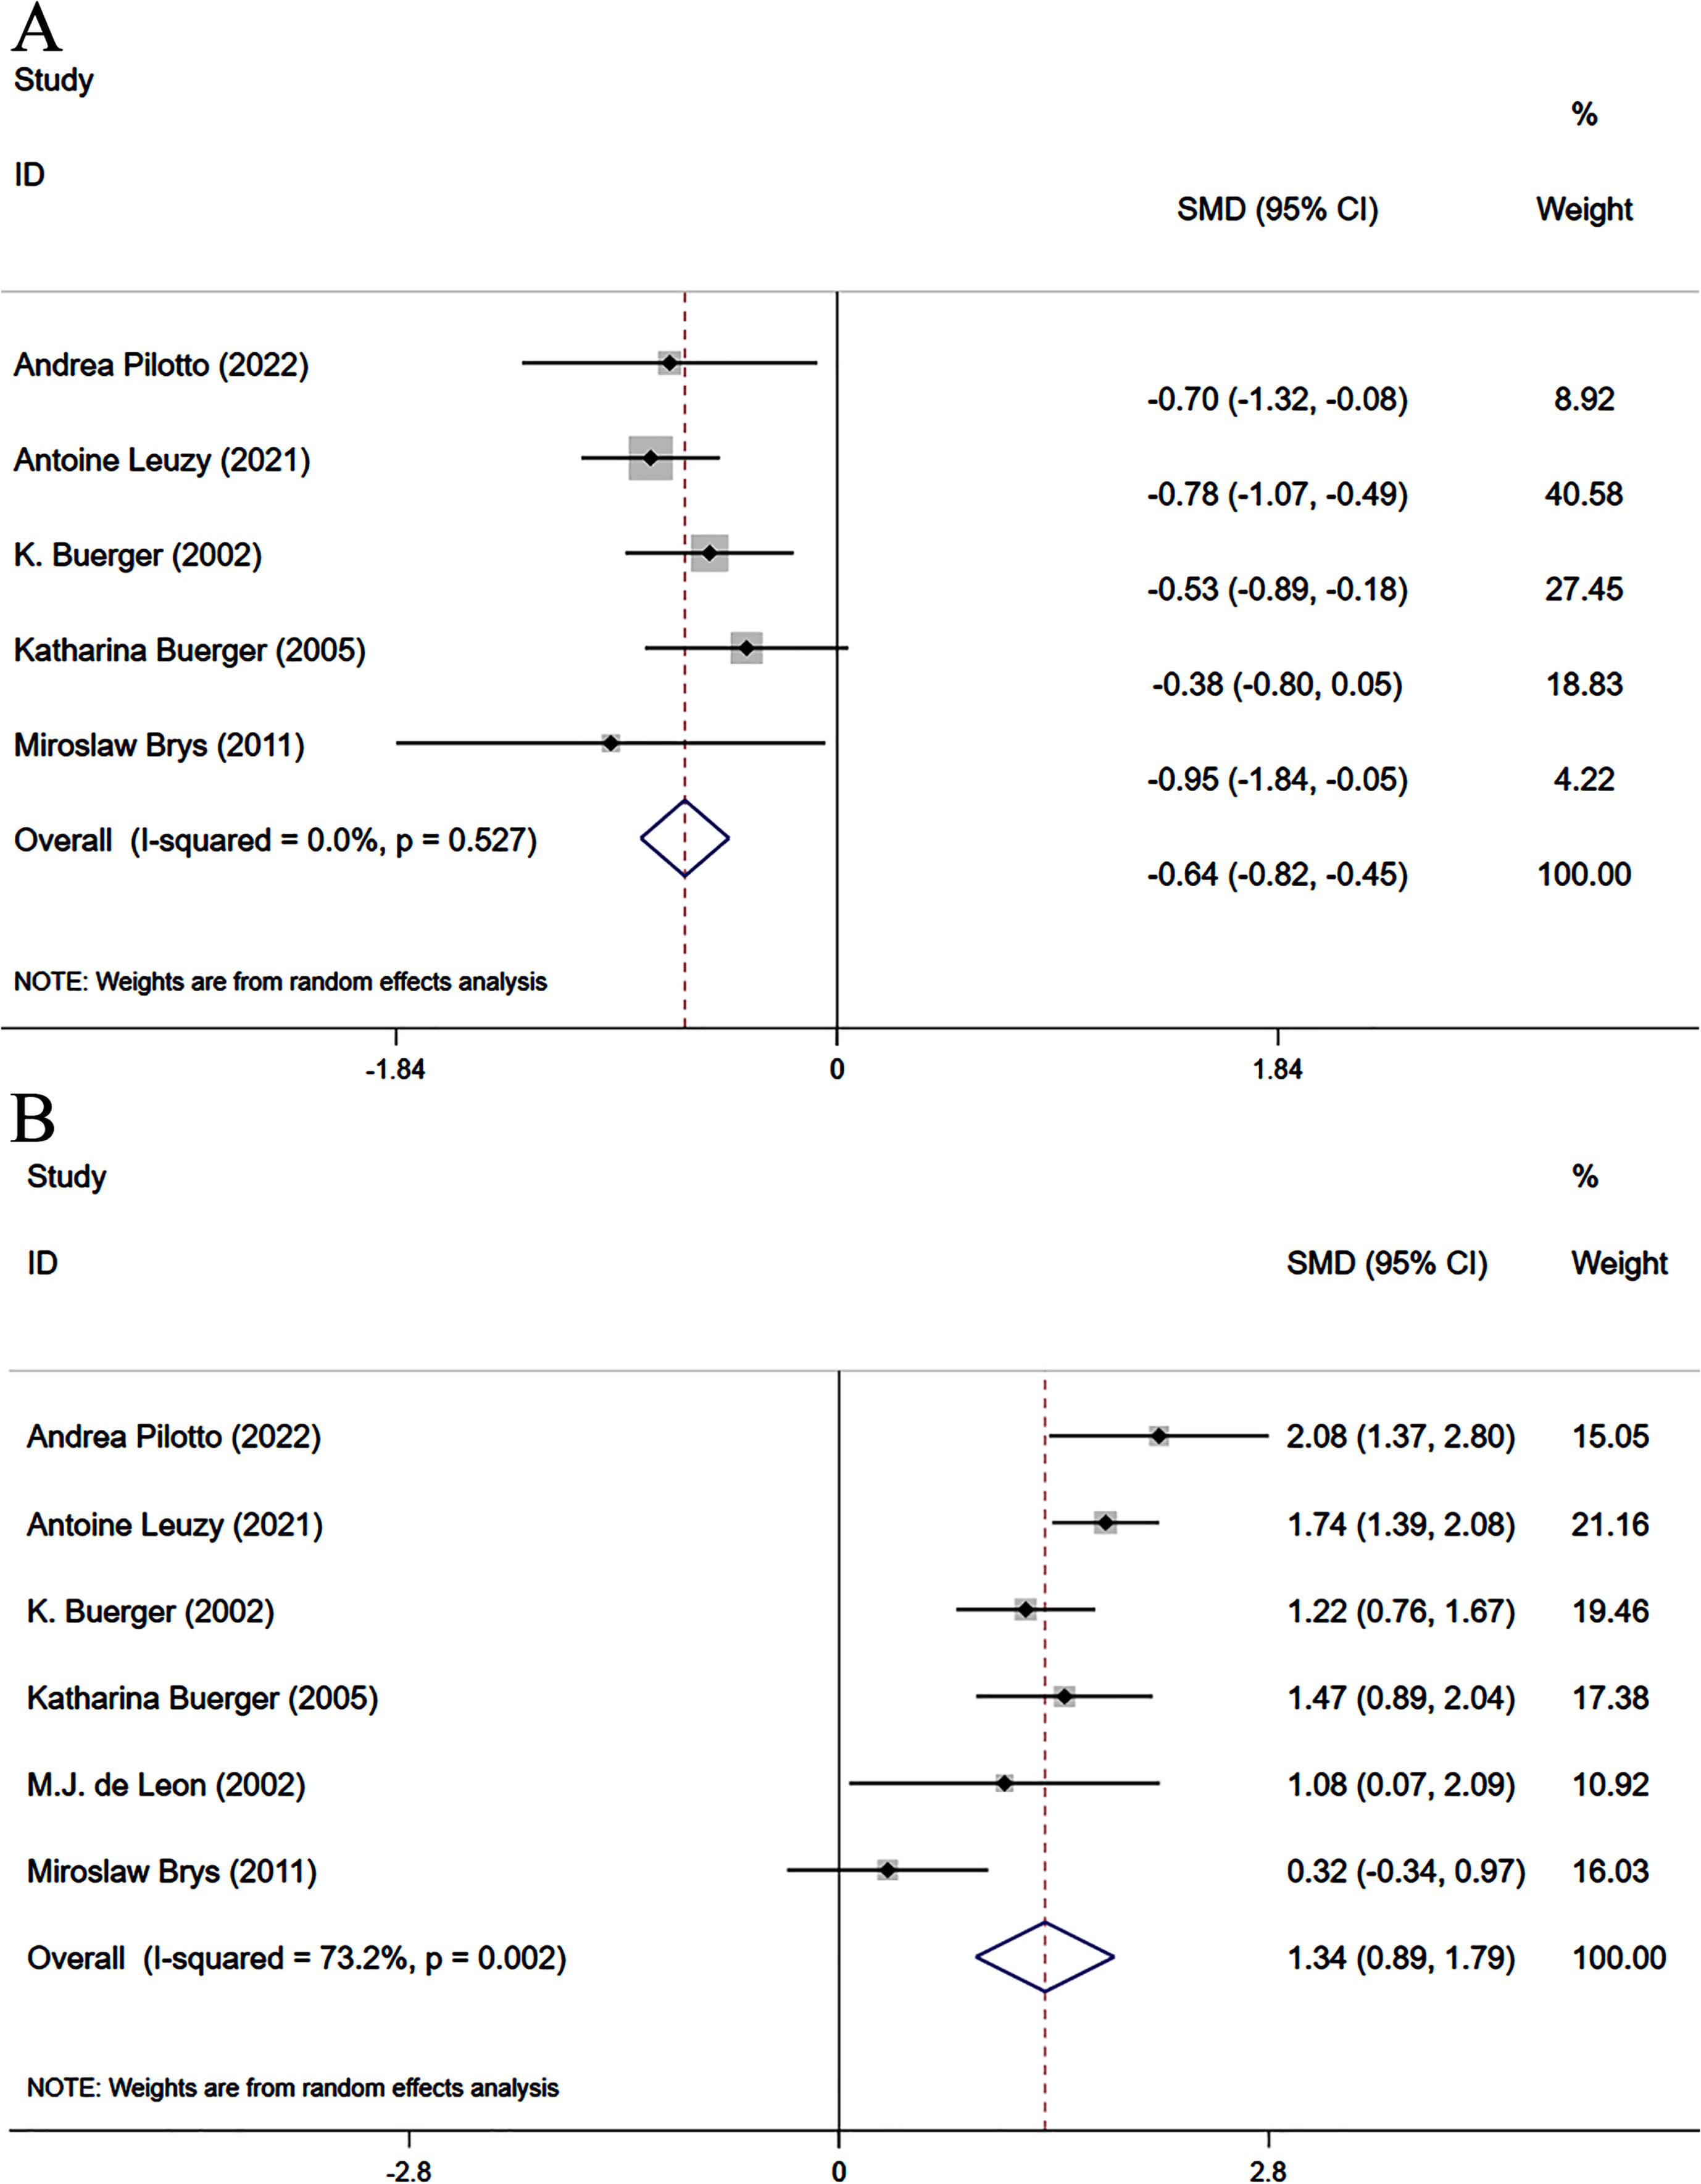
Forest plots for CSF p-tau231 levels in NC, MCI, and AD with random effects model. A) MCI versus AD; B) MCI versus NC. NC, normal control; MCI, mild cognitive impairment; AD, Alzheimer’s disease.
The results showed that p-tau231 levels in MCI patients were lower than in AD patients, but higher than in NC patients (MCI versus AD, SMD =−0.64, 95% CI: −0.82- −0.45; MCI versus NC, SMD = 1.34, 95% CI: 0.89–1.79). Begg’s test demonstrated no publication bias (MCI versus AD: p = 1; MCI versus NC: p = 0.707). Sensitivity analysis and regression analysis showed no factors that might influence the heterogeneity (p > 0.05).
Plasma p-tau 231 levels in the NC, MCI, andD AD groups
Plasma p-tau 231 was reported in three trials, with 136 MCI and 95 AD patients [34, 55]. The analysis demonstrated that plasma p-tau231 levels in MCI patients were not significantly different from AD patients (SMD =−0.87, 95% CI (−1.26, −0.47) (Fig. 5A). However, high heterogeneity was found across these studies. This effect size was related to the general cognitive functions reported in the three studies. Begg’s test suggested no significant publication bias (p = 0.142).
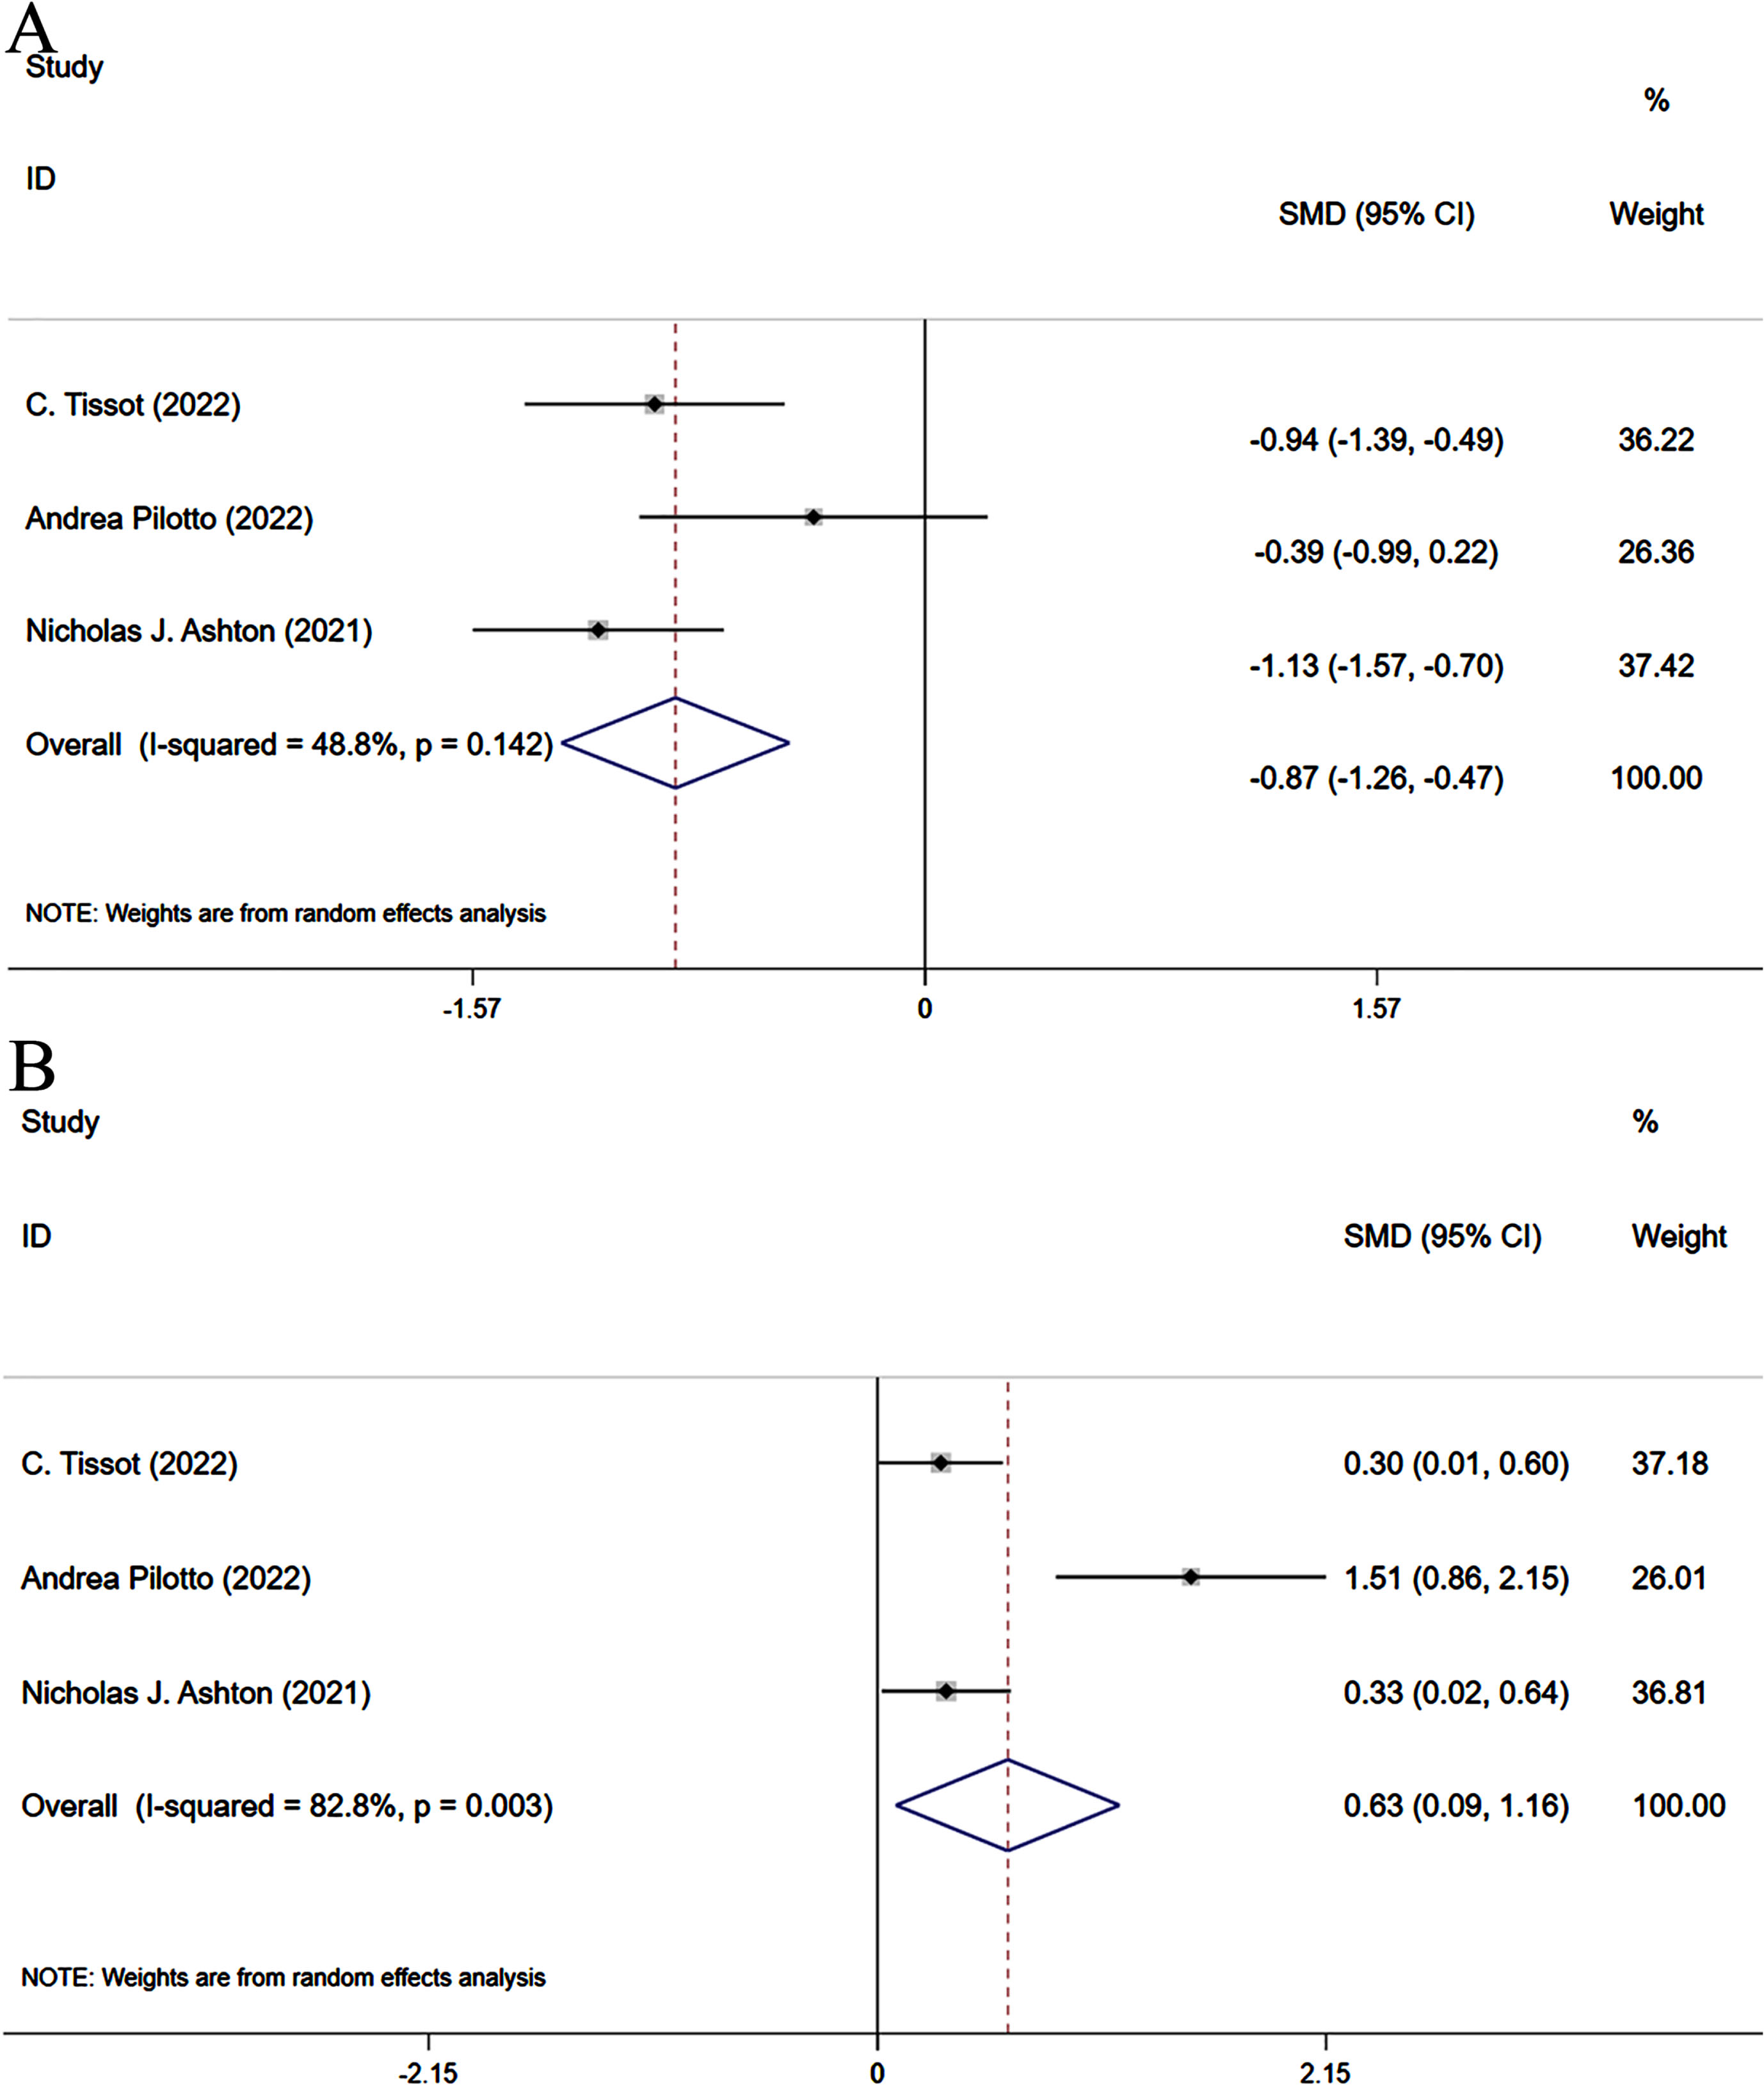
Forest plots for plasma p-tau231 levels in NC, MCI, and AD with random effects model. A) MCI versus AD; B) MCI versus NC. NC, normal control; MCI, mild cognitive impairment.
Furthermore, these three studies [34, 55] also reported different levels of plasma p-tau 231 between MCI and NC groups. The meta-analysis demonstrated a significant difference in plasma p-tau231 levels between the MCI and NC groups (SMD = 0.63 (95% CI: 0.09–1.16) with high heterogeneity (I2 = 82.8%) (Fig. 5B). The sensitivity analysis using the leave-one-out approach revealed that no single study influenced the pooled effect size. Begg’s test indicated no significant publication bias (p = 0.296).
MMSE scores in the MCI and AD groups
Fifteen studies reported MMSE scores in MCI and AD groups [21, 59–62]. The analysis revealed that MCI patients had higher MMSE scores than AD patients, with a significant difference (SMD = 1.80, 95% CI (1.36–2.23)). However, a high level of heterogeneity was observed among the studies (I2 = 93.7%).
Moreover, 16 studies compared MMSE scores between MCI and NC groups [21, 59–62]. The analysis showed that MCI patients had lower MMSE scores than NC individuals (SMD =−0.96, (95% CI (−1.20, −0.71)) with high heterogeneity (I2 = 84.1%). Begg’s test indicated no publication bias (MCI versus NC: p = 0.767; MCI versus AD: p = 0.558).
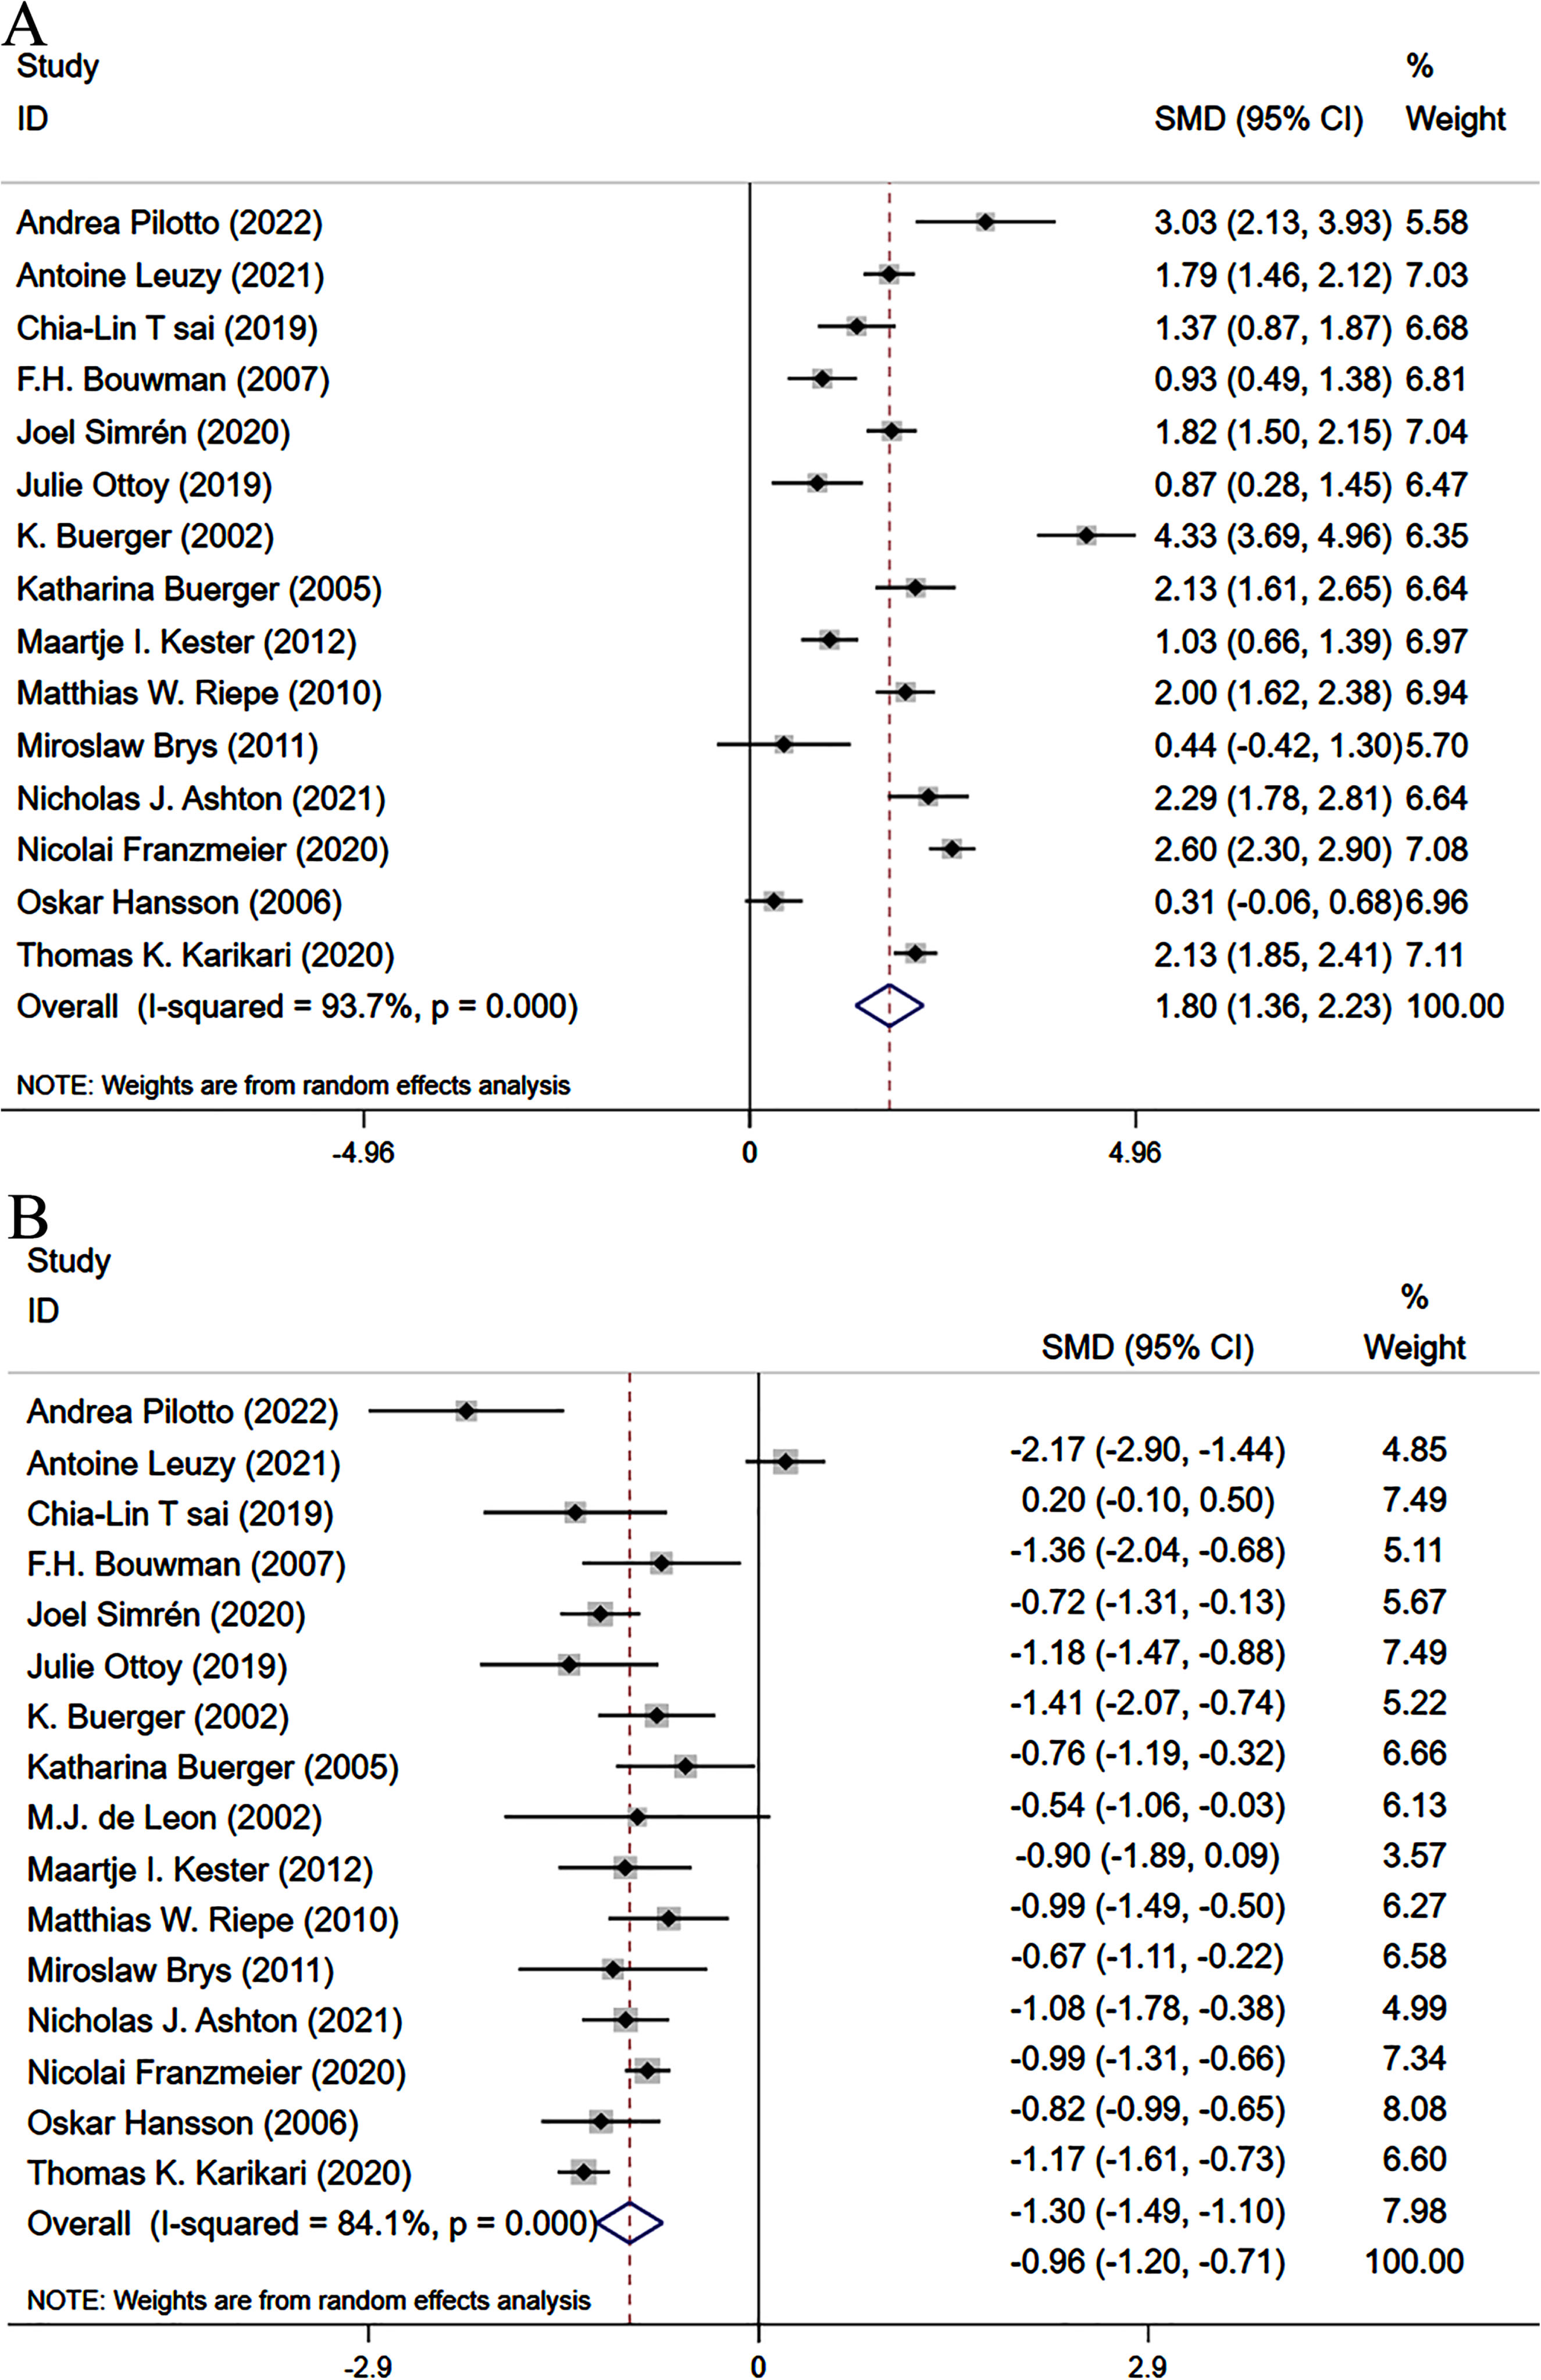
Forest plots for MMSE scores in MCI and NC with random effects model.
DISCUSSION
This study aims to explore the potential of plasma and/or CSF p-tau as biomarkers in distinguishing MCI, AD, and NC individuals. A total of 20 studies were included in our analysis. Our study indicated that CSF and plasma p-tau 181 levels were significantly lower in MCI patients compared to AD patients, whereas the CSF and plasma p-tau 181 levels in MCI patients were relatively higher than those in healthy individuals. Moreover, both the plasma and CSF p-tau 231 levels showed a similar concentration in all groups. In terms of cognitive function, MCI and AD patients exhibited lower MMSE scores than healthy individuals, suggesting a declining cognitive function in MCI and AD patients.
CSF p-tau levels have long been used to distinguish AD from other forms of dementia. However, its clinical efficacy is poor, with 71.6% sensitivity and 77.8% specificity [63]. In recent years, CSF p-tau 231 and p-tau181 have gained attention as promising biomarkers due to their relatively high performance in diagnosing AD-related tau pathology[36, 65].
A cross-sectional diagnostic study in AD and healthy patients demonstrated that p-tau231 was more sensitive and specific than p-tau181, thus significantly reducing false positive identification [36]. Research has suggested that CSF p-tau231 may respond to Aβ homeostasis disruption without early dementia symptoms [66]. Several studies indicate that CSF or plasma p-tau217 has a higher specificity than p-tau181 in diagnosing AD [67, 68]. It is mostly attributed to a higher specificity of p-tau217 in distinguishing AD from other neurodegenerative disorders [33]. Moreover, plasma p-tau231 and p-tau217 exhibit enhanced capability than p-tau 181 in detecting early cerebral dysfunction before the clinical manifestation associated with Aβ plaques, thereby demonstrating considerable potential as blood-based biomarkers [69]. The level of p-tau 217 remains unchanged in non-AD patients with negative beta-amyloid results. More investigations are needed to corroborate these findings [70].
The analysis showed that CSF p-tau231 levels were significantly lower in healthy patients than in MCI patients [36, 71]. Several studies suggest that CSF p-tau231 performs better in detecting early AD than other markers [51, 72] and can provide insights into the severity of cognitive decline. However, there is limited evidence on CSF p-tau231 as a biomarker for AD [73]. Increased expression of p-tau181 in CSF is commonly observed along with degenerative processes in cortical areas of AD patients [74]. Our findings are consistent with previous retrospective analyses, which showed that p-tau181 can potentially differentiate between AD, MCI, and healthy populations [75, 76].
Technology has enabled low-concentration AD biomarker detection, bringing blood-based AD diagnosis closer to clinical diagnosis. The release of p-tau into the bloodstream and its link to cognitive deterioration are still being studied. A possible mechanism for the cognitive decline is the leakage of p-tau from the brain into the bloodstream, possibly due to neuronal damage and a breakdown of the blood-brain barrier [77–81]. Ferreira et al. conducted the first head-to-head study of plasma p-tau231 and p-tau181, involving 30 young adults without cognitive impairment (who passed a cognitive assessment), 155 cognitively healthy individuals, 54 patients with MCI, and 38 patients with AD. Their study revealed that individuals positive for plasma p-tau231 and p-tau181 typically exhibited poorer cognitive performance and had smaller hippocampalvolumes [82].
In contrast to CSF markers, the plasma levels of p-tau181 and p-tau231 are more cost-effective and can identify cognitive decline rapidly [83]. Janelidze et al. also demonstrated that plasma p-tau181 showed good specificity in distinguishing MCI and AD [30]. Growing evidence suggests that blood-based tau biomarkers play an early diagnostic role in AD [84, 85]. Several recent observational studies have demonstrated that plasma p-tau231 can distinguish AD patients and healthy people with high accuracy. In a study using [18F]MK-6240 positron emission tomography (PET), plasma p-tau levels showed a positive correlation with the Aβ PET standardized uptake ratio. The inflection point of p-tau231 increased earlier than other plasma p-tau, indicating its potential to identify AD patients at an earlier stage [31, 35]. In the early stage of AD, plasma p-tau231 was found to be expressed in the occipital cortex and lateral parietal lobe, which were associated with cognitive function [31]. Furthermore, plasma p-tau231 had a stronger correlation with AD in asymptomatic individuals compared to p-tau181 [31]. Another study discovered that plasma p-tau231 levels were considerably higher in AD and MCI patients, compared to healthy controls [55]. Likewise, our study also showed that plasma p-tau231 and p-tau 181 were able to distinguish AD and MCI patients from healthy people [34]. If plasma biomarkers can distinguish between MCI, AD, and healthy populations with comparable sensitivity and specificity to CSF markers, it is possible to determine whether patients need to undergo invasive examinations [86].
Factors such as differences in sample size, evolving diagnostic criteria, subjective clinical assessment, source of subjects, age, gender, and severity of AD may affect the consistency and accuracy of study results. Furthermore, different studies may employ different methods to detect biomarker levels, and different analytical methods may be used to assess the correlation between biomarkers and cognitive function [85]. Different types of detection methods may have different sensitivities and specificities in detecting biomarkers, which may lead to inconsistencies and affect our meta-analysis results. In particular, most of the screened studies were based on enzyme-linked immunosorbent assay (ELISA) measurements, while one study used single molecule array (SimoA) technology and another study employed immunomagnetic reduction (IMR) to measure plasma biomarker concentrations. The ELISA sensitivity is generally lower, and its accuracy in detecting ultralow abundance proteins is often limited, whereas SimoA technology has significantly higher sensitivity, approximately more than 1000 times, than ELISA. The IMR technology relies on the fundamental principles of magnetism and immunology with a high level of sensitivity. This technology improves the magnetic properties resulting from the binding of nanoparticles to specific molecules of interest in order to quantify biomolecules. As a result, any interferences caused by variations in sample color are effectively avoided.
In the early stages of the disease, the accurate detection of these ultralow abundance proteins is essential in diagnosing the occurrence of the disease. However, the extent to which changes in the performance of plasma p-tau biomarkers are influenced by analytical measurement methods remains uncertain [68]. Thus, this can also lead to bias in our results. Furthermore, even though these methodologies exhibit good sensitivity, it is also important to consider the potential impact of antibody variations on the outcomes. Measurement sensitivity may be affected by antibody affinities to proteins. Furthermore, the process of sample preparation has a significant impact, since the choice of buffers and culture medium might potentially induce variability. Various immunoassay platforms utilize different testing methodologies, resulting in different signal amplification strategies. Standardized methods should be utilized to choose volunteers and experimental items before testing. Additionally, efforts should be made to minimize measurement discrepancies across different platforms.
Based on our analysis and several observational studies, both p-tau181 and p-tau231 levels in both plasma and CSF significantly increased in AD patients compared to MCI patients and healthy controls. These findings suggest that p-tau can be used as a biomarker of AD-related cognitive impairments. However, further research is needed to confirm the correlation between plasma p-tau231 and cognitive impairment in AD patients, as lumbar puncture is invasive to obtain CSF samples, which may limit the interpretation of the results. Nonetheless, plasma p-tau231 levels hold promise as a cost-effective and easily accessible diagnostic biomarker for assessing cognitive decline in patients with AD.
Current biomarkers of neurodegeneration are classified into two proteins, amyloid and tau proteins. The amyloid-tau-neurodegeneration (A/T/N) classification system, advocated by the National Institute on Aging and Alzheimer’s Association (NIA-AA), has emerged as a new biomarker classification paradigm. The symbol “A” represents the presence of an Aβ plaque; “T” signifies the occurrence of neurofibrillary tangles, and “N” refers to a quantity of neurodegeneration. The A/T/N system can classify biomarkers as normal (−) or pathological (+), thereby helping doctors identify various illness stages more accurately [87]. After identifying the AD stage, interventions can be more personalized and accurate. More extensive studies are needed to classify participants at the first recruiting stage to better observe the disease progression and treatment outcomes [88, 89].
There are some limitations and constraints in this study that may affect the reliability and generalizability of our results. First, the studies included in this study were limited to English publications, which potentially excluded relevant studies published in other languages. Therefore, our conclusions may not fully represent all studies. Moreover, the evolving diagnostic criteria for AD and the subjective clinical judgments used to diagnose AD might also contribute to the high heterogeneity [90–92]. Therefore, we could not rule out the possibility of publication bias or distortion, which may also affect our conclusions. Additionally, plasma p-tau231 was strongly associated with the PET biomarker than p-tau181 in presymptomatic individuals [93], suggesting that p-tau231 may be more effective in detecting early AD pathology and cognitive decline. Moreover, the number of studies investigating p-tau231 was relatively small, and some of these studies had small sample sizes, which may affect the reliability and generalizability of our conclusions. Translating these results into practice is difficult. The quantitative research employed different methods and reagents. Thus, standardized measurement was necessary for reliable results. Therefore, the use of standardized measurement was essential to ensure robust and valid outcomes. Additionally, the proper collection and storage of blood and CSF were critical, since they significantly impacted the accuracy of biomarker measurements [94]. Furthermore, the calibration of laboratory equipment may have an impact on the accuracy and reliability of measurement outcomes [95]. Ultimately, although it is not feasible to specify individuals’ clinical profiles, biomarkers remain a valuable tool for physicians in evaluating the likelihood of illness. Hence, more original investigations using the ATN classification are needed to validate the reliability of our findings.
Conclusion
In conclusion, our meta-analysis highlights the potential of CSF p-tau 181/231 and plasma p-tau 181/231 as promising, cost-effective, and invasive diagnostic tools for cognitive impairment in AD patients. However, large-scale cohort studies are still required to validate the role of p-tau in diagnosing AD in diverse populations. It is important to note that the results of this study should be interpreted with caution due to high heterogeneity and the possibility of publication bias. Moreover, standardized measurement of p-tau and consistent reference standards are critical for ensuring the consistency of findings across different investigations. In addition to p-tau measurement, neuroimaging techniques can also be employed to improve the precision of AD diagnosis. Furthermore, it is highly urged to further investigate the underlying mechanism of alterations in p-tau levels and their correlation with the progression of diseases. Last, exploring the interplay between various forms of p-tau is also recommended.
AUTHOR CONTRIBUTIONS
Zhirui Li (Formal analysis; Investigation; Methodology; Project administration; Resources; Software; Supervision; Writing – original draft; Writing – review & editing); Zixuan Fan (Conceptualization; Formal analysis; Investigation; Methodology; Writing – original draft; Writing – review & editing); Qian Zhang (Writing – original draft; Writing – review & editing).
Footnotes
ACKNOWLEDGMENTS
The authors have no acknowledgments to report.
FUNDING
The authors have no funding to report.
CONFLICT OF INTEREST
The authors have no conflict of interest to report.
DATA AVAILABILITY
Data sharing is not applicable to this article as no datasets were generated or analyzed during this study.
