
Abstract
The mechanism of electromagnetic interference (EMI) is studied for an engine speed acquisition system in this paper. The effect of states and terminal loads is analyzed for the interference signal, which is simulated by using a commercial software. The oscillation of the voltage interference signal is produced by the speed sensor under the radiation of high-altitude nuclear electromagnetic pulse (HEMP), which has been validated by both simulation and experiment. The interference signal can be collected by the speed acquisition system and the normal operation of the engine will be obstructed. The GTEM cell is used for producing the plane wave for the experiment and the speed acquisition controller is used to test the ability of acquisition for interference signals.
Introduction
HIGH-altitude electromagnetic pulse (HEMP) is generated by the high-altitude nuclear explosion. As known, HEMP is consisted of an early-time HEMP (E1), an intermediate-time HEMP (E2) and a late time HEMP (E3). The early-time HEMP has a very rich frequency spectrum which can result in serious consequence on an electronic control system and draw great interests and concerns in past decades [1].
At first, researchers paid attentions on the coupling wire. The shield wire and twisted pairs were investigated by simulations and test [2,3]. Then the shielding effectiveness of connectors and conductive cavities was studied [4,5]. With continuous development of electronic technology, the impact of HEMP to an electronic control system has attracted more and more attention. For example, the interior electromagnetic environment of the car is studied under the consideration of high-altitude electromagnetic pulse (HEMP) radiation in [6]. Yang studied the effects of the HEMP for engine electronic control system by using the HEMP simulator [7], and found out that an engine control system could be susceptible to the HEMP. As an important component, an electronic controller becomes widely used in system due to its characteristics of high accuracy, light weight and low cost. In practice, the PCB board of the controller is located in a metallic cavity which could provide an shielding effectiveness above 40 dB [8], and the wire and the cable are shielded by conductive nets or tubes [9]. But the speed sensor is always exposed to the air. In such circumstances, the speed acquisition system that is an important part of the engine control system can be easily affected by the HEMP.
In this paper, the oscillating interference mechanism is analyzed for the speed acquisition system. In Section 2, the engine speed system is introduced and the speed sensor could couple large signals from the early-time HEMP. In Section 3, a simplified model of the speed sensor is utilized for simulation by using a commercial software computational simulation technique CST STUDIO. Section VI gives experimental research of the speed sensor. It is shown that the oscillating signal caused by strong pulses can be picked up by controller and used as speed signal by mistake.
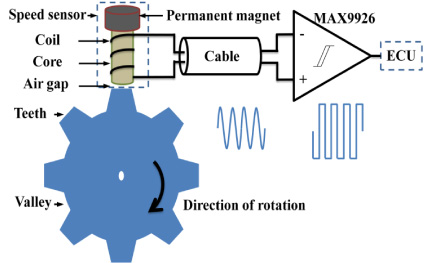
The diagram of speed acquisition system for Engine.
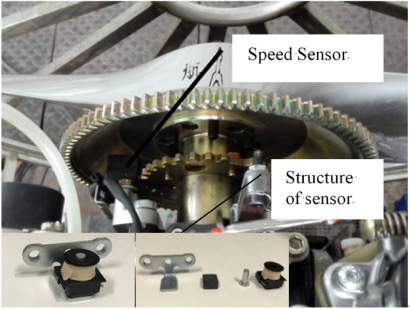
Assembly and structure pictures of the magnetic speed sensor.
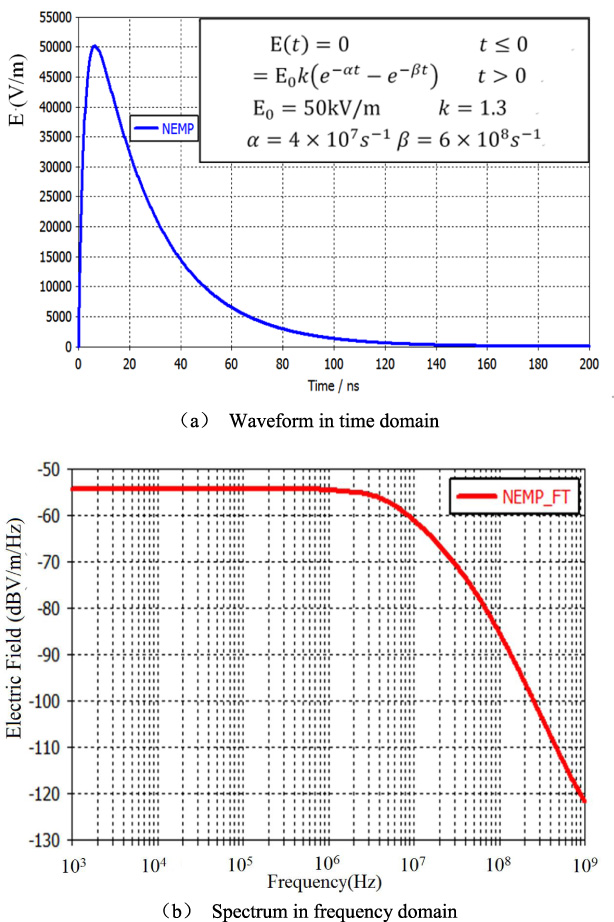
The diagrams of nuclear electromagnetic pulses.
The speed acquisition function of an engine provides instructions which determine the volume of fuel injected into the combustion chamber and the time for ignition. Improper instructions may bring with a fatal consequence on the engine operation. Generally, the speed acquisition system of an engine includes a speed sensor and corresponding signal proceeding circuit for output. As shown in Fig. 1. The electric signal is generated by a magnetic speed sensor. The sensor consists of a permanent magnetic, a core and a coil. The permanent magnetic is located on top of the core, which provides a constant magnetic field for the speed sensor. The magnetic speed sensor is positioned near to the rotating tooth wheel leaving a variable gap between the core and the top of teeth. As a result, the magnetic flux density (generated by the permanent magnet) is changing when the wheel is rotated [10], therefore a time-varying magnetic flux which is produced in the core of speed sensor. It should be pointed out that the variation rate of the magnetic flux is proportional to the wheel speed, the diameter of the tone ring and the density of teeth on the wheel. As shown in Fig. 2, the magnetic speed sensor is embedded into the engine body in front of the gear teeth of the rotating wheel. When the magnetic flux changes, the magnetic speed sensor produces an alternating voltage signal (shown in Fig. 1). The signal frequency is proportional to the wheel speed. The original output signal of the magnetic speed sensor is transformed by a specified chip, MAX9926, to produce a typical rotary encoder signal (a square wave where the frequency of the transitions is proportional to the speed of the rotary object). The trigger function of ECU (Electronic controller unit) collects the rising or falling edge of the square wave signal. Finally, the rotational speed of the shaft can be given as:
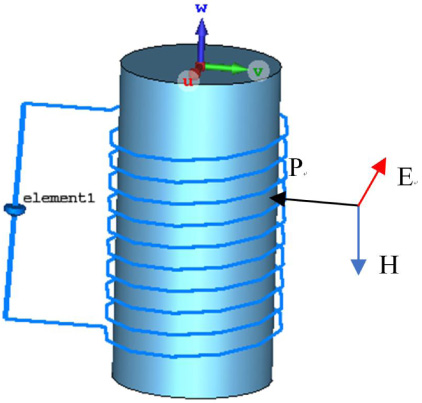
The simplified 3D model of the “open state”.

(a) Voltage time waveform of different loads in ohms. terminals. (b) Voltage frequency waveform of different loads in ohms.
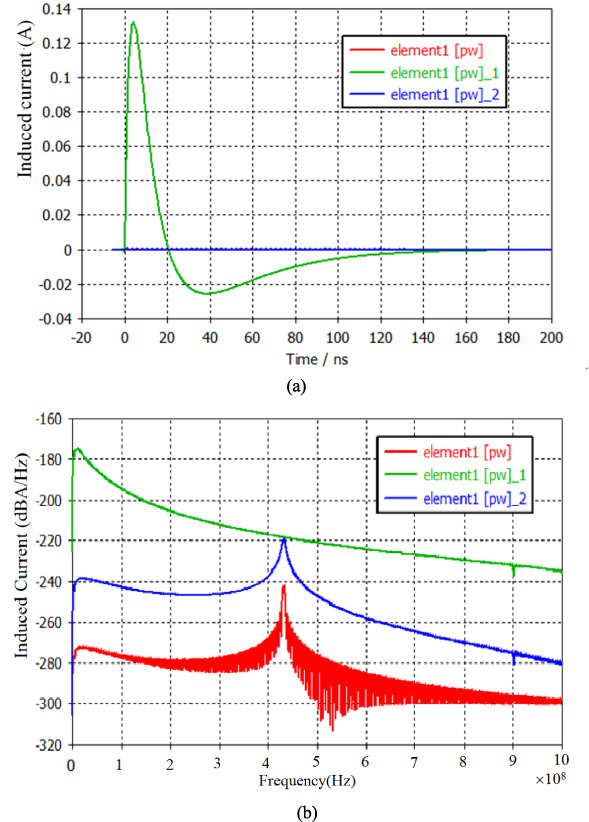
(a) Current time waveform of different terminals. (b) Current frequency waveform of different terminals.
With regard to the nuclear electromagnetic pulse, a double exponential function is employed as the plane wave excitation source in numerical simulations.
A commercial full-wave simulation software, CST Microwave Studio, is used for the analysis of electromagnetic coupling effect of the magnetic speed sensor towards HEMP. According to the spectrum characteristic of HEMP (E1), the frequencies are swept upto 1000 MHz to cover the main power of HEMP (as shown in Fig. 3). The boundary condition is set to be “open” in all directions. Polarization and propagation direction of the plane wave is decided on different states in the following simulations. The lumped element is used as the terminal load. Hexahedral TLM is used to simulate the effects of radiation for speed sensor. Taking into account the skin effect and proximity effect of the wire under the action of high frequency electromagnetic fields, a simplified model of the sensor is built by using the equivalent line of CST Microwave Studio [12]. In practice, the number of wire turns of the speed sensor is up to several thousands which may costs great computation and lots of memory. Therefore a simplified speed sensor with 10 turns over one layer of coil (with a metal core) are used here without loss of generality.
According to the working function of the inductive speed sensor, the operating state is classified into “open state” and “closed state”. When the magnetic flux reaches the minimum value, the magnetic field line is considered to form a loop through the external air which is considered as the “open state”. On the contrary, when the magnetic field reaches its maximum, the magnetic field line is considered to form a loop through the metal with less reluctance, and there is only a tiny gap between the core and the top of the tooth.
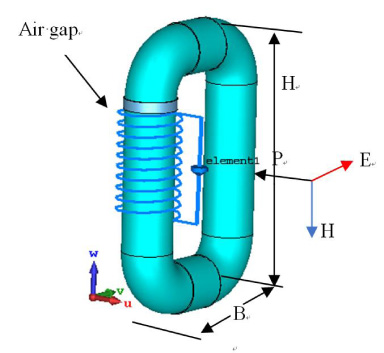
A 3D model of “open state” for simulation is shown in Fig. 4 with corresponding parameters given in Table 1. Since the gap is between the valley of wheel and the magnetic speed sensor, the magnetic field reaches its minimum value. To meet the military standard MIL-STD-461F, a plane wave with double exponential excitation signal is used as an excitation source [11]. The propagation of electromagnetic waves is along the minus v-axis of the coordinate system, and the direction of the magnetic field is perpendicular to the coil, which produces the maximum magnetic flux effective area (as shown in Fig. 4). The coil is investigated by loading lumped elements with different resistance and the simulation results are shown in Fig. 5 and Fig. 6.
The simplified 3D model of the “closed state”.
Parameters of the OPEN sensor
(a) Time domain voltage of the two states. (b) Frequency domain voltage of the two states.
From the simulation results, the following conclusions are drawn.
(1) When the terminal load resistance is comparable to an open circuit, the terminal voltage of the magnetic speed sensor is oscillating in the time domain and voltage amplitude damps slowly (shown in Fig. 5(a)).
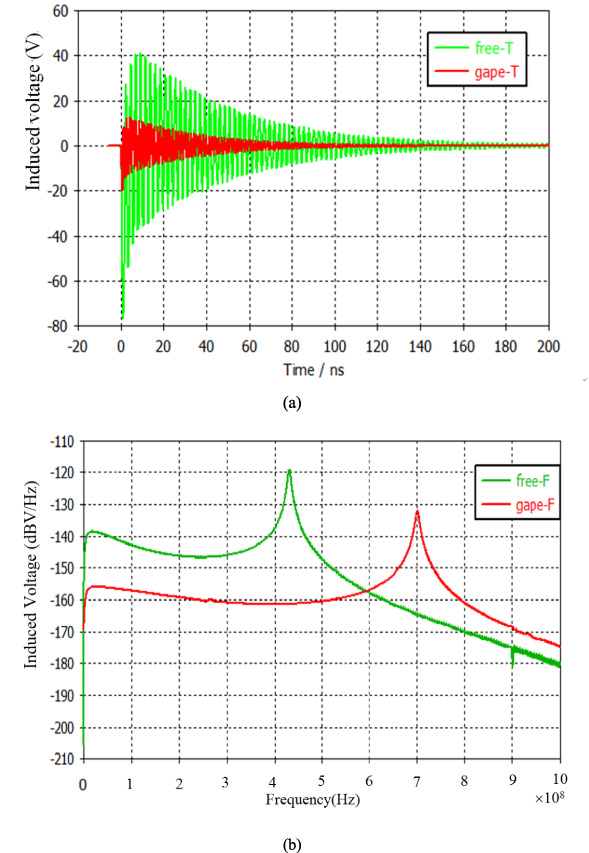
(a) Diagram of the GTEM cell’s electric field. (b) Location of the speed sensor in the experiment.
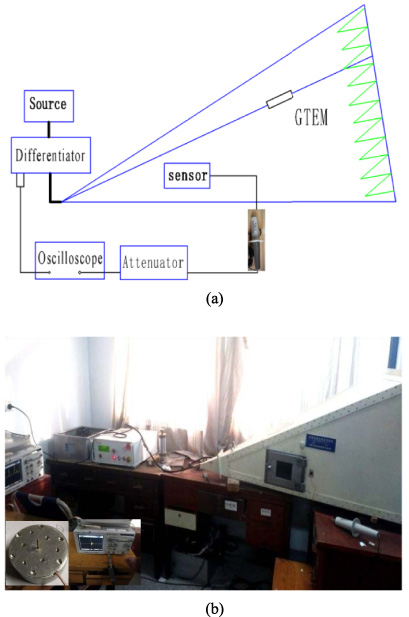
(a) Diagram of radiation coupling experiment. (b) Physical picture of radiation coupling experiment.
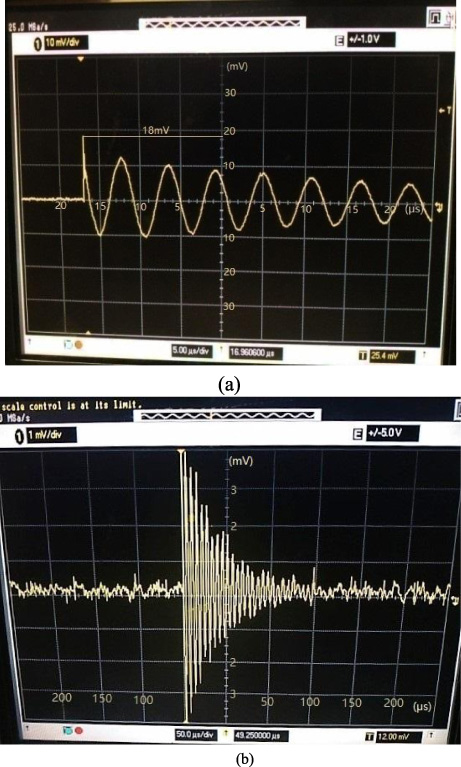
Voltage waveform diagram.
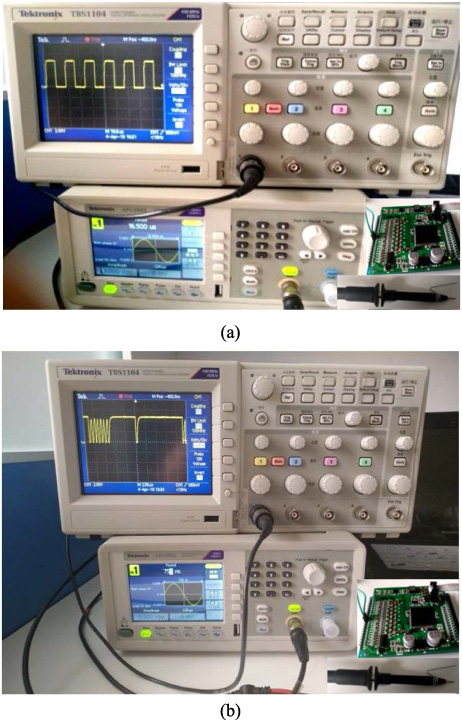
(a) Normal output of max9926 chip. (b) The error code output of MAX9926 chip.
(2) When the resistance reduces from 5 MΩ to 100 kΩ, the maximum value of the voltage do not change obviously, but the envelope of the signal damps dramatically.
(3) The oscillations of the terminal voltage will be disappearing when the load resistance becomes less than 50 Ω. The oscillation in the time domain is mainly produced by the resonance at about 430 MHz (shows in Fig. 5(b)).
(4) The amplitude of the terminal current in the time domain decreases rapidly as the electrical resistance of the terminal reduces (shown in Fig. 6(a)), and the terminal current has the same resonant frequency.
When the top of the teeth moves to the nearest of the core of the magnetic speed sensor, a closed state is used to describe the magnetic field reaching its maximum value. As shown in Fig. 7, the simulation model of the speed sensor is changed with a gap cutting from a circular core which is used for mimicking the low resistance magnetic field circuit. The gap presents the small space between the core and top of the teeth. The parameters of simplified magnetic speed sensor are shown in Table 2.
Parameters of the CLOSED sensor
Parameters of the CLOSED sensor
The “closed state” and the “open state” are compared in Fig. 8, which has the same terminal load of 100 kΩ.
In the diagram, the green curve with a label of “free” represents the “open state” with the 100 kΩ terminal load, and the red curve with a label of “gape” gives the “closed state” which has the same terminal load as the “open state”. The time domain shows that the voltage dropped from 76 V to 20 V, when the “open state” converts to the “closed state”. According o the frequency domain results, it could be found out that the resonance frequency increases from 430 MHz to 700 MHz and the frequency amplitude decreases more than 12 dB. It is known that the HEMP energy is mainly concentrated at 100 kHz to 200 MHz. This produces the phenomenon, which reduces the voltage value from 76 V to 20 V. But the resonance still exists.
The principle of the speed system of an engine shows that the alternating wave form (produced by the speed sensor) is converted to a square wave signal by MAX9926. Then the oscillating interference signal (produced by coupling of speed sensor) is transformed into a square wave interference signal by MAX9926.
In this section, experiments are conducted to verify the above phenomenon and theory. First the coupling experiment is carried out for demonstration. Typical parameters, such as the amplitude, the period and the duration are obtained through the radiation experiment.
The interference signal is generated by an arbitrary waveform generator and it has the frequency characteristics of the oscillation waveform. The same interfering waveform is injected into the input pin of MAX9926, and the output square wave is observed by an oscilloscope.
The coupling experiment
This coupling experiment is used to prove the existence of oscillation. The simplified model of speed sensor is used to show the problem of the oscillation.
A GTEM cell is used to test the speed sensor because of the small volume of the speed sensor. So, external instruments and people are not necessary to be shielded for the GTEM cell’s interference. All equipments used in this experiment are listed in Table 3.
Test equipment list
Test equipment list
The source is used to provide a double exponential pulse excitation for the GTEM cell. The double exponential pulse signal of the source is collected from the differentiator, and the electric field strength is measured by the electric field probe which has been calibrated before measuring. At the same time, comparing with the effective area of the GTEM cell, the volume of the speed sensor is very small, so the uniformity of the field can be guaranteed. The electric field strength inside the GTEM cell is shown in Fig. 9(a).
The coil is located at an effective position inside the GTEM cell. The coil axis is parallel to the direction of the magnetic field (shown in Fig. 9(b)). A voltage probe Tektronix P6015A is used to record the terminal voltage of speed sensor. The signal is attenuated about 1000 times by the voltage probe and is conducted into the oscilloscope by a 10 dB attenuator. The total attenuation coefficient is 3162. Figure 10 gives the test scenario of the coupling experiment.
From the results, the resonance period is shown in Fig. 11(a) and the duration of resonance is shown in Fig. 11(b). The transient responses provided in Fig. 11(b) is very close to the simulation results given by CST Microwave studio. The resonance period of the signal (in Fig. 11(a)) is about 20 us, and the max amplitude is about 158 V. Duration of the resonance phenomenon is more than 150 us.
The coupling of speed sensor will produce the oscillating voltage signal as an input signal of the chip. The resonance voltage has two main features: frequency and amplitude. The amplitude of the oscillating voltage signal can meet the requirements of the chip. If the frequency of oscillating voltage signal can be identified by the chip, the oscillating voltage signal will be processed as a useful signal. The operating of engine will be interfered.
This experiment is to test the chip response by using different frequency of signals. An authentic ECU of the engine control is designed for this experiment. When the PCB controller is connecting to the terminal of the speed sensor in the coupling experiment, a signal with the voltage amplitude around 158 V will not cause any permanent damages to the chip of MAX9926. It is validated that the MAX9926 chip links to the terminal of the speed sensor in the coupling experiment. Continues signal with different frequency (produced by the signal generator of Tektronix 2012B) is directly injected to the input pin of the MAX9926, and an oscilloscope is used to measure the output signal of the chip, which is shown in Fig. 12.
When the period of the input sinusoidal signal is 16.5 us and the amplitude is 5 V, the output is the square wave as the signal used in the engine control. The output signal is shown in Fig. 12(a). When the period of the input sinusoidal signal is less than 820 ns, the front of the square wave becomes distorted. The error code happens when the period is less than 758 ns in Fig. 12(b).
The chip response experiment is used to show that the frequency of the interference signal is converted to a square wave by the MAX9926 chip, and the square wave is treated as a useful signal of speed by ECU, which decides the starting time.
Conclusion
The coupling mechanism of the speed acquisition system with the threat of HEMP is analyzed in this paper. Resonance phenomenon of the terminal signals of the speed sensor is observed by using full-wave simulations. The phenomenon has been confirmed by using the real speed sensor in the GTEM cell.
The interference signal is converted into a square signal which can be handled by the controller. So error ignition and injecting orders are given by the controller of ECU which sends orders according to the speed and phase of the speed sensor. Then the interference signal produces a strong disturbance to the stable operation of the engine. All of these may make the running state of engine fluctuate, which has a close relationship with the characteristics of engine structure, load and control method.
Footnotes
Acknowledgements
The authors would like to thank Cheng Yang (Southeast University) and Peng Li (Southeast University) for technical support on the experimentation. And also thanks Bilal for checking this paper.