
Abstract
Nowadays most of the time humans spend in daily life on mobile phones but the thing that tends to get worried about is battery consumption as they run out quickly. We could not make important jobs such as emergency calls or send important documents when our phone battery runs out. This study represents vibration based sound energy is harvested to charge mobile phones using six piezoelectric sound transducers (PSTs) which converts sound energy to electrical energy. This paper proposed designing a low voltage sound energy harvesting circuit (SEHC) using PSTs. PSTs with SEHC is considered as an alternative power source to charge the smart phone battery, especially for remote area where power is unavailable. The SEHC consists of PSTs, non-controlled bridge rectifier circuit, filter, switch-mode open loop boost converter, charger circuit, and storage device at the output terminal. The complete SEHC has designed and simulated using Matlab Simulink software. The PSTs have been analyzed with different frequency and the output voltage of PSTs utilized as an input source to design SEHC. Finally, the results are generated at an output of 7.8 V DC from an input 1.05 V AC at 314 Hz through a SEHC using the PSTs, which suitable to charge smartphone battery efficiently.
Introduction
The earlier energy harvesting (EH) system is unstable and may acquire the uncertain act when it comes to real data-driven applications. This approach has made the EH system an important area of research as this energy can be obtained from the ambient environment free of charge. However, this type of energy is unpredictable and capable of exhibiting uncertain behavior in the actual practice system. It also produces low power values and is often used for low-power system operation. Among the most commonly used EH devices are photovoltaic, thermoelectric, piezoelectric, and electrostatic [1,2]. The EH system is commenced to increase the overall system efficiency and to utilize the benefits of the different sources. Thermoelectric is identified capable to convert waste heat energy into electricity. But this device cannot function individually since it generates low power. Behind that, solar energy is a well known viable energy to produce high power. Similarly, the performance of this energy is limited by the discrepancy of the sunlight irradiation.
The use of EH devices to reduce dependence on fossil fuels has attracted extensive research. Fossil fuel energy has exposed the world to environmental crises such as air pollution, hazardous waste release, and ozone depletion. With the ongoing crisis, today’s scientific research is more focused on the development of alternative energy to replace non-renewable energy use. There are several types of commonly used alternative energy devices such as electromagnetic, thermoelectric and piezoelectric [3,4]. In addition, solutions that align with the world’s need to target zero waste have also increased the number of studies in the field of EH. Most previous research has discussed thermoelectric module (TEM) behavior analysis that serves as a thermoelectric generator that only involves the steady-state where the cold side temperature is controlled by using heat sink devices as described in [5]. However, in real terms, the temperature of the TEM input will always fluctuate with a change in time to which it relies solely on the medium in which the TEM will be used. This suggests that the analysis of mortal conditions is crucial to focus on the next study to obtain a true picture of TEM behavior. This condition becomes more important when the TEM is used to channel the energy it generates to other systems.
Energy can be defined as the ability to do work. It has a transferable property from one matter to another matter in converted forms but neither can’t be created nor destroyed [6–8]. Without energy, any work is left undone [9]. Energy comes in several types such as heat energy, light energy, thermal, sound energy, and vibration energy [10–12]. This study is emphasized on sound energy. Sound energy is a type of energy, which can be related to the vibrations of matter. It is a type of mechanical wave or oscillation of pressure (combination of alternating compressions and rarefactions) which means it requires an object to travel through [13]. Sound energy had been chosen as nowadays, noise pollution is becoming worst and we wanted to produce something useful out of the pollution. Energy harvesting or power harvesting, is a process whereby energy is derived from external sources solar energy, thermal energy, kinetic energy, and wind energy captured and stored for small devices which are known as energy harvester [9,14]. This energy, which has been stored, will be later on converted into other forms of energy. A mobile device on the other hand is a device, which is computer-based, and the size is small that we can hold it just by using our hand. For example, smart phones and tablets [15,16].
The purpose of doing this study is to design and build a SEHC that can convert sound to electrical energy and to charge a mobile device efficiently. The significance for this study is that we can make use the noise pollution that is on going in our environment. Due to overcoming, it would be hard where we are trying to make the world quieter, we produce something good out of it. That is converting the sound energy into electrical energy. Next, we can have a new alternative energy, which everyone is searching for. This energy is not only renewable but it also can easily be obtained as simple as talking.
Furthermore, this study can solve the problem of mobile devices’ short life span battery. The battery can be constantly be charged without having to connect it into plugs or power banks. Moreover, this study expands sound energy harvesting for domestic electricity supply.
Phenomenon of sound energy harvesting
Mechanical energy (a form of energy caused by vibrations and change in pressure; this energy can be derived from sound energy), which can be harvested from the environment [17,18]. The piezoelectric effect works on the basis of converting sound energy to mechanical energy first before converting it to electrical energy [19]. Sources of sound energy or mechanical energy and ambient vibration are also analyzed and listed as shown in Table 1 and Table 2 [20].
Sources of sound and mechanical energy
Sources of sound and mechanical energy
Sources of vibration based ambient energy
In [21] the study is proposed harvesting other forms of energy which abundance in the environment as shown in Fig. 1. Further investigation is done on the specifications and capacities of different piezoelectric transducers; it is addressed as resonant devices here as shown in Table 3 [21].
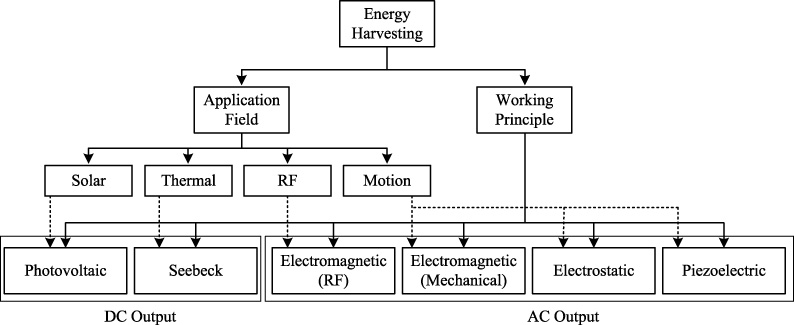
Various methods of generating electricity.
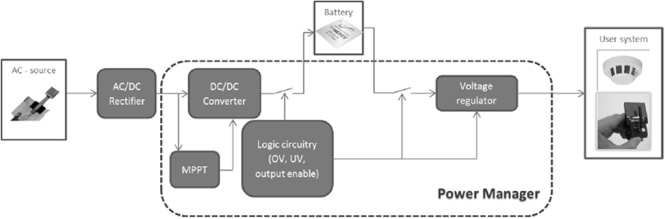
A harvester has been designed where it is a piezoelectric transducer, AC–DC rectifier, and power manager, which is also known as conditioning circuitry. However, the design is just the basic innovation of piezoelectric harvester as shown in Fig. 2 [21].
Furthermore, the work in [22] indicated that on creating piezoelectric harvester to harvest sound energy produced by jet engines for generation of electricity (i.e., scientists employ piezoelectric effect to harvest energy from sound. According the study in [22], the harvester or the sensor receives input vibrations from jet engine to produce electricity for the jet’s system back. At the same, as the sensor absorbs noise and unwanted vibrations from the engine, the level of the jet’s noise could be then reduced and noise pollution from flying aircraft can be reduced [23].
Specifications & capacities of different piezoelectric transducers
In [24], the authors indicated that in conjunction with sound harvesting, noise reduction is also given a great weightage. It seeks to exploit the energy in pressure ripple in pumped hydraulic systems to generate low levels of electrical energy sufficient to power wireless sensing and transmitting nodes. Four generations of prototypes have been designed, fabricated, and tested, mainly by [24]. The devices generate up to 2.2 mW of power, adequate for their intended purposes. The devices have been designed for service in hydraulic systems up to 35 MPa (5000 psi). They are making use of the piezoelectric effects a lot in this research. This is because, as mentioned earlier, piezo material is able to generate electricity when it detects any changes in pressure (can be caused by any means, as here it is the pressure exerted from hydraulic pumps) on its surface [25].
In [26], the authors proposed the key properties of zinc oxide, a material that when squashed or stretched creates a voltage by converting energy from motion into electrical energy, in the form of nanorods. The nanorods can be coated onto various surfaces in different locations making the EH quite versatile. When this surface is squashed or stretched, the nanorods then generate a high voltage [27]. The nanorods respond to vibration and movement created by everyday sound, such as our voices. Electrical contacts on both sides of the rods are then used to harvest the voltage to charge a phone. Yet their prototype can only produce a maximum of five volts if it’s physically tapped all the time [28]. The study in [29], being able to keep mobile devices working for longer, or do away with batteries completely by tapping into the stray energy that is all around us is an exciting concept. This collaboration was an excellent opportunity to develop alternative device designs using cheap and scalable methods. In this proposed study have brought this technology closer to viability.
Basic innovation of piezoelectric harvester.
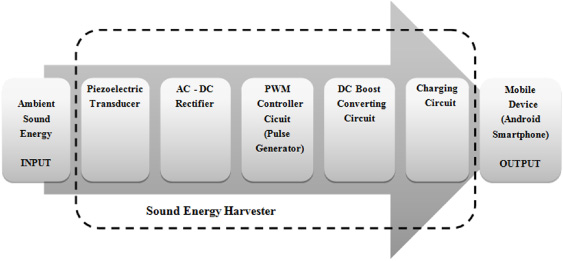
The block diagram of the sound energy harvesting is shown in Fig. 3. The advanced of this proposed model is including an extra circuit called the DC boost converter and charging circuit, where through this harvester can be used for high ranges of regulated voltage requirements. Electrical energy will be in the form of AC voltage. As a smartphone requires DC voltage, the AC–DC rectifier circuit converts AC voltage to DC voltage through diode rectification process. Then, the circuit continues with the pulse width modulation (PWM) controller circuit (pulse generator) where the voltage will be then matched to the battery charging level of the Android smartphones. Finally, the charging rate of the android smartphones can be controlled through amplification of voltage by designing a DC boost converter circuit. The output voltage is then regulated by the charging circuit and channeled to the smartphone for charging.
Block diagram design of piezoelectric harvester.
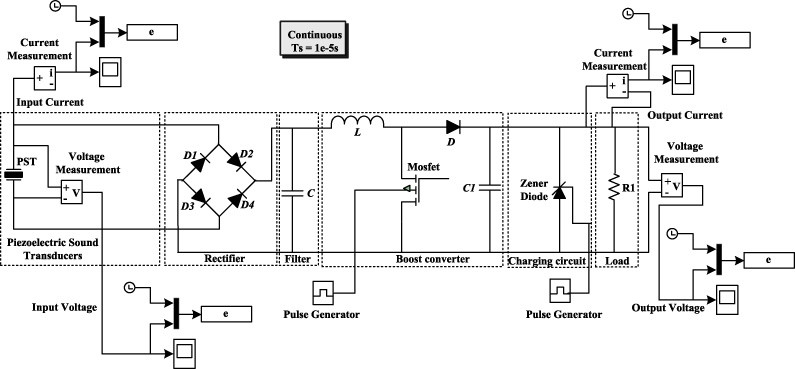
In this study have been developed three main circuits that convert low AC voltage produced to suitable and stable high DC voltage which are the bridge rectifier circuit, DC–boost converter, and the charging circuit. Figure 4 shows the proposed schematic diagram of the combined circuit that has modeled. To develop the proposed model Matlab Simulink software have used to test the efficiency of the circuit. Simulation through this software allows us to find the suitable and stable capacitance and inductance value in order to produce stable and high voltage supply without ripples in the signals.
From the simulation in the Matlab Simulink software, we have found the right capacitance value, inductance value, and the pulse generator frequency in order to produce stable DC supply at 3.7 V which is suitable to charge a typical android phone battery. The circuitry is divided into three main circuits, which are the bridge rectifier circuit, DC–boost converter circuit, and the charger circuit. The bridge rectifier circuit consist of four diodes arrange in specific order and a capacitor which functions as filter in the circuit. The function of the circuit is to convert AC voltage source to stable DC voltage source. The capacitor reduces the ripples in the voltage signals formed after the rectification by the diodes to produce a more stable voltage output. However, the magnitude of the voltage drops due to resistance of the diodes. Next is the DC-boost converter circuit, which consists of an inductor, MOSFET switch, diode and a pulse generator. The main function of the circuit is boost up the low voltage input into a larger voltage output. In this developed circuit managed to boost input voltage range approximately 170 mV to 1.05 V. The magnitude of boosting of voltage depends on the frequency of pulse generator. This pulse generator controls the frequency of the MOSFET gate and the suitable frequency of pulse generator was 10 kHz. Although high voltage is produced, the voltage output was still unsuitable to charge a phone battery smoothly due to some ripples in voltage that was produced after boosting. This is where the charging circuit comes into picture. The charger circuit was made up of a zener diode and pulse generator to control it. This circuit smooth the voltage output and eliminates the ripples in the voltage signal to produce suitable voltage output to charge a phone battery. The zener diode in this circuit stabilizes the voltage output at 7.8 V DC with aid of a pulse generator to control it.
A similar research field has been carried out by [30] where they only used two circuits in their circuitry which are rectifier circuit and charging circuit. This circuit was only able to produce a low magnitude voltage with ripples in it and took a long time to charge a phone’s battery. On the other hand, this study is developed SEHC was able to generate double the voltage and is capable to charge battery within a few hours. The voltage produced from proposed circuits are ideal and suitable to charge a typical android phone battery and could improvise with further modifications.
Circuit diagram of the developed sound energy harvesting system.
PSTs used in the study is tested for its voltage output. The six PSTs are chosen as sample of this experimental analysis. The six PSTs are connected in series to determine the total voltage build up by all the transducers. The transducer is connected to digital oscilloscope to determine the characteristic of voltage generated by the transducer and its output voltage produced by all six PSTs at different frequency of vibrations. The frequency of vibration is controlled by the diaphragm vibrator, which is assumed to produce the same vibration as environmental sound. The set-up of this experiment was as shown in Fig. 5.
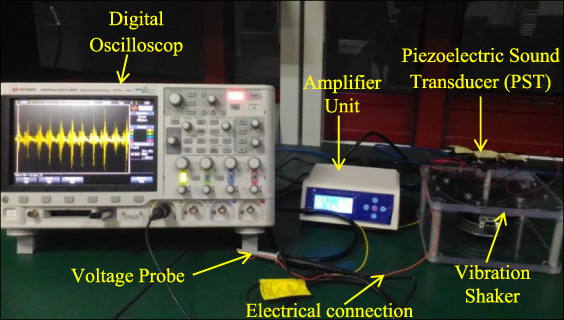
Experimental setup of the PSTs.
Six PSTs have been tested with the energy harvesting power conversion circuits. The prototype of PSTs is shown in Fig. 6. The parameter values of the PSTs are summarized as shown in Table 4.
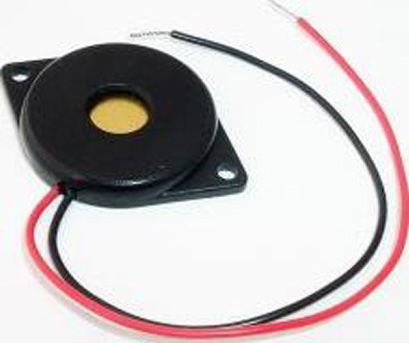
Prototype of the piezoelectric sound transducers.
Parameters of piezoelectric vibration transducer
This section describes the behaviors of PSTs and the outcome of the improvement SEHC results, which is simulated through the Matlab software.
Behaviors of the PSTs
The characteristic of the PSTs, it is produced energy through vibration. The frequency of vibration was set at 10 Hz, 52 Hz, 71 Hz, 90 Hz and 314 Hz and the voltage generated from the six transducers was measured and recorded in Table 5. The experimental snap is short of the SEHC system using PSTs corresponding through frequency as shown in Fig. 7 to Fig. 11. Figure 7 shows the graph signal obtained from oscilloscope was not stable and wavy. The average voltage generated by six PSTs was minimum and maximum range between 170.2 mV to 1.05 V in this particular frequency.
Analytical data from PSTs
Analytical data from PSTs
Figure 7 shows the voltage signal obtained from the oscilloscope was not stable and even wavier than before. The average voltage generated by six transducers is 170.2 mV in this particular frequency 10 Hz.
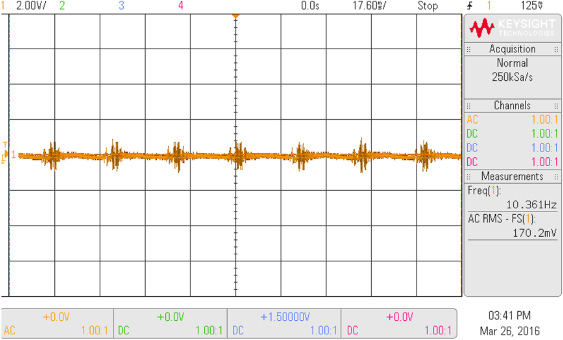
Oscilloscope measured r.m.s voltage output around 170.2 mV from vibration of 10 Hz.
Figure 8 shows the voltage signal obtained from the oscilloscope was not stable and even wavier than before. Average voltage generated by six PSTs is 707.2 mV in this particular frequency 52 Hz.
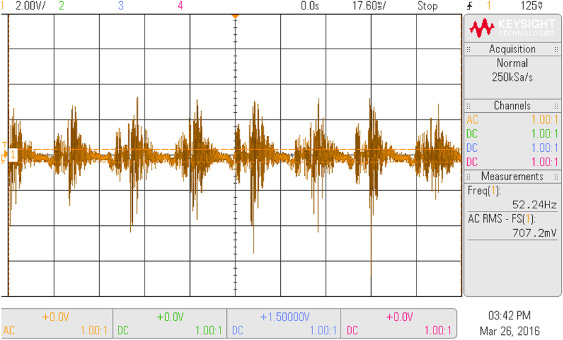
Oscilloscope measure r.m.s voltage output around 707.2 mV from vibration of 52 Hz.
Figure 9 shows the voltage signal obtained from oscilloscope was still unstable and wavy. Average voltage generated by six PSTs was 814.6 mV for this particular frequency 71 Hz.
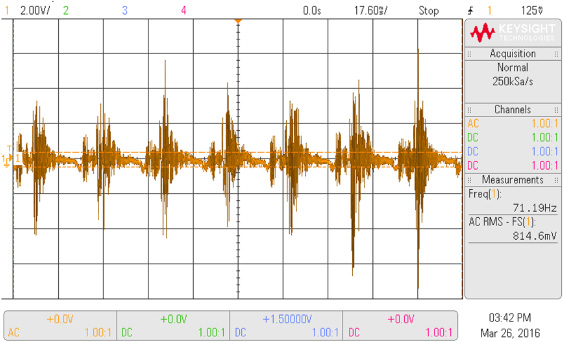
Oscilloscope measured r.m.s 814.6 mV for vibration with frequency of 71 Hz.
Figure 10 shows the voltage signal obtained from the oscilloscope was still unstable and gets wavier than before. Average voltage generated by six PSTs was 854.6 mV for this particular frequency 90 Hz.
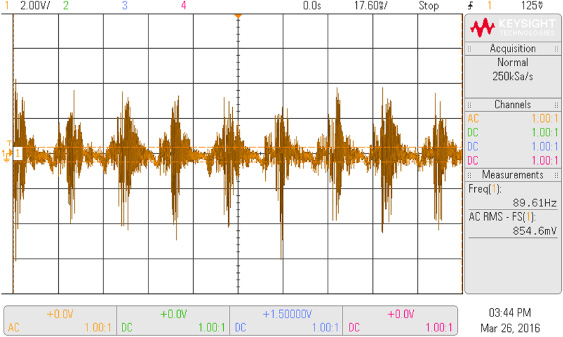
Oscilloscope measure r.m.s voltage output of 854.6 mV for vibration with frequency of 90 Hz.
Figure 11 shows the voltage signal obtained from the oscilloscope was still unstable and most wavy compared to other signals. Average voltage generated by one transducer was 1.05 V for this particular frequency 314 Hz.
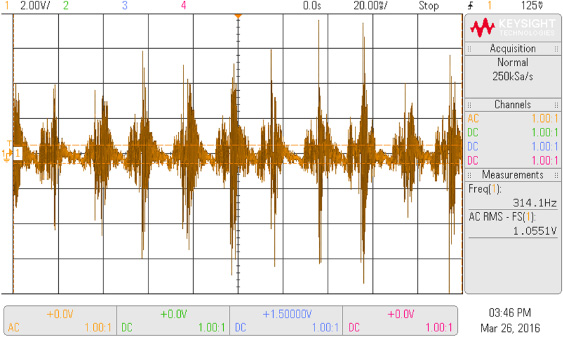
Oscilloscope measured r.m.s voltage output of 1.05 V for vibration with frequency 314 Hz.
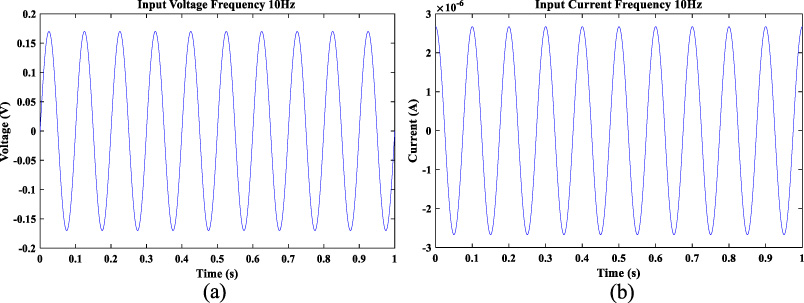
(a) Input voltage and (b) current of PSTs with frequency 10 Hz.
From the experiment, results are obtained that the root mean square of voltage output of the PSTs increases as the frequency of vibration from the vibrator increases. Thus, it could say that the frequency of vibration from sound is directly proportional to voltage output of the PSTs. When, the vibrator was turned on, the vibration is transferred to PSTs. The transducer contains piezoelectric material such as zinc oxide, which displays piezoelectric effect. Piezoelectric effect refers to ability of a material to generate electrical energy from mechanical stress on the material. In this case, the vibrator diaphragm vibrates apply mechanical stress which are same as stress exerted by sound to the six PSTs attached to it and the transducers coverts those strains into useful electrical energy.
The lowest r.m.s voltage was recorded at 170.2 mV when the frequency of vibrator was at its lowest at 10 Hz. On the other hand, the r.m.s voltage was highest at 1.05 V when the frequency of vibration was also at its highest at 314 Hz.
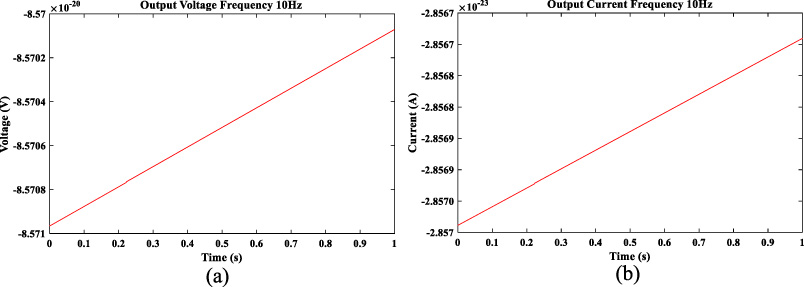
(a) Output voltage and (b) current of SEHC with frequency 10 Hz.
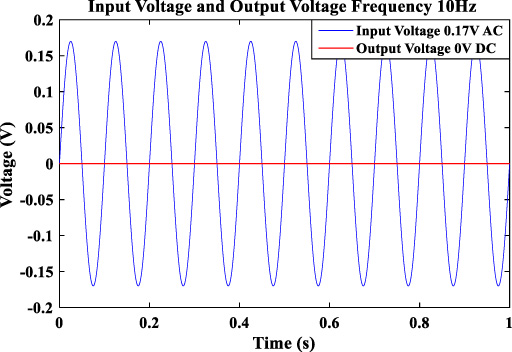
Input and output voltage of PSTs with frequency 10 Hz.
From simulation results are obtained signal wavy voltage output. The wavy signal can be divided into a lower negative cycle and upper positive cycle where the current and voltage will be in the opposite direction. The vibration from the vibrator consists of a series of compression and expansion, which is alike as the properties of sound waves. During the compression stage, the piezoelectric is pressed and stressed to release electrons, and voltage output was generated which makes up the upper positive cycle of the voltage signals. During the expansion stage, the piezoelectric was stretched and electrons are drawn into the piezoelectric in the opposite direction, creating voltage output with a lower negative cycle in voltage signals. This was how the wavy signals were formed during the experiment. The signals of voltage signals were unstable and complicated to be measured. Thus, root mean square (r.m.s) of the peak voltage generated by the transducer represents the voltage generated by the piezoelectric. From the data collected, we have found out that the r.m.s. voltage generated by the transducers were increasing with the frequency of vibration. As the vibration in frequency was increased, the total mechanical strain applied to the transducer increases tremendously. This strain caused the more electrons to be released and redraw in the piezoelectric making the voltage output also increases. The proposed SEHC has generated voltage up to 7.8 V DC and it sufficient efficiently charges a 3.7 V android battery. However, average voltage output from one transducer was only up to micro to millivolt at the highest frequency of vibration. Thus, the solution had made to overcome this problem was by adding more PSTs together to add up the r.m.s. voltage output. So far in the experiment, it had able to generate up to 1.05 V from six PSTs. Another crisis faced during the experiment was the small voltage produced by the PSTs. The solution was to boost the voltage in the circuitry that has modeled. A similar pursue was done where keyboard capacitor was used as piezoelectric material to generate electricity. In this study, AC voltage is also produced. However, the magnitude of voltage and current produced was too small to generate any electrical component or appliances compared to PSTs, which are capable to generate up to few thousand millivolts and able to charge the battery after further modification is done. Figure 12(a) and (b) shows is the simulation results of AC input voltage 0.17 V and current microampere level when the six PSTs are vibrated corresponding the sound frequency of 10 Hz.
This is the DC output voltage and current (ripple free) when the six PSTs are vibrated corresponding to the sound frequency of 10 Hz as shown in Fig. 13(a) and (b).
Figure 14 shows the input and output voltage of vibration based SEHC system model, which input voltage 0.17 V AC is generated from PSTs. From that figure, it is predicted the output voltage of 0 V corresponding to the input voltage of 0.17 V. This simulation result shows the DC voltage with no effect of voltage due to very low input voltage.
Figure 15(a) and (b) shows is the simulation results of AC input voltage 0.7 V and current microampere level when the six PSTs are vibrated corresponding to the sound frequency of 52 Hz.
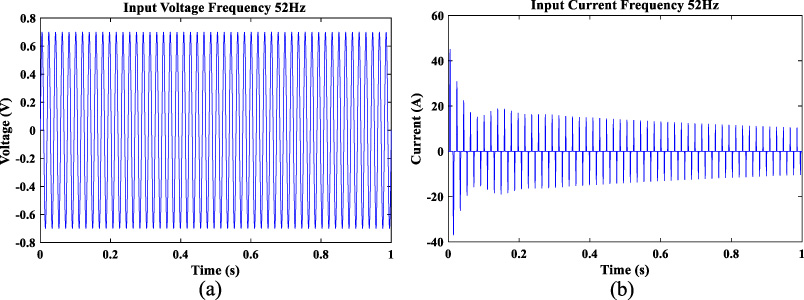
(a) Input voltage and (b) current of PSTs with frequency 52 Hz.
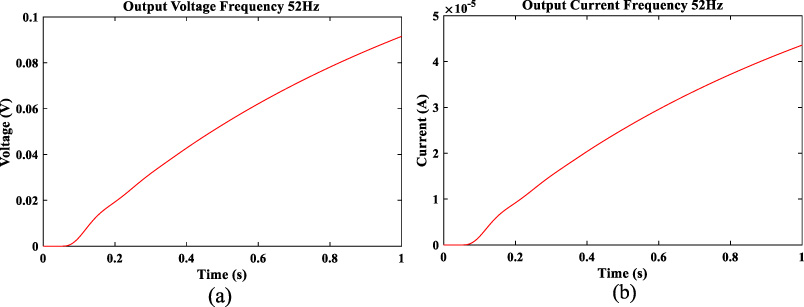
(a) Output voltage and (b) current of SEHC with frequency 52 Hz.
This is the DC output voltage 0.091 V and current microampere level (ripple free) when the six PSTs are vibrated corresponding to the sound frequency of 52 Hz as shown in Fig. 16(a) and (b).
Figure 17 shows the input and output voltage of vibration based SEHC model, which input voltage 0.7 V AC is generated from PST. From that figure, it is predicted the output voltage of 0.091 V DC without ripple corresponding to the input voltage of 0.7 V. The result represents the voltage rises gradually after every 0.187 s.
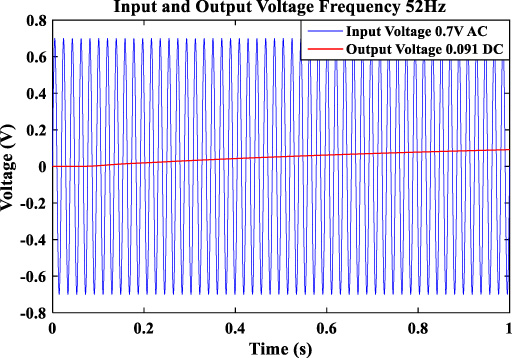
Input and output voltage of PSTs with frequency 52 Hz.
This is the AC input voltage 0.814 V and current when the six PSTs are vibrated corresponding to the sound frequency of 71 Hz as shown in Fig. 18(a) and (b).
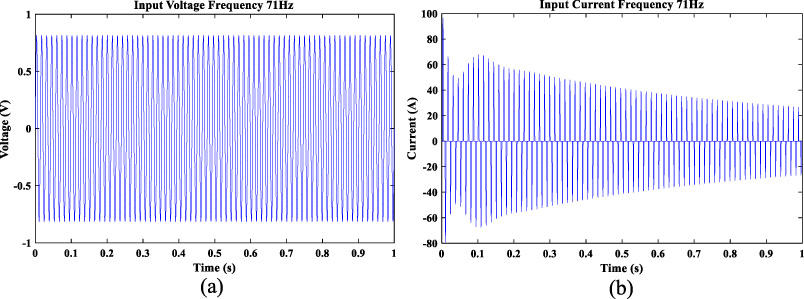
(a) Input voltage and (b) current of PSTs with frequency 71 Hz.
This is the DC output voltage 0.49 V and current microampere (ripple free and almost optimum) when the six PSTs are vibrated corresponding to the sound frequency of 71 Hz as shown in Fig. 19(a) and (b).
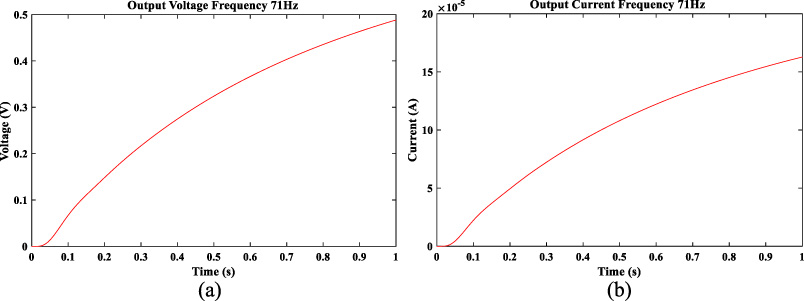
(a) Output voltage and (b) current of PSTs with frequency 71 Hz.
Figure 20 shows the input and output voltage of vibration based SEHC model, which input voltage 0.814 V AC is generated from PSTs. From that figure, it is predicted the output voltage of 0.49 V DC without ripple corresponding to the input voltage of 0.814 V. The result represents the voltage rises gradually after every 0.14 s.
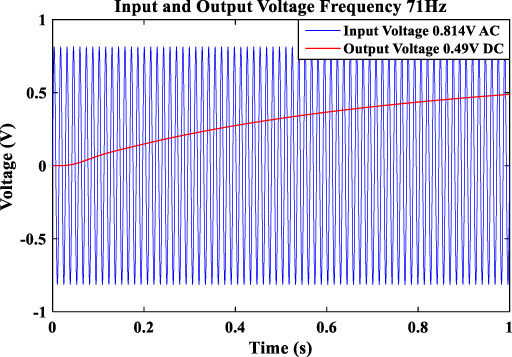
Input and output voltage of PSTs with frequency 71 Hz.
This is the AC input voltage 0.85 V and current when the six PSTs are vibrated corresponding to the sound frequency of 90 Hz as shown in Fig. 21(a) and (b).
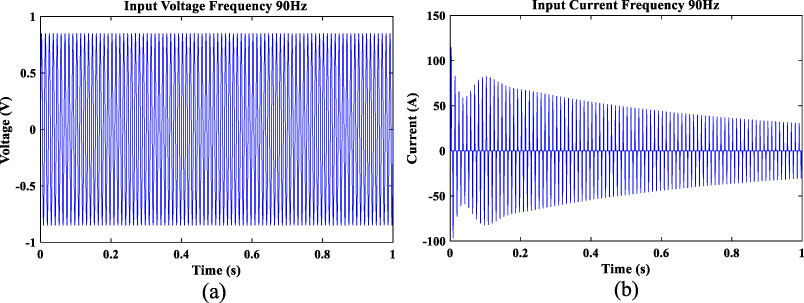
(a) Input voltage and (b) current of PSTs with frequency 90 Hz.
This is the DC output voltage 0.49 V and current microampere (ripple free and almost optimum) when the six PSTs are vibrated corresponding the sound frequency of 90 Hz as shown in Fig. 22(a) and (b).
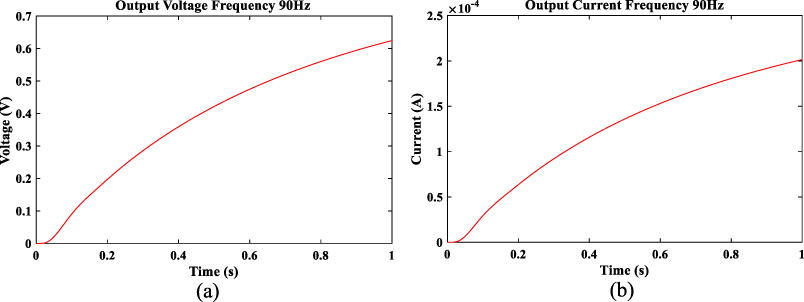
(a) Output voltage and (b) current of PSTs with frequency 90 Hz.
Figure 23 shows the input and output voltage of vibration based SEHC system model, which input voltage 0.85 V AC is generated from PST. From that figure, it is predicted the output voltage of 0.63 V DC without ripple corresponding to the input voltage of 0.85 V AC. The result represents the voltage rises gradually after every 0.13 s. The output voltage shows still very low to charge the mobile phone battery.
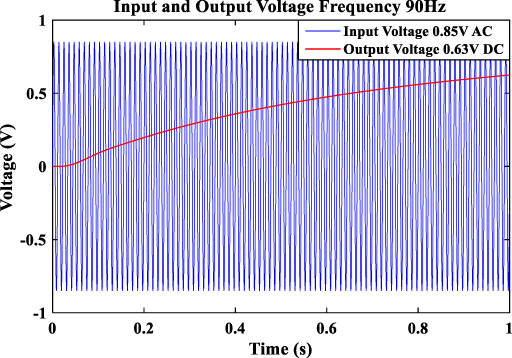
Input and output voltage of PSTs with frequency 90 Hz.
This is the AC input voltage 1.05 V and current when the six PSTs are vibrated corresponding to the sound frequency of 314 Hz as shown in Fig. 24(a) and (b).
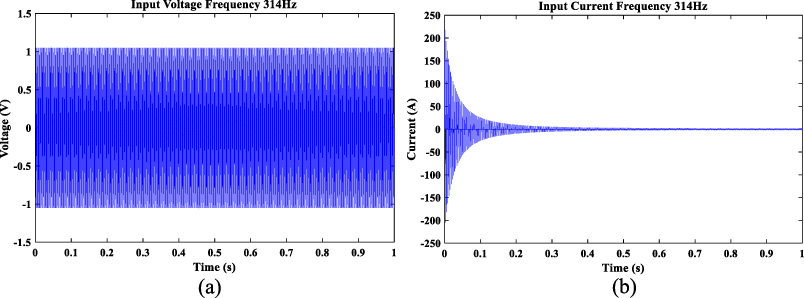
(a) Input voltage and (b) current of PSTs with frequency 314 Hz.
This is the DC output voltage and current milliampere (ripple free and optimum) when the six PSTs are vibrated corresponding to the sound frequency of 314 Hz as shown in Fig. 25(a) and Fig. 25(b).
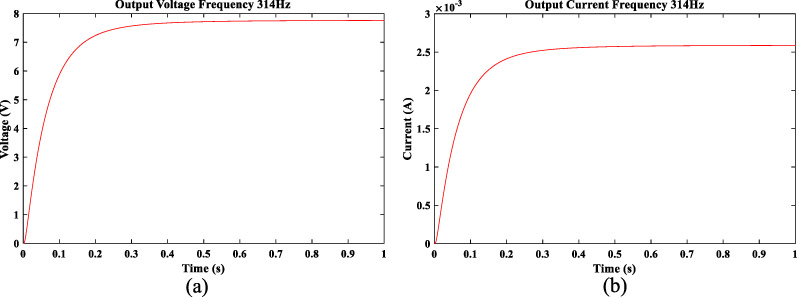
(a) Output voltage and (b) current of PSTs with frequency 314 Hz.
Figure 26 shows the input and output voltage of vibration based SEHC model, which input voltage 1.05 V AC is generated from PSTs. From that figure, it is predicted the output voltage of 7.8 V DC without ripple corresponding to the input voltage of 1.05 V AC. The result represents the voltage rises gradually after every 0.01 s and it becomes smooth with stable after 0.2 s. This is suitable voltage to charge the mobile devices such as phone battery.
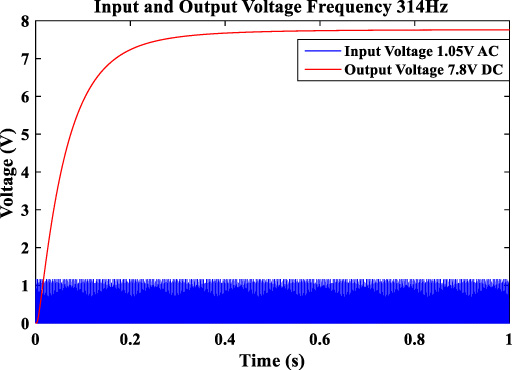
Input and output voltage of PSTs with frequency 314 Hz.
This paper attempts to show that PSTs can convert sound energy to electrical energy to charge the phones. With the input voltage AC of about 1.05 V, the voltage was boosted to obtain a larger stable output voltage of 7.8 V DC, which is large enough to charge more powerful android smartphones. Based on the results obtained, it is proven that when the frequency of sound wave increases, the input voltage produced by the PST will also increase until it reaches its peak voltage of about 1.05 V. As a result, the mobile phone can charge efficiently in a short time due to the stable output voltage. The concept of piezoelectric effect to harvest energy is properly understood and applied in this study. Further work on microphones containing piezoelectric crystals will also be done in future to improve the efficiency of the prototype built.
Footnotes
Acknowledgements
This work was supported in part by the Ministry of Higher Education, Malaysia, and in part by Universiti Kebangsaan Malaysia under Grants DIP-2018-020.