
Abstract
In order to reduce the influence of ill-posed inverse on response prediction in the situation of unknown uncorrelated multiple sources load, a response prediction method based on elastic-net regularization in the frequency domain was proposed. This method utilized the linear relationship between known responses and the unknown responses instead of the transfer function to predict the response. Moreover, the elastic-net regularization model has two regularization parameters combining l1, l2 regularization to reduce the influence of ill-posed inverse. The experiment results on the data of acoustic and vibration sources on cylindrical shells showed that the elastic-net regularization in predicting response could obtain higher accurate results compared with the method of transfer function and the method of ordinary least squares, and predict vibration response effectively and satisfy industrial requirements.
Keywords
Introduction
Excessive vibration response is one of the main causes of mechanical damage, so it is necessary to predict the vibration response accurately. Vibration response prediction could be divided into two types: frequency-domain method and time-domain method. In the frequency domain, there are two common methods to predict response: one is the finite element method, and another is based on the transfer function method. Moreover, the response prediction method based on the transfer function between load and response has been widely used [1,2]. The response prediction method may vary from each other in different structures. Yin et al. [3] put up a method to predict the response of the liquid piping system in vessels. Thormann et al. [4] put up a method for dynamic response prediction of linear frequency domain on viscous transonic flows. For metro environmental vibration, Wu et al. [5] put up a vibration prediction based on soil frequency response function in the frequency domain. The finite element method is widely used in response prediction, Somashekar et al. [6] put up a new finite element method validated by the experimental method to predict vibration response of printed circuit board.
However, all these methods above can only predict responses when multiple source loads are known. To predict response under unknown uncorrelated multi-source loads, Mao et al. [7] used the multiple-input multiple-output SVM model to identify load. Wang et al. [8] used ordinary least squares to estimate uncorrelated multiple sources load in the frequency domain. However, when the matrix’s condition number is large, the classic least-squares of the generalization method will cause ill-posed inverse, which will significantly affect the accuracy of the regression. To solve the ill-posed inverse problem, Wang et al. [9] proposed an improved Tikhonov regularization method for load identification under the condition of uncorrelated multi-sources load in the frequency domain.
Based on the above researches, a response prediction method based on elastic-net regularization in the frequency domain was proposed to solve the ill-posed inverse.
Elastic-net regularization based multi-point vibration response prediction
Problem description of response prediction
The problem solved in this paper is to predict the unknown response when the load is unknown and parts of the response are known. There are n responses classified into n1 known response points and n2 unknown response points (n1 + n2 = n). In the situation of unknown uncorrelated multiple sources load, the vibration response of the n2 unknown measurement points could be predicted by vibration response of the n1 known measurement points.
Linear relationship between known response and unknown response
In the frequency domain, when the excitations are uncorrelated and acting on the linear time-invariant system (LTI) to get multiple responses of the system, the linear relationship exists between multiple inputs and multiple outputs [9]. Vibration responses in LTI from uncorrelated multiple sources load and multiple measurement points meet the Eq. (1) [8]:
In Eq. ((1)), ω stands for frequency, S y j y j (ω) is the auto-power spectrum of response y j (j = 1, 2, 4, …, n), S f 1 f 1 (ω) is the auto-power spectrum of load source f i (i = 1, 2, 3, …, m), |Hj, i(ω)| is the frequency characteristics of the transfer function of load f i to response y j and |Hj, i(ω)| can be obtained through finite element method or experiment method.
Moreover, the linear relationship between the known responses and the unknown response existed on the LTI system in frequency domain shown as Eq. ((2)) [10].
Where
Considering the linear problem:
The theory solution of this problem is
An effective method for solving ill-posed problem is Tikhonov regularization. The aim of Tikhonov regularization is to find an approximate solution to this linear problem by solving Eq. (4) [11]:
In particular, when the penalty is
Ridge is a continuous shrinkage method, and it always keep all variables in the model, so ridge cannot produce a sparse model. Therefor when the model is complex, the computational cost of training model could be high [10].
A method called the lasso was proposed to provide a sparse solution by selecting the variable automatically [13]. The penalty of lasso is
The elastic-net regularization (EN) is a regularization method combined lasso with ridge. The naïve Elastic-net regularization is defined as Eq. (7) [11,14].
Where 𝜆1, 𝜆2 is non-negative, and 𝜆1 = ap,
EN not only can generate sparse solutions, but also have better prediction performance than lasso when there is a strong correlation among variables.
As shown in part 2.2, a linear relationship between the known responses and the unknown responses exists shown in Eq. ((8)). The linear relationship matrix
The model of elastic-net regularization in multi-point vibration response prediction can be descripted as Eq. ((10))
The optimal parameters of Elastic-net regularization are selected by the method of cross validation.
To validate the correctness and precision of EN in response prediction, EN is compared with OLS and the method of transfer functions (TF) in which the unknown responses can be predicted by transfer functions and two independent excitation sources load in this experiment. Moreover, these methods are compared in theory shown as Table 1 [9–11].
Comparison of response prediction methods
Comparison of response prediction methods
Acoustic and vibration experimental devices and data
The experimental device is a cylinder structure fixed on the vibration table by the fixture and suspended by elastic rubber rope. There are a spherical noise excitation device and a suspended vibration excitation device inside and outside the cylindrical shell, respectively. The vibration excitation device includes vibration excitation sensors, external acoustic excitation and internal vibration response sensors. The position and direction of vibration excitation of the table vibration and the external acoustic reverberation acoustic excitation are fixed in each experiment, and the sensor of the response measuring points could reflect the main vibration of the system. The layout of measurement points is shown in Fig. 1. In the experiments, two independent excitation sources and eighteen sensors to measure the vibration responses data in which data is classified into the known responses and the unknown.
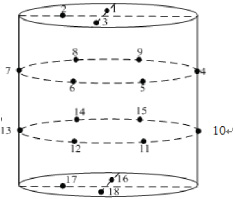
The layout of measurement points.
In this experiment, a single vibration excitation and a single reverberation room acoustic excitation were added to the device, and recording response of 18 vibration response measuring points under vibration and acoustic excitations. There were three magnitudes acoustic-only excitation and five magnitudes vibration-only excitations, so 15 magnitudes of multi-source load united excitation can be obtained totally. To satisfy the constraint of the applicable scope, we only selected data from nine response points (the nine points are on the upper part of the cylinder). In order to predict multiple responses at a time, this study set the number of known points to seven and the number of unknown points to two.
Experimental evaluation method and index
Leave-one-out (LOO) method is used for experimental verification. LOO is to leave only one sample for each test set, and the other samples for the training set. In all the fifteen pairs experiment, fourteen pairs are chosen for training and leave one pair for testing, and we need to train fifteen times and test fifteen times, finally obtain the average value of result.
3 dB relative error is to validate the correctness and precision of experiences, which is widely used in engineering practice. The 3 dB relative error is shown in Eq. ((11)):
In this study, we select 100 points from 0 to 1 for searching optimal parameter p, and as shown in Fig. 2(a), it can be seen that relatively good results can be obtained from 0.002 to 0.006. Then, we select 40 points from between 0.002 and 0.006 for searching. As shown in Fig. 2(b), the best results are got, when the parameter p is equal to 0.047. When the parameter p is fixed, the optimal parameter a is selected by the method of cross-validation at each frequency.
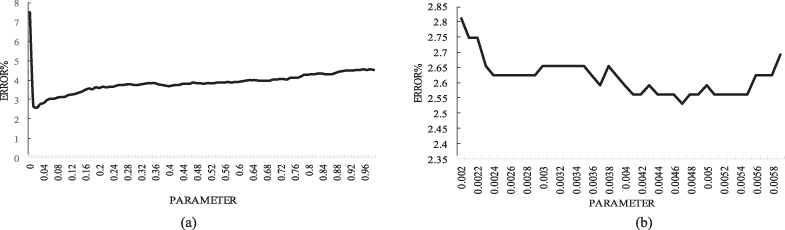
Search for optimal parameter.
To validate the correctness and precision of TF, OLS and EN, the chosen predicted response would compare with the real responses. Because there are a total of 15 pair experiment and 18 response points, for predicting one point, there are 15 ×18 = 270 conditions to compare the real responses to the predicted response, and when predicting 2 points, the cases are more. For the sake of simplicity, two points are selected in sequence to form a group as unknown responses to compare the predicted response with the real response is chosen. Table 2 shows the result of TF, OLS and EN in which each t1 and t2 combined into a group, t1 and t2 represent the unknown responses. To make it clearer, taking the first and second point as example, Fig. 3 shows EN’s the energy dB of the predict response and the real response in point 1 and 2.
The energy error over 3 dB of predicted response and real response%.
The energy error over 3 dB of predicted response and real response%.
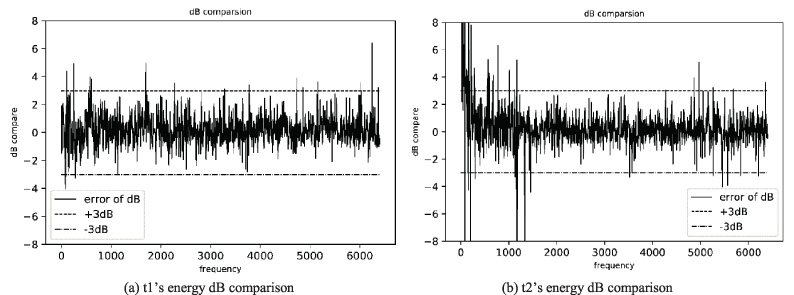
The energy dB of the predict response compared with the real response.
As shown in Table 2, EN on response prediction is applicable in the situation of unknown transfer functions. Moreover, the energy error over 3 dB of EN is better than the OLS’s and TF’s which indicate EN has a better performance in response prediction than OLS and TF because for solving ill-posed. As shown in Fig. 3, the energy dB of EN could be maintained in a good range at most frequencies, and it could satisfy the industry standard.
Conclusion
Elastic-net regularization is introduced to predict response in the frequency domain when uncorrelated multiple sources load is unknown. Moreover, without transfer functions, this method can predict the response effectively and obtain the same accuracy as the method of transfer functions even in the face of ill-posed problems.
If the load sources are correlated to each other in the frequency domain, the phase of loads and responses will be crucial. Therefor, characterizing the phase of load and correlated load sources is a further research direction in multi-source dynamic random response prediction.
Footnotes
Acknowledgements
This work was financially supported by National Natural Science Foundation of China (Grant No. 51305142, 51305143, 71571056), the General Financial Grant from the China Postdoctoral Science Foundation (Grant No: 2014M552429) project of Quanzhou science and technology plan (2017G045, 2018C110R, 2018C114R), Postgraduate Scientific Research Innovation Ability Training Plan Funding Projects of Huaqiao University (No. 1400214012).
Conflict of interest
The authors declared that they have no conflicts of interest to this work. We declare that we do not have any commercial or associative interest that represents a conflict of interest in connection with the work submitted