
Abstract
The reliability of the emergency flotation system of helicopters is analysed by using fault tree analysis and the Monte Carlo method. We constructed a fault tree with the failure of system as the top event and obtained the minimal cut set, the ranking of the structural importance of the bottom events and the probability of the occurrence of the top event. Based on the system fault tree, a Monte Carlo simulation model of the emergency flotation system is established by using Matlab/Simulink. The results show that the Monte Carlo method is feasible and effective for the reliability analysis of the emergency flotation systems of helicopters. Furthermore, the comparison between the criticality importance and mode importance of each subsystem suggests that the control component is the weakest part of the emergency flotation systems, thereby providing a basis for system reliability design and fault diagnosis.
Keywords
Introduction
The helicopter life-saving tech is important to ensure the safety of crew or passage when a helicopter in emergency, such as emergent loading, failing or damage accidence, generally, the rescue environment is classified into two categories according to different falling environments: land rescue and marine rescue. Helicopters are not watertight. After landing in the sea, they usually sink into the water within a few minutes, making it difficult for the crew to escape [1]. The emergency flotation system is one of the main life-saving equipment installed in helicopters. It helps keep helicopters afloat in the event of a water landing, ensuring adequate time for the crew to escape. However, owing to the complex sea conditions and the difficulties faced during the arrival of rescue teams, the reliability of the emergency flotation systems of helicopters is pivotal.
Therefore, to analyse the reliability of the emergency flotation systems of helicopters and determine the weak link of the system reliability, we developed a fault tree with the system failure as the top event after clarifying the relationship between the system structure and logical function, and conducted qualitative and quantitative analyses. Furthermore, based on the Fault Tree Analysis (FTA), we used the Monte Carlo (MC) method to analyse the reliability of the emergency flotation systems and determine the weak link of the system reliability.
Working principle of helicopter emergency flotation system
The emergency flotation system of a helicopter comprises three major components, i.e. a control component (S1), an inflatable component (S2) and a pontoon assembly (S3). The schematic diagram of the system is shown in Fig. 1. It can be observed that the subsystems are connected in series, hence, an emergency floatation system works only when all the subsystems function properly [2].
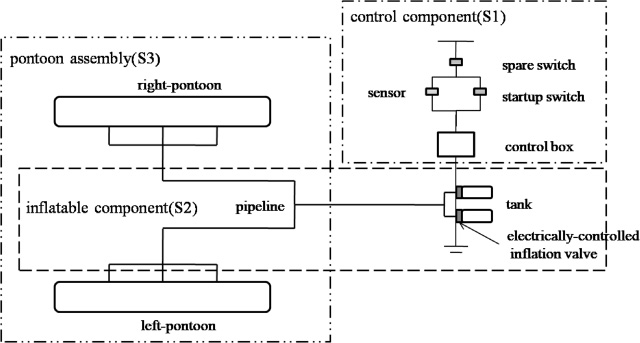
Schematic diagram of helicopter emergency flotation system.
When an emergency such as a sea crash occurs, the pilot can turn on the control switch according to the scenario to activate the airbag inflation and ignition device. Moreover, if the pilot loses his/her operational capability, the sensors in the emergency flotation system can intelligently activate the ignition device as well. When the inflatable component receives the ignition signal, air source devices I and II operate together and inflate the pontoons on both sides of the fuselage via an inflation pipeline, enabling the helicopter to float on the surface of the water, thereby obtaining time for the crew to escape.
The FTA considers an undesired fault as the top event, and determines the necessary and sufficient reasons of the top event by a strictly hierarchical logical analysis from top to bottom, thereby determining the cause or a combination of causes for the top event. Consequently, the weak link of the system is determined by ranking the importance of the bottom event [3].
The fault tree is divided into five layers, in which the total system failure is the top event. For the fault tree to correspond to the actual situation, the incorrect operation of the pilot is included in the fault tree as a bottom event. Because the pontoon cabin protects the pontoon, the failure rate of the pontoon is considered zero by default before the pontoon cabin fails. In the fault tree, the logical relationship between the pontoon cabin failure and the pontoon damage is defined as the cold spare gate. Table 1 shows the symbols and meanings of the fault tree events where X represents the bottom events. According to the fault tree, all the minimum cut sets(MCSs) are obtained by using the downlink method : {X1X2}, {X3}, {X4X6}, {X5X6}, {X7}, {X8}, {X9X11}, {X9X12}, {X10X11}, {X10X12}, {X13}, {X14}, {X15X16}, {X17}, {X18}, {X19X20}, {X21}. This fault tree has a total of seventeen MCSs, and the MCS has a maximum capacity of two bottom events. Through the number of times that the bottom event occurs in all the MCS and the combination with other bottom events, the structural importance of the bottom event is sorted as follows:
Symbols and meanings of the fault tree
Table 2 illustrates life distribution and related parameters of each component along with the relevant information [4–7], and the mission time of the emergency flotation system is t0 = 2000 h. The probability of occurrence of the top event computed by using Eq. (1) is 0.1076. The probability of failure, birnbaum reliability importance and criticality importance of each subsystem are calculated to analyse the influence of the failure of each subsystem on the top event. The calculation results are shown in Table 3.
Life distribution and related parameters of system components
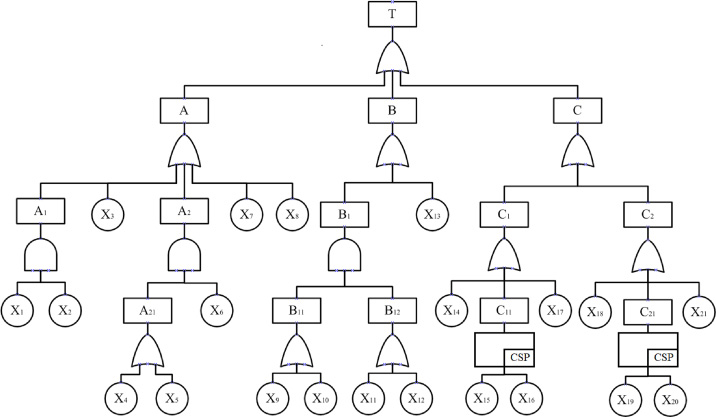
Fault tree of helicopter emergency flotation system.
Failure probability, probability importance and critical importance of subsystems
It is observed from the calculation results that, at t0, the probability of failure of each subsystem is sorted as follows as: S1 > S3 > S2. The greater the criticality importance of the subsystem, the weaker it is in the system. Decreasing the probability of failure of this subsystem significantly decreases the probability of occurrence of the top event. Table 3 identifies the priorities of the actions to be taken to implement the security controls when a top event occurs.
It is known from Table 3 that the criticality importance of the control component is the highest, approximately eleven times that of the pontoon assembly. Therefore, the failure of the control component contributes the most to the probability of occurrence of the top event. It is the weakest link of the helicopter emergency flotation system. Reliable emergency flotation systems can be developed by improving the control component or increasing the detection frequency of the control component.
The MC method plays an important role in the reliability evaluation of systems. It is an approximate calculation method based on probability and statistics theories, which can simulate the actual physical process of system fault, so the prediction results are highly consistent with the reality. According to Bernoulli’s theorem, when the sample size is sufficiently large, the probability of a random event can be estimated by the frequency of occurrence of the event in a large number of trials. In practical engineering applications, the probability of failure of the system can be obtained after several simulation sampling. On the other hand, the weaknesses of the system are determined from the mode importance of the bottom events [8].
By using MATLAB/Simulink and the system fault tree, we developed the MC simulation model of the emergency flotation system. Each bottom event is sampled by using the corresponding life distribution function as shown in Table 2. The sampling value of the failure time of the i-th base event is:
Calculation results under different simulation times.
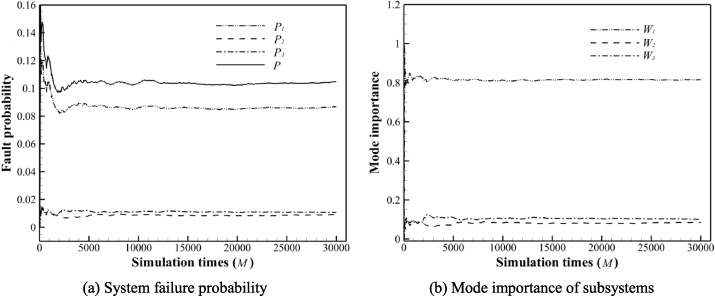
When determining the system task time, different simulation times (M) are calculated, and the result is shown in Fig. 3. It can be observed that the probability of failure of the emergency flotation system and the model importance of subsystems converge gradually with the increase in M. Considering the calculation time and data convergence, several calculations are repeated at M = 20000. The sample contains 100 sets of computational data, some of which are shown in Table 4.
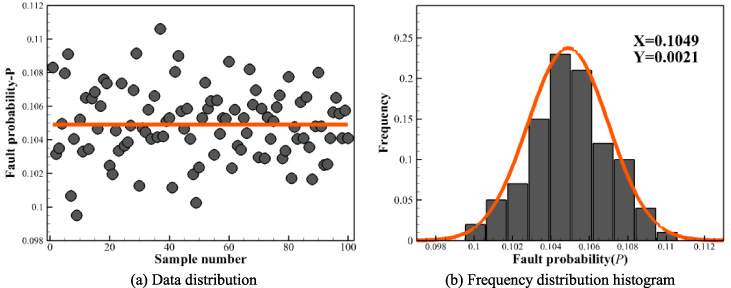
Figure 4(a) is the distribution of variable P. It can be observed that the sample points are concentrated on both sides of 0.1050. On processing the data further, the frequency distribution histogram (FDH), mean value (X), and standard deviation (Y ) of the probability of the system failure are obtained, and the variable P represents a normal distribution. Similarly, the FDH, mean value and standard deviation of the variables P1, P2, P3, W1, W2 and W3 can be obtained. As shown in Fig. 5, the data also show a normal distribution, therefore the MC method is feasible.
Sample data of variable.
Sample data
(Note: P-system failure probability, P1-control component failure probability, P2-inflated component failure probability, P3-float component failure probability, W1-control component mode importance, W2-inflated component mode importance, and W3-float assembly mode importance.)
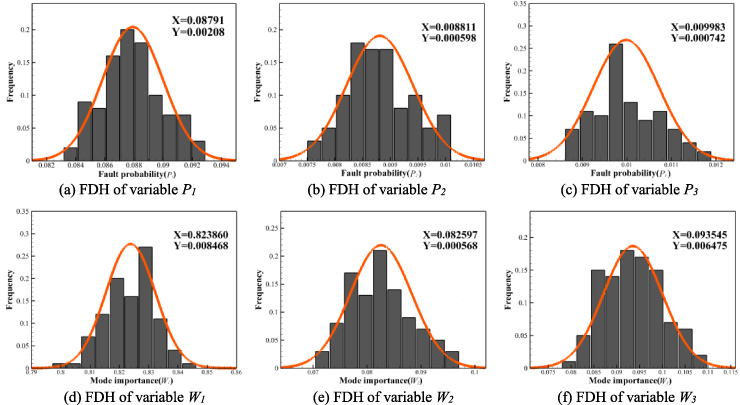
Frequency distribution histogram of variables.
On the other hand, the simulated mean probability of failure is compared with the calculated value. The results are shown in Table 5. It can be observed that the error between the probability of fault obtained by using the MC method and the actual calculation results is approximately 10−3, and the simulation accuracy will be higher with the increase in the simulation times and sample size. Therefore, it can be affirmed that the MC method is effective in the reliability analysis of the helicopter emergency flotation system.
Simulation results and errors
Furthermore, the weakness of the system reliability is judged from the mode importance. The larger the value, the weaker in the system. From the Fig. 5, we can observe that the mode importance of the control component is the maximum, which is approximately ten times that of the inflatable component. Therefore, we obtain the same conclusion as that of the FTA, i.e. the control component is the weak link of the system. Improving the control component will improve the reliability of the system.
With the help of the FTA and MC method, based on the analysis of the composition structure and logical function relationship of the helicopter emergency flotation system, we developed a fault tree with the system failure as the top event. The ranking of the structural importance of the bottom events, the probability of occurrence of the top event, and the probability of failure of each subsystem were obtained (S1 > S3 > S2). By comparing the criticality importance of each subsystem, we identified the control component is the weak link of the helicopter emergency flotation system.
On the other hand, based on the fault tree, an MC simulation model of the emergency flotation system is developed with the help of MATLAB/Simulink. When the number of simulations is 20000, the calculated data with a sample size of 100 is obtained. The feasibility and validity of the MC method are proved by combining the data distribution and average value of each variable. By comparing the mode importance of each subsystem, we identified the control component as the weak link of the system, which provides a basis for the reliability design and fault diagnosis of the helicopter emergency flotation system.