
Abstract
Conventional and low-calorie rosehip leathers were developed by several drying processes: convective and vacuum drying, both with and without a preconcentration process, and combined with a stage of microwave finish drying. The aim of this study was to reduce the processing time and to improve quality retention, in comparison with the conventional convective drying. The product temperature and moisture content as a function of time were analyzed in each case. Color and ascorbic acid content were measured in the leathers, as indexes of organoleptic and nutritional quality, respectively. Total drying times varied widely, between 120 and 870 min, while diffusion coefficients from 4.60 x10⁻¹⁰ to 52.3 x10⁻¹⁰ m2/s were fitted. The color was mostly affected by a combined time-temperature effect, while ascorbic acid retention showed a dependence on the oxygen partial pressure during drying. The concentration process carried out before drying caused no improvement on the dehydration rate of further convective or vacuum drying nor on product quality. Microwave finish drying led to the lowest processing times though it was detrimental for color and nutritional retention of leathers at an absorbed power level of about 1 W/g. Vacuum drying resulted the best option in this research, as it implied shorter processing time and higher quality retention compared with convective drying.
Nomenclature
Āscorbic acid Water activity Red-green chromatic parameter Yellow-blue chromatic parameter Convective drying Specific heat of water [J kg–1 °C–1] Chroma, color parameter Effective diffusion coefficient [m2/s] Leather thickness [m] Subscript referring to spatial position Lightness, color parameter Mass of water [kg] Microwave finish drying Superscript referring to time Preconcentration Absorbed power [W] Polydextrose-added formulation Coefficient of determination Sucrose-added formulation Time [s] Initial time [s] Initial time for the microwave finish drying stage [s] Vacuum drying Local moisture content in the diffusive model [kg water/kg dry matter] Initial moisture content [kg water/kg dry matter] Equilibrium moisture content [kg water/kg dry matter] Experimental moisture content [kg water/kg dry matter] Mean moisture content, calculated [kg water/kg dry matter] Normalized moisture content (dimensionless) Spatial coordinate for the diffusive model [m] Increase in sample temperature [°C]
Introduction
Processed food goes through several stages, undergoing numerous changes before reaching the consumer. Some of these changes are desirable and intended to define the product characteristics, but others affect negatively the product quality. Dehydrated fruits and vegetables are generally processed by hot air forced convection (hereafter “convective drying”), which is the conventional method [1]. In the way from fresh fruit to final product, some substantial quality changes usually occur during the dehydration process, with a minor impact of other stages as pre-treatments or storage. Nutritional quality in particular can be greatly affected at typical convective drying conditions. For example, in a previous study on low calorie-apple leathers [2], the retention of antioxidant capacity was less than 16% after air-drying at 50 °C for 7.25 h. Other authors [3] also measured low nutritional retention in dehydrated tomato halves, with ascorbic acid losses of 90% after 7 h of drying at 80 °C, and of 95% in a 6 h drying at 110 °C. On the other hand, an antioxidant activity retention of only 10% was reported in cranberries dehydrated for 4.5 h at 76.6 °C [4]. Therefore, alternative drying processes may be studied to improve retention of antioxidants and vitamins, as well as of general product quality.
In this work, different drying processes were applied to obtain rosehip leathers, a healthy fruit snack with potential as a functional food, as rosehip fruits are particularly rich in vitamin C. Since ascorbic acid (the main component of vitamin C) may be irreversibly degraded by an oxidative mechanism [5], we proposed to study the effect of oxygen partial pressure during drying on the quality of rosehip leathers. This was attained when comparing convective and vacuum drying processes, both carried out at 60 °C, as by reducing the total pressure in a vacuum oven, the partial pressure of oxygen is also reduced. On the other hand, application of microwaves in the final stages of drying was observed to reduce considerably the total processing times, and even improve the nutritional retention of dehydrated fruits [6–8]. Thus, combined processes are to be tested here, consisting on a convective or vacuum stage, followed by microwave finish drying. Another variant, a preconcentration process (high temperature, short time) conducted before convective or vacuum drying, was also tested. Following the hypothesis of the prevalence of the time effect over the temperature effect [9], preconcentration was expected to produce high quality formulations with lower moisture content, reducing the time required for subsequent drying and improving the nutritional retention of the final product. Besides, drying of preconcentrated samples would not be difficult to implement, since the companies producing rosehip jellies or jams could divert part of their concentrated pulp to the production of leathers. In summary, six drying processes were applied: convective drying (CD), vacuum drying (VD), convective drying after preconcentration (CD after P), vacuum drying after preconcentration (VD after P), convective drying with microwave finish drying (CD with MFD) and vacuum drying with microwave finish drying (VD with MFD). The aim of this work was to compare the processes and obtained leathers in the search of reducing processing times and improving quality retention, in comparison with the conventional convective drying.
Materials and methods
Fruit processing
Rosehip fruits (Rosa rubiginosa L., syn. Rosa eglanteria L.) were harvested in El Bolsón, Province of Río Negro, Argentina (41° 58′ 00′′ S and 71° 32′ 00′′ W). Ripe whole fruits were boiled for 30 min in an industrial cooker at atmospheric pressure (adding 0.2 kg of drinking water per kg of fresh fruit), and then processed with a pulping machine. Seeds and non-edible matter were removed by passing through a 0.5 mm sieve, obtaining a homogeneous pulp which was concentrated by evaporation to 14 °Brix. Then the pulp (average moisture content 5.85±0.02 kg water/kg dry matter; average pH 3.75±0.05) was cooled, frozen and stored at –20 °C until using.
Rosehip leather formulations
Rosehip pulp was thawed at 4 °C, homogenized and divided in two portions to prepare both a sucrose-added formulation (SAF) and a polydextrose-added formulation (PAF) as described in a previous work [10]. The SAF was developed for “conventional” rosehip leathers and its composition (g/100 g) was 77.95 fruit pulp, 21.00 sucrose, 1.00 citric acid and 0.05 sucralose. On the other hand, the PAF was devised to produce a low-calorie product and consisted on 77.92 fruit pulp, 21.00 polydextrose, 1.00 citric acid and 0.08 sucralose. An electric blender (Braun Multiquick Advantage, MR4050, 400 W, Spain) was used to homogenize the ingredients and then the formulations (mean moisture content 2.08±0.12 kg water/kg dry matter) were kept in sealed jars at 4 °C for 24 h, until processing.
General considerations
In order to obtain comparable results, sample shape and size and formulation load per drying experiment had to be the same in all the proposed drying processes. Restrictions were given by the microwave technology, for which the sample load and geometry, as well as the spatial arrangement in the oven, strongly affect the drying kinetics [11]. On these grounds, individual silicone molds were selected to contain the samples, as they resulted suitable for all the drying processes and facilitated sample distribution. Nine round based molds (muffin type) 0.051 m internal diameter were used in each drying batch. In order to obtain a finished leather 0.002 m thick, an initial thickness of 0.006 m was required, according to previously modelled data [12]. To this end, a formulation mass of 0.015 kg was weighed per mold, leading to a mean thickness of 0.00598±0.00011 m, as measured by a digital caliper. The target moisture content was 0.23 kg water/kg dry matter for sucrose-added leathers and 0.17 kg water/kg dry matter for polydextrose-added leathers, both corresponding to a water activity of 0.6. Such values were defined attending to microbiological safety (water activity below 0.7) and also to technological restrictions, related to product texture.
Convective drying (CD)
The molds with the corresponding formulations were placed in 0.20 m side stainless steel trays, to be dehydrated in a purpose-developed, automatically controlled tray dryer. The airflow was set at 60.0±0.5 °C and 2.5±0.1 m/s, conditions usually applied in the food industry [13, 14]. The initial moisture content was determined before each drying run by the AOAC method 984.25 [15] at atmospheric pressure and 105 °C up to reaching constant weight.
To construct the drying kinetics, the sample mass was measured at several times by removing the tray from the drier and weighing it on a digital balance (readability, 0.01 g; OHAUS Corporation, Inc., USA). Then the moisture content at each time was calculated by a mass balance, assuming constant dry matter in the product, and using the initial mass and moisture content. Drying was stopped as the mass corresponding to the target moisture content was attained. An additional tray with the same sample load, which was not removed for weighing, was used for recording the sample thermal history. Three of the nine molds were randomly chosen and thermocouples were fixed in them, recording product temperature as a function of time with a data logger ADQ16 2.03 (Biloba Ingeniería, Argentina). Triplicate drying curves and thermal histories were obtained for each formulation, from independent drying batches.
Vacuum drying (VD)
A vacuum oven (Arcano, China) connected to a diaphragm vacuum pump (Vacuubrand PC 500 Series –CVC 3000, Germany) was used. Pressure and temperature during drying were automatically controlled by digital systems. Formulations were dehydrated at an absolute pressure of 5 kPa, achieving a very low oxygen partial pressure, and a plate temperature of 60.0±0.5 °C, conditions usually applied in the food industry [13]. During the drying runs, vacuum was broken for a few seconds at fixed times, in order to weigh the samples for determination of moisture content as explained in 2.4. A thin aluminum tray was used to support the molds on the oven heated plate, allowing a fast, simultaneous weighing of the samples. Regarding thermal histories, thermocouples were inserted in three randomly selected molds, which were not removed for weighing. As in convective drying, moisture content and temperature curves were measured in triplicate.
Convective drying after preconcentration (CD after P)
The aim of preconcentration was to reduce as much as possible the moisture content in relation to the fresh formulations, without losing the required fluidity to be easily manipulated and self-leveled in the molds. A mass of 0.800 kg of sucrose- or polydextrose-added formulation was concentrated in a Teflon coated pan over direct flame, reaching boiling temperatures as in an industrial cooker for jams. Continuous manual stirring was applied to ensure the scraping of pan walls and bottom. The process was conducted in triplicate, for a fixed time of 22 minutes, after which moisture contents of 1.5 kg water/kg dry matter in the SAF and of 1.4 kg water/kg dry matter in the PAF were reached (the initial moisture content was given in 2.2). The moisture loss was not recorded during preconcentration because the process was short to be accurately sampled. However, as the temperature effect is indeed relevant, the product thermal history was measured, fixing a thermocouple so as to be covered by product without contacting the walls or bottom of the pan. Once the process was finished, the preconcentrated formulations were kept at 4 °C until the next day, to be convectively dried. Then, the experimental procedure already described in 2.4 was applied, using the same initial load per batch, but starting with a preconcentrated sample of lower moisture content.
Vacuum drying after Preconcentration (VD after P)
Formulations were preconcentrated as explained in 2.6 then vacuum dried, following the experimental procedure detailed in 2.5.
Convective drying with Microwave finish drying (CD with MFD)
For this combined process, the samples were dehydrated by convection for a fixed time of 60 min, then removed from the tray dryer and placed into the microwave oven to continue drying. During the convective drying stage, the moisture content and thermal histories were recorded as described in 2.4. The fixed duration of this first stage was determined based on a kinetic criterion, according to the objective of reducing the total drying time: it was considered that the beginning of the case hardening in the samples was a limiting factor for the drying rate, therefore, it was the point recommended for microwave application [16]. In the rosehip formulations, case hardening occurred after a 30% reduction of the initial drying rate was reached. Then, the convective stage was restricted to 60 min, time for which the instantaneous drying rate was 70% of the initial. Other authors working with high soluble solids matrices [6, 8] have limited the first drying stage to similar moisture contents, on comparable grounds as those described here.
The microwave final stage was carried out in a BGH Quick Chef microwave oven (Model B330DSS, BGH S.A. Argentina) with diverse heating programs, a built in forced convection system and a turntable plate. The original electric circuit was modified using a variable autotransformer (220 Volts in, 0–250 Volts out, max. current 8 A; El Toroide, Argentina), allowing the magnetron output power to be selected within a continuous scale, through a very smooth control of output voltage. To ensure the uniform treatment of the samples, the nine molds with convectively, partially dried formulation were placed forming a ring on the turntable plate (at equal distance from the center) and all operating times were set to correspond to an integer number of turns of the plate, allowing each mold to cover all possible positions in the oven cavity at least one time. The experiments were carried out in the 50% pulsed mode, consisting of pulses of 15 s on/15 s off, applying a voltage of 170 Volts with forced convection. Under these operating conditions, previous experiments were carried out with 135 g of distilled water distributed in 9 molds, just like in the samples, which absorbed 138.60±4.67 Watts. This absorbed power was calculated as P abs = m C p ΔT t–1 being m the mass of water [kg], C p the specific heat of water [J kg–1 °C–1], ΔT the increase in water temperature [°C] and t the extent of time along which the power was applied [s]. Then a power density of 138.60 W/135 g water, near to 1 W/g water, was the result. Similar values of specific power are usually reported in microwave drying of foodstuffs [7, 17].
The method of interrupting the drying run to weigh the samples and then continue drying was not applied for the microwave oven, since abrupt changes in the sample temperature occur, affecting the subsequent thermal history. Therefore, data corresponding to different drying times were obtained from independent runs of different durations. At the end of each run, the plate was removed from the oven to weigh the samples, and reloaded with convectively dried formulation for starting another run. To avoid the introduction of thermocouples in the microwave oven cavity, a supporting frame was constructed and conveniently located near the microwave oven, with three thermocouples fixed on it. This allowed a quick measurement of the product temperature in three random molds at the moment of removing the plate, immediately before weighing the samples.
Vacuum drying with microwave finish drying (VD with MFD)
The formulations were vacuum-dried for a fixed time of 40 min. Then samples were removed from the vacuum oven and placed into the microwave oven to continue drying. Mass transfer kinetics and thermal history during the first drying stage were recorded as described in 2.5. The fixed time of 40 min for the vacuum drying was determined upon the criterion already defined in 2.8. Data collected during the microwave drying stage followed the method detailed in 2.8.
Physical characterization of leathers: Moisture content, water activity and thickness
The leathers obtained in each drying batch were randomly sampled to be analyzed in order to observe deviations from the target moisture content, water activity and thickness. Experimental moisture content (W exp ) was determined in triplicate using a Mettler LP 16 moisture analyzer at 105 °C until reaching constant weight, according to the AOAC method 984.25 [15]. The water activity (a w ) was measured in triplicate at 25 °C by the hygrometric method AOAC 978.18 [15], in an AquaLab 4TEV equipment with temperature control (METER Group, Inc.). Concerning the thickness of leathers, 10 measurements were made in different sample portions, with a digital caliper (resolution: 0.01 mm, GeoTech, P.R.C.).
Mathematical modelling and fitting method for the drying kinetics
With a comparative purpose, a diffusive drying mechanism, characterized by an effective diffusion coefficient D, was assumed for all the processes. Then, the local moisture content in the leathers W was defined by Equation (1) as a function of time t and the spatial coordinate x.
For the combined processes CD with MFD and VD with MFD, the model was applied first to the 60 min convective stage and the 40 min vacuum stage, and then to the MFD stage. The initial and boundary conditions to solve the differential equation (Equation (1)), are the following:
The equilibrium moisture content W
e
was assumed to be cero for microwave finish drying stages and for vacuum conditions (VD, VD after P and VD stage previous to MFD). In the case of convective conditions (CD, CD after P and CD stage previous to MFD), W
e
was calculated as the moisture content in equilibrium with the drying air, using the GAB model previously fitted for the sorption isotherm of each rosehip formulation at 60 °C [18]. The mathematical model described by Equations (1–4) was solved using the fully implicit finite difference method [19]. Hereafter, subscript i refers to spatial position (50 nodes) and superscript n refers to time, considering the following discretization of the independent variables: x = (i-1) Δx, and t = (n-1) Δt
Defining
So the general equation for the intermediate nodes, i = 2 to I-1 is:
The equation for the leather bottom, i = 1, resulted:
According to the boundary condition at the leather bottom (Equation (3)):
Replacing
Finally, the equation for the leather surface, i = I, is of the Dirichlet type:
The mean moisture content of the leather at any time,
which is the value that can be compared with experimental data, not only to test model behavior but also to determine the effective diffusion coefficient.
Five replicates of the instrumental color of formulations and leathers obtained from all drying processes were measured by a Konica Minolta CR-400 colorimeter (Osaka, Japan). Determinations were carried out by placing the samples on a matt white surface. The parameters L*, a* and b* of the CIELAB space were recorded, and parameter Chroma C* = (a*2 + b*2)1/2 was calculated. Additionally, photographs were taken to observe the general appearance of the formulations and finished products, using a digital camera (Sony Cyber-shot DSC-W80, 7.2 mega pixels).
Determination of ascorbic acid content in leathers
Ascorbic acid (AA) was measured in triplicate by HPLC using a protocol adapted from previous work [20, 21]. The analyte was extracted by adding 0.5 g of sample in 2.5 ml of 5% (w/v) metaphosphoric acid (HPO3) solution. The dispersion was centrifuged at 4 °C and 15000 rpm for 15 min to recover the supernatant. Analysis were carried out in an Optimal ODS-H column (250×4.6 mm) coupled with a RP C18 guard column (20×4.6 mm), both from Capital HPLC Ltd (UK), along with a UV-Visible detector (detection wavelength: 245 nm). The mobile phase consisted of a mixture of 0.5% (w/v) metaphosphoric acid and acetonitrile, in a ratio of 93 : 7, respectively. An isocratic elution was carried out at 25 °C with a flow rate of 1 ml/min, the injection volume being 20μl. The calibration curve was prepared using HPLC-grade L-ascorbic acid (C6H8O6) dissolved in the mobile phase. Results were expressed as mg AA/g dry matter. Then, retention of ascorbic acid in the leathers was calculated in relation to the initial AA concentration, in the respective formulation.
Experimental design and statistical analysis
Data was analyzed using the Origin software [22]. For the comparison of modelled drying curves, the F-test for datasets comparison (function fitcmpdata) was applied (α= 0.05). For the analysis of the leather characteristics, a two-factor design with interaction was arranged, so two-way ANOVAs were performed to assess the effect of formulations and drying processes (and interactions of both) on the moisture content, water activity, thickness, color parameters and ascorbic acid retention. In order to compare the mean values, the Tukey test was used (α= 0.05).
Results and discussion
Physical characterization
All the drying processes applied here led to flexible pectic gels, whose characteristics agreed in general with those expected for the product, according to previous work from our laboratory and of other authors [23, 24]. Although the final moisture content, water activity and thickness were specified beforehand, it was considered important to measure them by official methods, in order to estimate their variability due to the processes or formulation. The final moisture content was not affected by the drying process (p = 0.138) but differed significantly between formulations (p < 0.001), as expected, being its mean value 0.233±0.012 kg water/kg dry matter in the product added with sucrose and 0.171±0.011 kg water/kg dry matter in the polydextrose-added leather. Regarding the water activity, its average value was 0.582±0.019 for all the leathers, with no significant effect of the process or formulation (p = 0.396). The thickness was also uniform (p > 0.05) and its mean value was 2.03±0.17 mm for all leathers.
Experimental drying curves and results of modelling
Experimental drying curves along with the models for every process in both formulations are illustrated in Figs. 1 and 2, were the normalized moisture content W n = W m /W0 is plotted as a function of time. Normalized values corresponding to the target moisture content of leathers were 0.11 for SAF and 0.08 for PAF. The curves produced by the various drying processes were clearly different and the processing times varied in a considerable range, between 120 and 870 min, depending on the process (p < 0.001), not on the formulation (p = 0.212), as verified by a two-way ANOVA. Processes involving microwave finish drying were the fastest (α= 0.05), as expected [6, 8]. The finish microwave stage used after convection and vacuum drying reduced the total processing times to less than a half compared with convective and vacuum drying alone, respectively. On the other hand, preconcentration had a negative effect on subsequent drying, being the time required for CD after P and VD after P higher than for CD and VD, respectively (α= 0.05). Table 1 shows the fitted values of the effective diffusion coefficient D (m2/s) for every formulation and drying process. The fit was good, in general, with coefficients of determination r2 higher than 0.9. Although the processing time was not affected by formulations, when the whole drying curves were compared through the kinetic model, differences between D values of SAF and PAF were found (p < 0.05). However, such differences were only observed during the MFD stages and were not consistent, not always in the same direction (D was lower for SAF during MFD stage after CD stage, whereas it was lower for PAF during MFD stage after VD stage, see Table 1). So such differences were assumed to be caused by deviations in the thermal histories (see next Section). The diffusion coefficients reflected the negative effect of preconcentration, being D values for CD and VD higher than the corresponding values after P.

Experimental (symbols) and predicted (lines) normalized moisture content (W
n
= W
m
/W0) as a function of time, for every drying process applied to the sucrose-added formulation. CD (•—-), CD after P (♦- - -), CD with MFD (▴⋯ ·), VD (), VD after P ( ), VD with MFD (
 ).
).
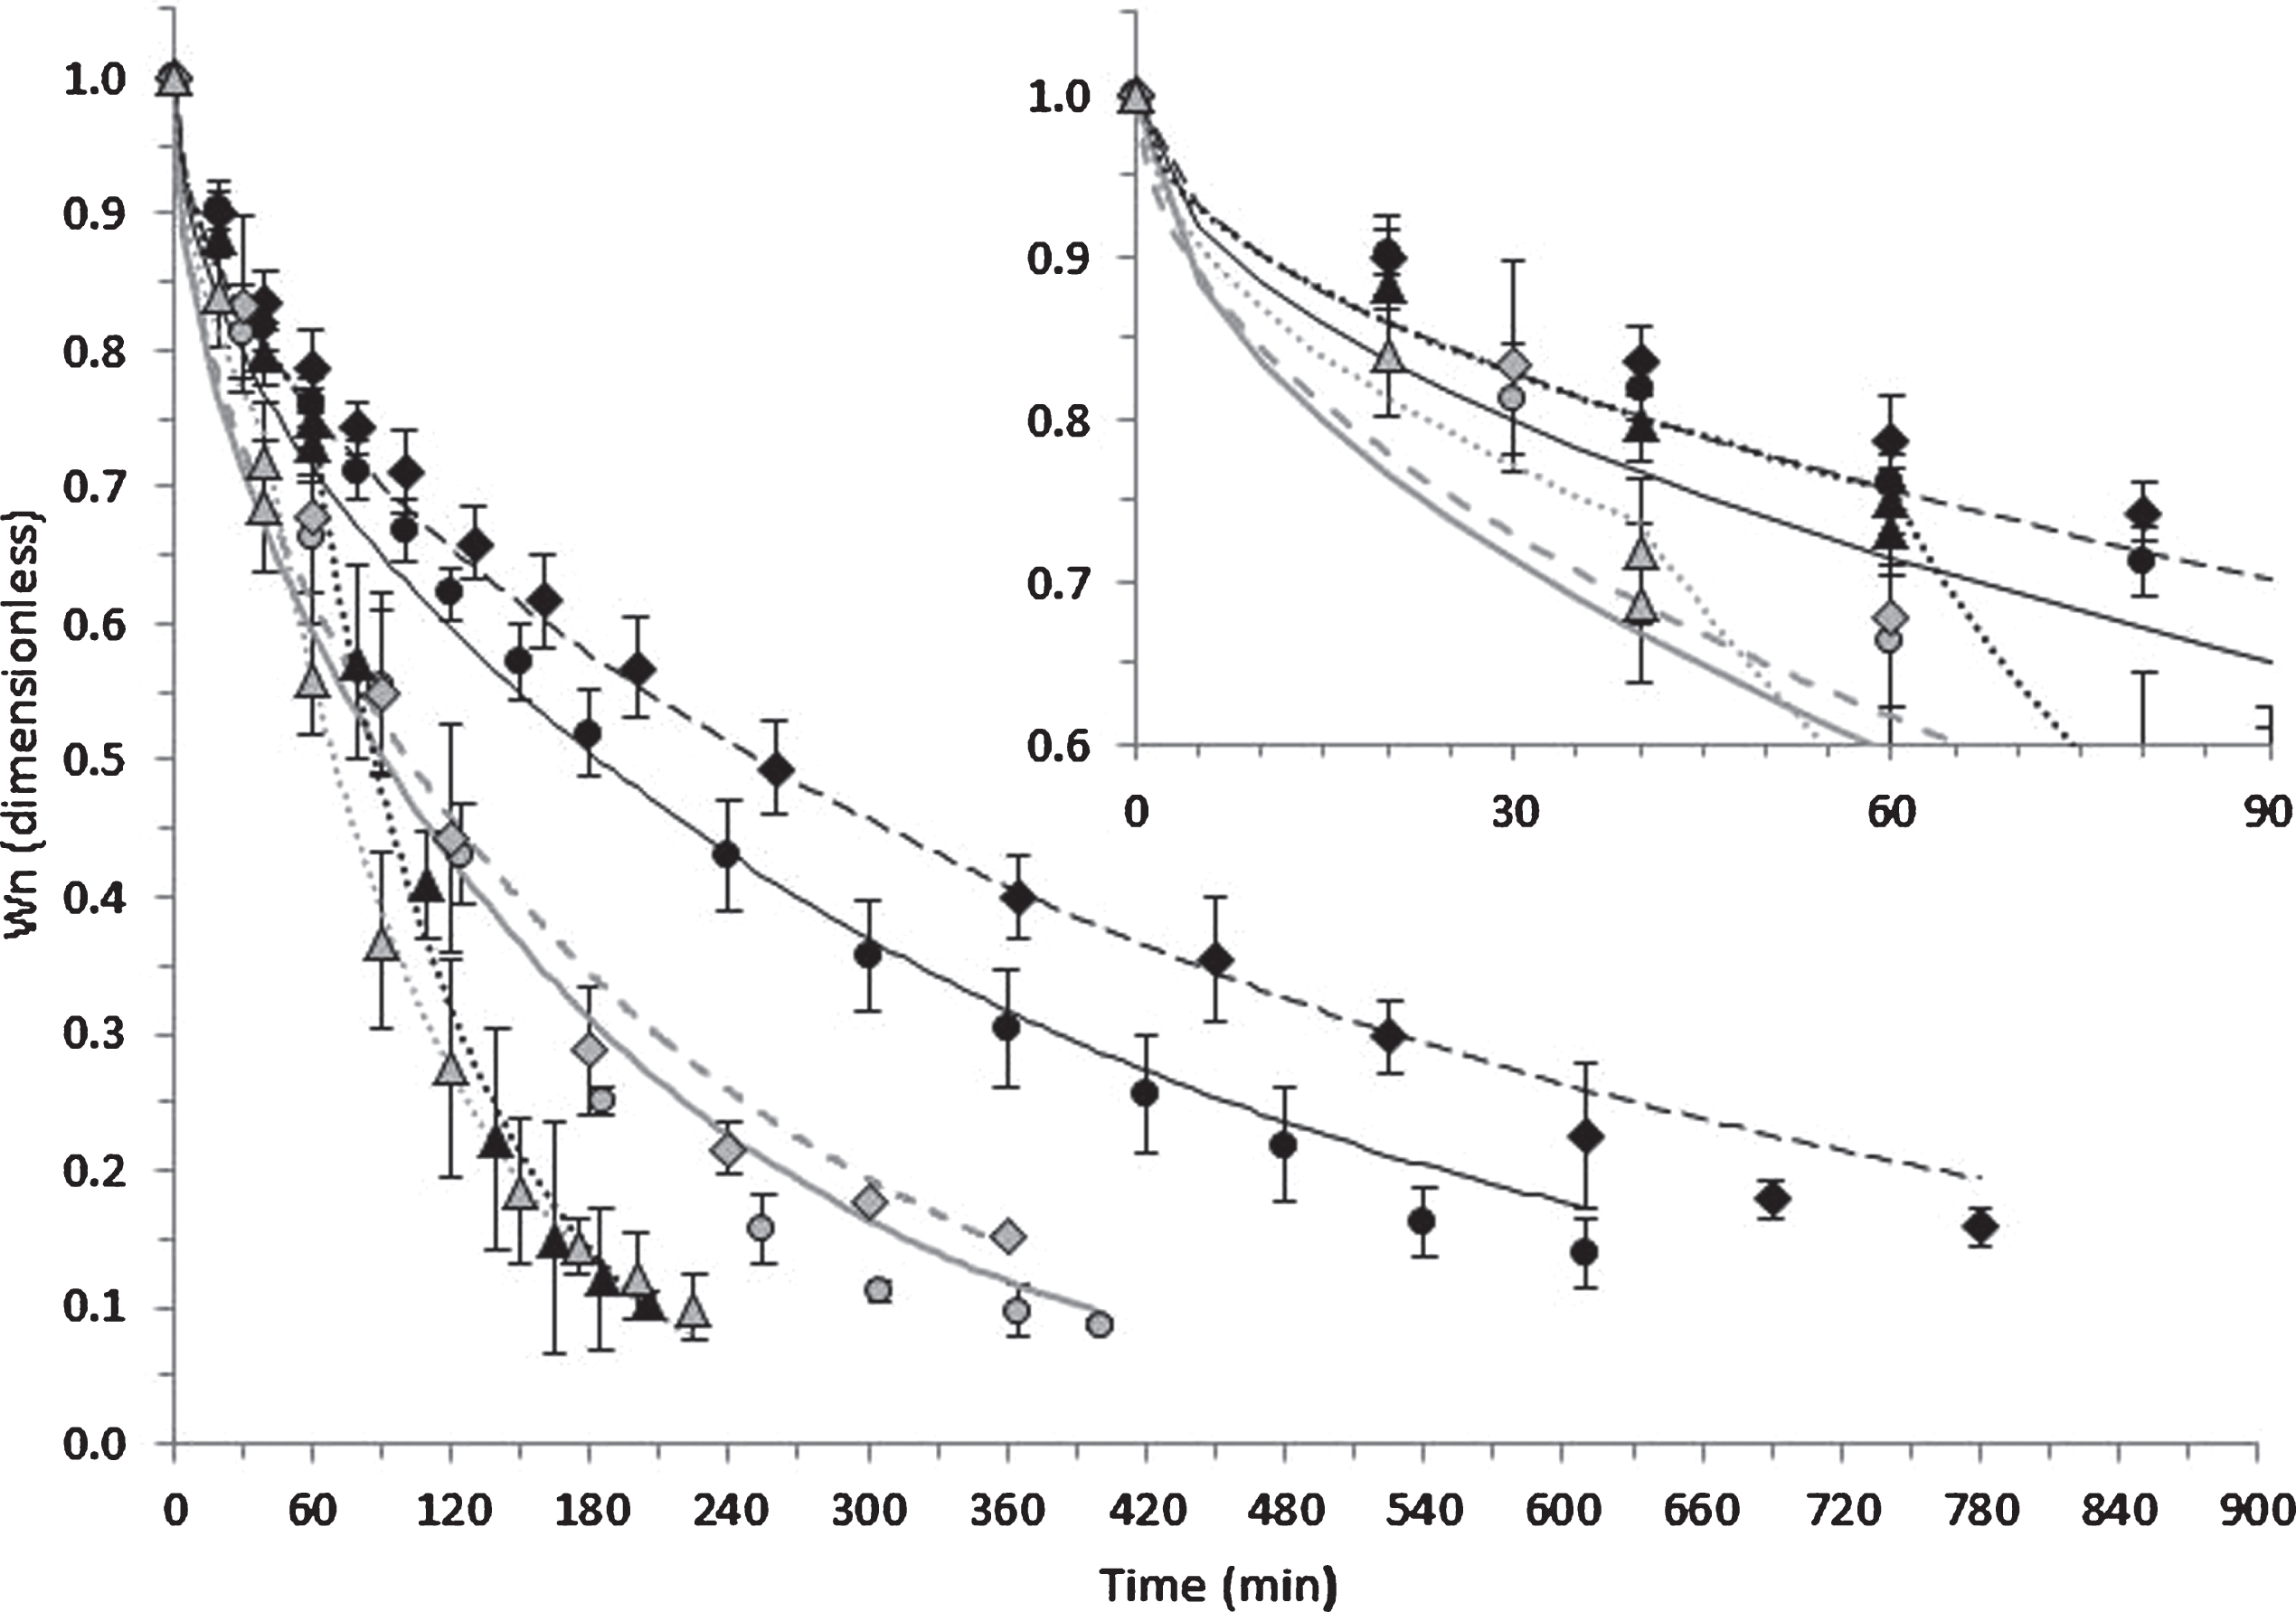
Experimental (symbols) and predicted (lines) normalized moisture content (W n = W m /W0) as a function of time, for every drying process applied to the polydextrose-added formulation. CD (•—-), CD after P (♦- - -), CD with MFD (▴⋯ ·), VD (), VD after P (), VD with MFD ().
Fitted values of the effective diffusion coefficient D (m2/s) for every formulation and drying process. Coefficients of determination r2 are given in parenthesis
The thermal histories of samples are shown in Fig. 3. The highest product temperatures were observed during microwave finish drying and this explains why CD with MFD and VD with MFD were fastest. Thermal histories for samples processed with microwave finish drying were more complex and variable, because the microwave oven lacked a product temperature control system, so it was hard to obtain reproducible data. Moreover, the applied power pulses were not short enough to avoid product overheating. Samples were also exposed to high temperatures during preconcentration, although for a considerably shorter time. The thermal histories for convection and vacuum drying were not affected by preconcentration. The highest temperatures reached in CD and VD were not the same, because heat transfer is more intense in convection than under vacuum at the same nominal drying temperature. In convective drying, the air drying temperature set at 60 °C was reached in practice by the product, while in vacuum conditions samples attained 56 °C after some 200 min.

Thermal histories for SAF () and PAF ( ) during the studied processes. Data for preconcentration (P) are also shown. Vertical dotted lines in CD with MFD and VD with MFD correspond to the beginning of the microwave finish drying.
Figure 4 shows the appearance of formulations and leathers, where different surface textures can be appreciated. The color parameters L*, a* and b* measured on the leathers were averaged for each drying process, as no difference was found between formulations (p > 0.05). The mean values are shown and compared in Table 2. The effect of the drying process on lightness (L*) was not easy to explain. Although the samples exposed to microwave finish drying were visually darker (see Fig. 4), their L* was not the lowest. Even the L* of fresh formulations (32.48±0.68) was significantly lower than those of all leathers (p < 0.05). This means that L* was not an adequate parameter to represent the color changes in rosehip leathers. The partially reflective surface of the products may have led to very similar values of L*, even for samples that are visually perceived as darker [25]. In this case, the instrumental color variation was not manifested as a loss of lightness, but as a chromaticity loss. The mean values of a*, b* and C* obtained for the formulations were 20.23, 19.80 and 28.31 respectively. These values were significantly decreased by all the drying processes, especially by those in which higher temperatures were involved: the chromatic parameters were significantly lower (p < 0.05) in leathers experimenting preconcentration or microwave finish drying, than in those obtained by convective or vacuum drying. Samples became in general less red and less yellow, possibly corresponding to a loss of fruit pigments, mainly γ-carotene, lycopene and anthocyanins, which are sensitive to heat [26]. Besides, the darkening observed visually can be related to Maillard reaction [27] and even products of caramelization of sucrose and polydextrose.
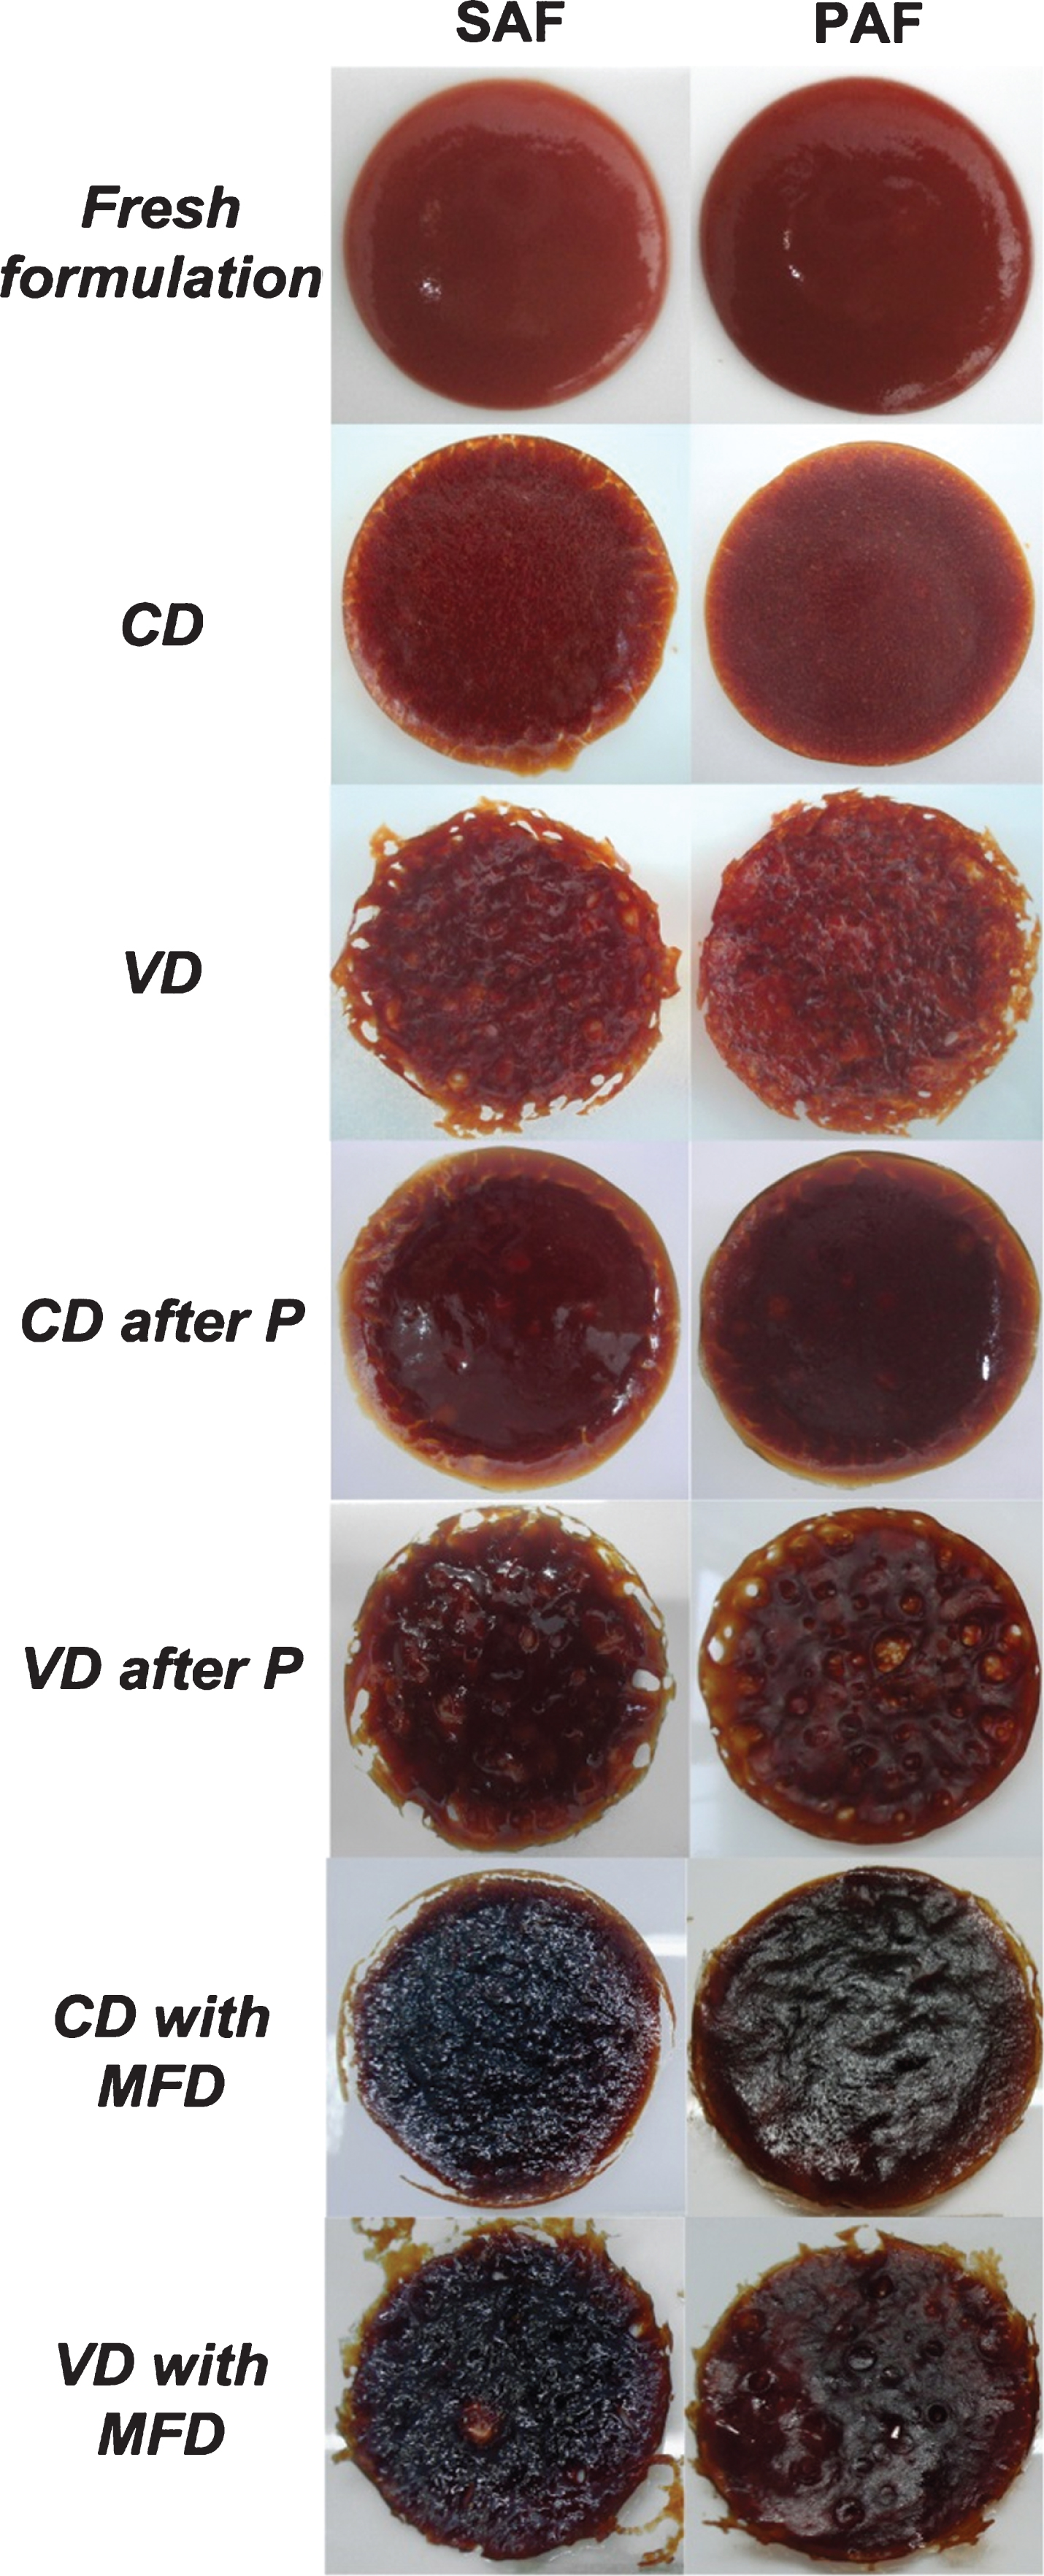
Photographs of the formulations and leathers obtained by the studied drying processes.
Mean values (n = 10) of the color parameters measured on the leathers obtained by all drying processes. Different superscripts in the same column indicate significantly different values (α= 0.05)
Concerning nutritional quality, the retention of ascorbic acid in leathers was evaluated, expressed as a fraction of the initial concentration, which was about 3.5±0.2 mg AA/g dry matter for both formulations (mean value of 20 batches prepared for the trials in this work). The mean values of AA retention for both formulations after each drying process can be seen in Fig. 5. According to the analysis of variance, the process explained 96% of the data variability, while the formulation explained less than 1%, so nutritional retention was affected by the drying process, with no considerable effect of the formulations. The effect of oxygen was evidenced in both formulations, by a higher retention in vacuum drying (VD) with respect to the convective process (CD) at the same temperature (α= 0.05). The same was observed for preconcentrated products, as VD after P showed higher retention than CD after P. On the contrary, this effect was not observed when comparing CD with MFD and VD with MFD, because most of the nutritional loss is caused by the final microwave stage. In fact, AA retention in the respective first stages were not significantly different (p < 0.05), being 0.8490±0.0842 for 60 min of CD and 0.8497±0.0740 for 40 min of VD. After the microwave finish drying, AA retention dropped to around 0.15 in both cases. Hence, the shorter total processing time achieved with the microwave finish drying could not compensate for the thermal damage caused by the high temperatures. Preconcentration, which also involved high temperatures, did not affect the final retention in any case, that is, there were no differences (p > 0.05) between CD and CD after P nor between VD and VD after P. This can be explained by the short preconcentration time, only 22 min, allowing the compensation of the time and temperature effects on the nutritional quality. After the preconcentration process AA retention in both formulations was 0.9355±0.0386.
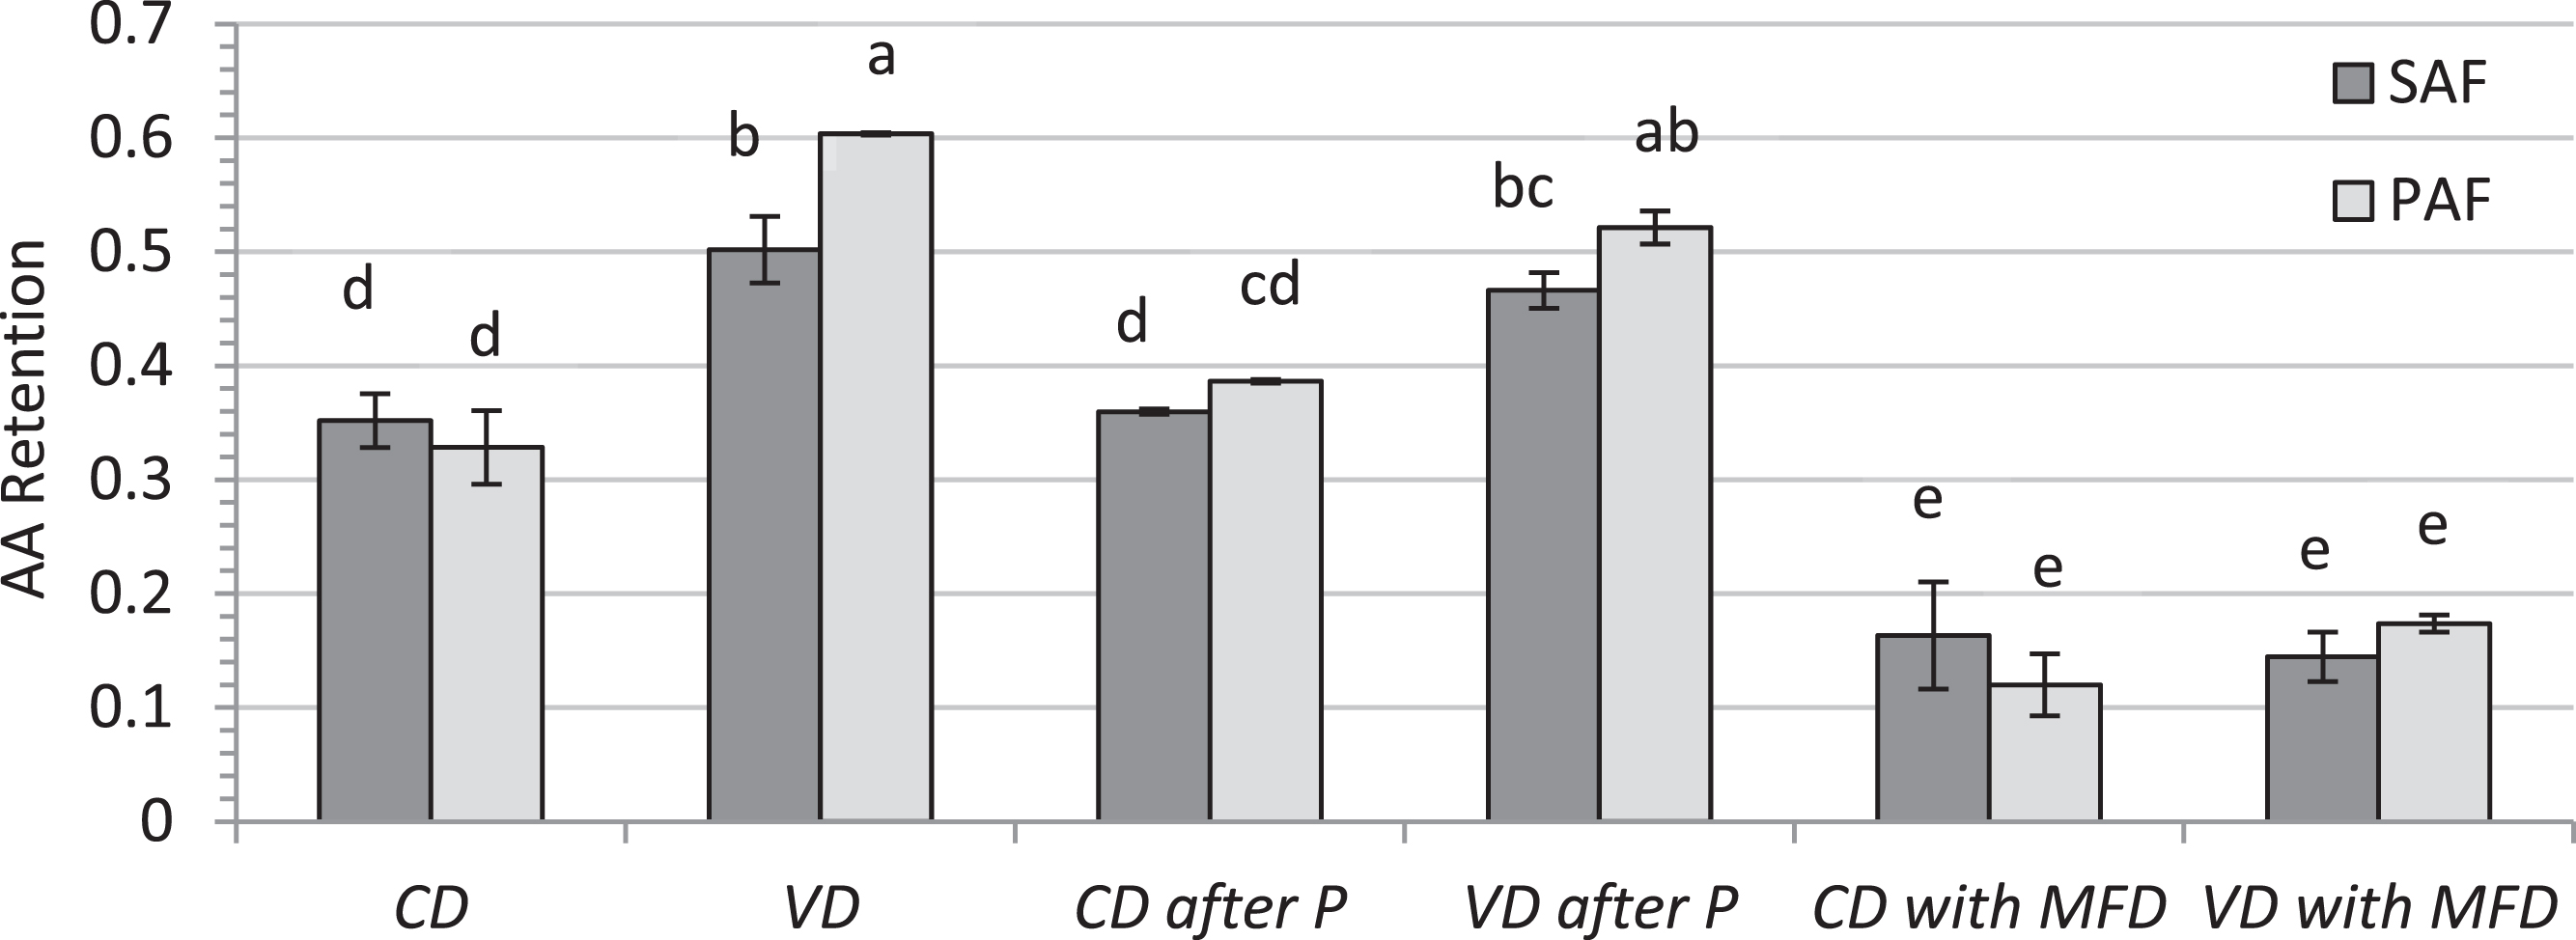
Mean ascorbic acid retention in both formulations after each drying process (n = 3). Different letters indicate significantly different values (α= 0.05).
Regarding organoleptic quality (Chroma), no significant effect of the oxygen partial pressure (convective vs vacuum conditions) was observed. However, Chroma was more affected in samples exposed to higher temperatures, as the microwave finish dried and those preconcentrated, even when the preconcentration time was very short. On the other hand, nutritional quality (ascorbic acid retention) was clearly dependent on oxygen partial pressure, at least while the temperature effect was restricted, i.e. when drying at 60 °C or after preconcentration, when the effect of short time prevailed over that of high temperature. During microwave finish drying, the effect of the high temperatures involved for a relatively long time, prevailed over that of the oxygen partial pressure, leading to the lowest ascorbic acid retention. So, in general lines, vacuum conditions and moderate temperatures could be the keys for a high quality product.
Conclusion
Six drying processes for making rosehip leathers were devised based on different technologies and their combinations. They were applied on sucrose and polydextrose matrixes which showed, in general, the same behavior. Formulations did not affect the drying kinetics, neither the quality of the obtained leathers, so the conclusions expressed here are valid for conventional and low-calorie products.
The use of vacuum drying showed two advantages over convective drying: shorter processing time and higher quality retention (higher Chroma and higher ascorbic acid retention).
As it resulted the best option between those tested, this could encourage further research on the way to the development of a healthy snack, with potential functional properties.
In spite of the amount of water evaporated during preconcentration, no total processing time reductions were possible in the subsequent drying and the quality retention was not improved either.
Microwave finish drying was very effective to shorten processing times, although the difficulties experienced to control product temperatures caused the highest quality losses, negatively affecting product color and ascorbic acid retention. Further research is being planned for the microwave finish drying aimed at using lower power densities to avoid sample overheating.
Conflict of interest
The authors have no conflict of interest to report.
Footnotes
Acknowledgments
Authors express their gratitude to Comisión de Investigaciones Científicas CICPBA, CONICET, Universidad Nacional de La Plata and Agencia Nacional de Promoción Científica y Tecnológica for support and funding provided for this research, and also to the colleague Antonio De Michelis for providing the rosehip pulp.