
Abstract
To build the design method of new energy-saving block & invisible multi-ribbed frame composite walls developed by our research team, taking window and door openings of various dimensions as the parameters of the experimental study, six 1/2 scaled energy-saving block & invisible multi-ribbed frame composite wall specimens were made. The cyclic loading tests on specimens were performed. The failure characteristic, hysteretic behavior, ductility, energy dissipation capacity and stiffness degradation were investigated. The test results show that as window and door openings increase, integrity of the wall weaken, causing bearing capacity of the wall to decline, degrading the stiffness more slowly after yield, the limit displacement to be bigger, ductility to be good, energy dissipation capacity increased. The above results indicated that to rigid walls, when the bearing capacity does not decrease obviously, with appropriated opening, the seismic behavior of the wall can be greatly improved. Based on the analysis and comparison of test data, deformation limit of the wall under different performance objectives are determined, which provides the basis for the establishment of design method of the wall.
Keywords
Introduction
As one of series research of our project team, this paper studied the hysteretic behavior, ductility, stiffness degradation, energy dissipation capacity and other seismic behavior of the energy-saving block & invisible multi-ribbed frame composite walls under different sizes of openings. Many domestic and overseas scholars have studied the seismic performance of other walls under different sizes of openings. Wu et al. [1] made a seismic performance test of four full-size concrete frame restricted and transverse opening interlocked block dry-laid wall under the action of constant vertical loads and horizontal low cyclic loads, and analyzed the influence of window opening on the seismic performance of wall. The test results indicate that the window opening reduces the initial cracking load, the ultimate load and stiffness of the walls. Chang et al. [2] studied the influence of the opening position and size of multi-ribbed composite wall, and figured out the lateral stiffness of the multi-ribbed composite wall with opening by introducing the opening reduction coefficient. Jia et al. [3]discussed the influence of the changed size and position of opening on the seismic performance of wall on basis of ANSYS, a finite element analytical model. Wu et al. [4] made a horizontal low cyclic load test of seven external prestressing rough-dressed stone masonry walls and studied the influence of window openings and other parameters on the stress process, failure mode, shear bearing capacity and hysteretic curve of the walls. Zhang et al. [5] built a finite element model of masonry wall based on ABAQUS, and verified the established numeric values to analyze the applicability of model through a comparison of test wall; utilized the established model to investigate the influence of opening condition and other factors on the seismic performance of masonry wall. Su et al. [6] combined with the test data of a lot of domestic and overseas single-layer single-span infilled wall’s RC frame model, analyzed the influence of opening on the ultimate lateral bearing capacity and original stiffness of infilled wall’s RC frame, and provided the corresponding calculation method of reduction coefficient. Hosseinzadeh and Tehranizadeh [7] studied the nonlinear behavior of the steel plate shear wall with reinforced large rectangular opening (used as the window or door of a building). The numerical analysis was also conducted to a large number of steel plate shear walls with or without openings, and the analytical results: (1) reveal the characteristics of steel plate shear wall with openings; (2) study the influence of different opening characteristics as well as the size of components in the local boundary around the opening; and (3) discuss the introduction of openings that result in the change of strength, stiffness and ductility of the wall. Penava et al. [8] built a calculation model base on non-linear finite element, and the calculation model was verified by a series of tests. Thereby, an investigation was made on expanded parameters as well as the influence of different window and door sizes and positions on the shear behavior of infilled wall’s frame. Hussein et al. [9] manufactured a full-size wall assembly made of six clay masonry wallboard, 2 constraint column and one binder, and push down under the action of constant vertical loads and monotonic horizontal loads. The wallboard has different structure, i.e. solid wall and the wall with window or door openings.
Above research can be used for reference by this paper, but the studied energy-saving block & invisible multi-ribbed frame walls have their own characteristics, especially the research of its seismic performance with different sizes of openings is a new topic. Therefore, in this paper, the seismic performance of 1/2 scaled wall specimen with six different sizes of openings was investigated through low cyclic load test.
Test profile
Specimen design and reinforcement
The test specimen designed was divided into two groups. The 1/2 scaled model was selected.
The first group consists of three door opening specimen with different sizes, and the wall dimension is 2.7 m
The second group consists of three window opening specimen with different sizes, and the wall dimension is 1.8 m
The specimen takes ratio of holes as change parameter (hole ratio is the ratio of opening area to specimen’s gross area), and according to the optimal reinforcement ratio obtained by the research team in previous studies, the reinforcement rate of six specimens remains unchanged. The specimen size and reinforcement are shown in Fig. 1.
Mechanical properties of steel reinforcement
Mechanical properties of steel reinforcement
Physical and mechanical properties of the block
Mechanical properties of fine aggregate concrete
Sizes and reinforcement of specimens.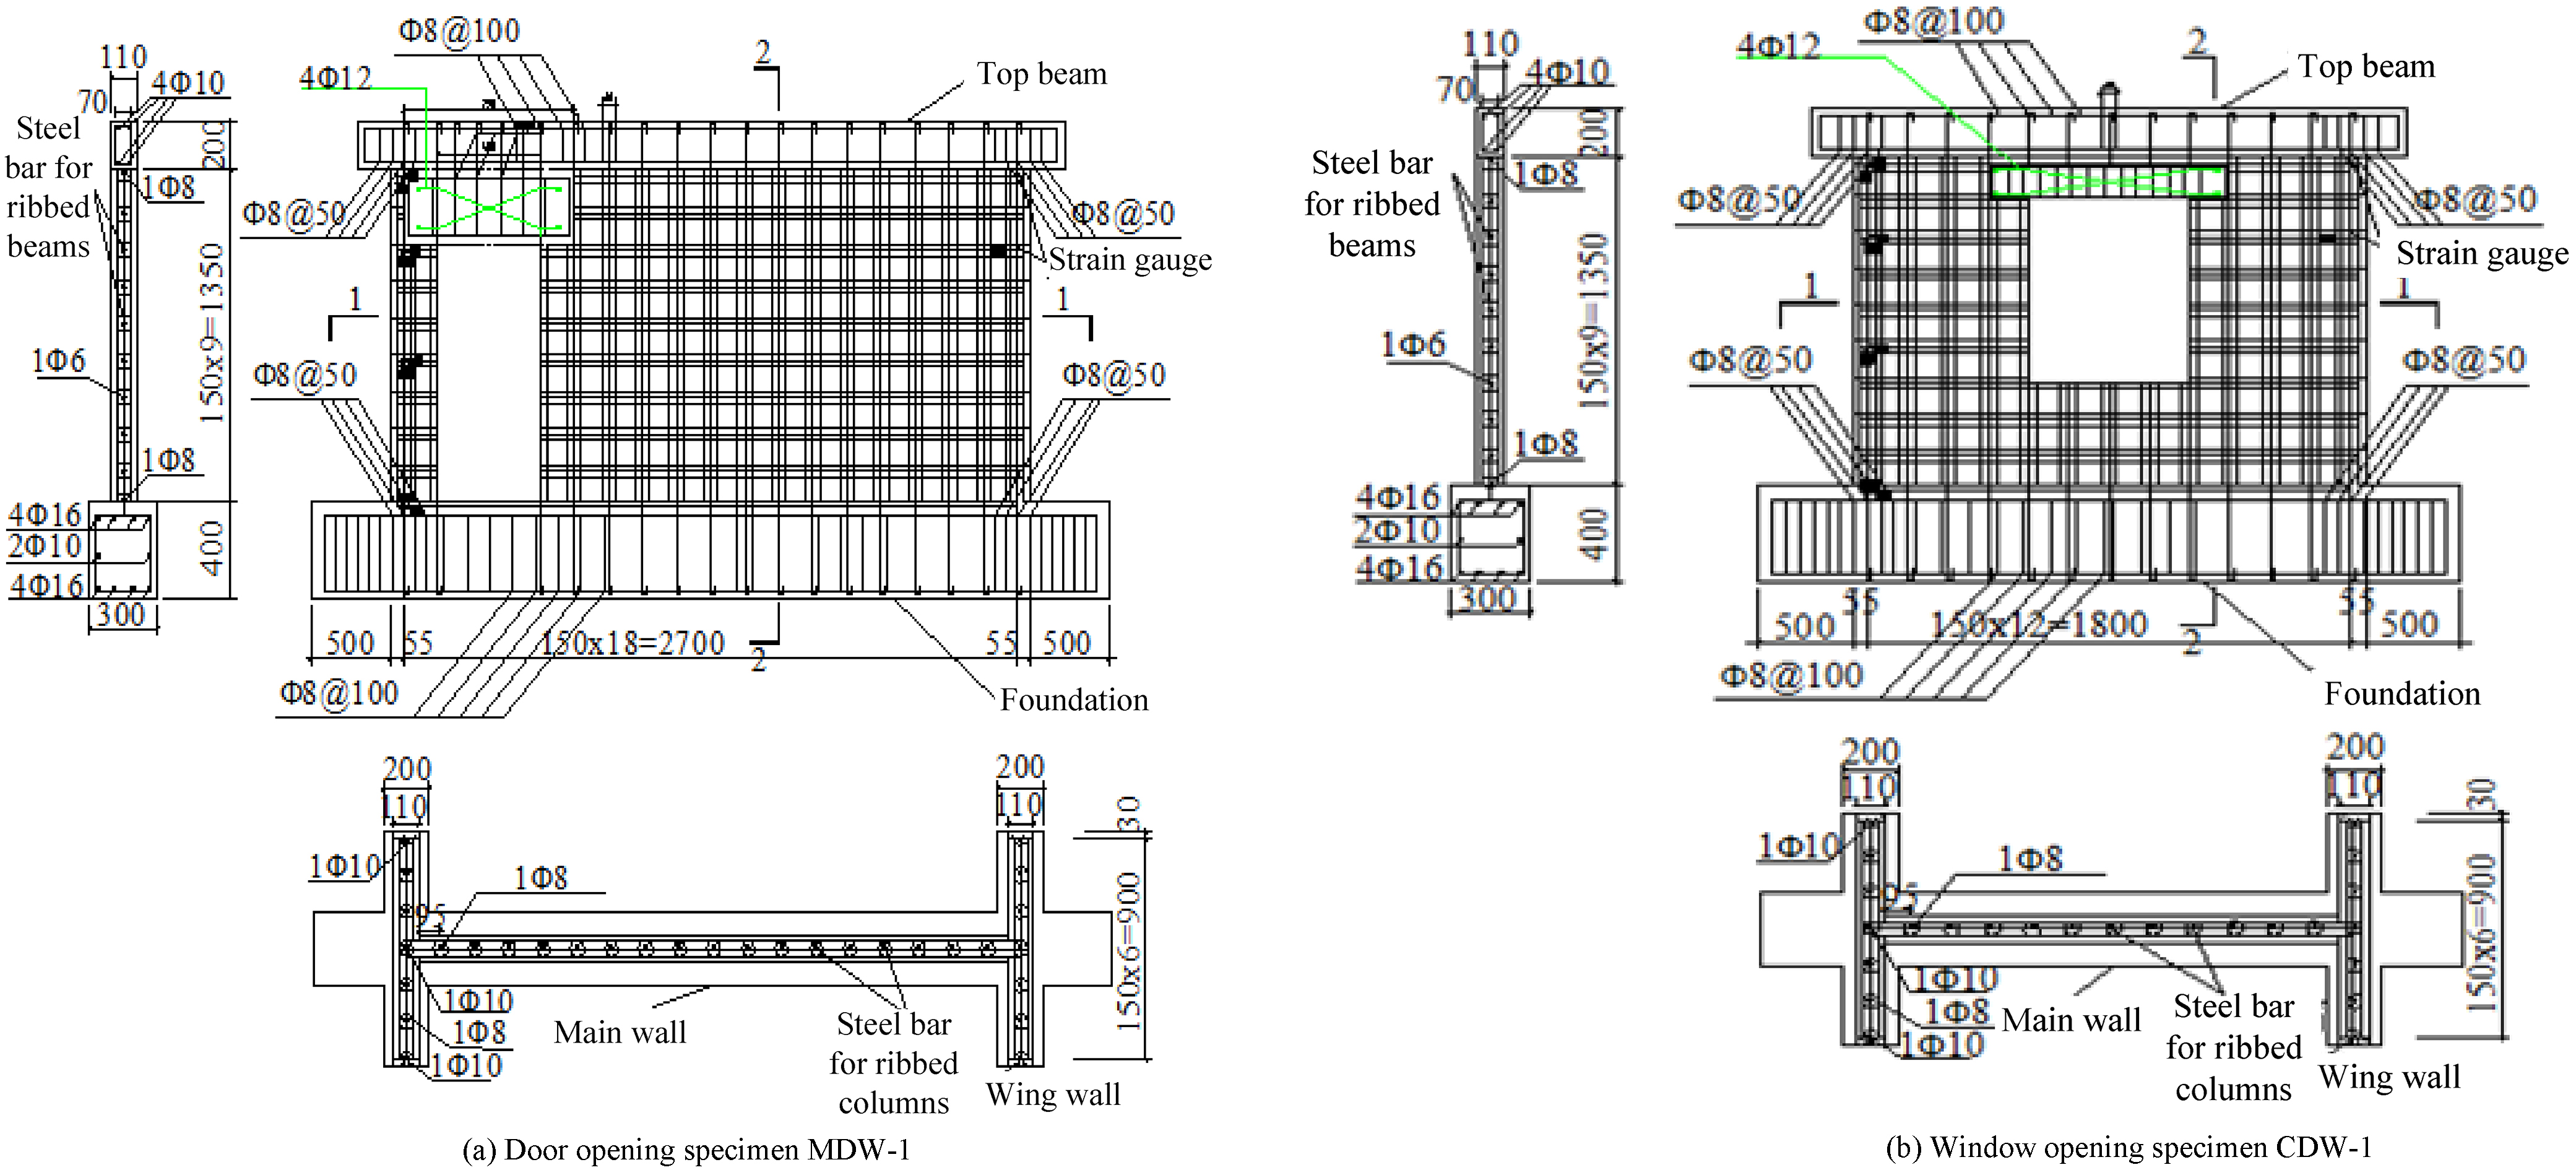
The measured values of the mechanical properties [10] of steel reinforcement used in the specimen are shown in Table 1; the measured values of the physical and mechanical properties of the block are shown in Table 2, and the measured values of the mechanical properties [11] of fine aggregate concrete are shown in Table 3.
Lading set-up and loading process
500 kN MTS actuator is adopted. Four round steel of the top beam of specimen are connected with actuator by conversion steel plate. Two ends of the floor beam of specimen are fixed at prepared holes on the ground by pressing beam respectively. Two terminal parts of the floor beam are fixed by using jack with precompression. The schematic diagram of the lading set-up is shown in Fig. 2 (take the first group of specimens as an example).
Lading set-up.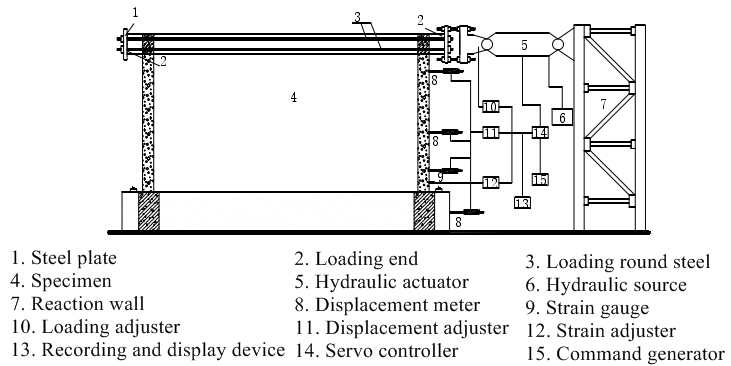
The loading process is an important controlling unit in the control of loading and the simulation of seismic oscillation. This test uses variable-amplitude displacement control [12] for loading. Before the specimen yields, each loading stage repeats twice, until the load value decreases below 85% of the maximum bearing capacity. Then the specimen is deemed as failed, and the loading can be stopped. The loading process of each specimen is shown in Fig. 3.
Displacement test: the layout of displacement meter is shown in Fig. 2. A laser displacement meter is set at the end of the loading direction of the top beam, to measure the horizontal displacement of top beam; a displacement meter is set inside the wall surface at 1/3 and 2/3 of the wall height, to monitor the deformation of the wall under force; in order to eliminate the influence of the movement or rotation of floor beam on the overall displacement of the wall, the displacement meters are set in the horizontal and vertical directions of floor beam within the loading plane, to monitor the slippage and warping deformation of floor beam.
Loading process of specimens.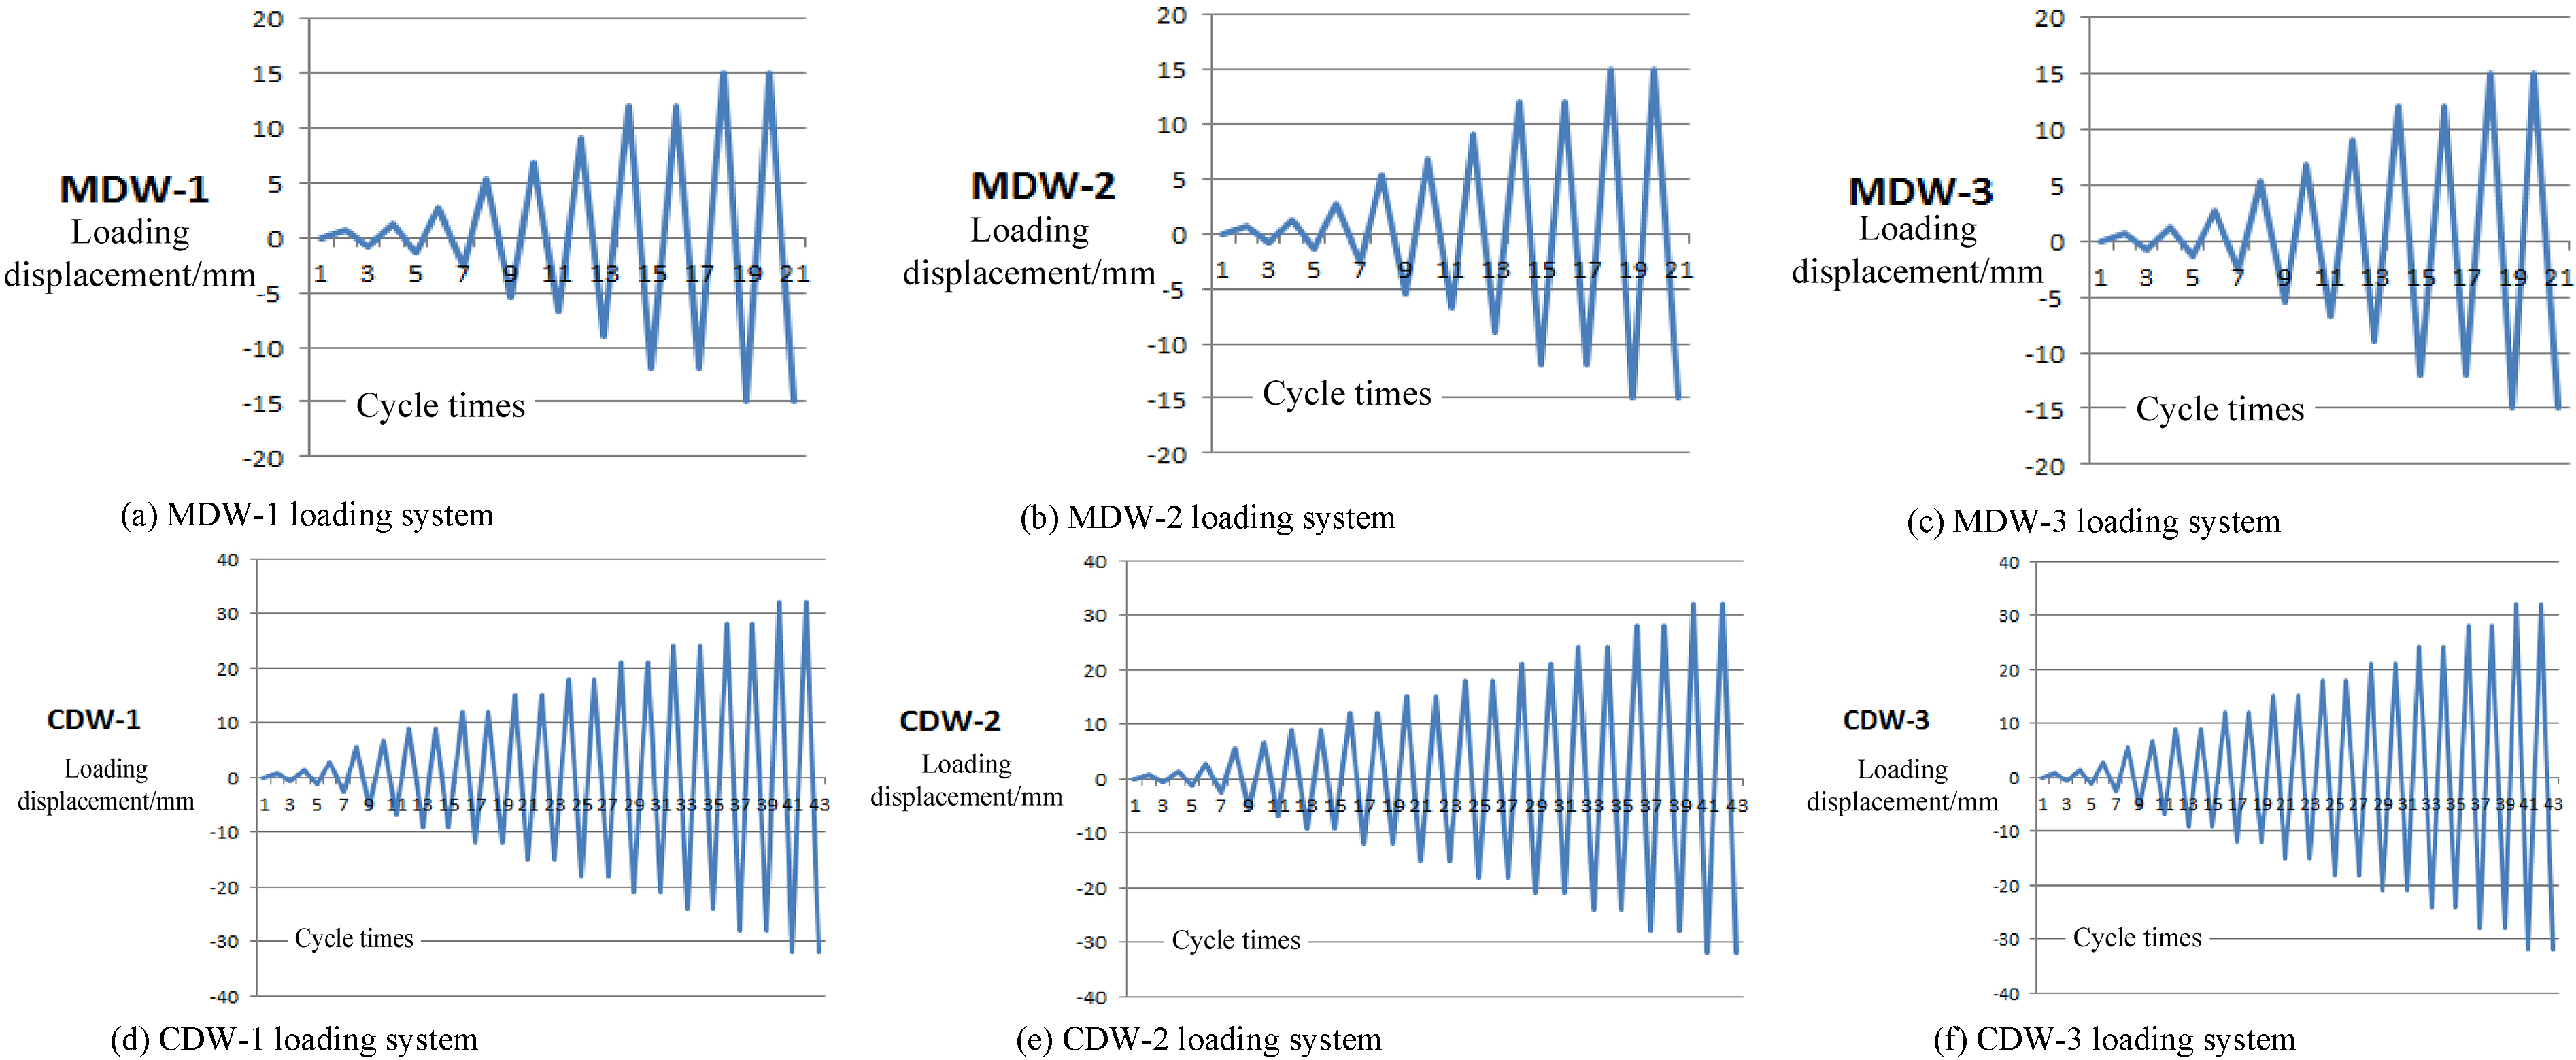
Strain test: it is preliminarily judged that the failure mode of the specimen is roughly a shear failure, and the cracks are distributed in a crossing way. In order to measure the strain of the reinforcement of the ribbed beam and column, the strain gauge is arranged in the cross position. The arrangement of strain measuring points of the first and second groups of specimens are shown in Fig. 4.
Strain measuring point of specimens.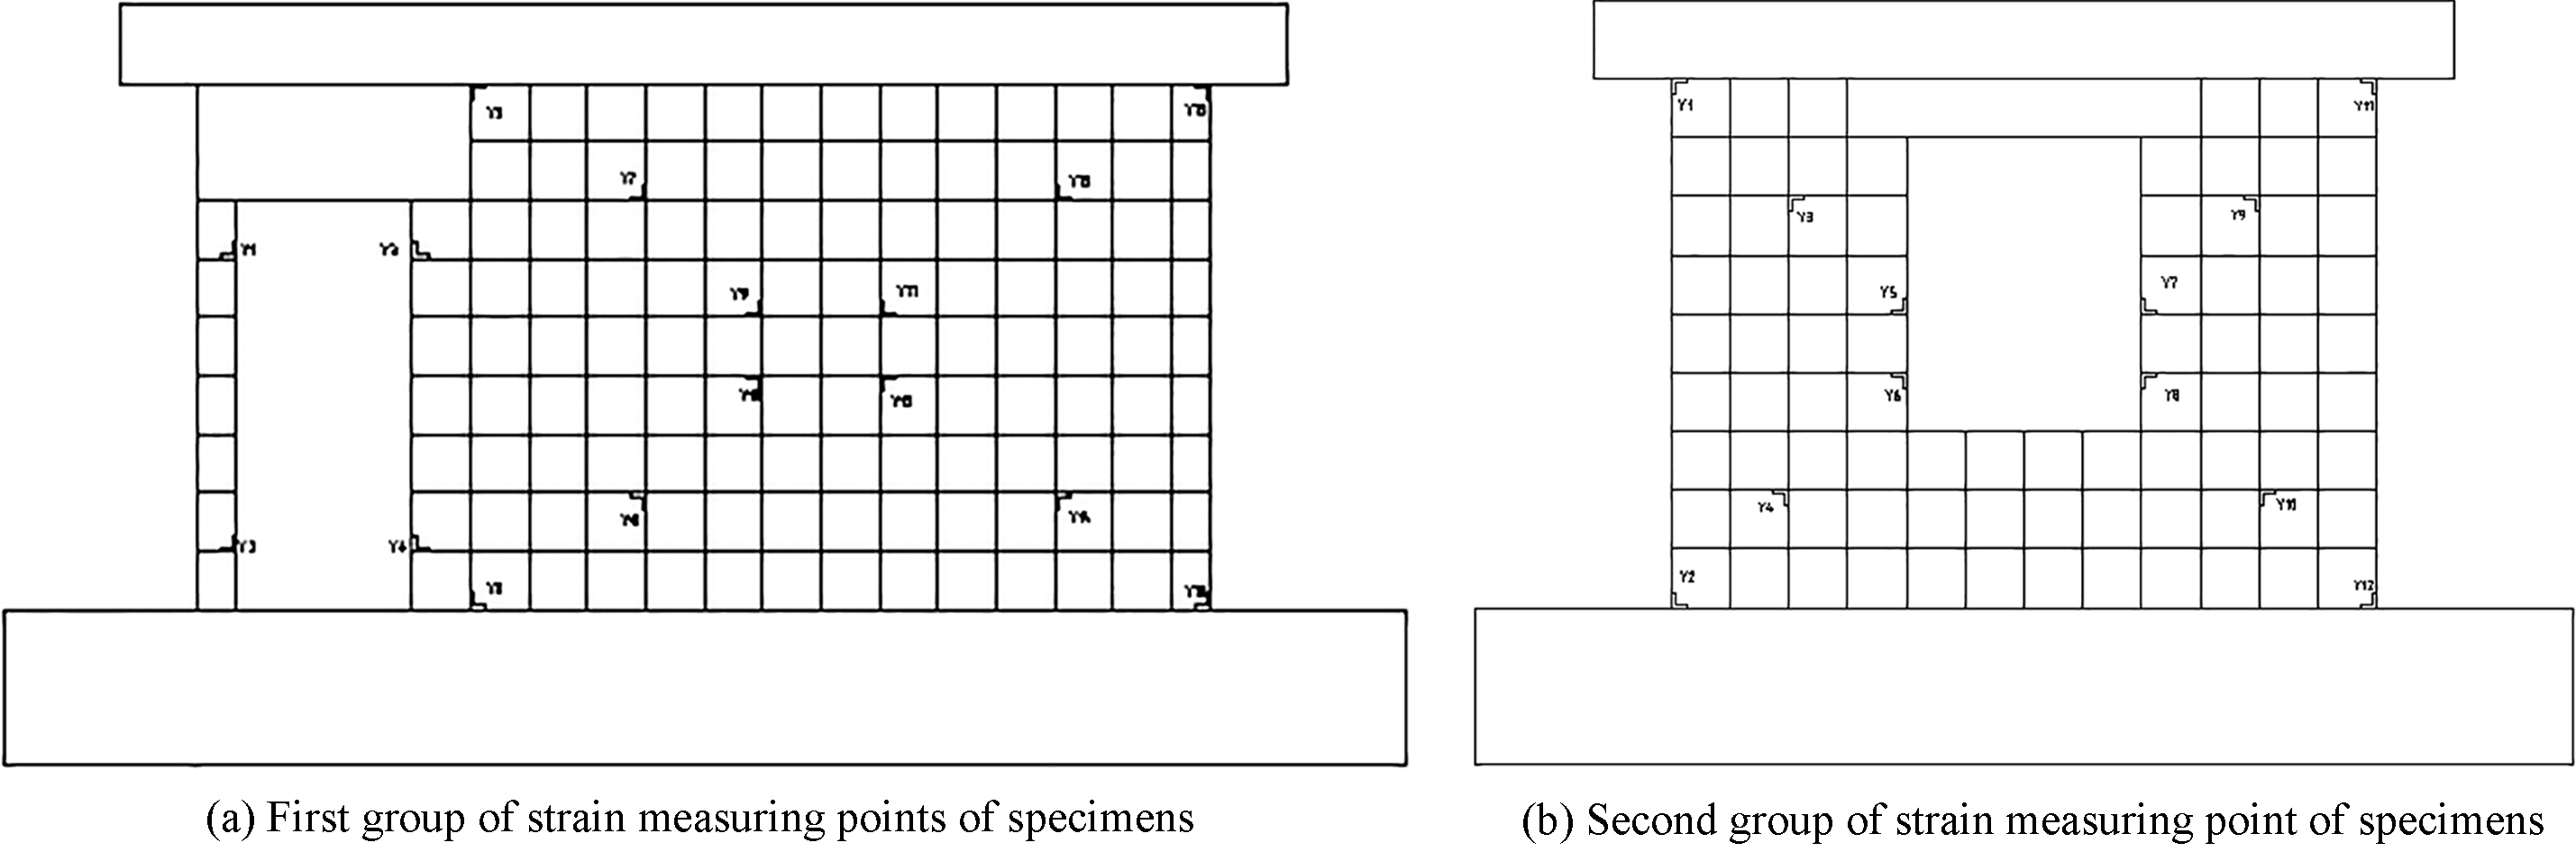
Test phenomenon of the first group of specimens
Take the specimen MDW-1 as an example. No crack exists before specimen is loaded. When the displacement amplitude of 1.35 mm is loaded in a forward direction, and the peak load value of this stage is 71.6 kN, about 41.8% of the ultimate load value, at this time, the first “
Failure and crack development of specimen MDW-1.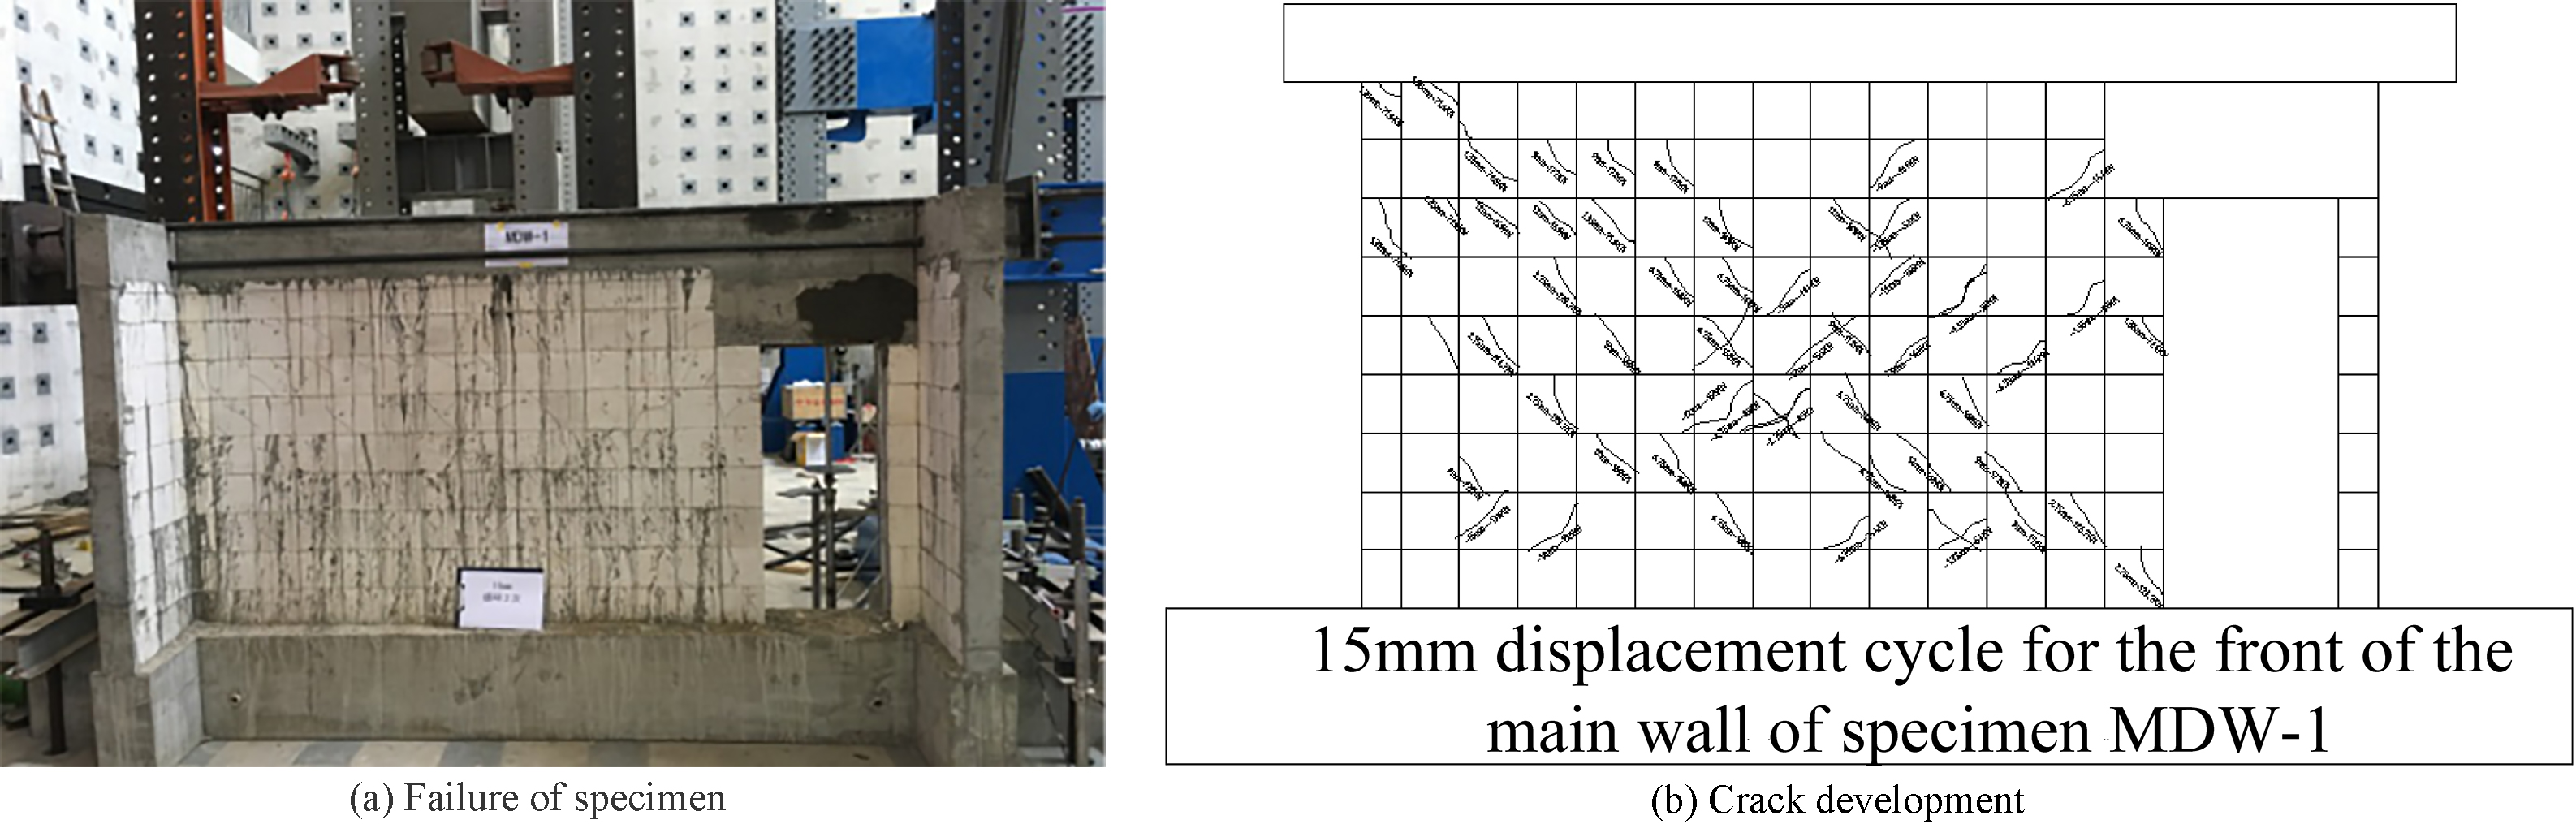
Take CDW-1 as an example. Before specimen is loaded, there is no initial crack. When the displacement amplitude rise to 2.7 mm, and the load is 60 kN, the “/” type micro-cracks appear on the first skin block at the lower left corner of the opening. When the displacement amplitude rise to 5.4 mm, and the load is 74 kN, cracks increase at the lower left part of the opening, with extended crack length, and the “/” type diagonal cracks also appear at the upper right corner of the opening. When reverse load is
Failure and crack developing of specimen CDW-1.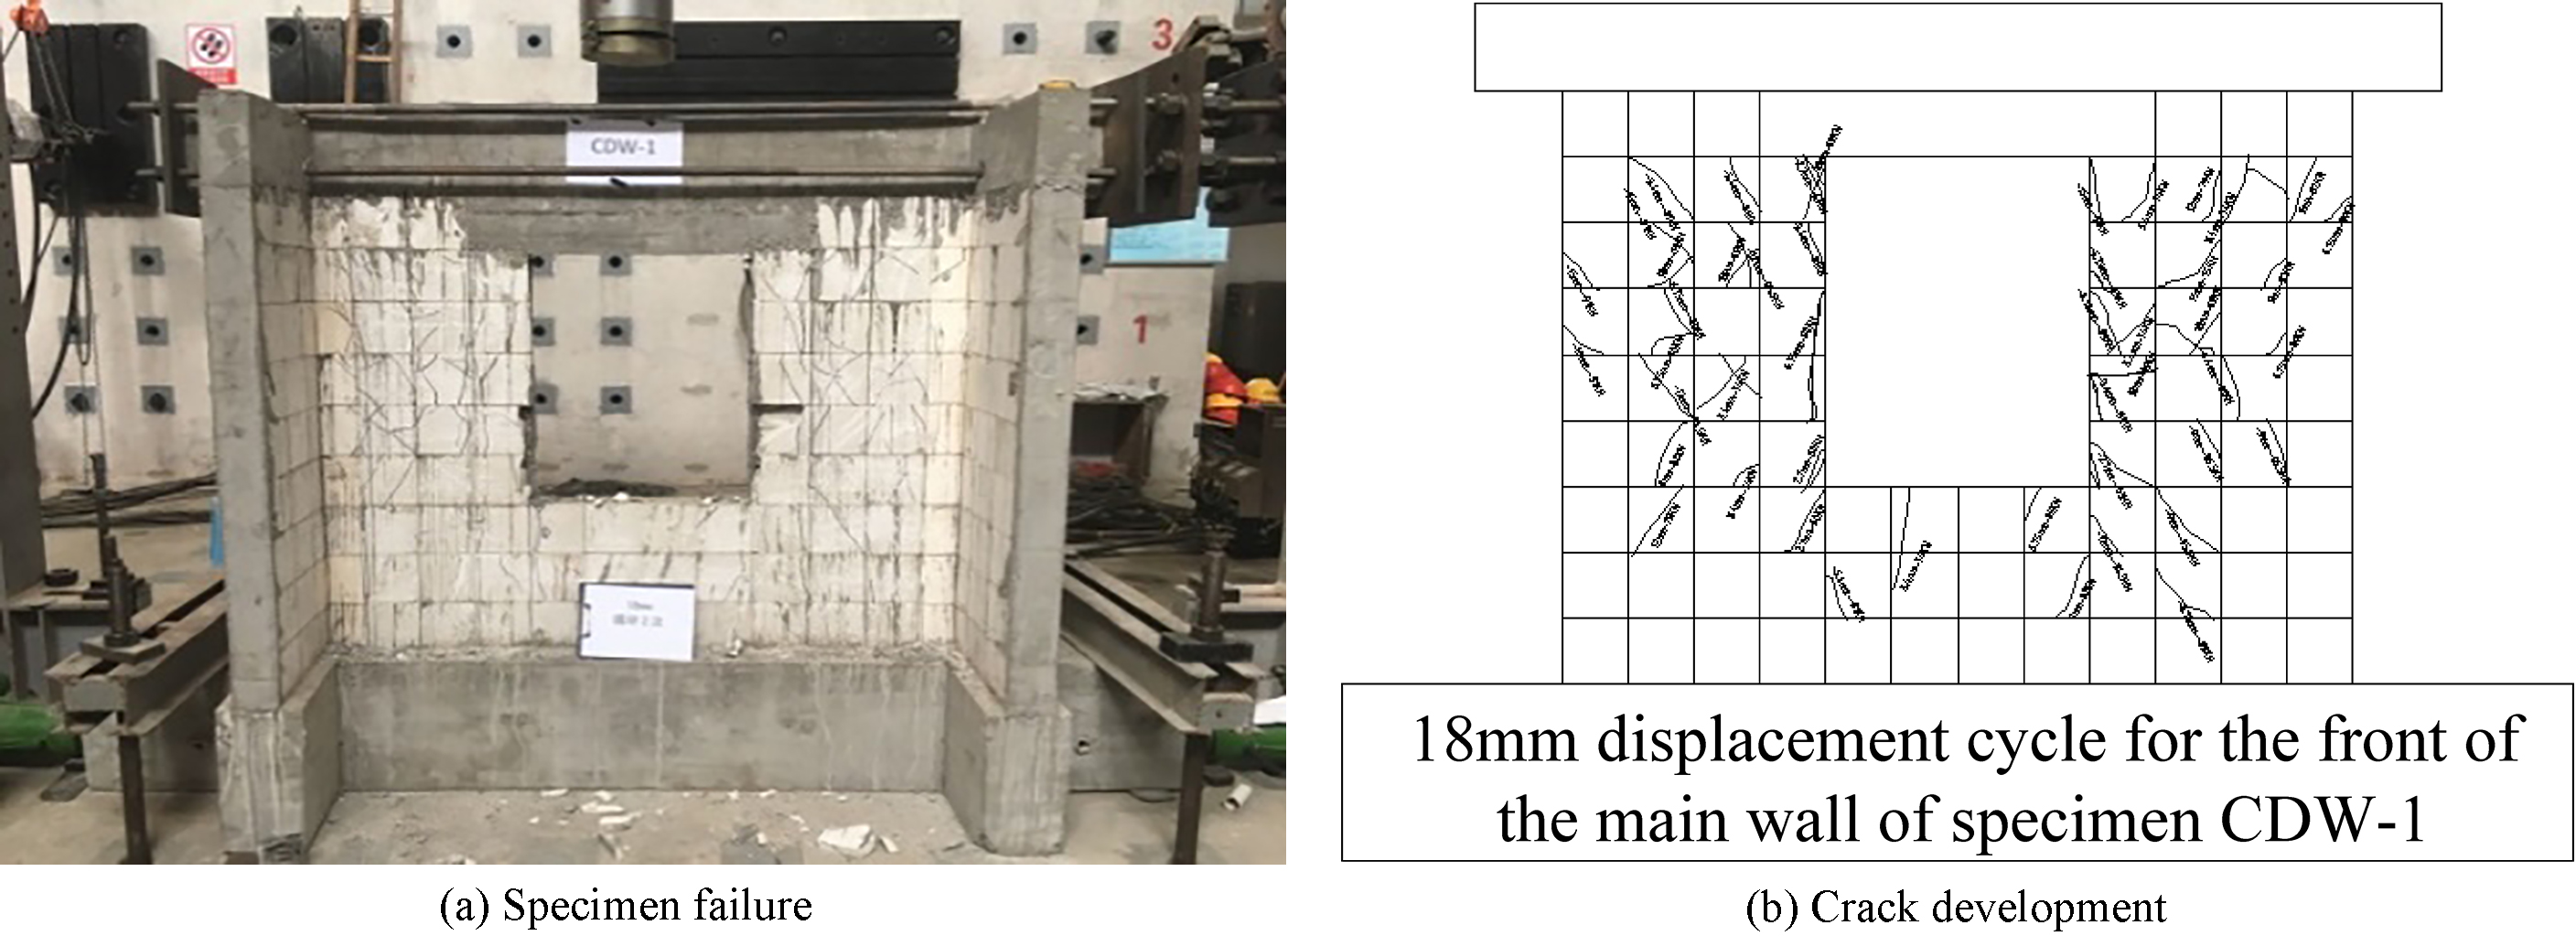
Through the analysis on test phenomenon and referring to research data of related brick wall [4, 6], the failure modes of wall with openings can be roughly divided into: shear compression failure and diagonal-compression failure.
Shear compression failure
From loading to failure, the wall goes through three stages: (1) Elastic stage. At this stage, the displacement-load relation curve basically shows a linear relation, and the stiffness degradation of the wall is less. The wall stiffness is the initial stiffness, until the wall starts to show cracks. (2) Cracking stage. With the increased displacement, the wall begins to show cracks, with quickened stiffness degradation. As cracks just begin to generate, and due to the obstruction of ribbed beam and column, the key failure cracks cannot form immediately. With the continuously increased loads, the cracks become more, expand, extend and gradually go through ribbed beam and column. Then, the concrete cracks, steel rebars start to yield, and stiffness gradually degrades, forming a main crack belt. (3) Failure stage. As the quantity of concrete cracks on ribbed beam and column rises, most steel rebars have already yielded, and bearing capacity enters a decaying stage, stiffness degradation becomes evident gradually. Finally, at the first cycle of certain grade, bearing capacity decreases below 85% of the maximum bearing capacity, and the specimen was damaged.
Diagonal-compression failure
In the diagonal-compression failure process of the wall with openings, the cracking load is about 45% of the peak load. After cracks generate, due to the obstruction of ribbed beam and column, cracks can’t develop continuously with many short cracks, and the location of crack appears as a jumping pattern. Finally, the failure of wall occurs at the intersection of cracks in the middle of the wall, and blocks are crushed. When the wall is crushed, the quantity of cracks on ribbed beam and column is less, and a few steel rebars yield.
Analyzing from the failure phenomenon of six specimens, in the failure process, the blocks crack seriously, the concrete of ribbed beam and column cracks, most steel rebars yield, and finally specimens are damaged. Therefore, the failure mode used for wall specimens with openings are all shear compression failure.
Test results and analysis
Hysteretic behavior
Hysteretic curve
Under the push-pull action of amplitude displacement control, the load-displacement curves of specimens show a recycling ring shape, forming the hysteretic curves composed of multiple hysteretic rings from loading at the beginning to the end. Normal hysteretic curve patterns include: arch, shuttle, S shape and reverse S shape. The hysteretic curves of wall with openings are shown in Fig. 7a–f.
Hysteretic curve of specimens.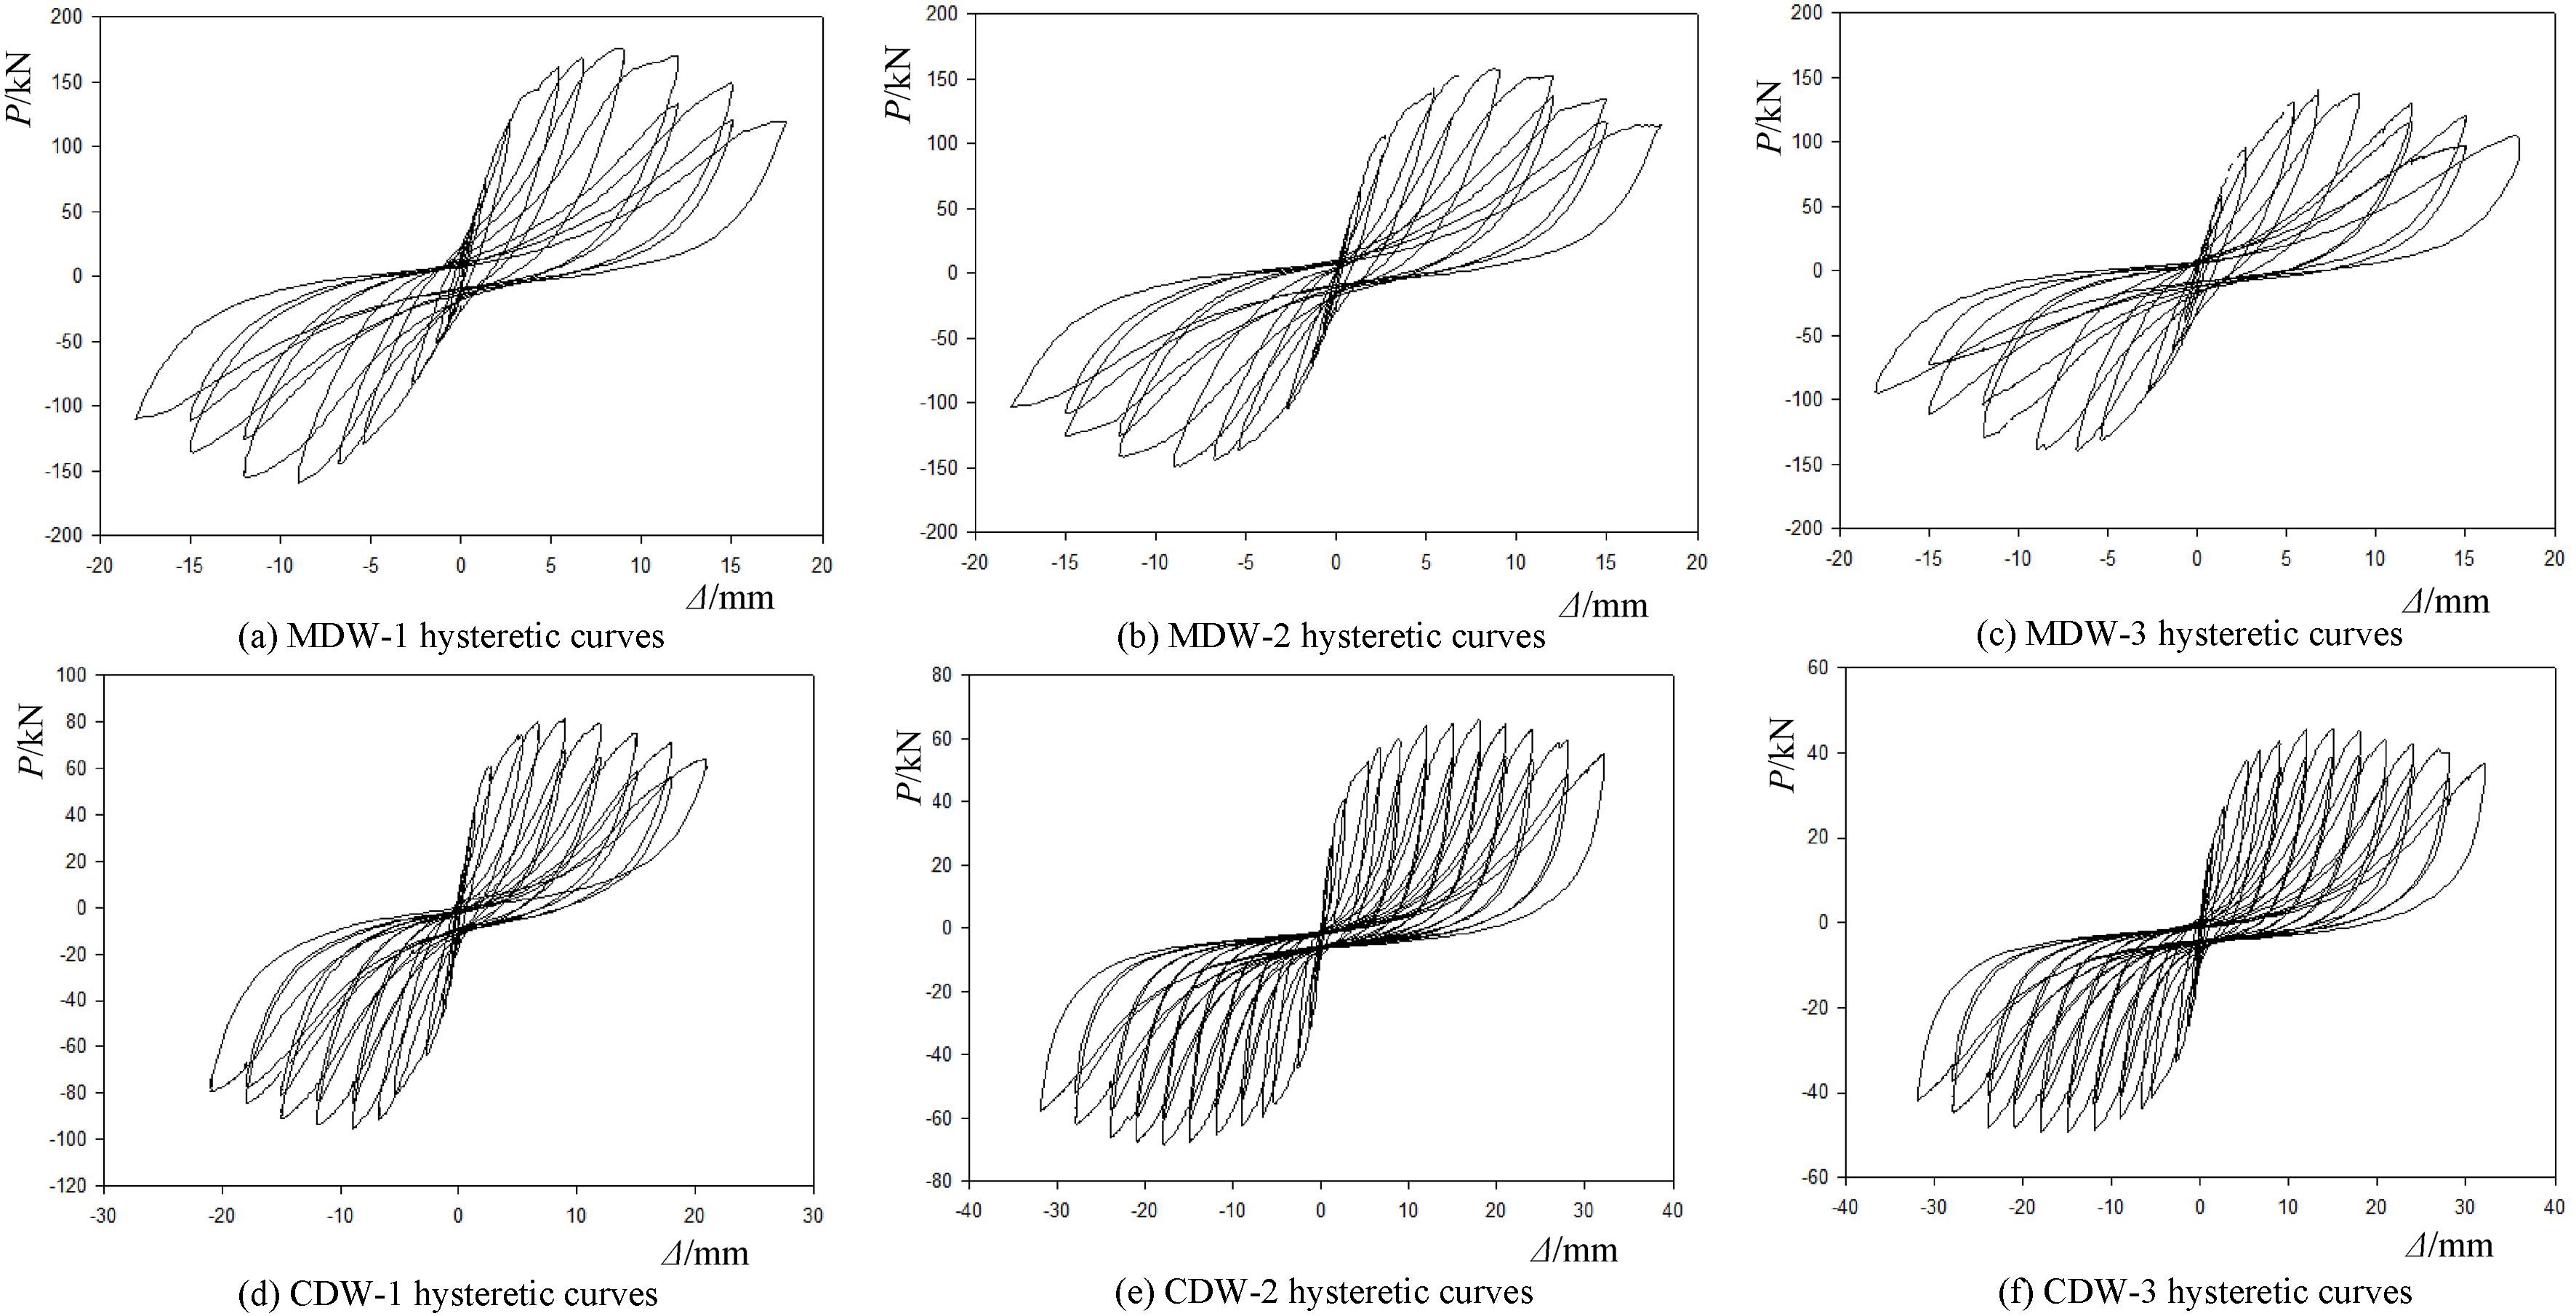
(1) The similarity and difference between hysteretic curves of the first group of specimens
Common characteristics: it can be seen from the hysteretic curves of three specimens that, before the specimens do not crack, the load-displacement curves are basically linear. At the early stage of cracking, stiffness slightly degrades. After unloading, hysteretic ring show a closed form, with smaller area, and the entire hysteretic curve displays a shuttle shape, without showing obvious shear deformation and slippage. As the displacement amplitude increases, bearing capacity rises, the cracking results in increasingly evident stiffness degradation, hysteretic curve slowly becomes full, until reaching to the maximum bearing capacity. When the displacement amplitude is unloaded to zero, the closed phenomenon of hysteretic ring gradually becomes significant. After this, the bearing capacity of specimens enters a declining stage, shear deformation becomes obvious, concrete cracks, and most reinforcement of ribbed beam and column yield. In the second cycles, stiffness degradation expedites, and finally the hysteretic curves of specimens display a reverse S shape.
Difference: as the rate of opening increases, the bearing capacity of specimens shows a decaying trend. In the rising stage of bearing capacity, with the increase of opening rate, stiffness decreases much faster. In the declining stage of bearing capacity, with the increase of opening rate, stiffness decreases much slower, with better ductility, stronger hysteretic energy dissipation capacity and better nonlinear seismic performance.
(2) The similarity and difference between hysteretic curves of the second group of specimens
Common characteristics: in the early non-cracking stage, the load-displacement curves are linear, and the hysteretic ring show a shuttle shape in loading and unloading. As the displacement amplitude rises, the hysteretic curves become more and more full. In the decaying stage of bearing capacity, the hysteretic curves show a closed form after unloading, and finally display a reverse S shape.
Difference: with the increase of opening rate, the bearing capacity of specimens evidently decreases, and so does stiffness. The displacement value of peak load gradually increases, the hysteretic ring becomes fuller, showing better energy dissipation capacity and ductility. After reaching to the peak load, the bearing capacity declines more slowly, and stiffness degradation becomes more slowly.
In low cyclic reciprocating loading, connect the corresponding peak load points of displacement amplitude of each stage in the same direction, the skeleton curves of specimens can be obtained, as shown in Fig. 8. Through the skeleton curves of specimens, the yield point, crack point, peak load point, ultimate displacement point and ductility coefficient of specimens can be determined, and the three stages and stiffness degradation that specimens have experienced can also be seen more visually. The skeleton curves of the first group of specimens are shown in Fig. 8a; the skeleton curves of the second group of specimens are shown in Fig. 8b; the skeleton curves of the six specimens are shown in Fig. 8c.
Skeleton curves of specimens.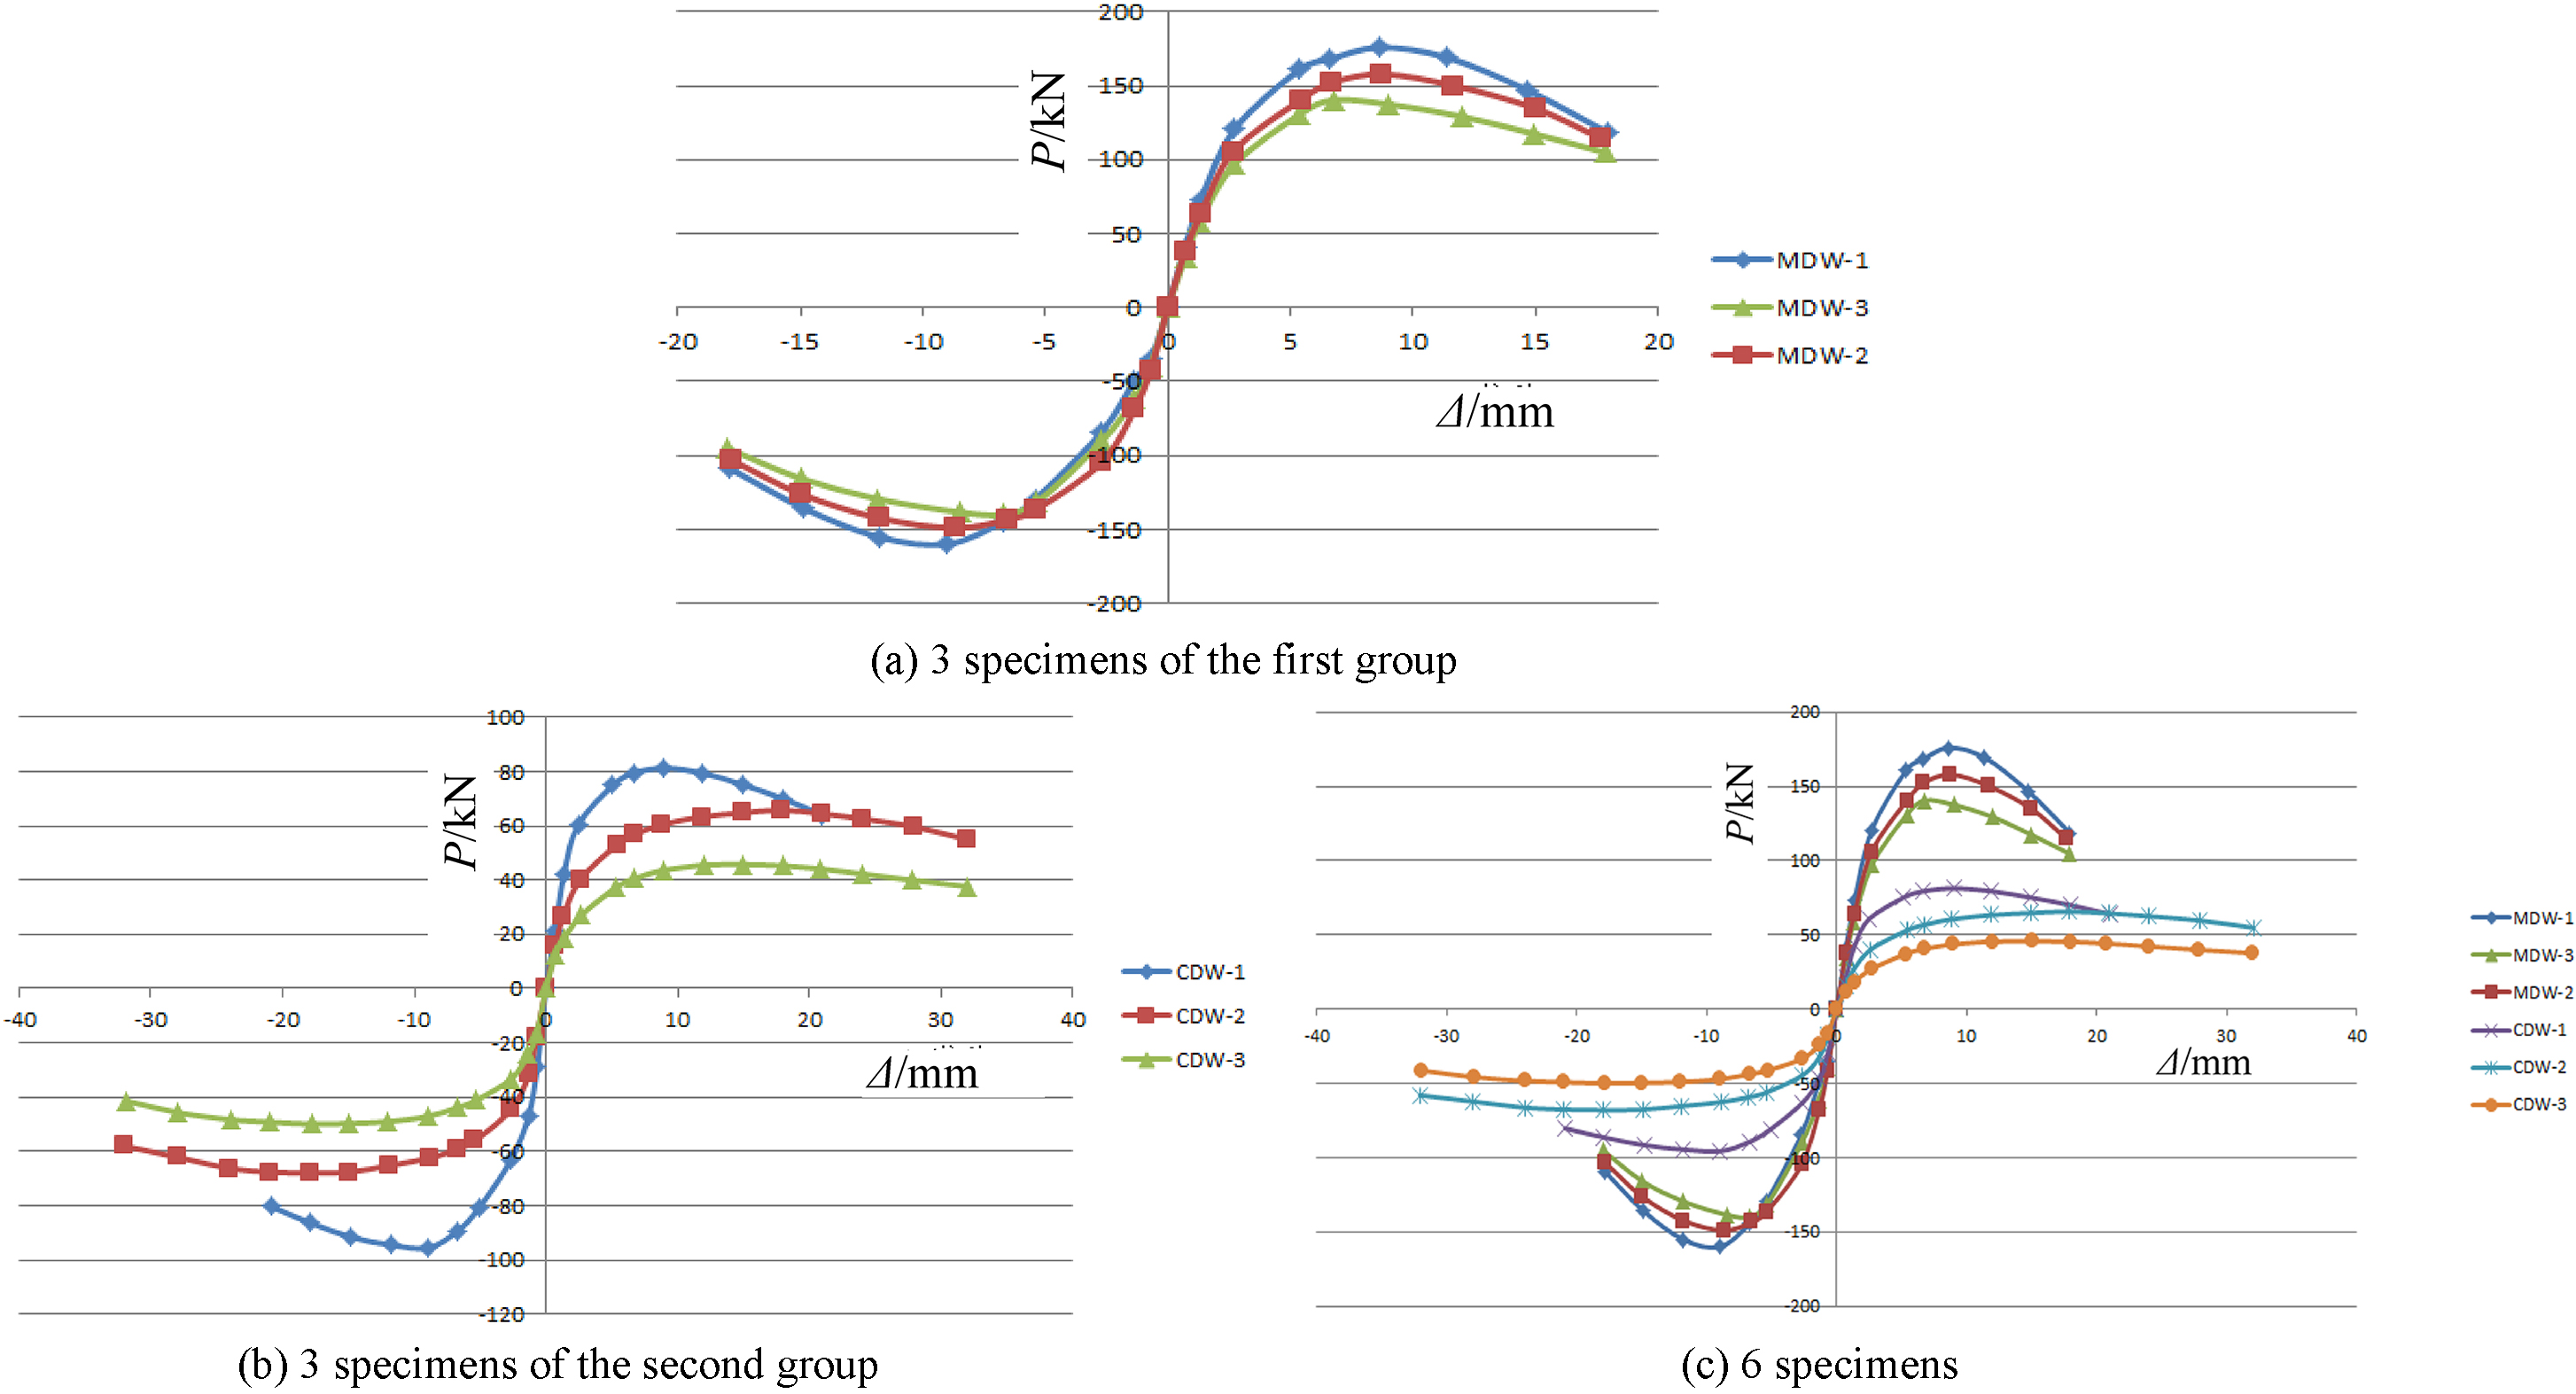
It can be seen from the skeleton curve, in the early loading stage, the load-displacement relationship curve is basically linear. With the increase of displacement amplitude, the specimens show cracks. When the stiffness starts to degrade, the curves obviously become bent, and the load continues to increase. As the cracking and deformation rate of wall are expedited, reaching to the maximum bearing capacity, there is evident residual deformation after unloading. Then, as the displacement amplitude increases, the bearing capacity enters a declining stage, the wall cracking aggravates, and stiffness gradually degrades. When bearing capacity reduces to below 85% of the maximum bearing capacity, the specimen is destroyed and loading ends. The specific analysis is as below:
For the first group of specimens, as the opening rate increases, the maximum bearing capacity of specimen shows a declining trend; at the rising stage of bearing capacity, with the increase of opening rate, the stiffness degrades quicker; at the declining stage of bearing capacity, with the increase of opening rate, stiffness degrades slower, ductility is better, hysteretic energy dissipation capacity is stronger, and nonlinear seismic performance is better. For the second group of specimens, as the opening rate increases, the bearing capacity of specimen decreases, and initial stiffness reduces. At the rising stage of bearing capacity, with the increase of opening rate, the stiffness degrades quicker; at the declining stage of bearing capacity, with the increase of opening rate, stiffness degrades slower, ductility is better, hysteretic energy dissipation capacity is stronger, and nonlinear seismic performance is better.
It is generally known that the greater the stiffness of a structure is, the larger its absorbed seismic force will be, and the worse its deformation and energy dissipation capacity will be [13]. The nonlinear deformation capability and hysteretic energy dissipation capacity of the structure are important basis to determine nonlinear seismic performance. Ductility refers to the inelastic deformation capacity borne by the structure after yielding and before being damaged. When it reaches to the peak load value, the stiffness degradation becomes be slower, deformation keep on increasing, and bearing capacity does not drop rapidly and causes structural damage. This indicates a better ductility.
A structure with large ductility coefficient has good ductility performance. The ductility coefficient is calculated according to the following equation:
Where,
This test uses the energy method [14] to determine the yield point of specimen. The specific practice is shown in Fig. 9. U point is the peak load point of specimen. Make a horizontal line UY through U point, and then make a diagonal line OY through the origin O to intersect with UY at point Y. When two dash areas OAB and UYB equal, at this time, point Y is the yield point and
According to the measured skeleton curve data, the eigenvalue point data and ductility factor of each specimen are worked out as shown in Table 4.
Summary sheet of test result
Equal energy method.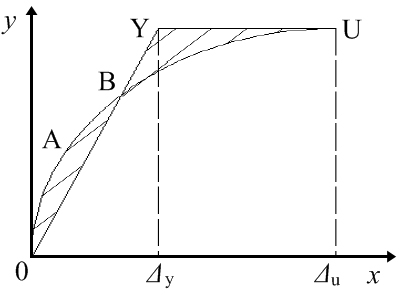
Comparing the three specimens in the first group in Table 4, with the increase of opening rate, their bearing capacity reduces, the displacement of cracking point reduces, ductility is promoted, energy dissipation capacity is enhanced. Comparing the three specimens in the second group in Table 4, with the increase of opening rate, their bearing capacity reduces, the displacement of ultimate load point increases, ductility is promoted, and energy dissipation capacity is enhanced. Comparing the six specimens in Table 4, with the increase of opening rate, the ductility of specimen shows an increasing trend, as shown in Fig. 10.
Relation curve of ratio of holes and ductility factor.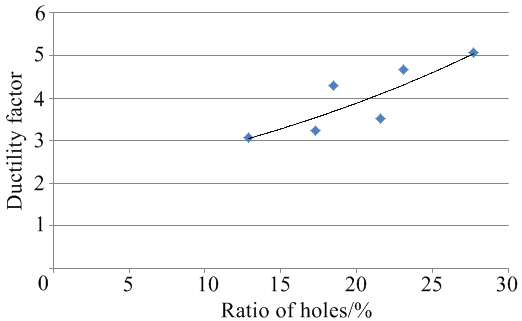
The process that the stiffness of specimen continuously decreases with the increase of displacement amplitude is called stiffness degradation. The paper replaces tangent stiffness with secant stiffness, and the calculation method is as follows:
Where,
According to Eq. (2), the stiffness of each specimen is figured out, and its stiffness degradation curves are drawn as shown in Fig. 11.
Stiffness degradation curves of specimens.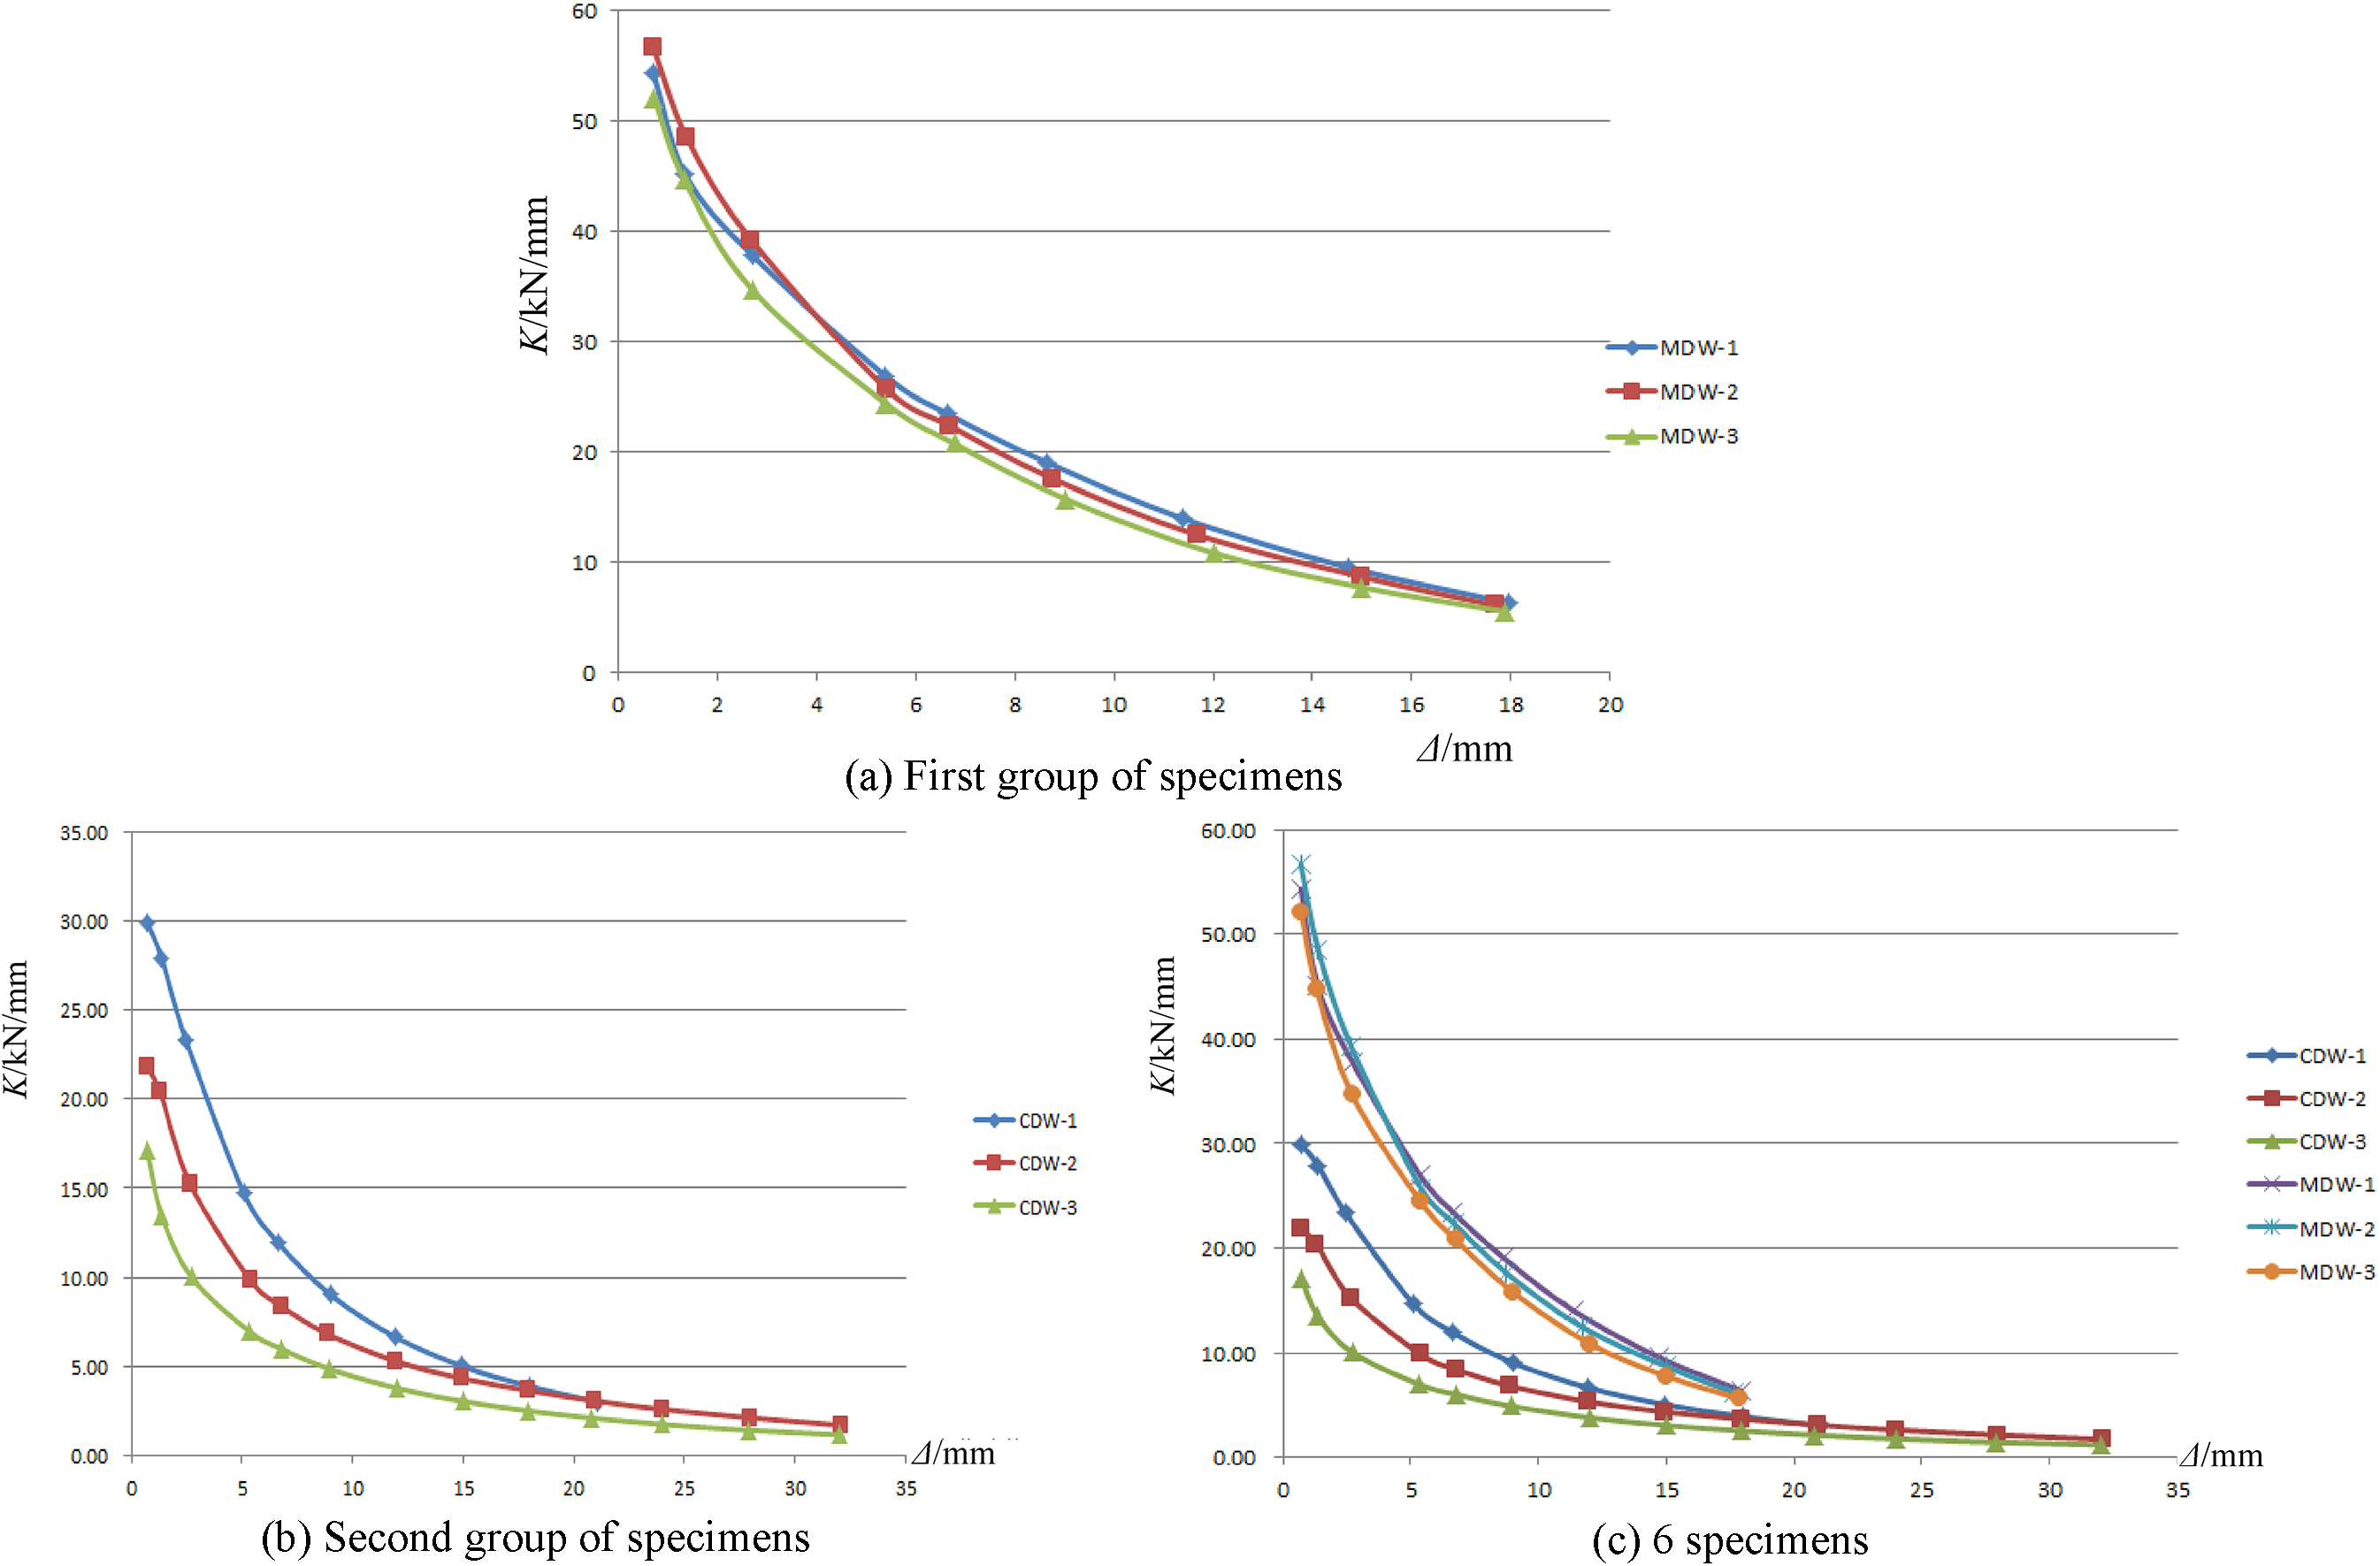
Stiffness degradation analysis:
The stiffness degradation curves of the first groups of specimens can be divided into three stages: rapid stiffness degradation stage at the initial loading period, mitigated stiffness degradation stage and stiffness stabilization stage. Since the specimen is designed according to the size of door opening of actual house (single-door, entry child-mother door, double-door), the size of opening does not differ much. Comparing the three curves, the initial stiffness of specimens before cracking is almost the same. Probably due to the different compactness of fine aggregate concrete, the initial stiffness of MDW-2 is slightly bigger. After the cracking process, the stiffness degradation curves of three specimens show certain law. The stiffness of MDW-1, MDW-2 and MDW-3 reduce successively, so do the stiffness degradation rate. After reaching to the maximum bearing capacity, the stiffness degradation rate of MDW-1 is the quickest. The deformation from the displacement at the maximum load to the ultimate displacement is the smallest, followed by MDW-2. After MDW-3 reaches to the maximum bearing capacity, it has the best nonlinear deformation capacity, slowest stiffness degradation and best ductility. The stiffness degradation curves of the second group of specimens have three same stages as the first group of specimens. With the increase of rate of hole, the integrity of specimens turns badly, and initial stiffness decreases. In the stable stiffness stage, with the increase of rate of hole, the stiffness declines more moderately. That’s to say, when the curve is more flat, the ultimate displacement will become larger, with lengthened curve and better ductility.
The stronger the structural resistance to inelastic deformation is, the more energy it will absorb in an earthquake, and the better the energy dissipation capacity will be, so the smaller the damage generated will be in the earthquake. Generally, the viscous damping coefficient is used to measure the structural energy dissipation capacity. In this paper, the viscous damping coefficient calculation method proposed by Jacbosno is adopted. The larger the viscous damping coefficient is, the stronger the structural energy dissipation capacity will be, the better the deformation performance will be, and the better the resistance to damage and collapse will be in an earthquake. The specific calculation method is shown in Fig. 12, according to Eq. (3).
Where,
Calculation diagram of equivalent viscous damping coefficient.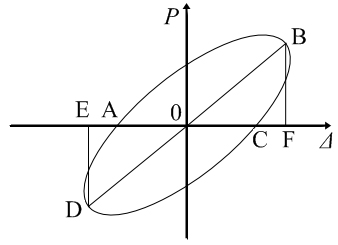
The equivalent viscous damping coefficients
According to above calculation method, the equivalent damping coefficients of all specimen’s characteristic point (cracking point, yield point, peak load point and failure point) are shown in Table 5. It can be seen from Table 5 that, the equivalent damping coefficients of specimens in the group one and two increase with the rise of rate of hole. It indicates that an appropriate opening can enhance the energy dissipation capacity of the component, but the openings should be reinforced. Otherwise, the bearing capacity and stiffness of component will be reduced a lot.
Deformation limit of the specimens
According to the two-stage fortification target required by the current Code for Seismic Design of Buildings in China, the fortification target requirements under the corresponding three performance levels are as follows:
“A minor earthquake without any damage” refers to that in frequent earthquakes, the structure can meet the requirements of elastic-plastic deformation limit and bearing capacity. “A moderate earthquake with repairable structural damage” refers to that the architectural structure has certain plastic deformation capacity and does not generate irreparable destroy. “A strong earthquake without collapsing” refers to that the architectural structure meets the elastic-plastic deformation limit.
According to the test data, the elastic displacement value and elastic-plastic displacement value of each wall can be worked out, and the allowable deformation value of the wall under different performance targets is determined, as shown in Table 6.
Conclusions
With the increase of the size of opening, the bearing capacity and stiffness of the wall will be weakened, so it is necessary to take measures to reinforce the opening or limit the size of opening, to ensure neither bearing capacity nor stiffness of the wall would decline too much. With the increase of door opening and window opening, the wall integrity will weaken, with declining bearing capacity, slower stiffness degradation after yield, larger ultimate displacement, better ductility and enhanced hysteretic energy dissipation capacity. This indicates that, for the walls with larger stiffness, when opening is made in an appropriately way, its seismic performance can be improved under no significant decrease of bearing capacity. According the test data, the elastic displacement value and elastic-plastic displacement value of each wall is worked out, so as to determine the deformation limit of walls at different performance objective.
Footnotes
Acknowledgments
This work was support by the National Natural Science Foundation of China (No. 51578253); Scientific and Technological Planning Project of Xiamen City (No. 3502Z20172011 and 3502Z20172014); Scientific and Technological Planning Project of Quanzhou City (No. 2018C083R); Reform study of graduate education and teaching of Huaqiao University in 2018 (No. 18YJG55).