The traditional distribution network lacks real-time topology information, which makes the implementation of smart grid complicated. The smart grid needs to monitor and dispatch the grid to maintain the economic and safe operation of the system. In this paper, we propose a topology detection algorithm of the distribution network based on adaptive state observer. Based on the transient dynamic model of the distribution network, the line states of the distribution network are regarded as unknown parameters, a virtual adaptive state observation network is built, and the topology can be inferred by the changes of adaptive state parameters. Finally, the effectiveness of our algorithm is verified by the MATLAB simulation experiments.
The power network transmission is divided into two parts by voltage grade: the transmission network composed of the high voltage lines between the substation and generator, and the distribution network composed of the middle and low voltage lines between substation and the user [1]. In the past, the centralized control and monitoring of the power system have been at the level of generation, transmission and high-voltage distribution. With the emergence of the active distribution network of intermittent distributed energy vehicles, there is a demand for the improvement of low-voltage distribution level control. At present, the control and automation management of the distribution network have been widely studied. In many cases, it is assumed that network topology information is available [2, 3].
Relatively speaking, the topology change period of the transmission network is longer and the structure is relatively stable, while the distribution network is more flexible, has more branches, and its topology changes more frequently, generally about half an hour. Real-time monitoring of the distribution network topology can be more convenient for the control of the distribution network and the scheduling decision-making [4].
In the past, there have been many researches on topology detection of the transmission network, mainly by means of state estimation [5], compressed sensing [6], etc., and relatively few researches on topology detection of the distribution network. In literature [7], the Group Lasso algorithm is used to estimate the medium-low-voltage distribution network topology, which can restore the network topology with limited data and has better performance in the case of noise. Literature [8] uses structure learning to detect the current radial distribution network. This algorithm has the lower complexity and only uses the measured data of nodes. Similarly, literature [9] detects the distribution network topology based on nearest-neighbors method. A method based on voltage analytics is proposed in literature [10], where the algorithm has the superior line verification performance.
Extensive existing literatures focus on static power flow equations without dynamic characteristics. Therefore, we can detect the distribution network change more quickly and timely using transient dynamic data. Regarding the topology information of the distribution network as unknown parameters, a virtual adaptive state observation network is built, and the current distribution network operating topology can be inferred through the state estimator of the adaptive quantity of topology information.
The rest of the paper is summarized as follows. The distribution network transient dynamics model and the mathematical problem description of topology identification are introduced in Section 2. In Section 3, we propose a topology detection algorithm of the distribution network based on adaptive state observer, and its effectiveness is proved by rigorous mathematics. In Section 3, the proposed algorithm is simulated in a 22-node distribution test network, and the effectiveness of the algorithm is verified. The all work in the paper is summarized in Section 4.
Problem description and modeling
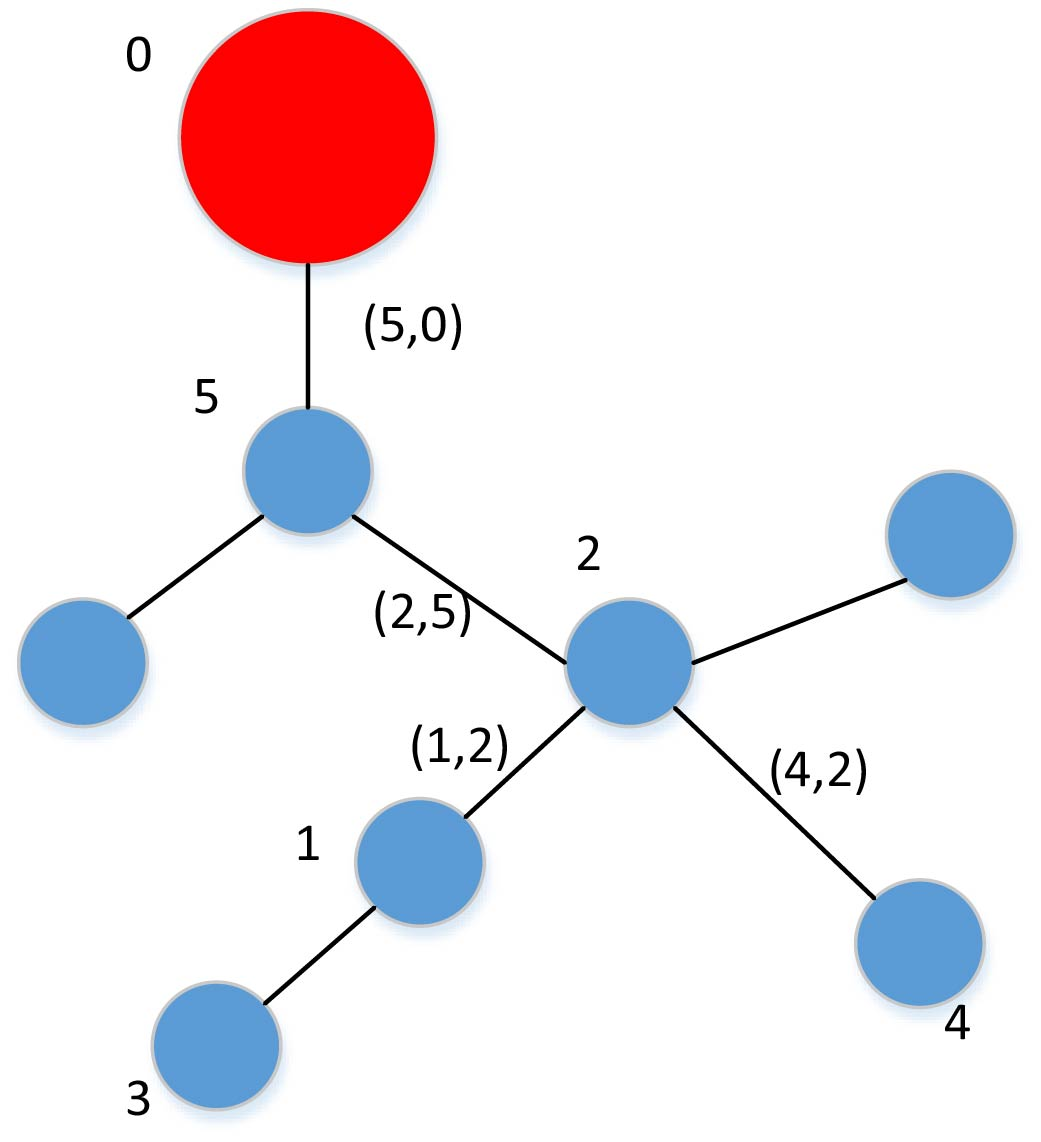
Considering a distribution network with nodes, we describe it as a graph , where is the set of all nodes in the distribution network station area, and its numbers are , where node 0 is directly connected to the feeder, represents the set of all edges. The set of all nodes except node 0 is marked as , namely . As shown in Fig. 1, it is a simple schematic diagram of distribution network.
Topology diagram of low-voltage distribution network.
Due to the existence of switches in the distribution network, each line state can be connected or disconnected. For each line , when it is connected, its state index is , otherwise . Therefore, considering switches of the distribution network, the current operating topology of the distribution network can be expressed as , where . In the distribution network, the inertia coefficient is negligible, and the dynamic model can be considered as first order. Thus, the dynamic model of the distribution network can be expressed as [11]
where is the active power required by the load, is the susceptance of the line , is the voltage phase angle of node , and is the frequency-power coefficient.
In addition, since the power load of the node will fluctuate randomly over time, the random perturbation of the load can be expressed by the following expression
where , is a random quantity obeys the standard normal distribution, is a characteristic function of the load perturbation intensity. Obviously, users with a higher demand for power will also have a large intensity of power fluctuation. Therefore, is a non-negative increasing function, which determines the variance of the load fluctuation, and its specific form needs to be determined by previous statistical information.
Due to the frequent actions of distribution network switches, the topology graph of the distribution network will change in real time. In order to ensure the safe operation and facilitate management of the distribution network, it is necessary to monitor the topology changes of the distribution network in real time, that is, to make sure the states of all lines , .
Topology detection algorithm for distribution network
For the topology detection problem of the distribution network, the main goal is to make sure the states of all the lines, regard the states of all the lines as the unknown parameter, and design a virtual adaptive state observation network. The design of the observation network is
where the state observation of the power load is
In the observation network Eq. (3), , and are the observed values of and in the original model. , and are positive constant, which determines the convergence rate of the virtual observation network. and are feedback gains. is the set of all possible connected nodes of node .
Definition 3.1: Let denote the family of all non-negative function on which are continuously twice differentiable in and once differentiable in . Then, the diffusion operator acting on functions is defined by
Hypothesis 3.1: Assume that are linearly independent on the orbit of the outer synchronization manifold .
Theorem 3.1: Assuming that the power load fluctuates randomly with time. Then, satisfies Lipschitz continuity condition. Then, the adaptive state observer can satisfy .
Proof: Firstly, we consider the convergence of the state observation of the power load Eq. (3b), the synchronization error of the load value between the actual physical network and the observed network is set as , and the differential of the synchronization error is expressed as
where , because satisfies the Lipschitz continuity condition, then there is a positive number, that is, , such that . Then, construct a scalar function
Based on the method in the literature [12], we use the diffusion operator to solve the random disturbance problem, and we can get
Obviously, , then we can get
Let . By defining , we can get that exists and is bounded with a large probability, and . This means that .
Then, the observation of phase angle state is considered as follows. We record the synchronization error between the actual physical network and the virtual observation network as . Since , the derivative of the error term can be expressed as
In order to simplify the expression, we set , then the above formula can become
Based on the above system, the following Lyapunov function is constructed
and its differential can be expressed as
It can be clearly seen that satisfies the Lipschitz continuity condition, so there exists a positive number such that
Then we can get
Let , and it can be inferred that , which is equivalent to , namely
for all . Based on Hypothesis 3.1, we can get , and the theorem 3.1 is proved.
In view of the conclusion obtained from Theorem 3.1, the following topology detection algorithm of the distribution network is designed.
Topology detection algorithm
Fault Line Detection Algorithm of Distribution Network Based on Adaptive Observer
Input:
Output: The current running network topology is
Algorithm flow:
Step 1: According to the current input data , update the adaptive state observation network Eq. (3)
Step 2: Obtain the value of when the observation system is stable;
Step 3: Get the current network topology .
In this proposed algorithm, is a small threshold. This is because that may be caused by line aging, model errors, etc. The threshold is a redundant amount to ensure the accuracy of the algorithm.
Remark 3.1: In actual applications, PMU data can only be obtained at discrete sampling time points. In some cases, the actual data cannot ignore the sampling interval. Use to denote the sampling time sequence, which satisfies , the time interval is denoted as , and . When designing the observation network, the predicted states can be used to replace the continuous states in Eq. (3). The specific expression is
where is the predicted value of , and the predicted value follows the following differential equation
At the sampling moment, we update the state , mark as the value of the maximum sampling interval, namely . Refer to literature [13], there is a constant , when the maximum sampling interval satisfies , we can get .
The line impedance of each line
Number
Bus 1
Bus 2
Impedance
1
0
1
13.1004
2
1
2
90.0952
3
1
3
9.0934
4
3
4
25.4602
5
4
5
3.7569
6
5
6
82.3659
7
5
7
16.9538
8
3
8
6.6280
9
8
9
90.0952
10
8
10
7.3024
11
10
11
90.0952
12
10
12
12.4937
13
12
13
4.7092
14
13
14
226.9148
15
13
15
90.0952
16
15
16
15.3328
17
16
17
51.8535
18
16
18
8.5854
19
18
19
37.9407
20
19
20
56.6514
21
19
21
9.2414
22
4
9
90.0952
23
6
17
51.8535
24
14
18
805454
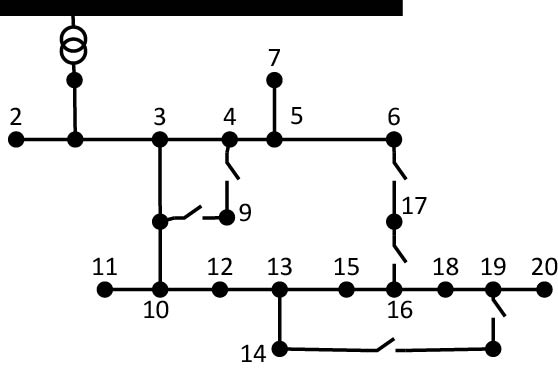
Topology diagram of 22-node low-voltage distribution network.
System partial parameters list
Simulation parameters
Value
Frequency power factor
20
Feedback coefficient
5
Feedback coefficient
5
Feedback coefficient
100
Load fluctuation intensity
1
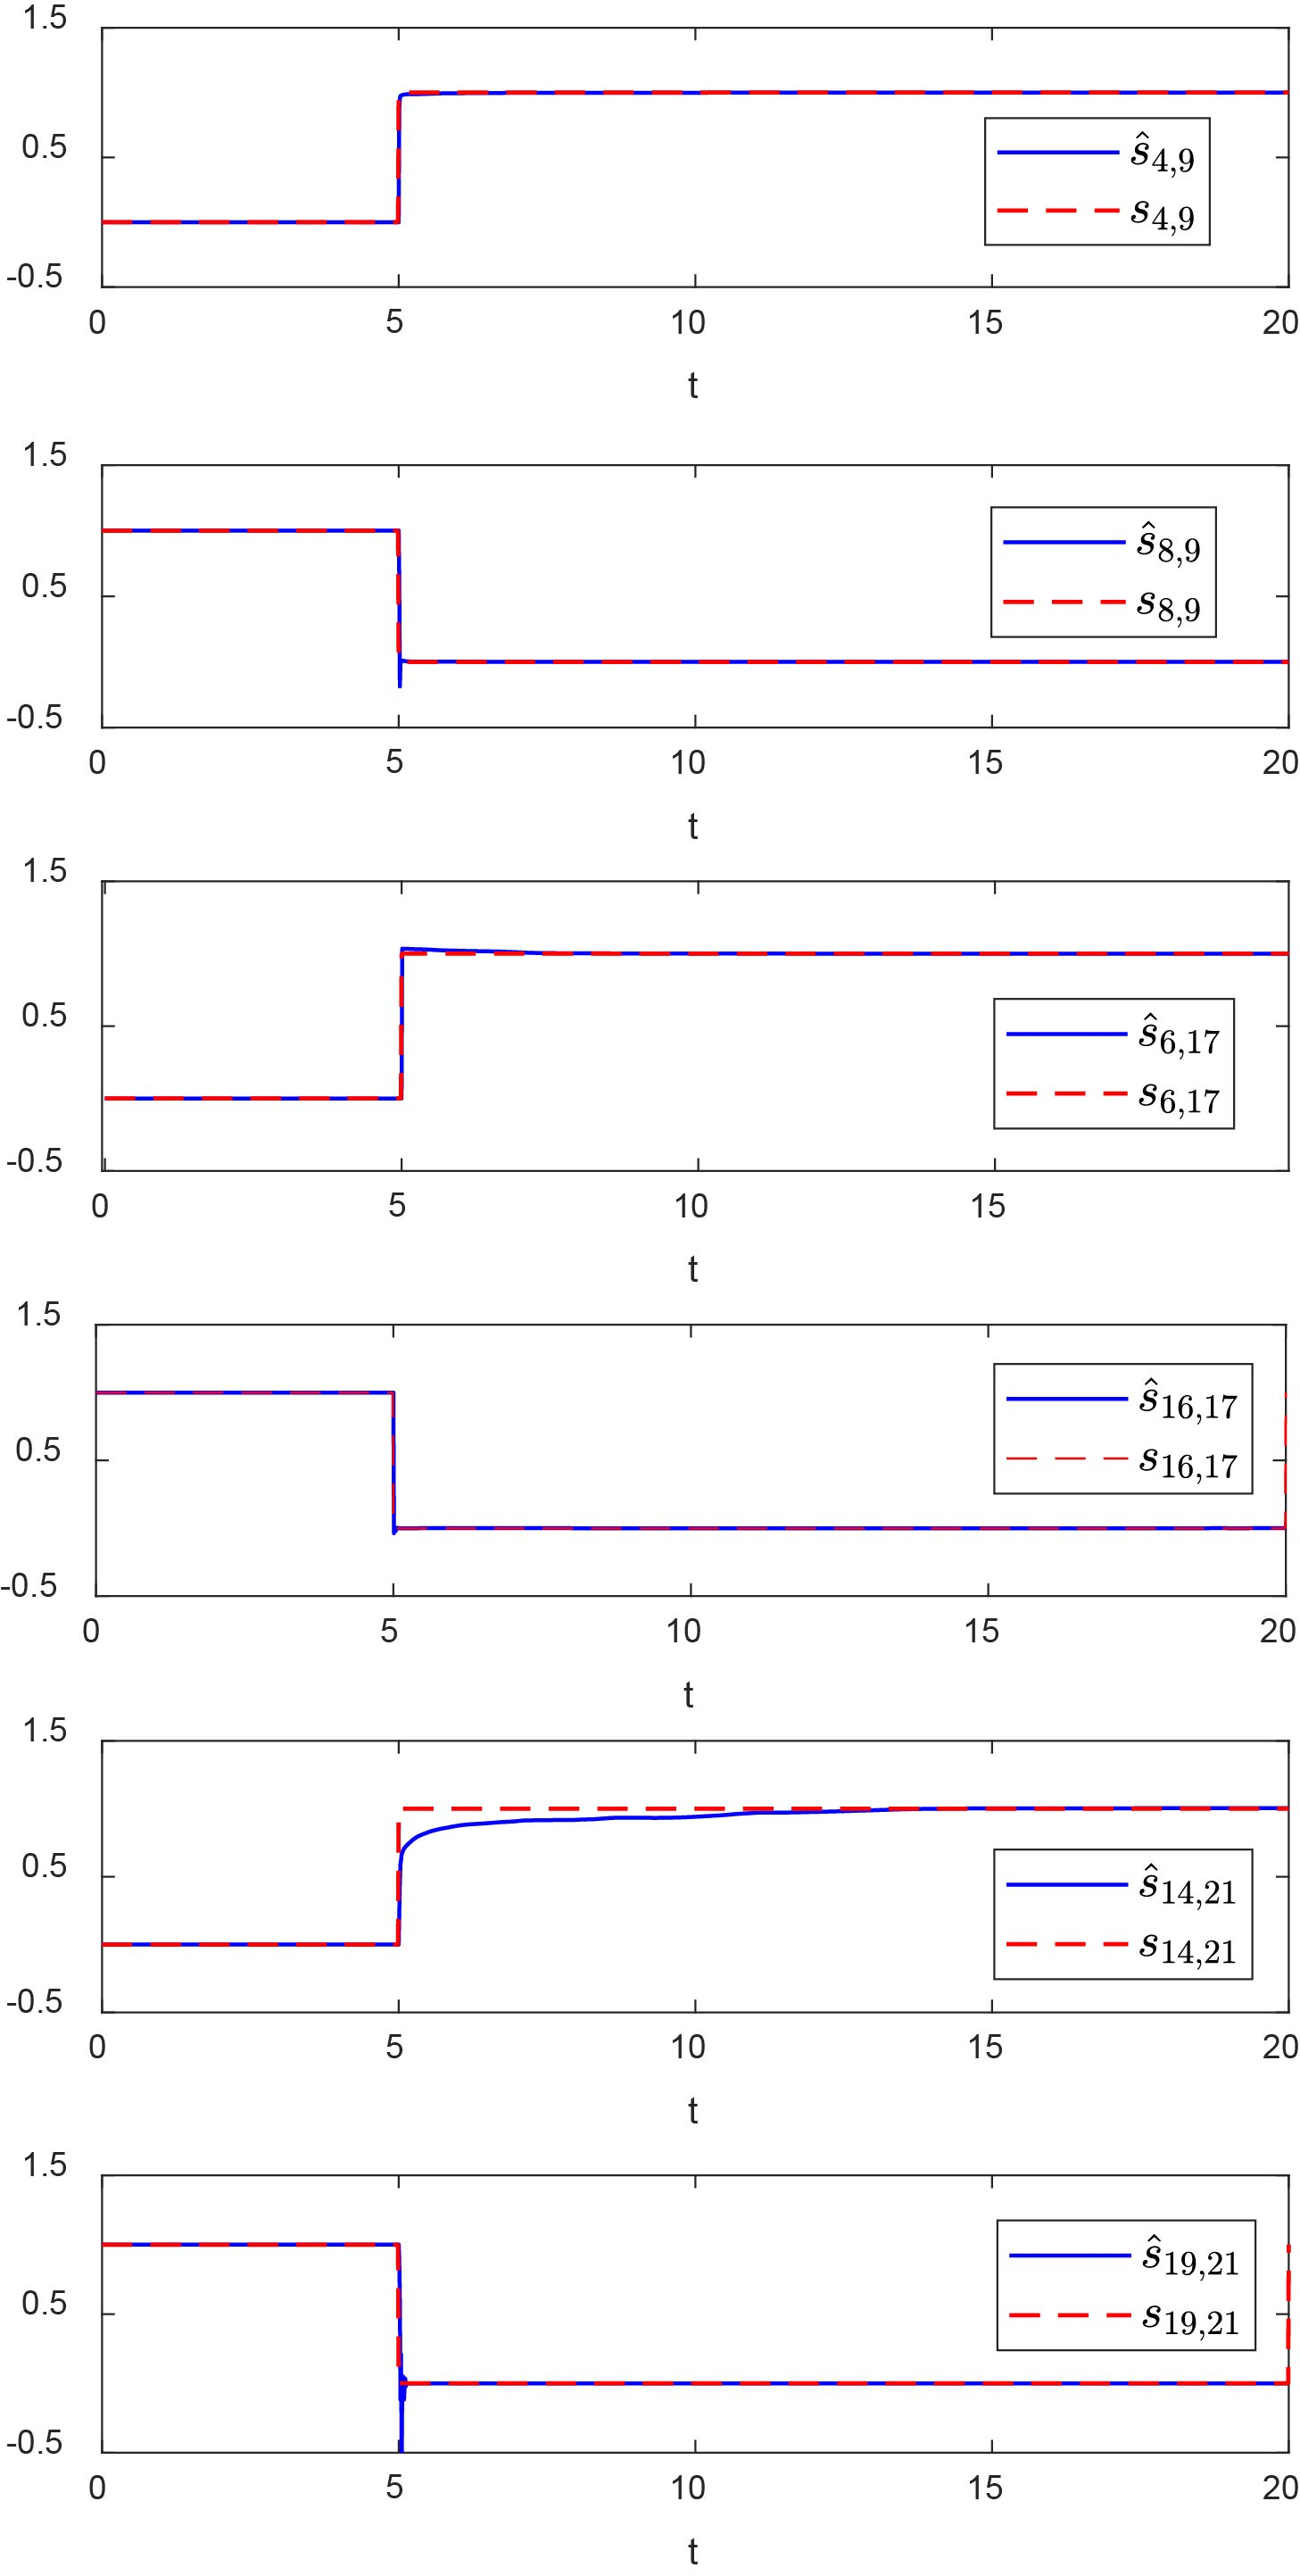
The evolution curve of some switching state observed values over time.
Numerical simulation analysis
In order to verify the effectiveness of the proposed algorithm, it is applied to a distribution network with 22 nodes for simulation verification, and the distribution network topology is shown in Fig. 2. The dynamic model is realized by ode45 in MATLAB with differential equation simulation.
As can be seen from Fig. 2, the distribution network will operate in different states due to different switching states. The line impedance of each line is shown in Table 2.
The random fluctuation function of the load uses a commonly used linear increasing function . Other simulation parameters are listed in Table 3 below.
The system first runs in state 1: , , , , , , at , the distribution network system changes to state 2: , , , , , . Through the simulation experiment, the state changes of , , , , , are shown in Fig. 3. It can be seen that after the topology changes, observed values of line states change accordingly, and finally they can converge to the real state values quickly, and the observed values based on line states can also detect the actual situation of topology changes. This also fully verifies the effectiveness of the algorithm proposed in this paper.
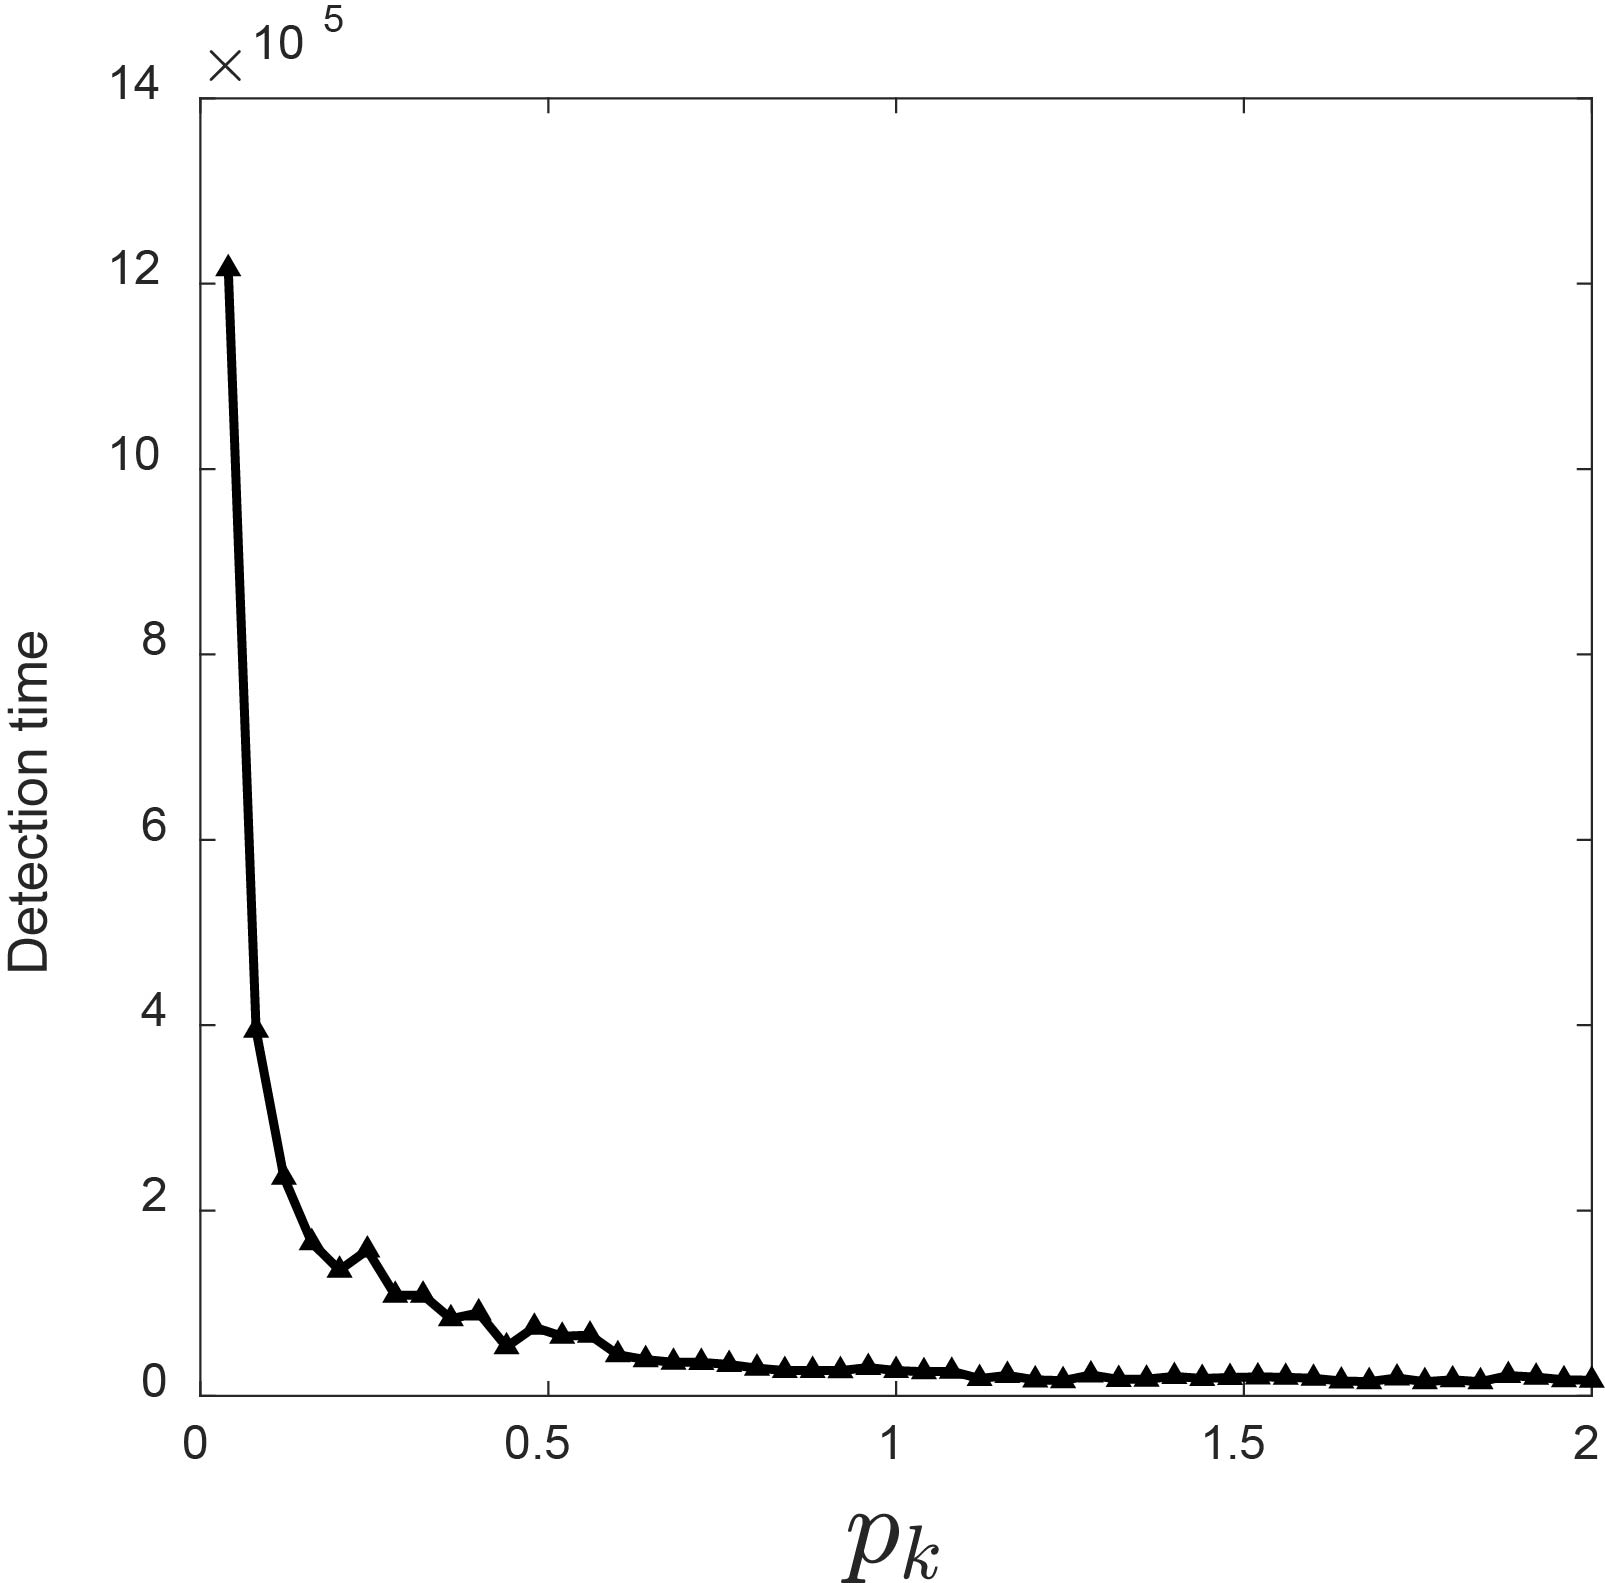
In order to further explore the performance of the algorithm, the influence of fluctuation intensity on detection speed is explored here. To uniformize the evaluation criteria, we defined an indicator called detection time , which is the difference between the instant of the topology change and the instant of the observer system to reach stability , i.e. . If the changes of after will not exceed a small threshold (we select 0.02 here.), the observer system is regarding as reaching stability. Figure 4 shows the topology detection time when changes from 0 to 2. It can be found that when the load fluctuates more violently, the topology detection will be faster on the trend. This is actually due to the load fluctuation has a certain driving effect on the adaptive state observer, which makes it converge to the real value faster without falling into a local stable value.
The evolution curve of detection time with the load fluctuation intensity .
Conclusion
This paper proposes a distribution network topology detection algorithm based on an adaptive state observer. The algorithm uses the observation capability of adaptive state observer to observe the position parameters, so the current distribution network topology connection can be inferred from the observed values of line states. Through rigorous mathematical derivation and simulation experiments, the effectiveness of the algorithm is verified. The timely identification of distribution network topology changes provides technical support for distribution network scheduling problems. In practical application, the central processing unit at monitoring center receives the data from PMUs. Then, these data after pretreatment are input of the virtual observer network. Based on our proposed algorithm, the differential equation in (3) can be computed by numerical integration. After the observer system reaches stable, the topology change can be detected by the estimation of , which can provide potential guidance for our subsequent application study.
References
1.
FarnesiS.MarchesoniM.PassalacquaM. and VaccaroL., Solid-state transformers in locomotives fed through AC lines: a review and future developments, Energies12(24) (2019), 4711.
2.
WuW.C. and XuT., Accelerated ADMM-based fully distributed inverter-based volt/var control strategy for active distribution networks, IEEE Transactions on Industrial Informatics16(12) (2020), 7532–7543.
3.
YoshizawaS. and HayashiY., Advanced voltage control based on short-time ahead voltage fluctuation estimation in distribution system, Electric Power System Research, 2020, 188.
4.
LiX.Y.ZhaoD.M. and GuoB.C., Decentralized and collaborative scheduling approach for active distribution network with multiple virtual power plants, Energies11(11) (2018), 3208.
5.
Saurabh Sihag, and Ali Tajer, Power system state estimation under model uncertainty, IEEE Journal of Selected Topics in Signal Processing12(4) (2018), 593–606.
6.
BabakmehrM.SimõesM.G. and WakinM.B., Compressive sensing-based topology identification for smart grids, IEEE Transactions on Industrial Informatics12(2) (2016), 532–543.
7.
DekaD.BackhausS. and ChertkovM., Structure learning in power distribution networks, IEEE Transactions on Control of Network System5(3) (2018), 1061–1074.
8.
LiaoY.Z.WengY. and LiuG.Y., Urban MV and LV distribution grid topology estimation via group Lasso, IEEE Transactions on Power Systems34(1) (2019), 12–27.
9.
GengJ.C.ZhangX.F. and GuoZ.M., Topology verification of low-voltage transformer areas based on discrete Fréchet distance and editing nearest-neighbors method, Electrical Measurement & Instrumentation54(5) (2017), 50–55.
10.
CavraroG.KekatosV. and VeeramachaneniS., Voltage analytics for power distribution network topology verification, IEEE Transactions on Smart Grid10(1) (2019), 1058–1067.
11.
NishikawaT. and MotterA.E., Comparative analysis of existing models for power-grid synchronization, New Journal of Physics17(1) (2015).
12.
WuX.Q.ZhaoX.Y. and LuJ.H., Identifying topologies of complex dynamical networks with stochastic perturbations, IEEE Transactions on Control of Network System3(4) (2016), 379–389.
13.
FarzaM.BouraouiI.M’enardT.Ben AbdennourR. and M’SaadM., Adaptive observers for a class of uniformly observable systems with nonlinear parametrization and sampled outputs, Automatica50(11) (2014), 2951–2960.