
Abstract
To determine the proper range of information quantity of traffic signs in the straight line sections of grassland highways, we have established virtual scenes of such sections of highways with varying levels of information quantity, and we have carried out an experiment on simulated driving. During the research, the method of principal component analysis (PCA) is adopted, and indicators related to eye movements are selected, which prove to be sensitive to the information quantity of traffic signs. Moreover, the pattern of variations is analyzed to examine how the information quantity of traffic signs may impose an impact on drivers’ visual load, and the experimental results are assessed and verified in a subjective manner. The research findings indicate that the information quantity of traffic signs could impose a significant impact on the fixation duration, saccade duration, saccade amplitude and fixation entropy of drivers. Within the proper range of information quantity (20–30 bits/km), drivers have shown stronger ability to acquire and process information with higher searching efficiency and optimal strategy of allocating attention, which will facilitate safe driving. The subjective assessment of drivers’ workload has also proven the validity of the research findings.
Introduction
Information contained traffic signs plays a vital role in the management of road traffic system. In addition, it constitutes a critical part of the information of man-machine environment system. Encountered with proper quantity of traffic sign information, drivers are capable of drawing insights from road traffic environment in a more efficient, accurate and timely manner, so as to promptly adjust their driving behaviors. Insufficient or overloaded information of traffic signs will lead to heavier load on drivers’ visual recognition and cognition, compromising their capabilities of allocating visual attention while imposing a negative impact on their driving behaviors [1, 2]. At present, numerous studies have been conducted on this issue both at home and abroad. Smahel and Smiley identified the traffic sign information layout with optimal effect of visual recognition through visual and memory experiments of marker information [3]. Jiang and Zhou studied the impact imposed by signpost graphic symbols on drivers’ capabilities of recognizing symbols, thereby revealing the relationship between character and time of graphic symbol recognition while establishing standards of the information contained quantity graphic symbols [4]. Based on the information theory and the drivers’ mentality during visual recognition, Wang et al. proposed the standards for assessing the information quantity of traffic signs, and concluded that the proper threshold of information overload in traffic signs shall be set as 6 pieces within the same location, whereas the information density overload threshold of traffic signs in highway sections shall be set as 18 pieces per kilometer [5]. Drawing inspiration from the information measurement method used in the information theory, Zuo et al. proposed the mathematical method for quantifying the amount of traffic sign information [6]. Based on their study, the maximum amount of information contained in a traffic sign shall be 286.3 bits, whereas larger or smaller amount is likely to hinder the transmission of information. Fan et al. set up the model for calculating the information density threshold of traffic signs located in road sections, and put forward the recommended value of the information density overload threshold of traffic signs located in road sections corresponding to varying speeds. Their research findings indicate that when the speed limit of a road section is set at 60, 80 and 100 km/h, the information density overload threshold of traffic signs would be 30, 22, and 18 pieces per kilometer, respectively [7]. Lu et al. examined the impact imposed by the quantity of traffic sign information on drivers’ cognitive load and their driving behaviors [8, 9]. Costa et al. estimated the distance from the initial fixation of drivers to the vertical signs, and found that such distance had a linear correlation with the driving speed and fixation duration. Based on their research findings, they recommended to increase the distance from the initial fixation of drivers, so as to enhance the safety of driving [10]. Liu et al. conducted a simulated experiment on visual recognition of dynamic signs on highways [11]. Their research findings indicate that the distribution of the drivers’ fixation points is highly correlated with the speed of changes and the variation of information quantity, whereas the validity of visual recognition would fall sharply when the information quantity exceeded five pieces. By conducting indoor simulation tests, Du et al. analyzed the quantitative relationship between the quantity of information contained in traffic signs and the time of reaction for drivers’ visual recognition, thereby providing the recommended value of reaction time for the visual recognition of signs located in urban roads [12]. Schnell et al. examined the impact imposed by the brightness and size of texts on the time required for drivers to recognize traffic signs with certain information quantity [13]. Their research findings indicate that the enhanced brightness of the symbol or the increased size of traffic signs would reduce the time required for drivers to acquire information. Lu et al. examined the impact imposed by the traffic signs with varying quantities of information on the cognitive load of drivers. Their research findings indicate that the subjective driving load is highly correlated with the quantity of information contained in traffic signs, and the time required for reaction lasts longer as the information quantity is increased [8]. Cheng et al. examined the drivers’ reaction time and EEG signals while fulfilling tasks of interpreting information in traffic signs, and found that the optimal threshold of information quantity would be 4 names of places for road guidance signs [14]. Xu et al. studied the features of drivers’ eye movement behaviors while recognizing the experimental information contained in the traffic signs [15]. Researchers adopted the response surface method for regression in the equation of eye movement speed under varying conditions, and identified the proportional relationship between the fixation duration and eye movements through comparison. Their research findings indicate that the duration of saccade is roughly equivalent to 1/5 of the fixation duration. Through the simulation test, Liu et al. examined the correctness and the reaction time required for the participants’ visual recognition of combined signs [16]. Their research findings indicate that the information threshold for combined signs with simple guiding graphics shall be set as 6 pieces, whereas the threshold for more complicated guiding graphics shall be set as 5 pieces.
Judging from our comprehensive analysis, the majority of the existing studies center around the quantity of information contained in the traffic signs at highway sections, ramps and intersections, whereas fewer studies focus on the information quantity of traffic signs located in the general environment of road driving and especially grassland highways. Therefore, to cope with the improper setting of information quantity of the traffic signs in grassland highways, it is necessary to study drivers’ visual recognition of the the quantity of information contained in traffic signs. During the study, we have taken the information quantity of traffic signs as the main control variable, and we have analyzed the relationship between such information quantity and the features of drivers’ visual attention by elaborating on their visual properties, and put forward the range of information quantity most adaptable to grassland highways. Our research findings are expected to provide theoretical guidance for the design and establishment of traffic signs located on grassland highways, further studies on the theories of traffic safety as well as road traffic engineering projects related to ecological restoration.
Simulated driving experiment
Quantification of information in the traffic engineering facilities
With a combined use of graphics, colors, texts and other signals, traffic signs could convey information contained in the road environment. While drivers recognize the information transmission, they experience the transition from ignorance into cognition. The quantity of information contained in a specific item is related to the number of varying states that the item may exist, in addition to the probability of these states to occur. Moreover, the quantity of information contained in traffic signs, or more specifically, the average quantity of information contained in each traffic sign, is related to the probability of the possible connotations of each sign. In this study, the Shannon’s information theory is adopted, and the formula for measuring the quantity of information contained in traffic engineering facilities is obtained and specified as follows:
where,
In terms of the composition, traffic signs consist of such components as words, graphics and symbols. For each subset, the probabilities of the varying elements to occur are not the same. However, it is assumed that such probabilities are the same so as to simplify the computation, then
Traffic engineering facilities set up in highway sections consist of numerous elements, including a large proportion of discrete data. Based on the features of traffic engineering facilities of the highway sections located in Inner Mongolian grasslands, it is found that they mainly consist of 9 types of elements such as Chinese characters, Arabic numerals, colors, and Mongolian. During the information transmission, each type of element has its importance to varying extents. Therefore, to obtain adequate quantity of information transmitted by each type of traffic engineering facilities in an effective manner, we need to identify the optimal method applicable to grassland highways. According to the statistical analysis of the varying elements of numerous traffic engineering facilities located in grassland highways, the method of Analytic Hierarchy Process (AHP) is adopted to assign weights to the importance of 9 types of traffic engineering facilities in highway sections. Subsequently, the quantity of information contained in each type of element along with its corresponding weight are specified in Table 1.
Information quantity and weights of 9 elements of traffic engineering facilities
By taking into account the information quantity and weight of each element, we may express the computational formula of the information quantity of traffic engineering facilities for highway sections as:
where,
Traffic signs.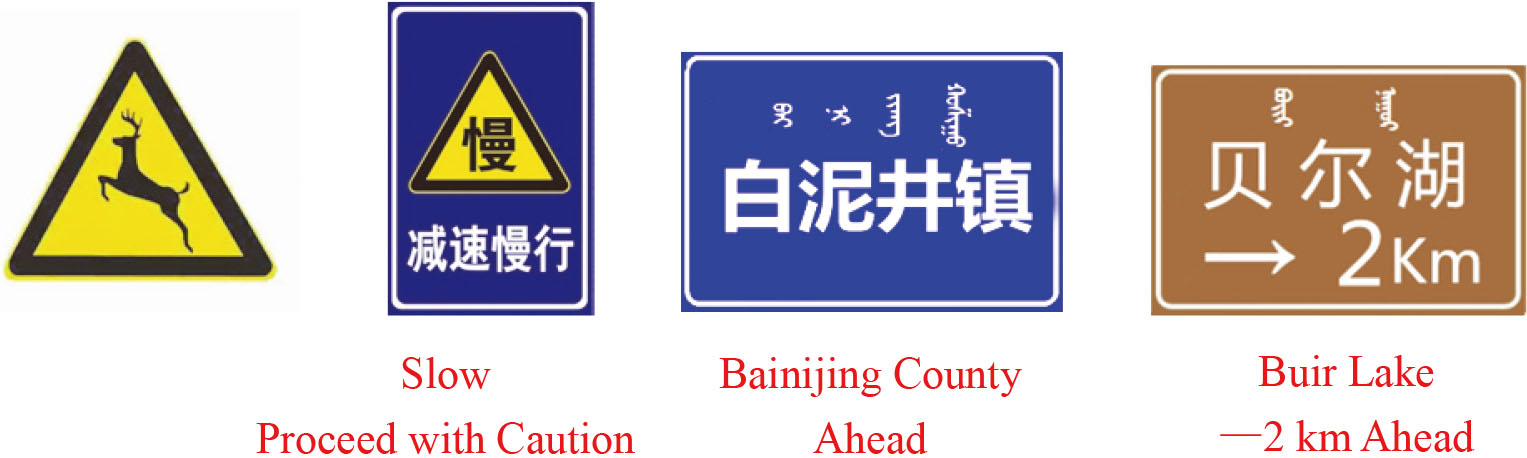
In this study, the aforementioned computational method is adopted based on the information theory to quantify the information contained in guiding facilities located in grassland highway bends. Subsequent to the quantification, it is found that the information quantity of the four traffic signs illustrated in Fig. 1 amounted to 1.45 bits, 14.36 bits, 11.86 bits, 10.83 bits, respectively.
Regarding the simulated driving system, the six-degree-of-freedom method is applied into the real vehicle cockpit, which was developed and produced by the French automobile manufacturer Renault. The simulated driving vehicle was equipped with a circular curtain in the front, enabling drivers to have a 180-degree subjective horizontal view. The system of tracking eyeball movements in the experiment was the SMI iView XTM HED helmet eye tracker developed and produced by the German company SMI (Senso Motoric Instruments), which was a head-mounted video eye-tracker in essence. The equipment adopted in the experiment is illustrated in Fig. 2.
Experimental equipment.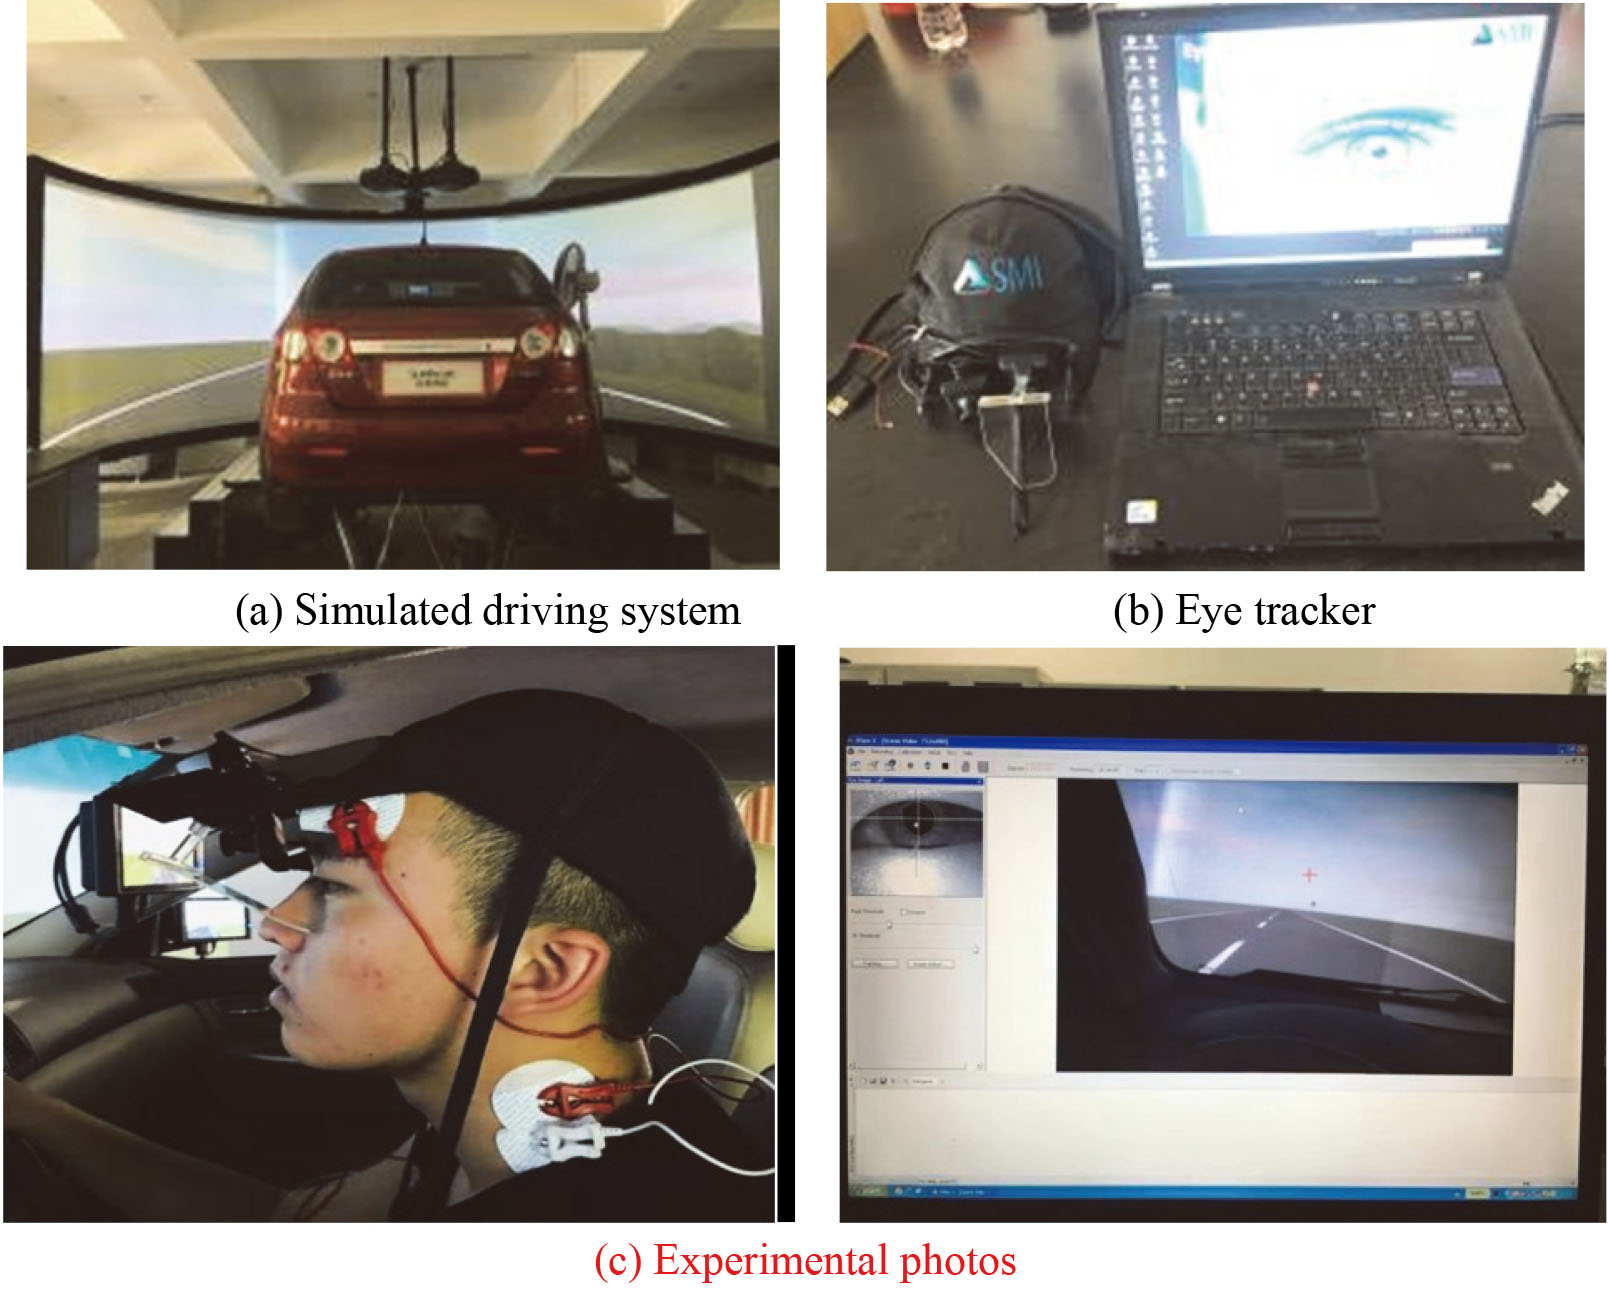
Examples of traffic signs with five levels of information quantity.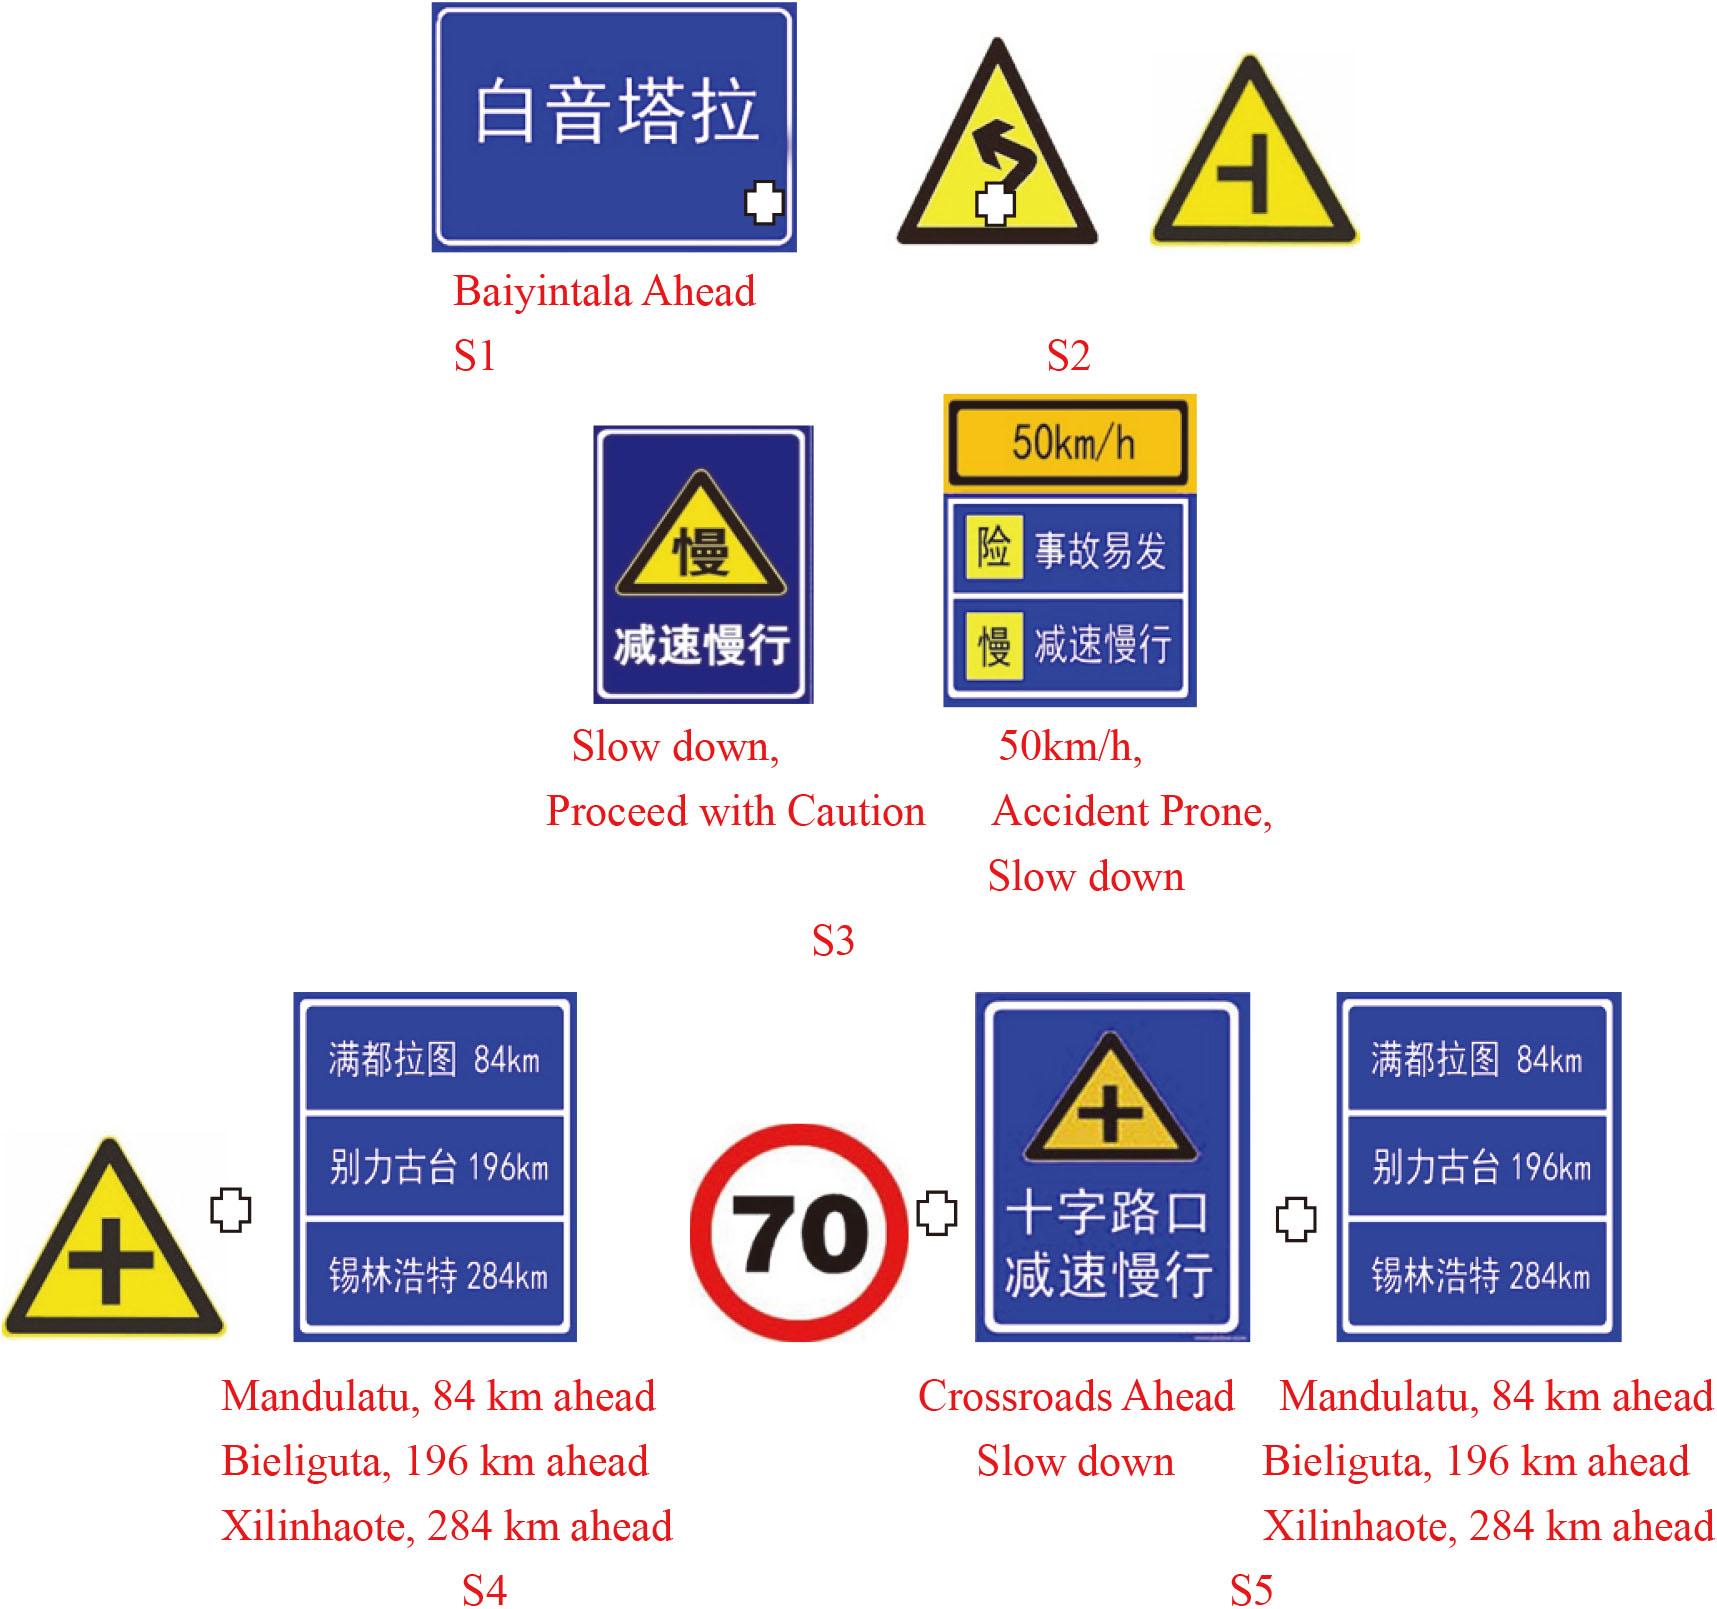
According to Li, the density of distribution for the information quantity of traffic signs in the straight line sections of Inner Mongolia grassland highway amounted to 0–10 bits/km in most of the cases [17]. Such perception is taken as the basic reference for establishing the simulated scenes, whereas the range of information quantity for the straight line sections in grassland highway is specified as follows: S0 (blank control), S1 (0–10 bits/km), S2 (10–20 bits/km), S3 (20–30 bits/km), S4 (30–40 bits/km), S5 (40 bits/km+). Examples of traffic signs for assessing the information quantity are illustrated in Fig. 3. The impact imposed by the information quantity of traffic signs on the visual properties of drivers is examined and analyzed, so as to identify the best environmental conditions of information quantity for drivers’ optimal visual attention and search mode. Through the establishment of simulated driving scenes, it becomes possible to effectively control numerous sorts variables during the driving experiment, and to fundamentally forestall the interference of irrelevant factors. Therefore, besides the varying sorts of traffic signs and the diversified levels set for information quantity, the simulated scenes for driving traffic environment are illustrated as follows:
The established simulated scenes for the grassland highway sections with a distance of 24 km was a typical secondary grassland highway equipped with two lanes. Its width amounted to 3.75 m, whereas the design speed was set at 80 km/h. In each level of information quantity, there were three repetition levels. In addition, the distance of straight line section for each level of information quantity amounted to 3 km. A bend was set in place to connect the straight line section of each level, with a radius of 500 m and a distance of 300 m. Neither traffic vehicles nor diversified landscapes were established in the simulated scenes so as to avert their impact on experimental results.
The simulated scenes are illustrated in Fig. 4.
Simulated scenes.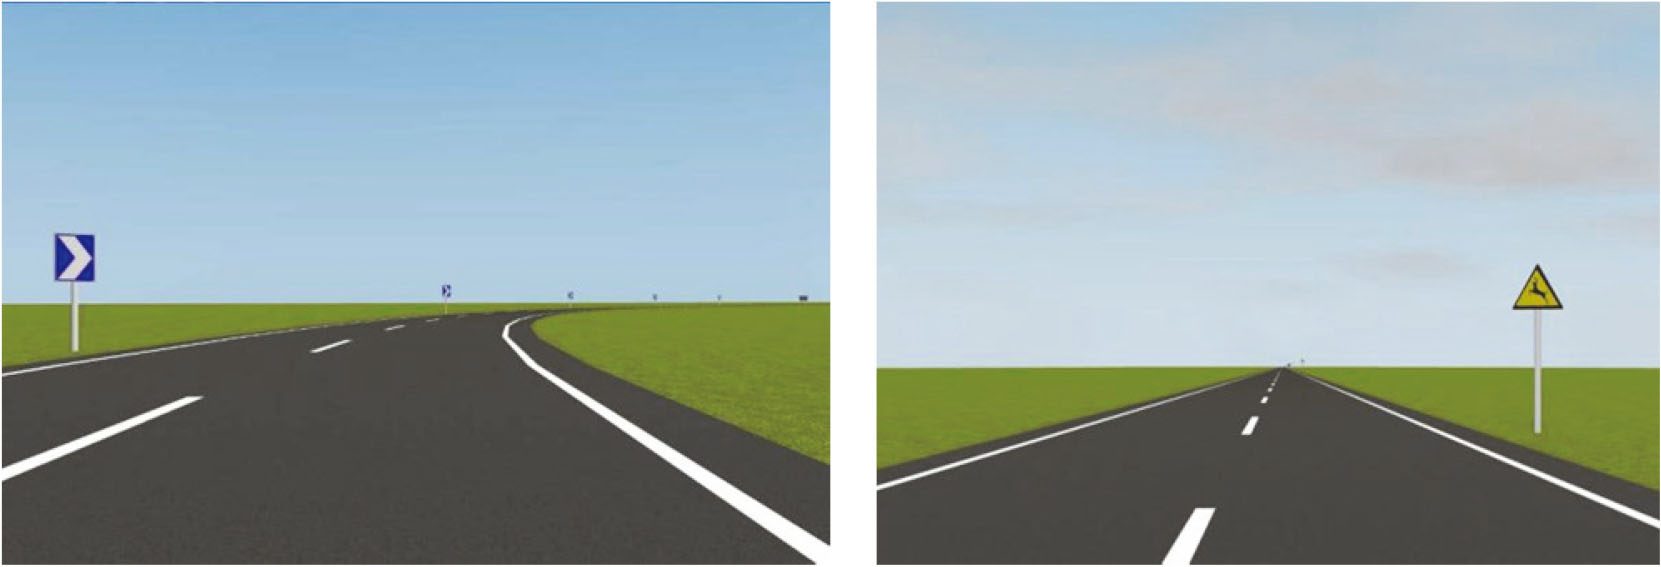
The research findings indicate that varying types of drivers mainly differ from each other in their driving habits and behaviors due to varying levels of driving experience, ability and personality [18, 19, 20]. Therefore, we have fully taken into account the gender, age and educational level during the experiments, so as to avoid the impact imposed by personal factors on the experimental results. As evidenced by our examination and analytical results of the existing people accountable for traffic accidents, drivers aged between 18 and 40 years old are the age group with a high incidence of traffic accidents [21, 22]. In addition, to minimize the impact imposed by drivers’ gender and educational level on the experiments, the male drivers with certain driving experience were selected to take part in the simulation driving experiments.
During the experiment, 30 drivers were selected. All test drivers were in good health, who possessed the naked or corrected visual acuity of above 5.0 in the logarithmic visual charts as well as the Chinese legal driving license. The test drivers were aged between 19 and 42 years old (with the average age of 28.2 years old and the standard deviation of 5.8 years). Their driving age ranged between 2 and 8 years (with the average driving age of 8.3 years and the standard deviation of 3.6 years), whereas the driving mileage amounted to 0.7
Drivers’ visual properties
Proper indicators of measuring eye movements shall be able to reflect the features of drivers’ visual attention and visual load in multiple dimensions. Correspondingly, it shall be noted that the system of assessment indicators for eye movements can impose a direct impact on the rationality, accuracy and holisticity of the final results of visual assessment. Based on the connotations of the indicators related to drivers’ eye movements, each indicator is able to reflect drivers’ response to the changes in terms of the content of research in multiple dimensions. Moreover, these indicators are inevitably linked with each other to some extent, thus leading to accumulative and overlapping information measured by such indicators. According to the aforementioned analysis, during the establishment of the assessment indicator system, the holistic indicators are taken into account so as to reveal all aspects of information. Besides, the redundant indicators of information are removed through mathematical methods, so as to convert a large number of linearly related indicators into unrelated ones in smaller numbers. This procedure is referred to as the reduction of dimensionality. Subsequent to completion of this step, the assessment indicator system is simplified and clarified, and more importantly, it becomes more capable of reflecting the features of the changing laws of the data in a holistic manner.
Basically, the method of principal component analysis is adopted to reorganize numerous indicators that are correlated with each other to a certain extent, and to convert them into a new set of unrelated holistic indicators used for replacing the original indicators.
The procedures of computation through the principal component analysis are specified as follows:
It is assumed that there are n samples in total, and that there are p variables in each sample, then we may form a matrix of
(1) The correlation coefficient matrix is calculated:
The computational formula for the correlation coefficient is specified as follows:
(2) The eigenvalues and eigenvectors are solved:
Subsequently, the equation of
(3) The rate of contribution is measured by the principal component, and the rate of cumulative contribution is calculated:
For the samples, the rate of contribution by the principal component
Finally, the principal components consisting of eigenvectors that correspond to eigenvalues are selected, with a cumulative rate of contribution exceeding 85% and the eigenvalue exceeding one in general. According to the requirements of the principal component analysis as well as the research methodology and outcomes on drivers’ eye moments for traffic safety [23], three indicators related to drivers’ eye movement behaviors are selected, namely, fixation, saccade and blink. In particular, the detailed indicators are standardized, which include blink duration (BD), fixation duration (FD), pupil diameter (PS), saccade duration (SD), saccade amplitude (SA), saccade peak velocity (SPV) and saccade average velocity (SAV). In addition, the correlation matrix and related P values are calculated based on the standardized indicators, and the KMO and Bartlett sphere tests are conducted. Judging from the experimental results, the fixation duration, saccade duration and saccade amplitude are eventually selected as the indicators of assessing the impact imposed by the quantity of information contained in traffic engineering facilities on drivers’ visual features. Further analysis and discussions are specified as follows.
Analysis and discussion of fixation duration
Figure 5 has illustrated the trend of variation of the average fixation duration for drivers’ visual recognition of varying levels of information quantity in traffic signs at three driving speeds.
Comparison of the variation of the average fixation duration for drivers’ visual recognition of varying levels of information quantity in traffic signs at three driving speeds.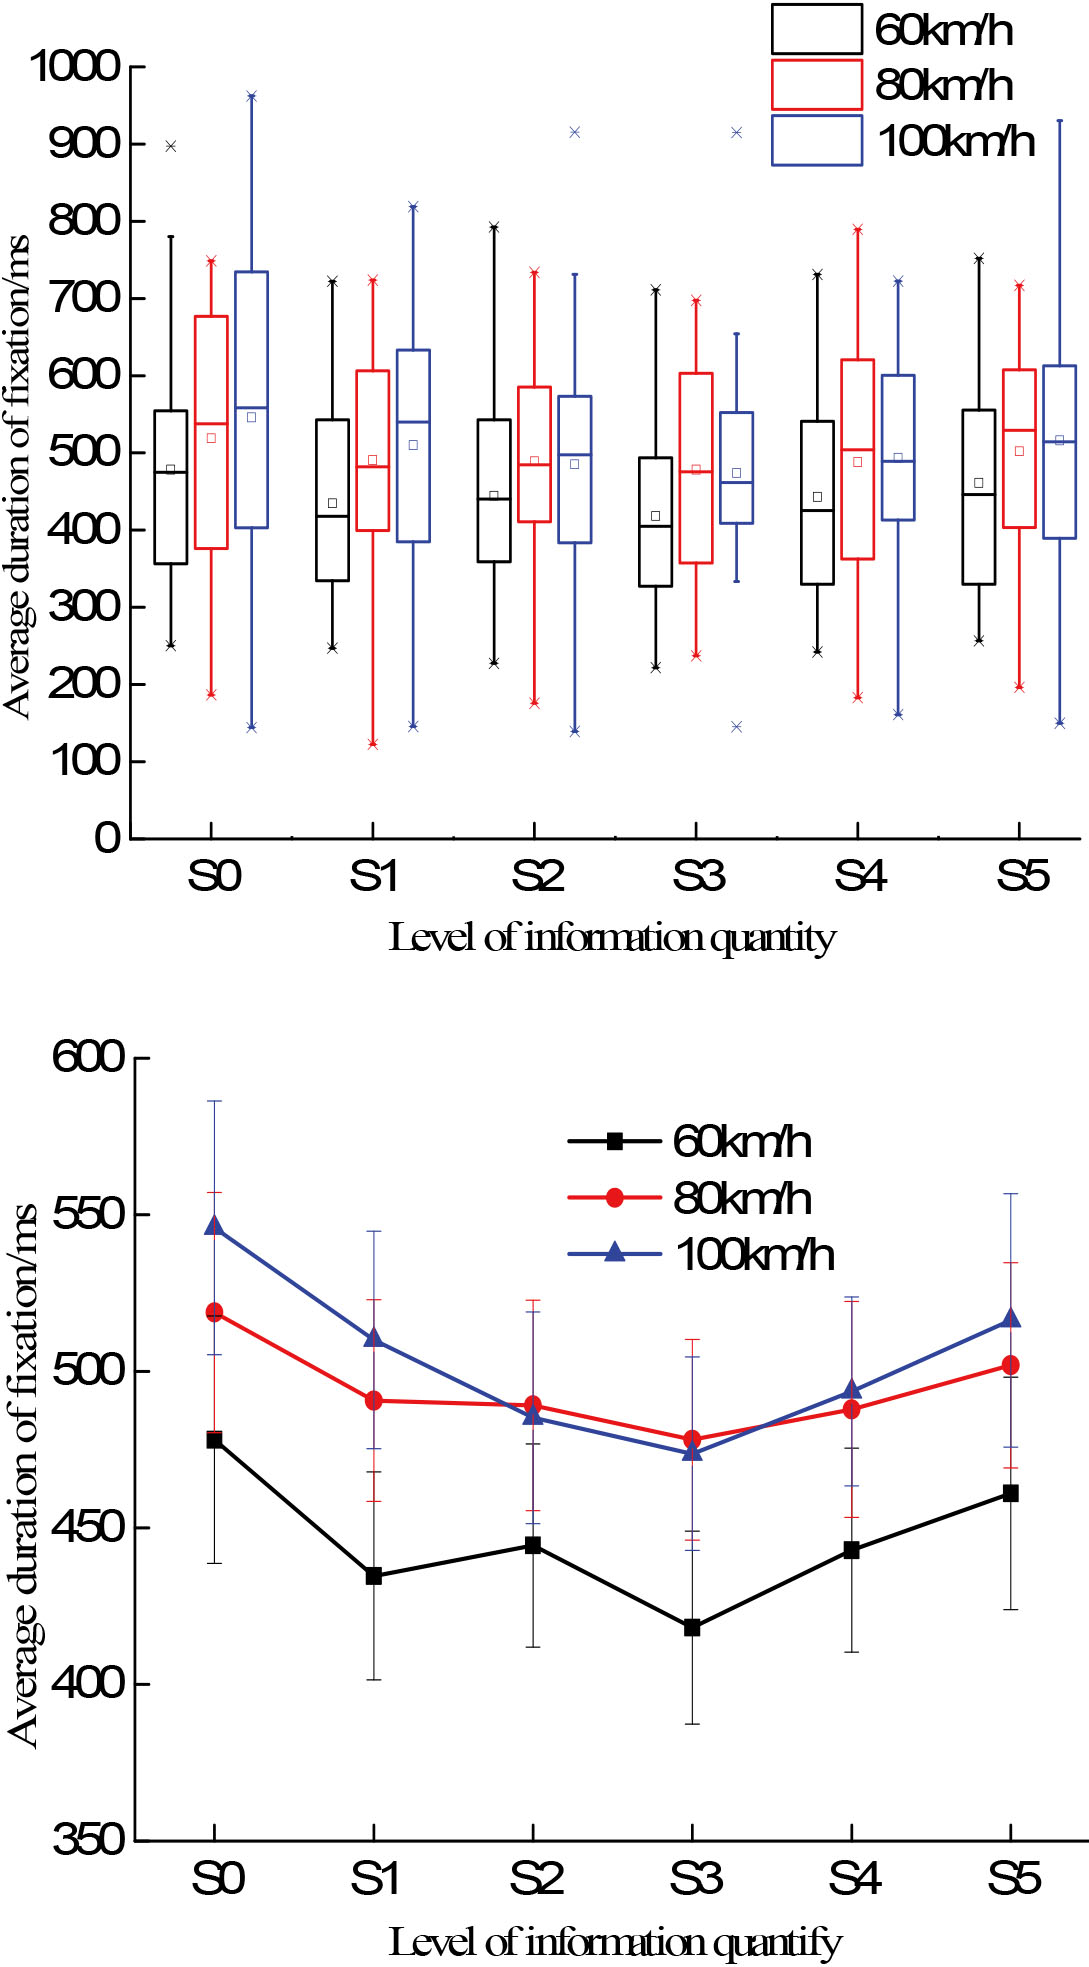
As shown by Fig. 5, the average fixation duration of drivers at the three different speeds is the smallest under the condition of S3 information quantity. Through comparison of the results of the box-plot, it can be concluded that the dispersion degree of average fixation duration under circumstances of S3 information quantity is smaller than that under other levels of information quantity. The research findings indicate that under such circumstances, drivers’ average fixation duration proves to be more stable and concentrated, drivers’ visual attention is more stable, whereas the drivers’ of capabilities of perceiving and acquiring environmental information related to road traffic is also stronger. Drivers could process the target information in an efficient manner, visual coordination is at its optimal level, whereas the visual load is small. Such status proves to be conducive to drivers’ safe driving.
Figure 6 has shown the law of variation of the average saccade duration for drivers’ visual recognition of varying levels of information quantity in traffic signs at three driving speeds.
Comparison of variation of the average saccade duration for drivers’ visual recognition of varying levels of information quantity in traffic signs at three driving speeds.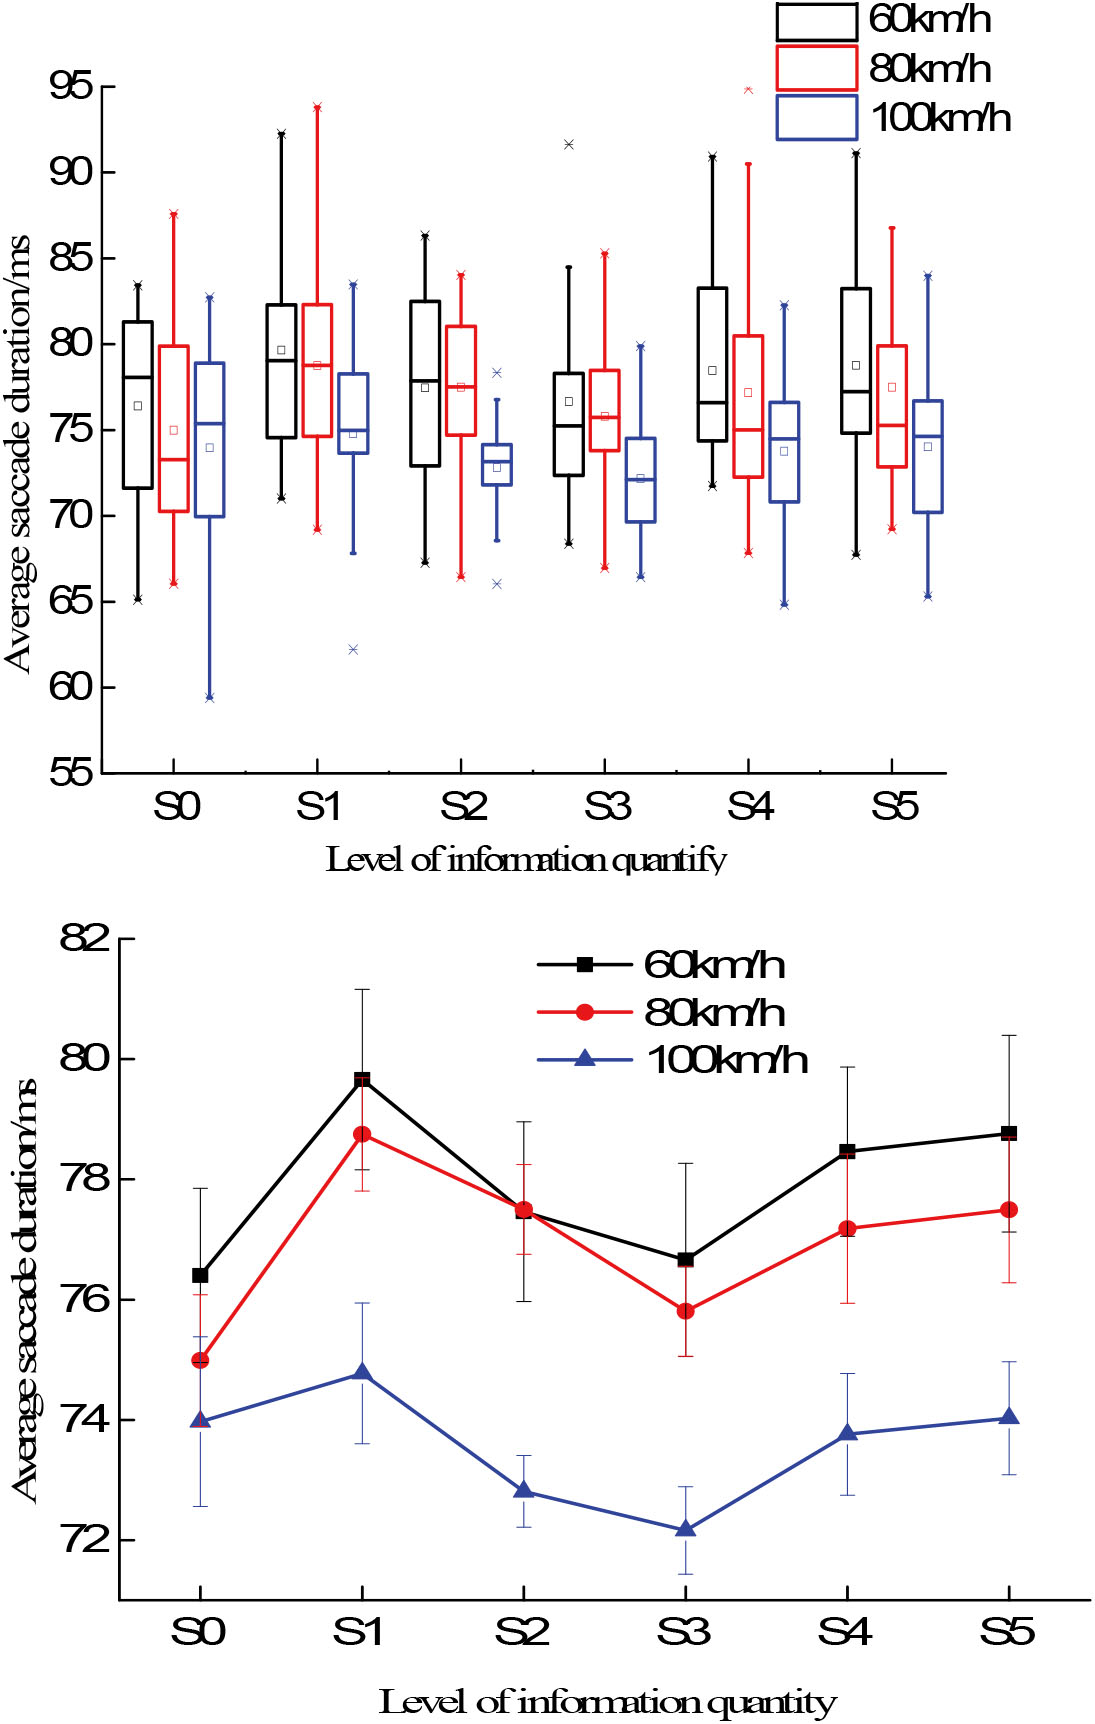
As shown by Fig. 6, the average saccade duration of drivers at three driving speeds is the smallest under circumstances of S3 information quantity. Through the comparison of the results of the diagram, it can be concluded that the dispersion degree of average fixation duration under circumstances of S3 information quantity is smaller than that under other levels of information quantity. The research findings indicate that drivers’ mode of searching information is more stable, drivers’ overall visual coordination leads to better effects, whereas drivers’ searching efficiency of acquiring environmental information on road traffic is also higher. Drivers could promptly capture the useful information, and their ability of identifying the target information is stronger. Such status proves to be conducive to drivers’ safe driving.
Figure 7 has shown the law of variation of the average saccade amplitude for drivers’ visual recognition of varying levels of information quantity in traffic signs at three driving speeds.
Comparison of variation of the average saccade amplitude for drivers’ visual recognition of varying levels of information quantity at three driving speeds.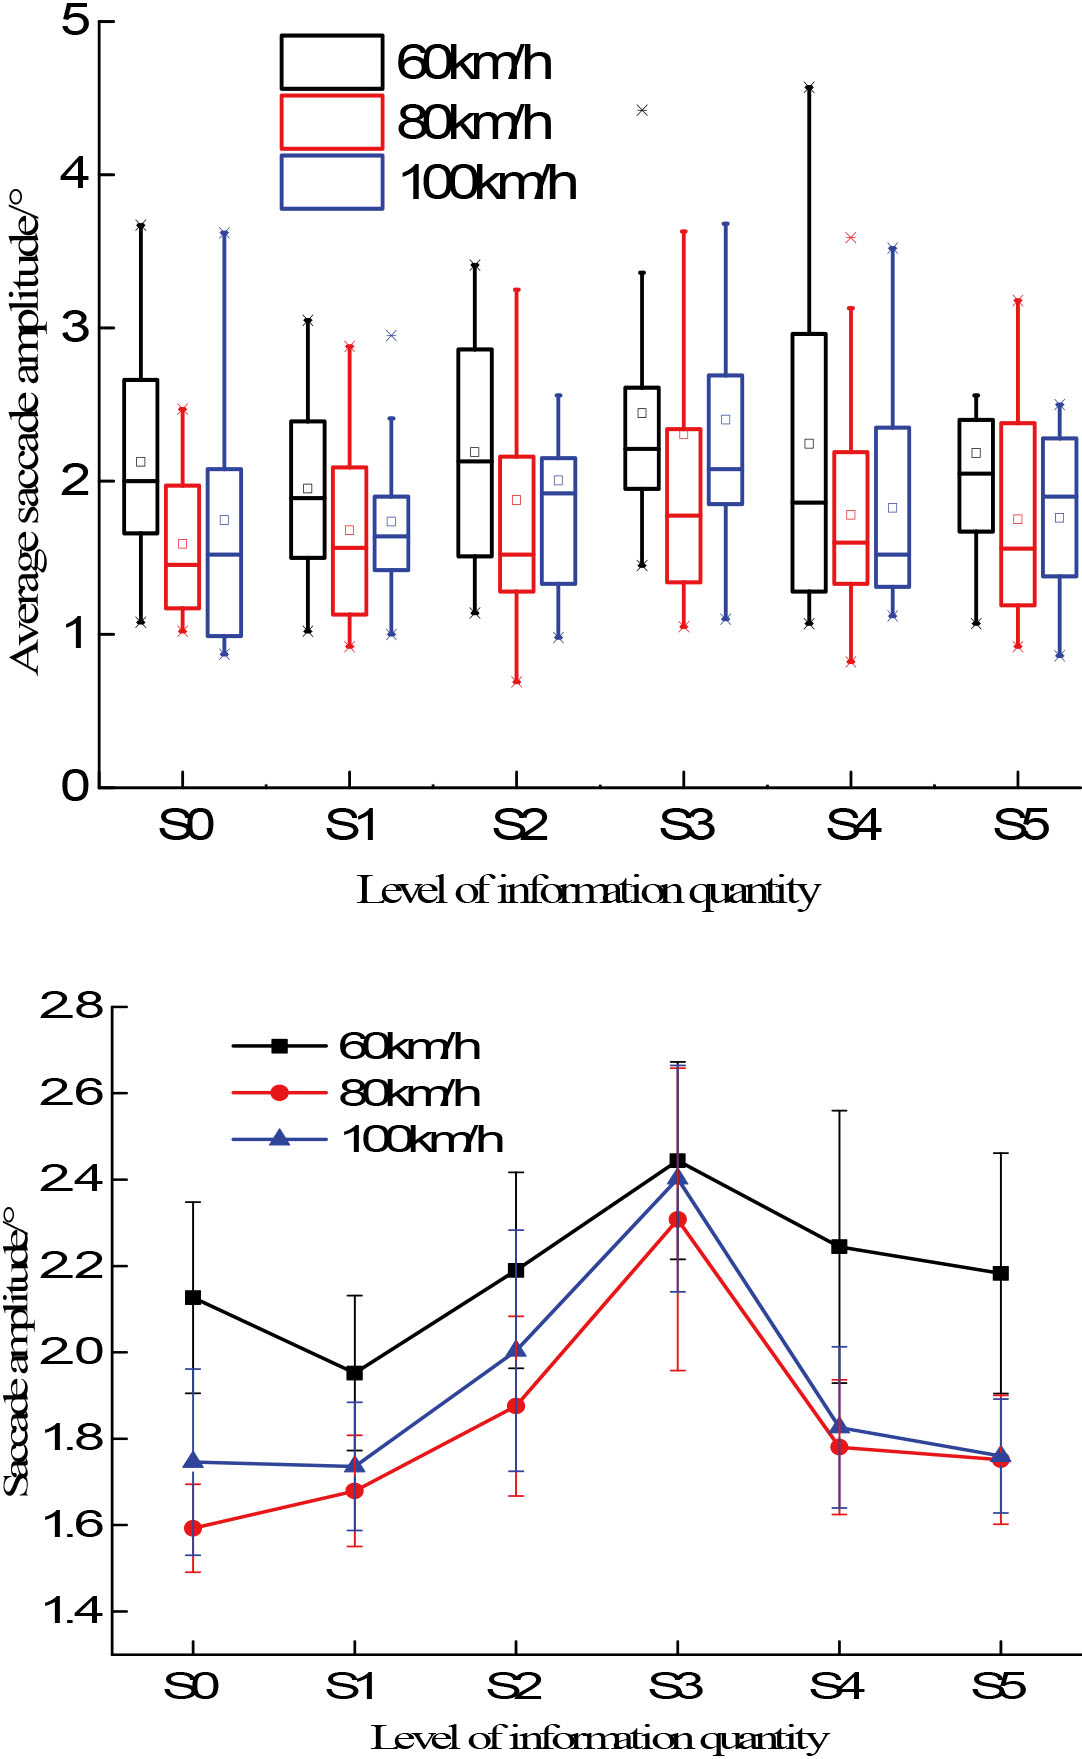
Saccade amplitude allows researchers to effectively measure drivers’ depth of attention while they are searching for information during driving. As shown by Fig. 7, the average saccade amplitude of drivers at three driving speeds was the largest under circumstances of S3 information quantity. Through the comparison of the results of the diagram, we may conclude that the dispersion degree of average fixation duration under circumstances of S3 information quantity is smaller than that under other levels of information quantity. The research findings indicate that while searching for environmental information on the road traffic, drivers are able to obtain more information related to road traffic environment information each time they gazed. This enables drivers to observe and draw insights from the surrounding traffic environment, while effectively relieving their tension and improve driving safety.
Entropy refers to the parameter that characterizes the state of matter in thermodynamics. This indicator is generally adopted to measure the degree of confusion in the system before being introduced into signal processing to describe the uncertainties of information. Bao and Boyle first adopted the entropy rate to analyze the visual properties of drivers [23].
The rate of fixation entropy refers to the randomness of drivers’ visual saccade during driving. The entropy rate is proportional to the areas of interest that drivers are able to notice during equal distance and driving time. The greater the entropy rate, the more areas the drivers are able to focus with shorter average time of fixation duration. On the other hand, the smaller the entropy rate, the drivers risks paying attention to the longer average fixation time. In case drivers’ fixation target is related to the driving task and proves to be effective. In addition, the greater the fixation entropy rate, the better the drivers’ mode of visual search, and the more conducive it is to the driving safety [24].
In terms of drivers’ visual recognition of varying levels of information quantity in traffic signs, the fixation entropy rates with three driving speeds of 60 km/h, 80 km/h and 100 km/h are calculated respectively, as illustrated in Fig. 8.
Fixation entropy rate for drivers’ visual recognition of varying levels of information quantity in traffic signs at three driving speeds.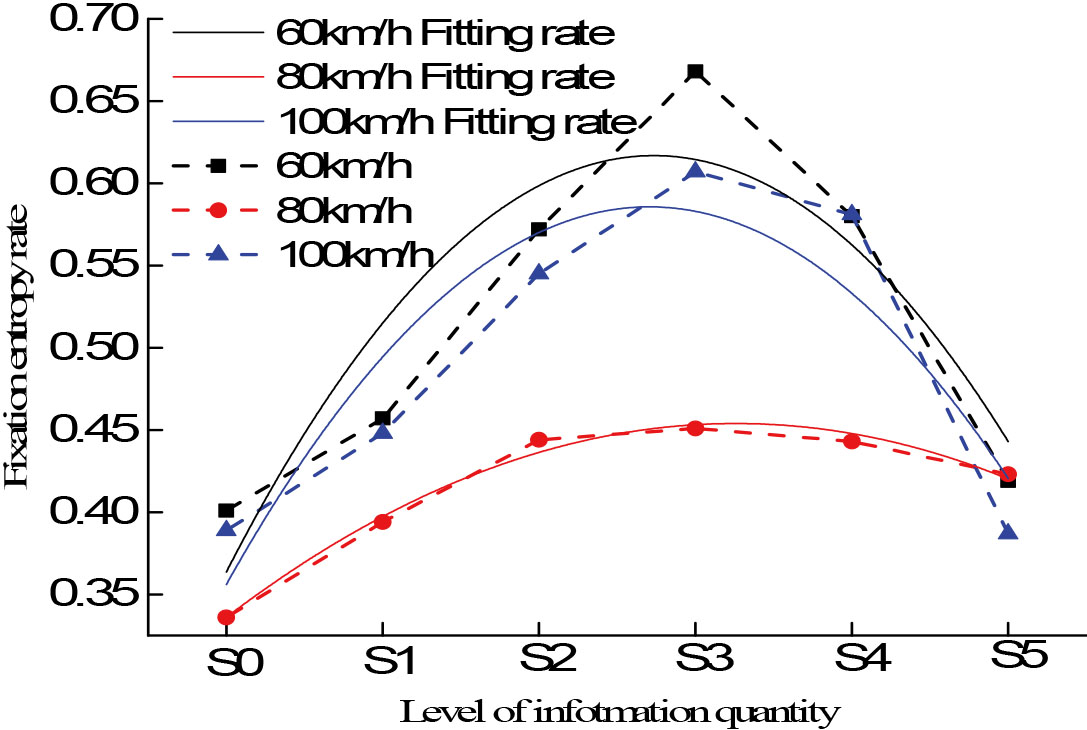
Radar chart of total task load index at varying levels of information quantity.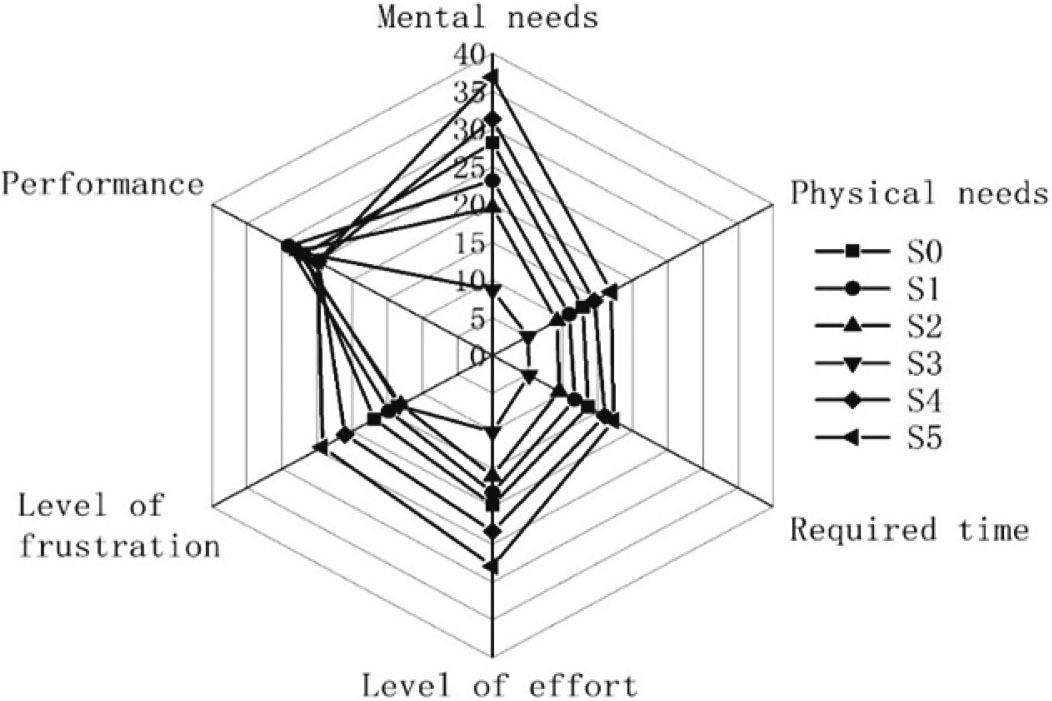
Judging from the tests on drivers’ visual recognition of varying levels of information quantity in traffic signs at three driving speeds, it is found that the fixation entropy rate has reached the maximum threshold in the case of S3 information quantity. The research findings indicate that drivers’ fixation behaviors in the case of S3 information quantity would feature strong duration and frequency, more random visual saccade, and the best strategies of allocating attention. In other words, drivers are able to obtain more information related to traffic environment within the same time, and to recognize the signals warning against danger in advance so as to ensure driving safety.
To cope with the improper provision of information quantity in traffic sign in grassland highways, we have studied the drivers’ visual recognition of information quantity in traffic signs based on their visual properties in the paper. During the study, we have taken the information contained in traffic signs as the primary control variable, and we have analyzed the relationship between the information quantity of traffic signs and the visual attention of drivers. Furthermore, we have put forward the range of information quantity most adaptable to grassland highway. The research findings are of practical value to the design and establishment of highway traffic signs, and are expected to provide reference for developing optimal countermeasures of preventing traffic accidents and training the driving skills of drivers in particular. In addition, we have adopted the NASA-TLX scale to assess the subjective driving load derived from drivers’ recognition of traffic signs under varying levels of information quantity, so as to verify the influencing mechanism of information quantity in traffic signs on drivers’ eye movement indicators and the fixation entropy rate.
NASA-TLX scale is the method most widely adopted in measuring multi-dimensional subjective loads. The approach has been extensively applied into ergonomics or human system engineering at home and abroad. For instance, the method can be used to assess the subjective load during assignments in such areas as aviation, aerospace, transportation and weaponry industries [25]. This method is applied into the assessment of drivers’ subjective driving load from six dimensions, namely, physical needs, mental needs and required time, in addition to levels of effort, frustration and performance. Figure 9 has illustrated a radar map of the total indexes of drivers’ subjective task load under each level of information quantity. The final score of the driving task at each level of information quantity can be obtained through the division of the total task load index by the weight, as shown in Fig. 10.
Task load score under each level of information quantity.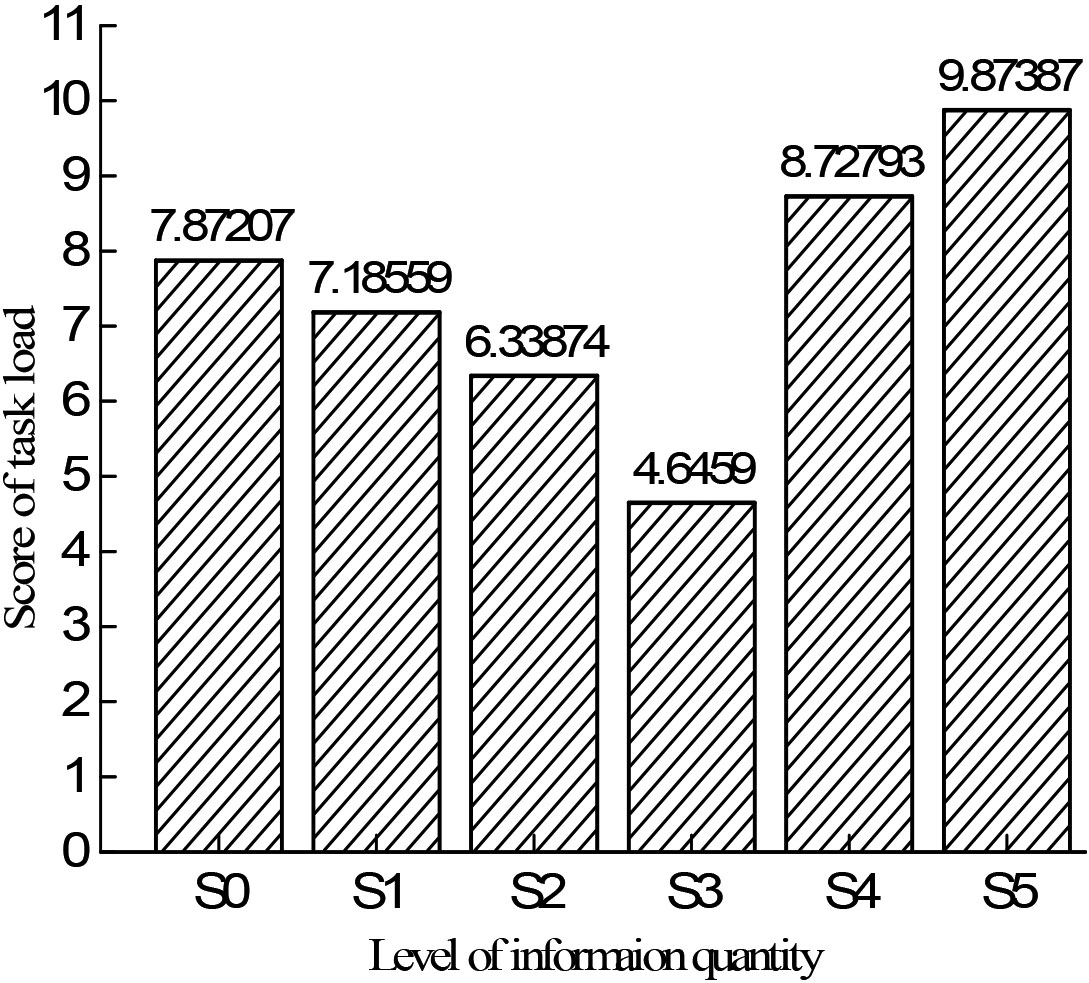
According to the aforementioned analysis, we have identified the subjective load of the test drivers through simulated driving experiments. The research findings indicate the trend of declines first before increases with enhanced levels of information quantity when drivers recognize traffic signs with varying amounts of information. It is found that drivers have the smallest mental burden under circumstances of S3 information quantity. In addition, their driving experience proves to be more comfortable, which would facilitate their recognition of information contained in the road traffic environment. The drivers are also more capable of correctly controlling the vehicle, so as to ensure driving safety. The results of subjective load assessment for drivers consist with analytical results of their eye movement indicators.
To examine the proper range of the quantity of information contained in traffic signs for the straight section of grassland highways, six traffic engineering facilities are set up with varying information levels to analyze the impact imposed by such facilities on drivers’ visual features in the straight section of the grassland highways. Based on the analysis, the conclusions of the research are specified as follows:
Under circumstances of S3 information quantity, drivers’ average saccade duration at the three speeds of 60, 80 and 100 km/h is the shortest. In addition, compared with other cases, the average saccade duration under S3 information quantity features smaller dispersion, indicating that drivers have more stable saccade features and stronger capabilities of processing road information with smaller visual loads. Under such circumstances, they are more able to ensure safety of driving. Under circumstances of S3 information quantity, drivers’ average saccade duration at the three speeds of 60, 80 and 100 km/h is the shortest. In addition, compared with other cases, the dispersion of the average saccade duration under S3 information quantity is the smallest. The research findings indicate that under such circumstances, drivers are able to search for information in road traffic environment in a more efficient manner, and are more able to quickly capture useful information and to spot target information. Under circumstances of S3 information quantity, drivers’ average saccade amplitude at the three speeds of 60, 80 and 100 km/h is larger, whereas the dispersion degree of the average saccade range is relatively small compared with other levels of information quantity in traffic signs. The research findings indicate that under such circumstances, when drivers search for information in road traffic environment, they are able to obtain more information related to the environment in each of the saccades. This will enable them to observe and construe the surroundings, and effectively reduce their tension and enhance the safety of driving. To assess the subjective driving load of drivers, the NASA task load index is adopted. When drivers recognize the traffic signs at varying levels of information quantity, their subjective load is found to be the smallest under S3 information quantity. The research findings indicate that the test drivers have less psychological burdens under S3 information quantity with stronger sense of driving comfort. Such level of information quantity also proves to facilitate drivers’ visual recognition of information in road traffic environment and to enable them to correctly control their vehicles, thereby ensuring the safety of driving. The research findings on the drivers’ subjective load assessment consist with aforementioned analytical results of drivers’ eye movement indicators. The features of drivers’ visual recognition are taken into account, in addition to the trend of variation of their visual load, and it is recommended that the information quantity of traffic signs in the straight section of grassland highways shall be set at the range between 20 and 30 bits/km.
Our findings in this paper are of great significance for optimizing the setting of highway traffic signs and enhancing the level of traffic safety. In the subsequent studies, researchers are advised to consider multi-source data indexes, such as test drivers’ ECG or EEG, driving operation behavior, and vehicle operating status in road environments of various sorts, and are also recommended to carry out an in-depth analysis on the influencing mechanism of the information quantity of traffic signs on drivers.
Footnotes
Acknowledgments
The work was financially supported by National Natural Science Foundation of China (51768057).