
Abstract
The crossing compression of retinal artery and vein is closely related to retinal vein occlusion, so detecting the contraction angle of the crossed vein blood vessel can assist to diagnose the retinal vein occlusion diseases. Through pretreating methods such as filtering, enhancement and edge extraction, the binary edge images can be extracted. The candidate feature points can be obtained by the corner point detection method based on chord-to-point distance accumulation (CPDA). The self-adaptive rectangular filter is used to screen out the crossing point of candidate angle, so as to fit the edge curves and figure out the contraction degree of vein. The experimental results show that this algorithm can better detect the contraction degree of crossed vein blood vessel, with an average error remaining at
Keywords
Introduction
Retinal vein occlusion [1, 2] is a major cause of visual loss in patients, which belongs to eye diseases resulted from multiple factors. Either vascular abnormality or haemodynamics anomaly can lead to retinal vein occlusion. Medically, it is widely considered that the vein vascular contraction due to crossing compression of retinal artery and vein [3, 4] closely relates to retinal vein occlusion. So we can analyze and diagnose the branch retinal vein occlusion situation by judging the contraction degree of vein blood vessel at the crossing compression place of retinal artery and vein. Recently, optical coherence tomography angiography (octa) is mainly used in medicine to measure the macular blood flow density, foveal avascular area (FAZ) and foveal retinal thickness in patients with retinal vein occlusion to judge the occlusion, in the past, optical coherence tomography was mainly used to evaluate central retinal vein occlusion coherence tomography (OCT) and fundus fluorescein angiography (FFA) is used to identify whether there is macular edema and the degree of retinal ischemia [5]. And the direct detection of the contraction degree of vein blood vessel at the crossing compression place of retinal artery and vein is mainly labeled and calculated artificially by professional ophthalmologists. This method not only needs a large number of practitioners but also is low-efficient. Besides, because different ophthalmologists have different medical skills and levels, there may be a great measuring error. Faced with massive image data, the ophthalmologists have to spend a lot of time to process them, which may make the patients to miss their golden time of therapy, and may result in the ophthalmologists’ visual fatigue, measuring error, and misjudgment of pathogenic condition at the end. Thus, an automatic angle detection method of crossing compression of retinal artery and vein is required to reduce the data processing time and eliminate the individual difference led by the ophthalmologists with different medical skills and levels.
This paper establishes an angle detection system of crossing compression of eyeground retinal artery and vein, which replaces the manual detection mode with automatic mode, thereby obtaining the objective detection results for aiding the diagnosis of eye diseases. Figure 1 shows the system flowchart. First, by pretreating the eyeground images collected,which include contrast enhancement, smoothing and sharpening [6], binary segmentation and edge extraction, the binarized retinal blood vessel images are acquired. Then, through the CDPA method [7, 8, 9, 10], the candidate corner points are screened out, and the self-adaptive rectangular filter [11, 12] is utilized to screen out the candidate corner points and get the crossing points. Later, the corner points and blood vessel edge information are used to separate the two edges of blood vessel. Finally, the vein’s crossing compression angle is computed by edge fitting and obtaining the extremum point of fitting curves.
Flowchart of angle detection system for crossing compression of retinal artery and vein.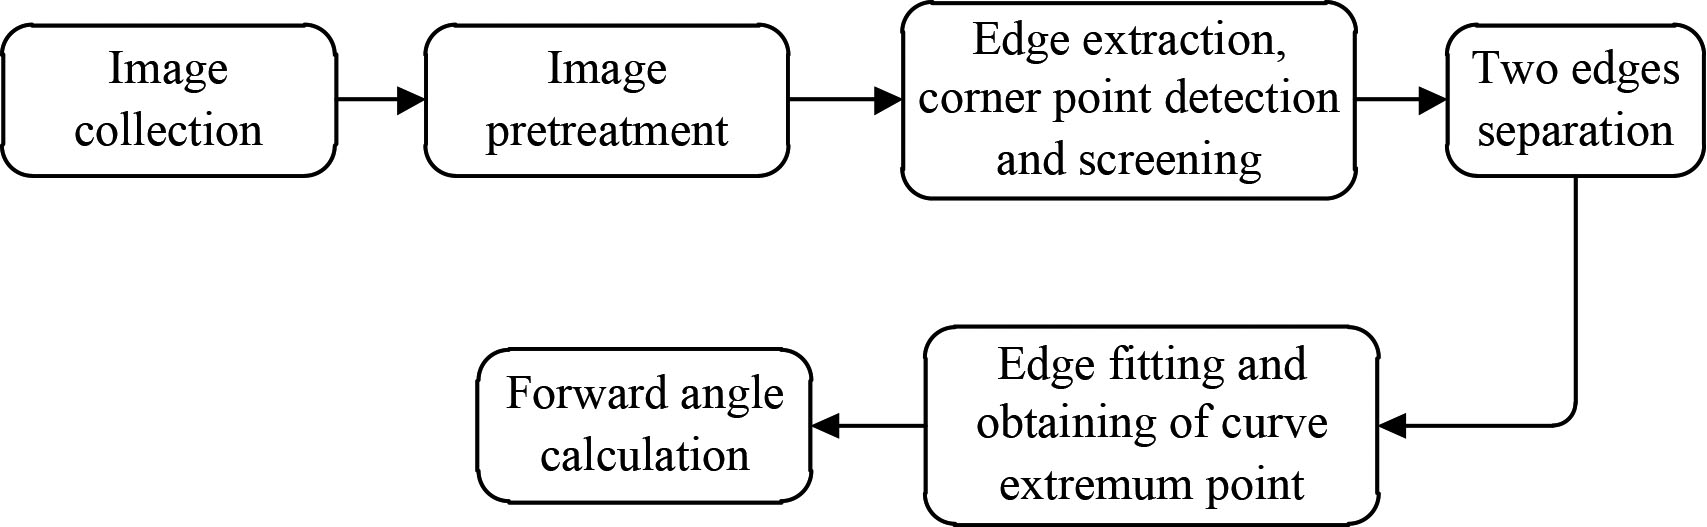
Eyeground image pretreatment
In the process of collecting retinal images, due to the influence of collection condition, sensor problem and so on, they often have such problems as uneven illumination and low noise contrast ratio, which greatly affects the treating effect. In order to eliminate these adverse effects and improve accuracy, it is indispensable to pretreat eyeground images. Pretreatment involves the following steps:
Take the green channels that blood vessel profile is the most different from the background as the subsequent treating object. Because noise often appears as isolated pixel points or pixel blocks that cause strong visual effects in the image, in other words, the appearance of noise will interfere with the image and make the image unclear [13]. Use Gaussian filter to perform weighted average on the images, to make every pixel of the images can be determined by itself and its neighborhood pixels, so that most Gaussian noises can be eliminated and images can be smoothened. Use illumination equalization treating [14] to eliminate the uneven illumination in the images. Image enhancement is to highlight the important information in the image according to specific needs, weaken or remove the unnecessary information. Use image enhancement to enhance the image that have received illumination equalization treating, to strengthen the contrast ratio of blood vessel and background, which is good for blood vessel separation [15]. Conduct binary segmentation on the enhanced eyeground images [16, 17, 18], and use themaximum inter-class variance method (OTSU) [19, 20] to segment blood vessel from the background. Use canny algorithm to extract the edge of the binarized blood vessel images.
Comparison before and after pretreatment.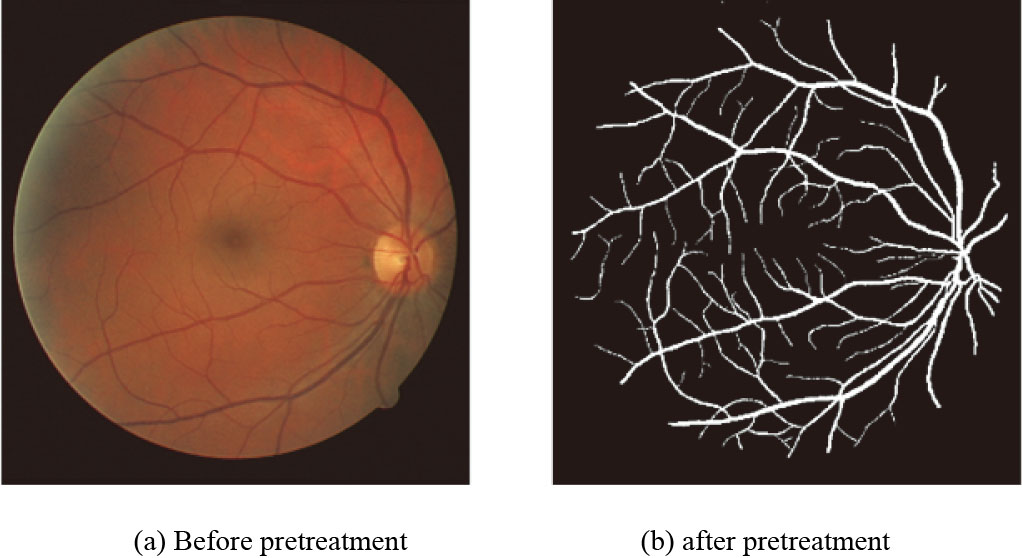
As shown in Fig. 2, throuth above steps, a clearly segmented blood vessel image can be obtained from the fundus diagram, then the candidate corner point can be got by CPDA corner point detection method. This detection method connects two points to get a chord, meanwhile moves both points to constantly change the chord, then figures out the distance accumulated value from the tested point to chord and takes it as the discrete curvature estimation of this point, and finally screens the discrete curvature estimation to get candidate corner points.
After performing CPDA corner point detection on binary images, we can get the candidate corner points. Later, these candidate corner points are screened by self-adaptive rectangular filter to acquire the corner point of artery and vein crossing compression.
The images obtained after screening by self-adaptive rectangular filter are still eyeground images, only the selected small part of which are effective corner points, while the others of which are all invalid data. Among eyeground images, invalid data occupies the majority of data size, which will not only cause huge calculation burden to subsequent steps, but also interfere the following steps. Hence, in order to reduce invalid data size and facilitate the subsequent edge separation and fitting, it is first to use self-adaptive rectangular frame or artificially frame select ROI region, and then the images of blood vessel under vein crossing compression at the to-be-tested angle are obtained from eyeground images. Figure 3 shows the corner point position after ROI region is selected.
Corner point position.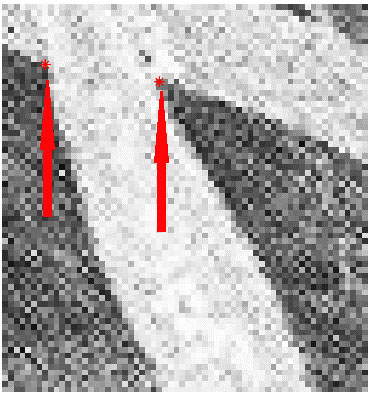
After extracting blood vessel edges by using canny algorithm [21, 22], it is necessary to screen the blood vessel edges. The followings are the problem needed to be solved in screening: first, blood vessel edges involve effective edge and invalid edge, as shown in Fig. 4a. How could we remove the invalid edge points from edge points? Second, the canny algorithm merely extracts edges, but doesn’t care about which type of edge it has extracted. So, the detected edge points probably include the information of non-blood vessel edges. To solve the above two problems, it is considered to adopt double corner point anisotropy and edge growing to screen out edge points twice. First, double corner point anisotropy is used to remove the invalid edge points outside the corner points. The screening conditions of edge points are shown in Eq. (1). When an edge point satisfies the condition of double corner point anisotropy, it should be removed.
in which,
Remove invalid edge points.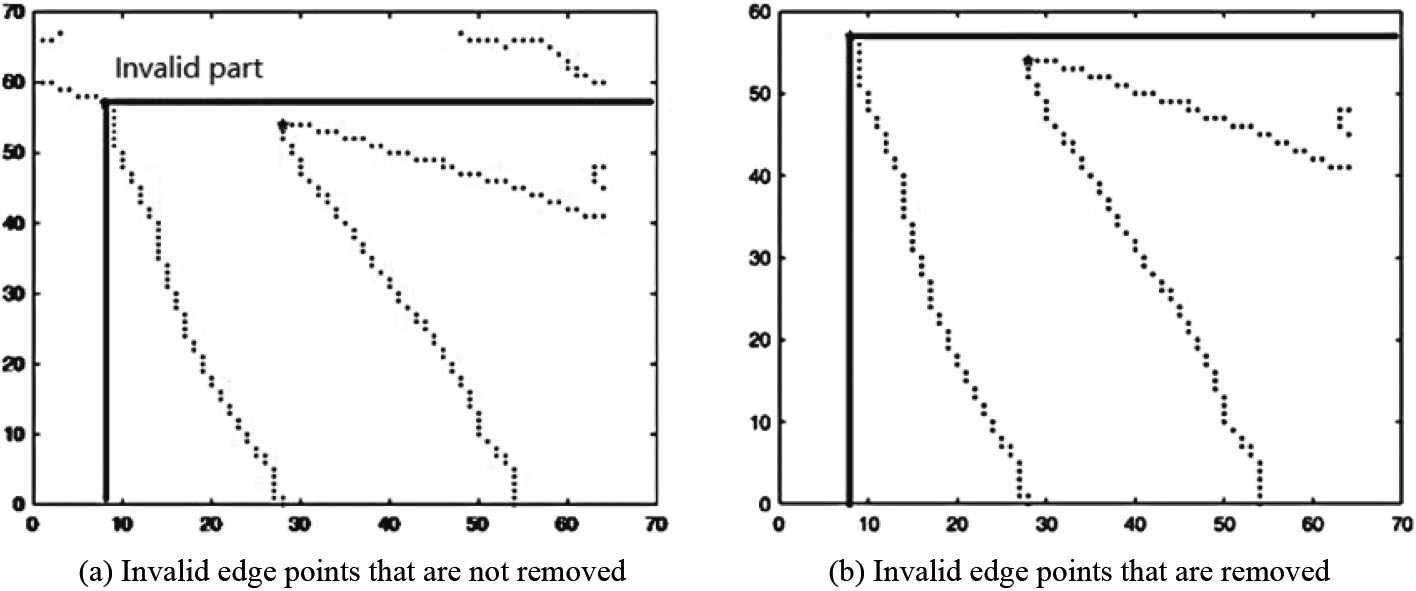
After above preliminary screening, next, we will solve the above-mentioned second problem by edge growing. First, the corner points obtained by using self-adaptive rectangular filter are taken as the growing points where the seeds grow in the edge. Figure 3 shows the corner point position. Second, the growing algorithm is used to enable seed points to grow along blood vessel gradually to ROI image edge or blood vessel edge, so that those edge points that are anisotropic with corner points or those non-blood vessel edge points captured by canny algorithm can be removed. From this, the pixel points of blood vessel edge are acquired. In the growing algorithm, the growing conditions mainly take the distance between growing points and the to-be growing points as its judging criteria. Among the criteria, the first judging criteria is the distance threshold between growing points and the to-be growing points. This threshold aims at the setting of non-edge points, that’s to say, when the distance between the to-be growing points and growing points exceeds such distance threshold, these to-be growing points will be judged as non-edge points and removed. The second judging criteria is the left and right edge relationship of growing points and to-be growing points. When both growing points and to-be growing points belong to the same edge, such as the left and right corner points and the to-be growing points of one of its pixel neighborhood, the distance between such to-be growing point and left corner point is smaller than that between it and right corner point, then we can judge it as the edge point at the same side of left corner point. In order to enhance the performance of the program to distinguish the left and right edges, we extract not only the blood vessel edge but also the blood vessel framework information, and utilize the property that both the to-be growing point and the corresponding corner point share the same edge to further distinguish the left and right edges.
Two edges separation.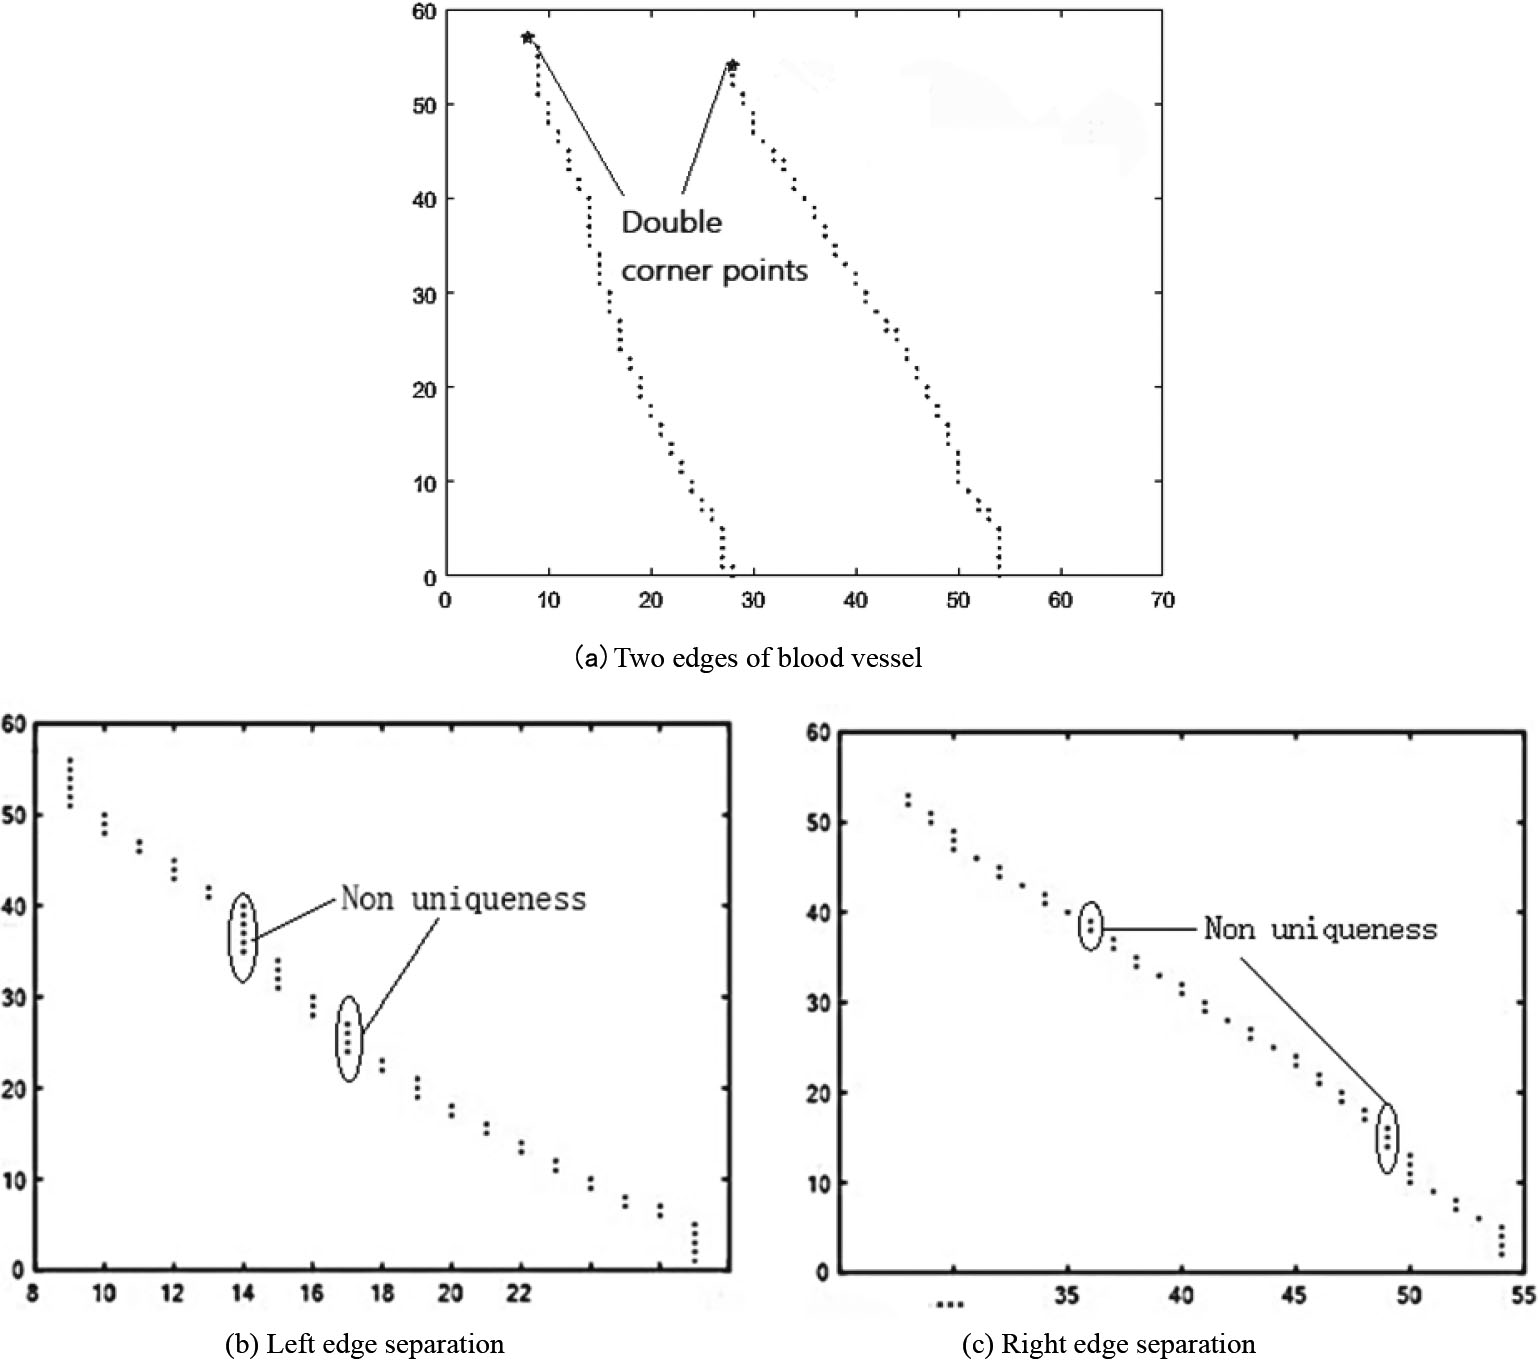
Take the value y of the corner points as the line scan variable, and move along the value y of effective edge points to their maximum/minimum direction, that’s to say, grow from one end to the other end of an edge in the whole process. In the coordinate axis, it can be seen that the process is that the images are scanned from top to bottom line by line, i.e.
in which, A and B are the distance between the starting growing points of two edges of blood vessel and the to-be-tested edge point, D is the maximum distance threshold, Fig. 5a shown the star symbols are labeled as double corner points, the double corner point is selected as the initial growth point, and the initial value of D is the distance between the double corner points. In case that neither A nor B is satisfied, this point should be removed; if only A or B is satisfied, this point shall be judged as an effective edge point of this edge; if both A and B are satisfied, it is considered that this point falls into an effective edge point of the maximum distance edge. Under screening enhancement, this point can be removed to ensure not importing the noise that locate exceeding the two edges, thereby accelerating the screening of the following noise. With the growth along
On account that in the subsequent edge fitting [23, 24], it is needed to solve the function expression of blood vessel edges, then the images of blood vessel edge points should satisfy the properties of the function. That’s to say, every independent variable has a uniquely determined dependent variable corresponding to it. According to this theory, combined with Fig. 4b and c, it can be seen that if the horizontal axial direction is selected as the independent variable, it is required to clear up the unnecessary edge points in ordinate axial direction, so as to guarantee its uniqueness.
In the processing of clearing unnecessary edge points, it is essential to integrate such problems as edge fitting effect and data utilization ratio. The following is the requirements to follow in clearing edge points: first, when the clearing is finished, the fitted edge points could restore the trend of original edges; second, at the premise of ensuring the first requirement, it is better to use more edge data points as possible. This requirement aims at enabling the fitted images to have more details, so that the results can be more accurate. According to above two requirements, this paper provides three methods:
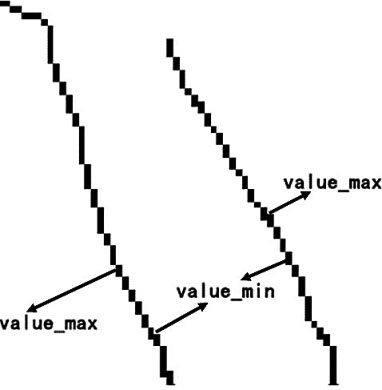
Maximum/minimum method: choose the maximum/minimum of dependent variable from the edge points with the same independent variable as the reserved edge points. The left top corner point is always selected as the origin of an image, while the left bottom corner point is selected as the origin in Cartesian coordinate system. In order to ignore the influence of coordinate system, here, when we discuss the maximal and minimal values, the blood vessel’s expansion direction will be taken the direction of maximal value, and the direction of minimal value will be the blood vessel’s contraction direction. In Fig. 6, the maximum/minimum direction of left edge is downward, while the right edge if upward. When the expansion direction and maximum/minimum direction of blood vessel is linked together, the expansion or contraction of blood vessel resulted from crossing compression will all be reflected by the maximum/minimum of edge points. As the blood vessel wall has a certain thickness, when the wall deforms, there will be a larger change in outer wall and a smaller change in inner wall. So, when the edge is fitted, the outer wall tends to magnify the bending degree of edge, meanwhile making some points to become the curvature catastrophe points. However, the inner wall has an inverse tendency.
Maximum/minimum direction. Median method: in order to balance the merits and demerits of the maximum/minimum method, it is feasible to amplify the curvature properly, so as to highlight curvature maximum and meanwhile reduce the catastrophe due to curvature magnification. When the blood vessel is short, such method can well prevent catastrophe and proper magnification. But when the blood vessel is long, it will change slowly, then such method has no great advantage but will over-weaken the curvature and make the change to be slighter. Variance type method: use variance calculation to obtain the points with better variance results. In case of short blood vessel, there are less points for option, so its effect is no different from the median method.
In Fig. 7, the right edge points in Fig. 7a receive duplicate removal by the extremum method to obtain the Fig. 7b. It is seen that the images of edge points can satisfy the functional uniqueness. In above discussion, our assumption takes abscissa as independent variables and ordinate as dependent variables for screening. To satisfy the above second requirement, the edge point data should be used as possible. When the blood vessel trend has a greater horizontal proportion, it is required to exchange the independent and dependent variables.
Uniqueness of edge points.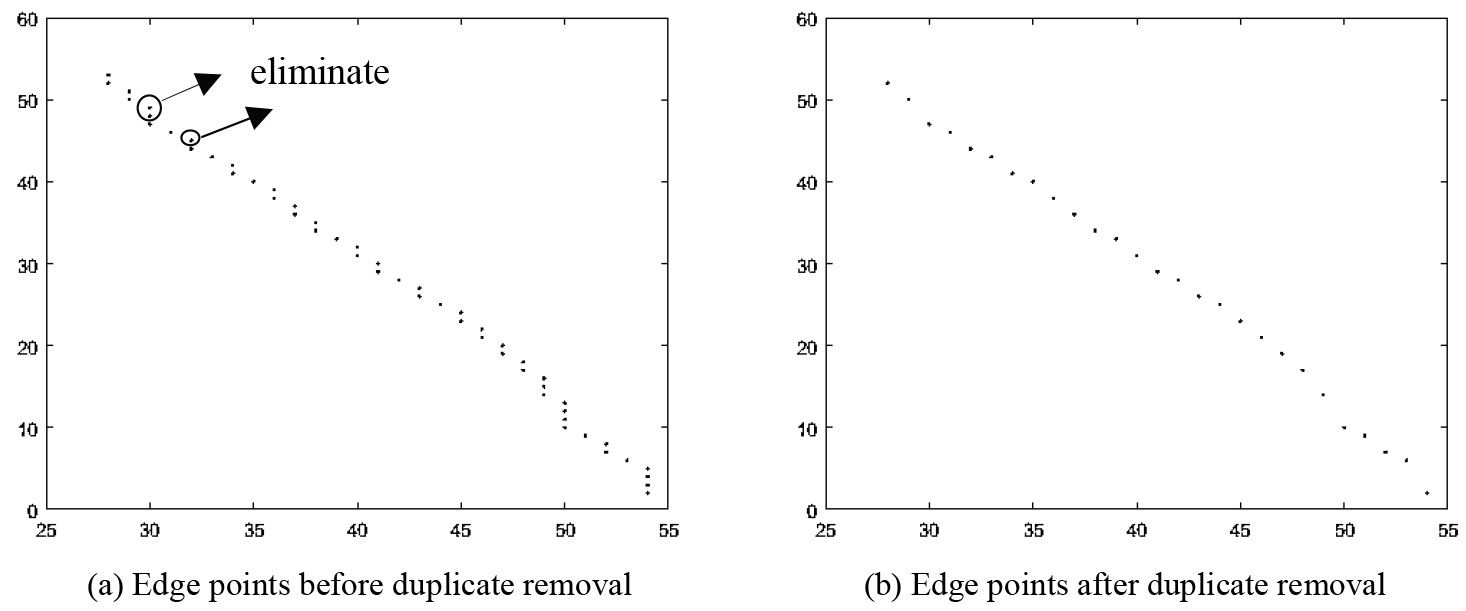
Edge fitting.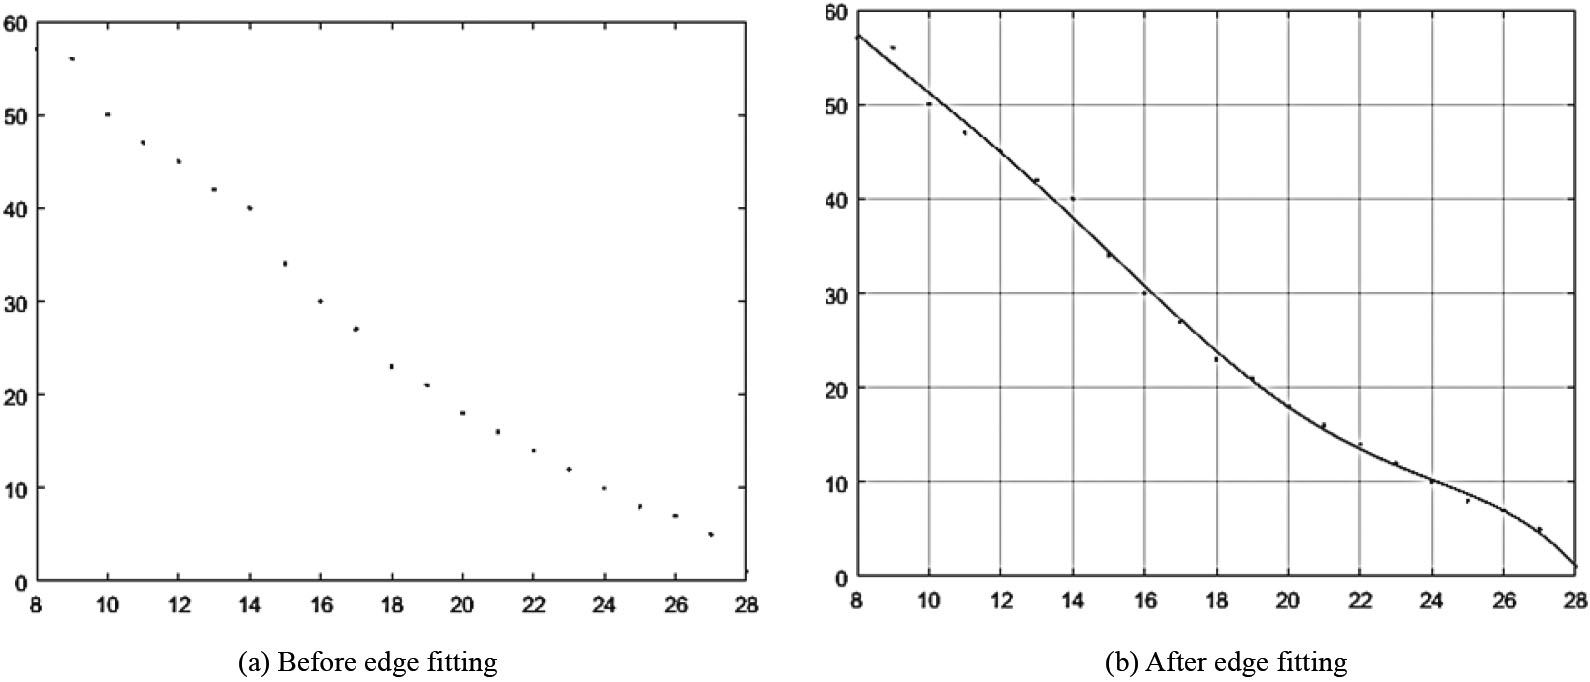
The screened edge points receive edge fitting by using polynomial. During fitting, it is first to involve the selection of the highest power of polynomial. Here, we adopt the idea of the least square method [25, 26], to minimize the quadratic sum of the error between the fitting results and original edge points, but set a threshold to avoid over-fitting as well. This threshold is set in consideration of two questions: one is to get the best curve-fitting edge point effect, two is to prevent over-fitting. Because an image needs to be artificially pixelated before being processed, so it is extracted on the basis of original edge. Once it is over-fit, it is easy to cause a poor restoration effect of fitting curve. In the data of this paper, the blood vessel length is below median. The biquadratic polynomial is taken as the basic fitting control group. First, solve the quadratic sum of its fitting error, and set the relative error threshold interval. If this threshold interval is satisfied, it is possible to adjust up or down the fitting power. Figure 8a and b show the comparison before and after left edge fitting, which uses quintic polynomial fitting to obtain the fitted equation of edge curve:
or
in which, the formula in Eq. (4) is a quintic polynomial fitting formula which takes x as independent variable and y as dependent variable. The Eq. (5) is on the contrary,
According to the curvature Eq. (6), solve the curvature of each data point for the fitted edge curve.
in which,
Curve extremums and labels.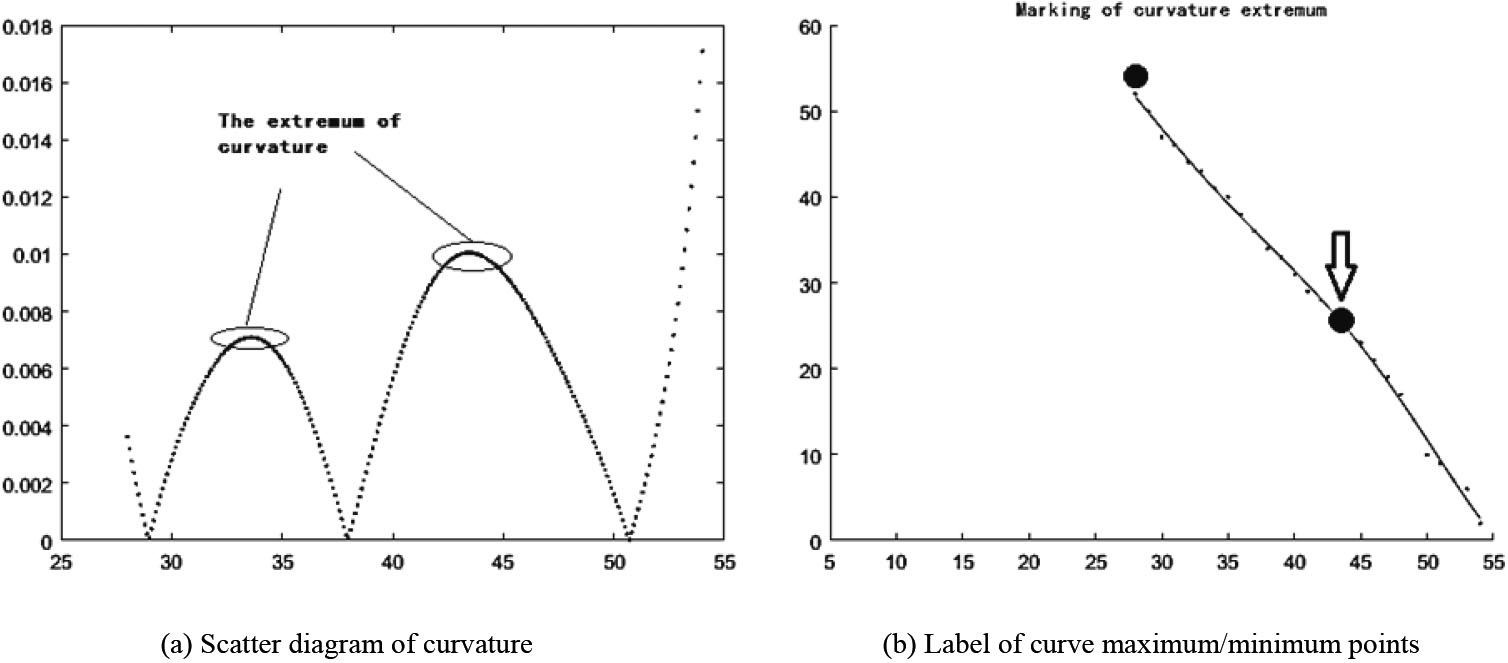
By connecting the two corner points on the edge to the maximum/minimum point of curvature,
in which,
Double straight line label.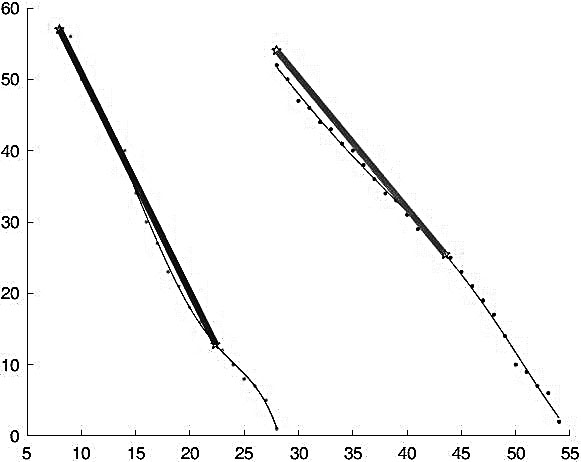
According to Eqs (8) and (9), the positive-going included angle between two edge straight lines along the flow direction of blood vessel is solved, and the angle of crossing compression blood vessel in vein is obtained.
In Eqs (8) and (9),
Result label of positive-going included angle.
This experiment is completed on the MATLAB platform of windows 10 system. The eyeground diagrams are provided by ophthalmologists, with 8 groups of image data in total, each group of images data are composed of a higher resolution eyeground diagram and a lower resolution eyeground diagram, and the two eyeground diagrams come from the same retina, contain 16 images in total. This paper will take one of the eyeground images as an example to show the experimental process, and the processing results of all image data will be sorted out in Sections 3 and 4.
Pretreating of eyeground images
Extract ROI region from eyeground images, as shown in Fig. 12a and b. Capturing the crossing part of artery and vein from eyeground images can be performed by two methods: one is artificial frame selection, that’s to find out the location of the crossing part in eyeground image by an ophthalmologist. The other is using the corner point screening in above eyeground image pretreatment to get the crossing part. The first method depends on the experience of ophthalmologist, but it cuts off a lot of irrelative data treatment, maximally quickening and promoting the identification accuracy. The second method completely depends on the support of Hash Rate, which will process a large number of irrelative data, but it needs no human experience which can further improve the whole system’s automation degree. Figure 12c is obtained by binarizing ROI region first, then conducting canny edge extraction and finally inversing. It can be seen that the improved edge has better performance, and shows less non-edge points or no noise when finding out the edge as possible.
Pretreating of eyeground image.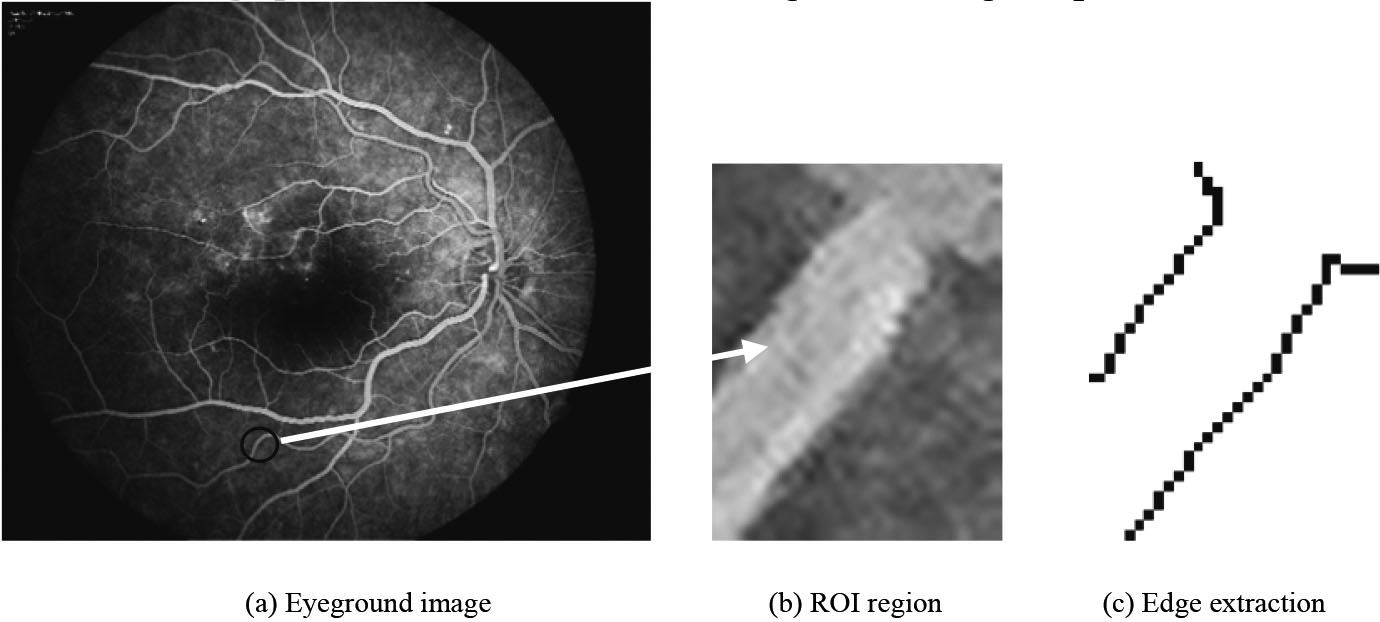
After extracting the edge, it is first to remove invalid edge. By using double corner point anisotropy, the useless points imported due to ROI region is first removed. Figure 13a and b show the screening process by using double corner point anisotropy. In Fig. 13a, the location of double corner points is highlighted. By using the position of double corner points and the screening principle, the invalid edge points are removed. In Fig. 13b, most invalid edge points have been removed.
Double edges and their separation.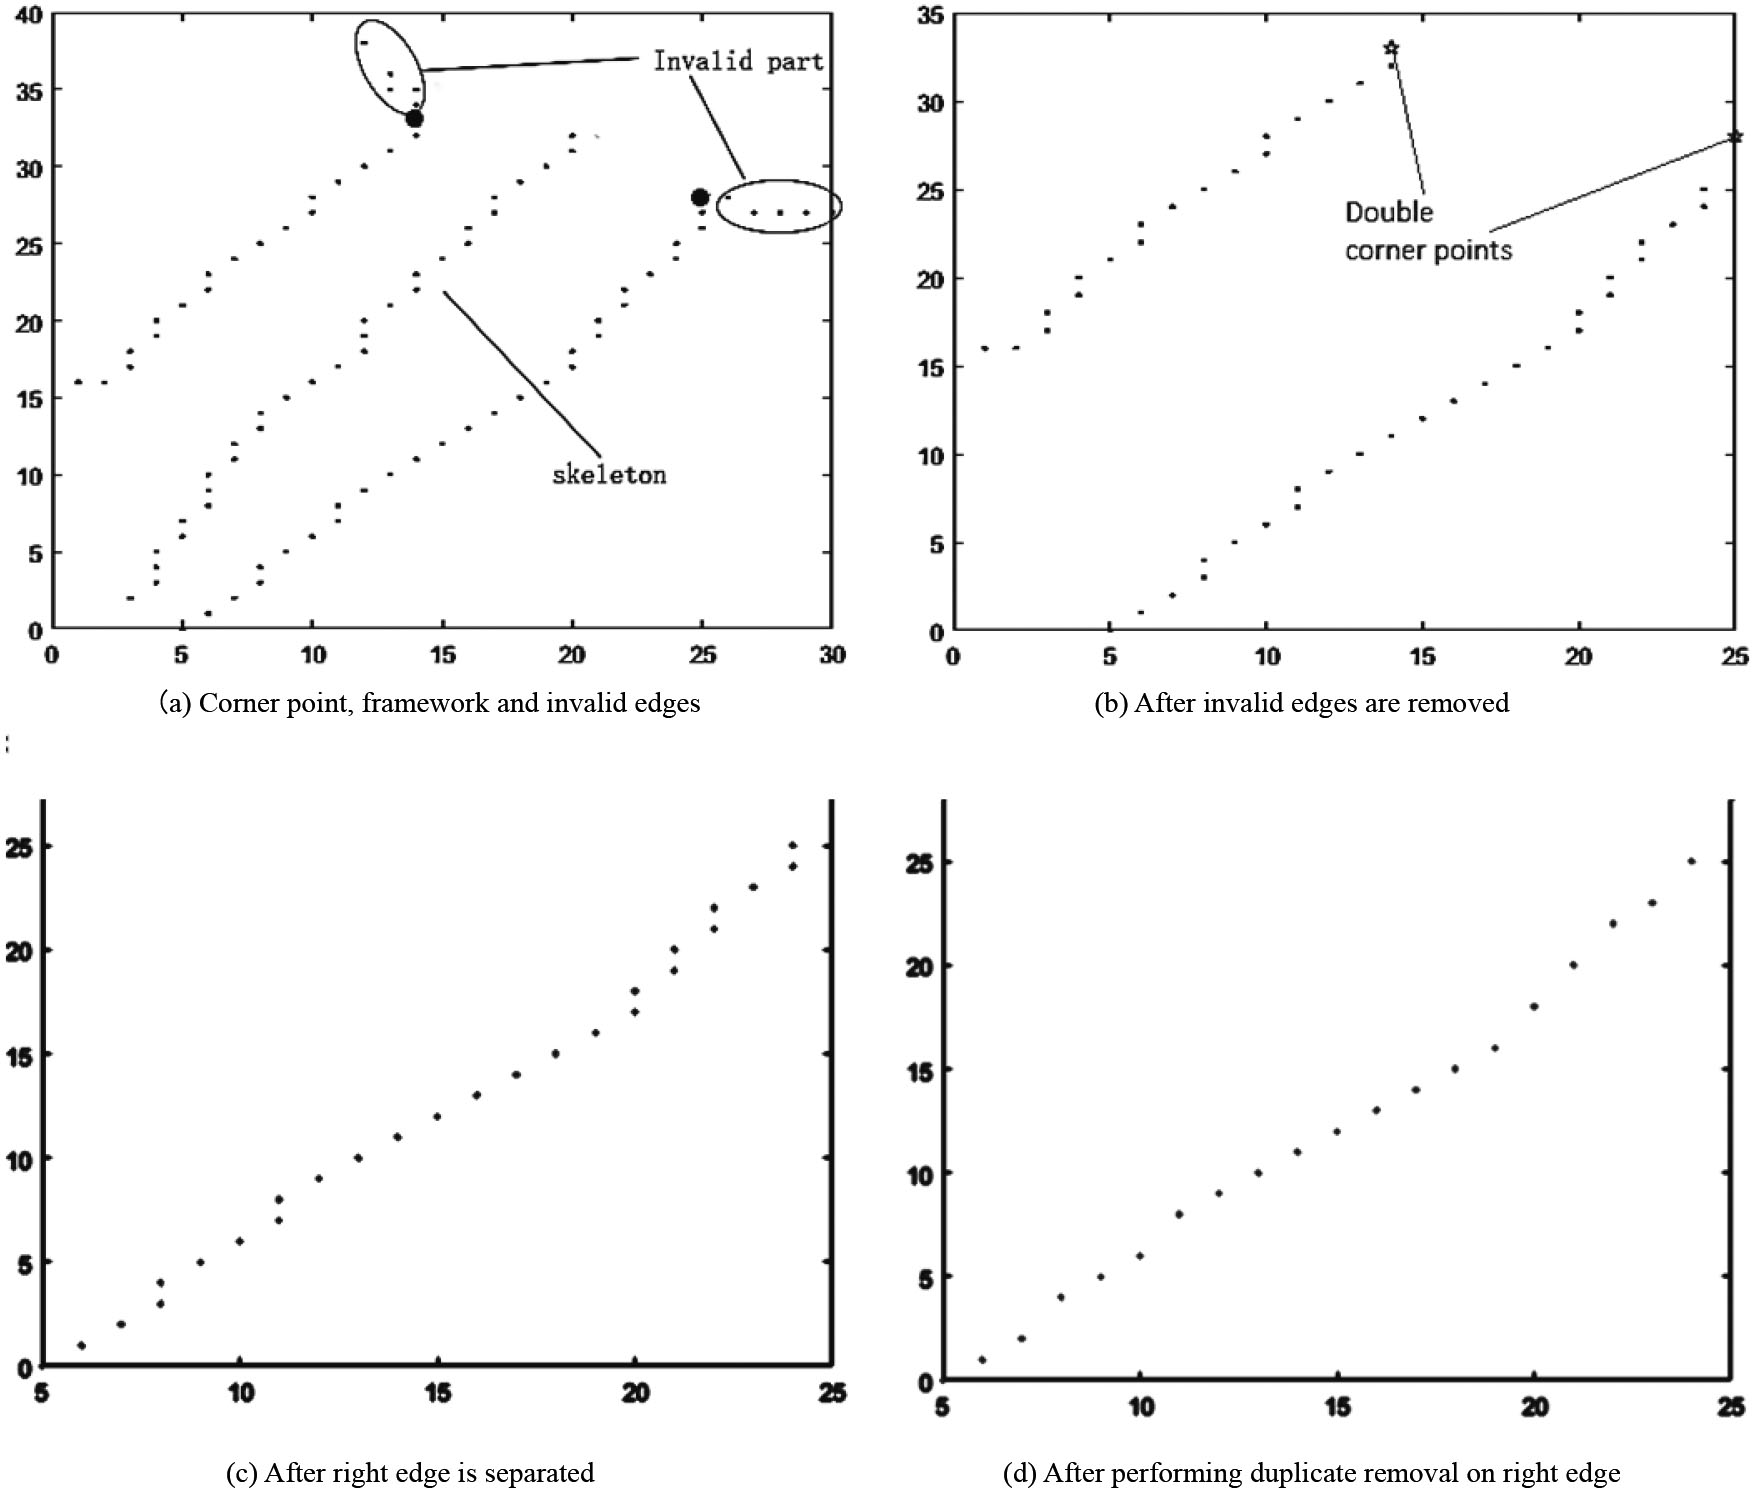
Second, we need to separate the two edges, which is implemented by both framework method [27] and edge growing method [28, 29]. As shown in Fig. 13a, the part between two edges is the framework of blood vessel. Distinguish edge points by using edge unilaterality, and at the same time, use edge growing method to avoid the noise of non-blood vessel edges. After above two steps, as shown in Fig. 13b, two edges can be separated successfully, and the noise have been cleared up. Figure 13c displays the right edge of blood vessel. The left edge is similar, so it is not displayed here. From the separation results, the separation effect is poor. Here, combining two methods strengthens the determining of non-edge noise and edges.
Fitting result of quintic polynomial
Edge fitting, curvature and angle calculation.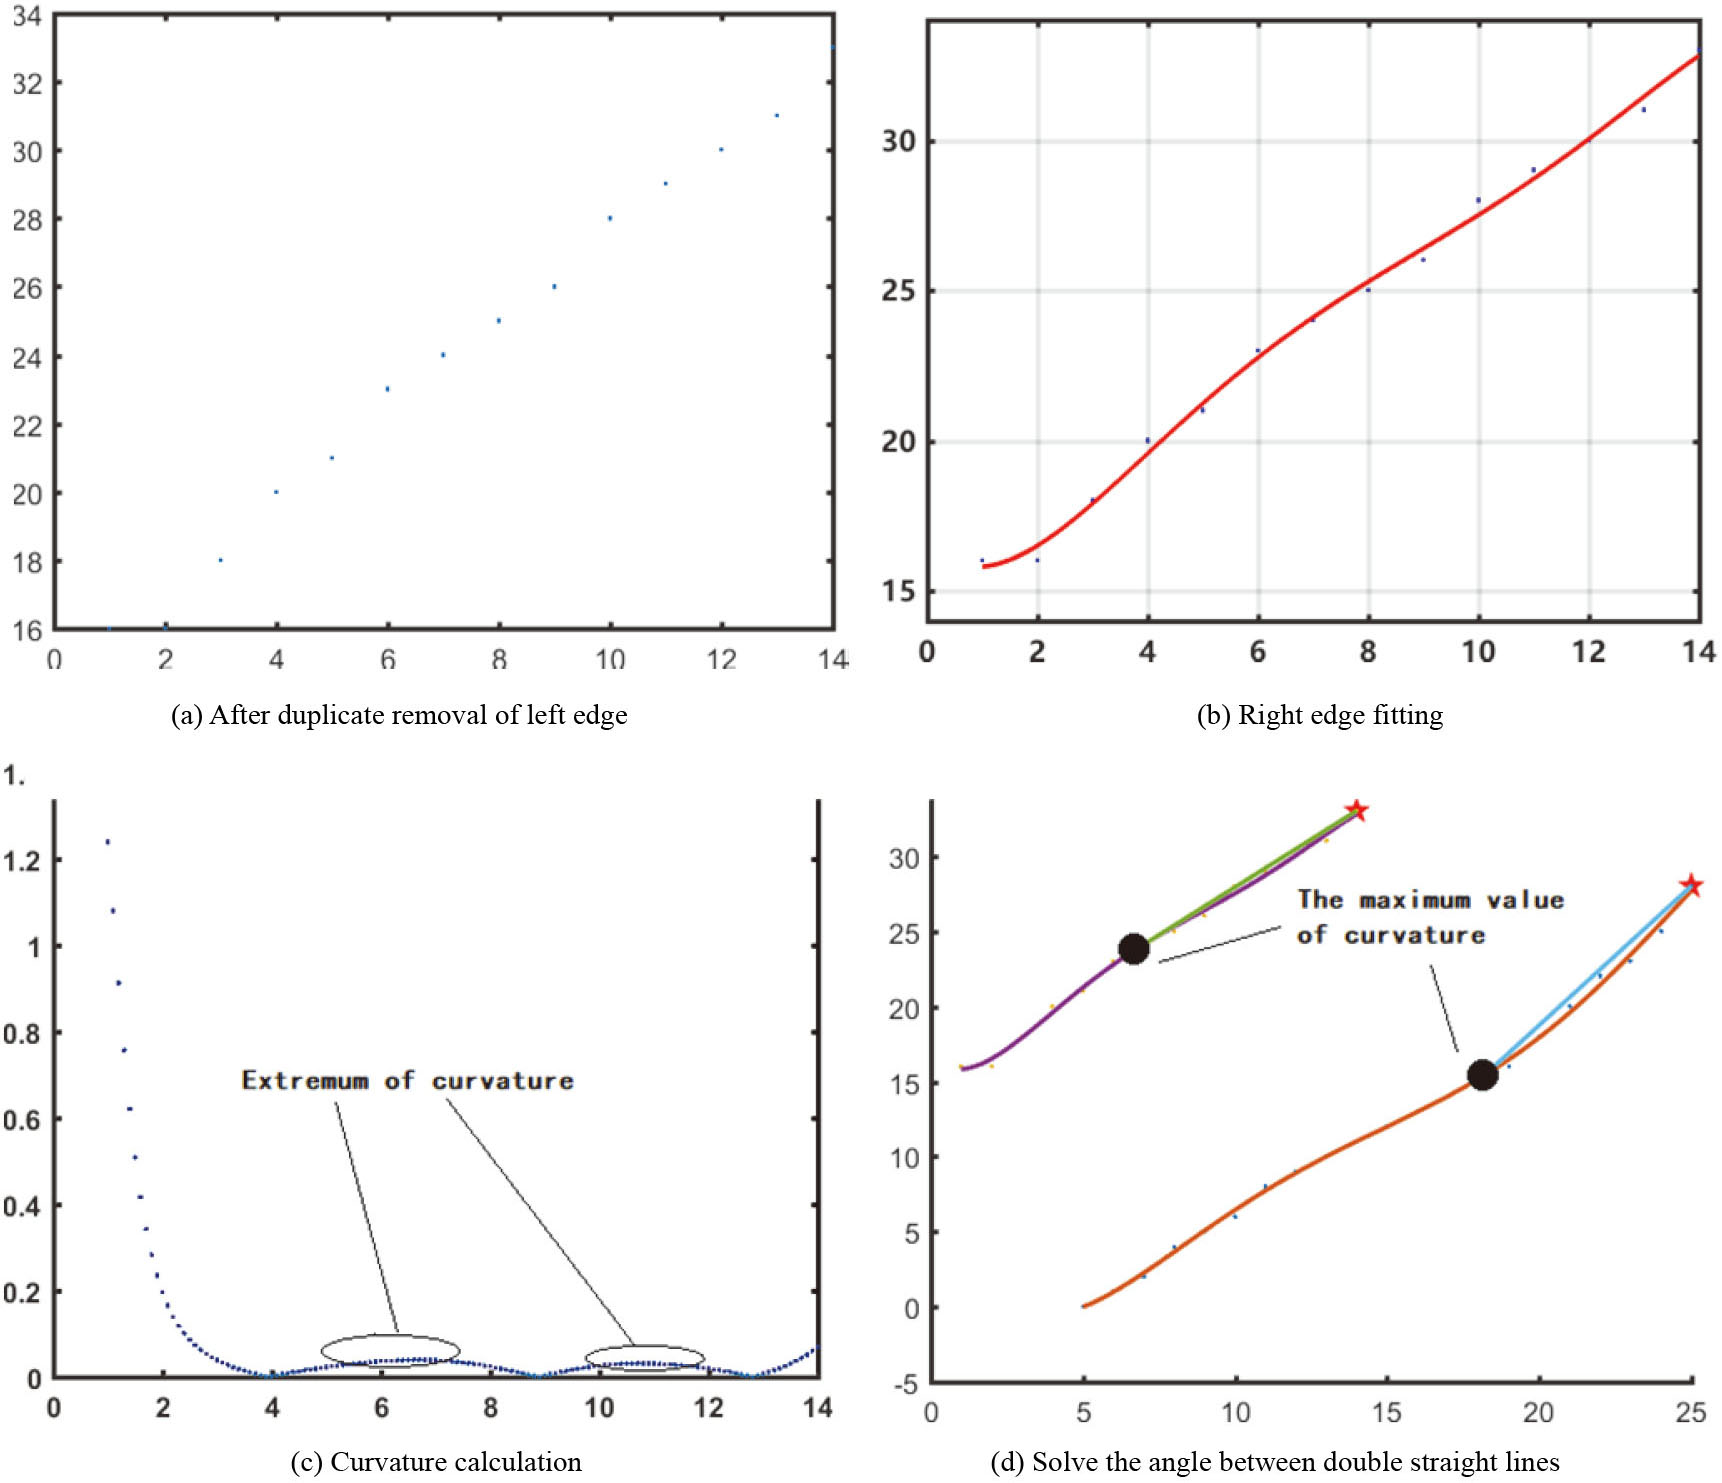
Finally, it is needful to conduct duplicate removal of the separated edge points, to eliminate redundant edge points. After the separation of two edges, the two left and right edges are obtained, which include a part of data points that don’t conform to the requirement of function fitting, so a further screening is necessary. To maximize the use of data points, it is first to compare the use efficiency of all data points when the abscissa axis and vertical axis are used as independent variables. When removing the data points under the same independent variables, this paper adopts the maximum/minimum method, and chooses the pixel points that can most reflect the trend of outer wall of blood vessel. See Fig. 13d for the screened right edge.
After carrying out double edge extraction and data point duplicate removal in separation steps in Section 3.2, the quintic polynomial is used to fit the data points of double edges. The fitting results are as below.
After the steps of double edge extraction, separation and data point duplicate removal in Section 3.2, the double edge data points in Fig. 13d are fitted by using the quintic polynomial of Eq. (4), and the fitting results are shown in Table 1.
It can be known from Table 1 that the fitting coefficient can fall in the 95% confidence interval, but it is not too high to over-fit. Combined with the fitting curve in Fig. 14b, we can see that it doesn’t fully cover the data points, but leave certain error correction space.
After getting the fitting function, we start to figure out the curvature of every edge data point, and obtain the curvature maximum/minimum of two edge curves. Figure 14c shows the curvature value of left edge, which is divided into four segments: the first segment is the tail part of blood vessel edge, two middle segments are the intervals where maximum/minimum appears, and last segments is where corner point is located. Here, we only select the maximum/minimum from the extremum. The abscissa of curvature extremum value is between 4
At the end, use double corner points and double curvatures’ maximum/minimum points to build double straight lines, and solve the positive-going included angle between double straight lines. As shown in Fig. 14d, the star symbols are labeled as double corner points, and the circular symbols are labeled as double curvatures’ maximum/minimum points. The curvature maximum/minimum points of left and right edges are (6.7, 23.7123) and (18.2, 15.4021) respectively, and the left and right corner points are (14,33) and (25,28), hence, the obtained slopes of double straight lines are 1.2723 radians and 1.8526 radians. From above data, it is computed that the positive-going included angle of double straight lines is 9.8079
Angle data counting
The image data in Figs 15 and 16 originate from real data collected by ophthalmologists. For the purpose of data display, the eyeground image has received ROI region extraction and size normalization processing.
Figures 15 and 16 contain 8 groups of data in total. In each data group, the top and bottom two images are acquired from the same crossing compression position under different resolutions. The above is collected under a higher resolution, and the bottom is collected under a lower resolution.
After undergoing the above steps, the crossing compression angles of 8 groups of data are recorded in Table 2, and the group number is the same with those in Figs 15 and 16.
The crossing compression angle results under different resolutions
The crossing compression angle results under different resolutions
Data groups 1 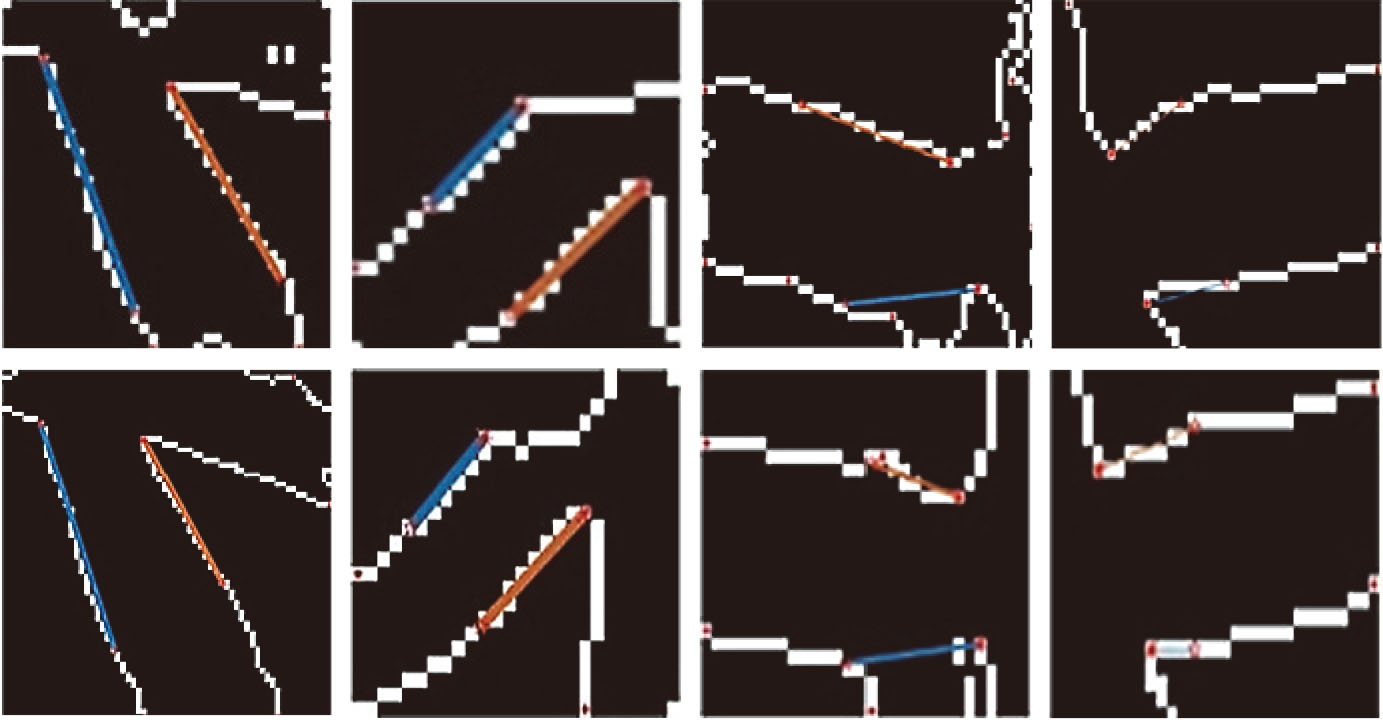
Data groups 5 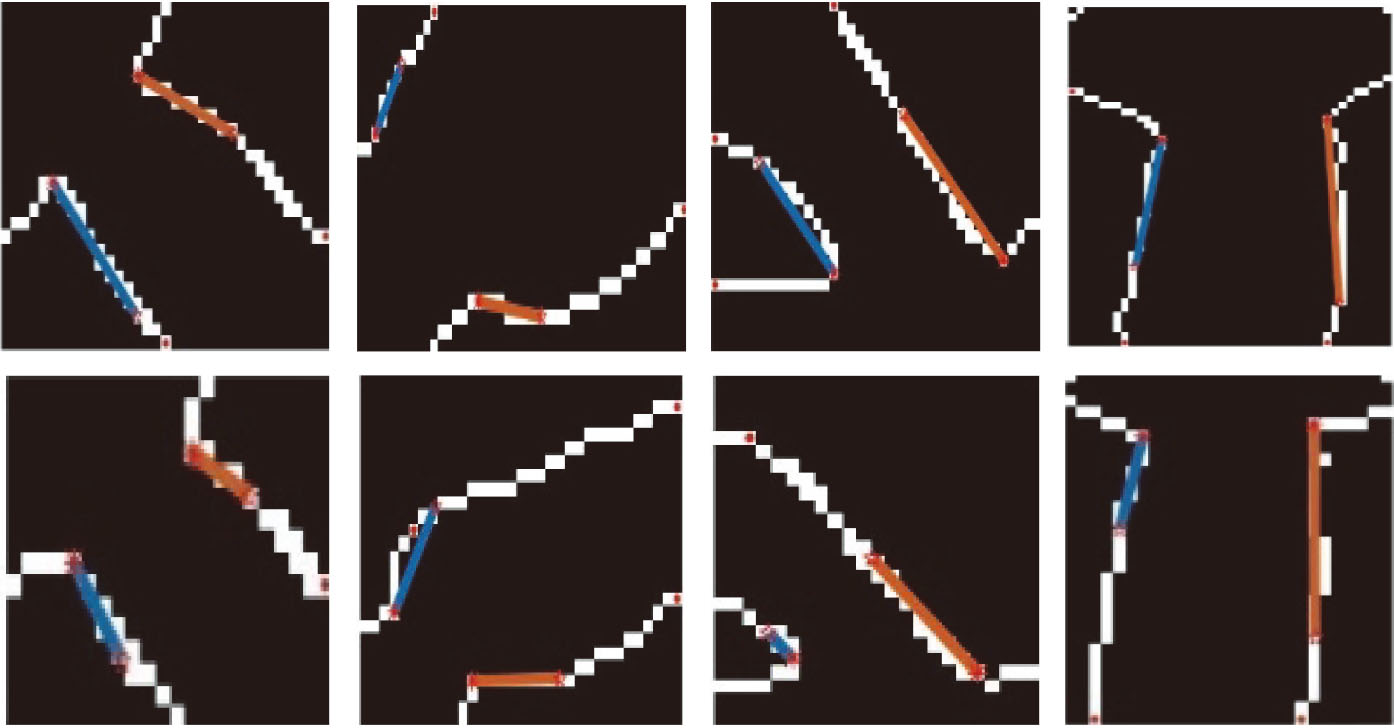
In Table 2, every two images such as in images #1 and #2 are the labeled image of the same crossing position of artery and vein under different resolutions after going through the above 4 steps, which angle detection value is recorded in the last column of Table 1. From above data, under two different resolutions, the error value of the crossing compression angle in above image data is basically less than
ROI extraction part is the part with the largest data processing amount in the whole experiment, and the intact data quantity in eyeground image is basically 25 to 28 times of that in ROI region of crossing angle. From this, the work of this part includes invalid processing in invalid region to a larger extent. So we consider to reduce deep processing operation in this region to get processing efficiency to a certain degree in return. However, this will sacrifice partial automation degree, and the ophthalmologists have to artificially select ROI region with the aid of program, so as to decrease excessive data processing in an intact eyeground image and thus increase processing efficiency. With the enhanced hash rate, the burden due to data quantity will be lowered gradually.
Conclusion
In exploring the problem of retinal vein occlusion, quantitative detection of the cross compression angle of arteries and veins is used to assist in the diagnosis of the degree of retinal vein occlusion. In this paper, the two groups of eyeground images with higher resolution and lower resolution are compared . After calculation, the error value of the crossing compression angle between the two groups of eyeground images is maintained at
Due to the large size of eyeground image , ROI region extraction is still manually selected by ophthalmologists on the premise of maintaining accuracy and speed. With the improvement of algorithm ability, ROI region extraction is expected to use deep learning network for positioning, so as to better speed up data processing and improve the degree of automation.
At present, the research results of retinal artery and vein crossing angle detection based on digital image processing technology are relatively few, and most of them are limited to blood vessel width measurement and artery and vein classification. In contrast, the measurement system of the artery and vein cross compression angle studied in this paper has a small error, which provides an objective basis for the auxiliary diagnosis of retinal vein occlusion. The measurement result does not strictly depend on the level of the ophthalmologist, and individual differences are excluded, so it has high practical clinical application value. The accuracy of edge detection and the calculation ability of the algorithm can be improved, so as to improve the calculation accuracy of angle.
Footnotes
Acknowledgments
This work was supported by the Key project of core technology research of Dongguan City (Grand: 2019622126004).