





Abstract
Emergency materials transportation, both economic and societal, is one of the most important parts of unconventional emergency management. In the present study, we built a quantitative simulation model underlying the mechanism of emergency materials transportation specifically regarding typhoon disasters. We then explored the internal influence factors and association mechanisms of the dynamic model as they relate to the effective control and guidance of emergency materials transportation. Using system dynamic model, this paper conducts the simulation study to identify the key influencing factors for the speed of emergency materials transportation. The relationships between influencing factors and the emergency capability were analyzed qualitatively. On this basis, SD flow chart was built. A typhoon disaster event in Leizhou Peninsula, China, is used as an example to validate the effectiveness and feasibility of the proposed model, as well as to simulate different emergency management strategies. Results of governmental emergency materials transportation are key factors in process of emergency formulating the policy to improve the speed and efficiency for emergency materials transportation during the emergency management process.
Introduction
Large-scale extreme natural disasters have occurred frequently in recent years throughout the world and thus have attracted extensive attention from the academic community. Destructive natural disasters, such as typhoons and tsunami, would induce a series of successive derivative disasters, which complicate the progression of disasters and rescue efforts during them. The high frequency, emergency and complexity of disasters have raised the requirements for emergency management to be more scientific and effective. Typhoon disasters are the most frequent and most destructive type of natural disasters in the world [1]. Statistics from the Swiss Reinsurance Company (Swiss Re) show that eight of the ten disasters that caused the costliest insurance losses from1970 to 2007 were associated with typhoon [2]. China is one of the countries most-affected by typhoon disasters in the world. Between 1988 and 2010, the annual direct economic loss due to typhoons in China was up to 29.05 billion RMB [3]. The economic loss due to typhoon disasters is on the rise following the aggravation of total economic volume [4].
The frequent occurrence of natural disasters has driven all governments and researchers to focus on emergency management. In particular, as the premise for implementation of emergency rescue after natural disasters, the cores of the rescue are how to transfer and deliver the large amount of rescue equipment and necessary materials to the affected areas in the shortest time, and thus meet the material needs of relief works. Mete and Zabinsky [5] proposed a random optimization model that could be used to store and distribute relief materials following multiple potential disasters. Rawls and Turnquist [6] have devoted much effort to carry out research on emergency rescue. For instance, considering hurricanes and other disasters. Rawls and Turnquist [7] studied the two-stage random mixing integer planning under conditions of rescue facility location selection, emergency supply stock decision-making and demand site combination. They extended this model to be applied under the restraint of service quality and aimed to ensure that the prospect of all the demands was not smaller than the preset level. Salmerón and Apte [8] used a two-stage random optimization model to guide the typical decision-making about the distribution of rescue materials and budget allocation before the occurrence of disasters. Sheu [9] developed an emergency dynamic rescue demand management model under the condition of insufficient information about large-scale natural disasters.
Meanwhile, under the premise of an outburst of natural disasters, the affected area urgently needed various materials. The infrastructures, such as transport facilities (highway, railway, etc.) and cyber network facilities in the affected area are destroyed to varying extents, which severely challenge the emergency logistic systems. Thus, it is urgent to probe into the occurrence, development and transfer of disasters, to understand the developing rules and thus precisely predict the derivative disasters [10]. Based on the equipment data of 22 typhoons that hit Taiwan between 2000 and 2008, Lin et al. [11] studied the demands from the emergency health departments under the condition of the typhoon landing and built a time-series linear model revealing the effects of the typhoons. The objective functions of an optimized model for a large-scale emergency rescue resource distribution site selection under a certain environment can be divided into single-objective optimization and multi-objective optimization. Above all, the main aim of the single-objective optimization is to find the service facility rescue sites with the smallest cost and within certain time. Harewood [12] used a queuing method for rescue facilities covering problems, computed the probability of arriving at the emergency resource distribution site within the emergency time and studied the problem of ambulance deployment and scheduling with the objective of solving it at the smallest costs. Some researchers studied the distribution optimization at emergency rescue resource distribution sites by using time and cost as the constraints [13, 14, 15, 16]. In addition, under the premise of meeting the time urgency of emergency systems, some researchers developed mathematical models based on system cost minimization and proposed the emergency rescue resource distribution site selection optimization models based on branch and bound and data envelopment analysis [17, 18, 19]. Multi-objective optimization is focused on multi-factors (e.g. economy, technology, society, safety, etc.) and thereby considers the layout of distribution sites for large-scale emergency rescue resources. Some researchers adopted the staging method to study the location selection problem of emergency rescue resources and modeled it under the constraints of time, transport costs and facilities coverage rate [20, 21, 22, 23]. Based on a reported study [13], Beraldi and Bruni [24] considered the prospect of arriving at emergency rescue distribution sites and used a random planning method to investigate the staged modeling. Based on emergency rescue resource distribution site localization under time constraint, some researchers realistically set the searching operation and parameters, and used the simulated annealing algorithm to propose multi-objective optimization of emergency rescue facility layout problems [25, 26].
The existing studies on optimization distribution and transport of emergency resources are focused on individual aspects. However, emergency rescue systems often featured structural complexity and uncertainty, while emergency material supply systems are multi-objective, nonlinear and multi-feedback time-variable systems. Fortunately, system dynamics is extremely superior in the simulation of complex systems. System dynamics, proposed by Jay Forrester from the Massachusetts Institute of Technology in 1956, can uncover the relationships between the feedback and structures and between function and dynamic behaviors in complex systems [27]. Since the 1990s, system dynamics has been extensively applied in various fields, including macroscopics, project management, learning-typed organizations, logistics and supply chain, and corporate strategies [28]. Recently, system dynamics has been used in emergency rescue systems. For instance, Brouwer developed a flood rescue system based on system dynamics [29]. Cooke [30] developed a behavior-oriented system dynamics model in response to mining disasters. From the perspective of system dynamics, Besiou et al. [31] created a causality model involving material acquisition, material transport and migration and material consumption and demand change. Min and Hong [32] built a system dynamics model for emergency material replenishment in affected areas and, using the Wenchuan Earthquake as an example, analyzed the effects of dynamic transport delay and information delay on the replenishment of emergency material.
The demand for emergency supplies increased dramatically after the typhoon disaster event. The management needs to bridge the gap between supply and demand to ensure an extraordinary supply of emergency supplies. The typhoon disaster emergency response system can effectively control the expansion of the situation and avoid or reduce casualties and property damage. How to get typhoon disaster relief personnel and supplies to the disaster area as quickly as possible is a prerequisite and basis for subsequent relief work, so it is important to study the allocation of emergency resources under typhoon disasters.
Regarding the information delay and transport delay of rescue material supply systems, here we establish an emergency supply allocation model based on system dynamics and introduce the road damaged rate, on-road stocks and material depletion rate into the model. We simulate the typhoon that stroke the Leizhou Peninsula in 2015 and analyze the impact factors on emergency supply allocation efficiency and overstock in each affected site. We also present some suggestions on efficient emergency material distribution.
Problem description
Upon the occurrence of typhoon disasters, the first task in the whole rescue process is to rescue the affected victims and allocate the rescue materials. The major characteristics are listed next. (1) Upon the occurrence of typhoon disasters, the mainstream rescue and transport pattern from the perspective of transport form is still land transportation. (2) Since typhoon disasters would severely damage the traffic road networks in the affected area, many transport teams would be blocked by the obstructed roads, which prevent a number of transport patches from transporting emergency materials in time. (3) From the perspective of whole emergency material transport, the self-rescue and mutual rescue by local victims play very important roles in the whole rescue process before the transport teams arrive at the affected area. (4) The rescue decision-making should not only involve the road traffic capacity and repair speed in an affected area, but also include the number of victims and disaster severity, which circumvent the insufficient rescue due to labor shortage.
Traffic and communication interruption in the affected area would complicate material distribution. In addition, the material distribution works are also affected by the secondary disasters, the swarm of numerous vehicles during the rescue process, the behavior of the crowds and rescue staff in the affected area, leading to a series of problems, such as transport delay and information delay, due to communication route-related reasons. Moreover, the environmental specialties in an affected area also lead to the uncertainty of material demand, thereby affecting the material distribution plans. Accordingly, the above impact factors should be considered in the formulation of plans for the comprehensive distribution of emergency materials.
Model
Along with the above discussion and hypotheses, we could macroscopically explain the relationships among different factors in the emergency material distribution upon the occurrence of typhoon disasters by using system dynamics.
Advantages of system dynamics
System dynamics (SD) is a system discipline based on systems theory, with information theory and cybernetics as its grip, and is an important branch of systems science and management science with strong intersectionality and integration. Compared to other methods (econometrics, game theory, etc.), system dynamics has many incomparable advantages: (1) It is less dependent on data. System dynamics is suitable for the study of complex systems with insufficient data, inaccurate data and difficult to quantify parameters, because the structure of the system dynamics model is centred on feedback loops and the existence of multiple feedback loops makes the system model unresponsive to the parameters, thus system dynamics can be used for extrapolation and analysis based on incomplete information; (2) It is suitable for long-term complex problems. System dynamics models based on causal feedback loops, whose system behaviour is determined by the internal structure of the system, do not require high requirements for simulation timeframes and can deal with long-term problems; (3) It is good at dealing with high-order, nonlinear and time-varying problems. System dynamics is more likely to reflect processes that are difficult to express in mathematical form, such as non-linear and deferred reflection, and is suitable for the simulation of high-dimensional, non-linear, time-varying and parametrically inexact systems; (4) It emphasizes conditional prediction. Simulations of system dynamics emphasizes the conditions under which the model operates as a result, providing new options for systems to predict future developments.
Construction of causal loop diagrams
According to the dynamics of emergency material distribution, we built causal loop diagrams and thereby described the relationships among different factors during emergency material distribution (Fig. 1). Specifically, “
System causal loop diagram.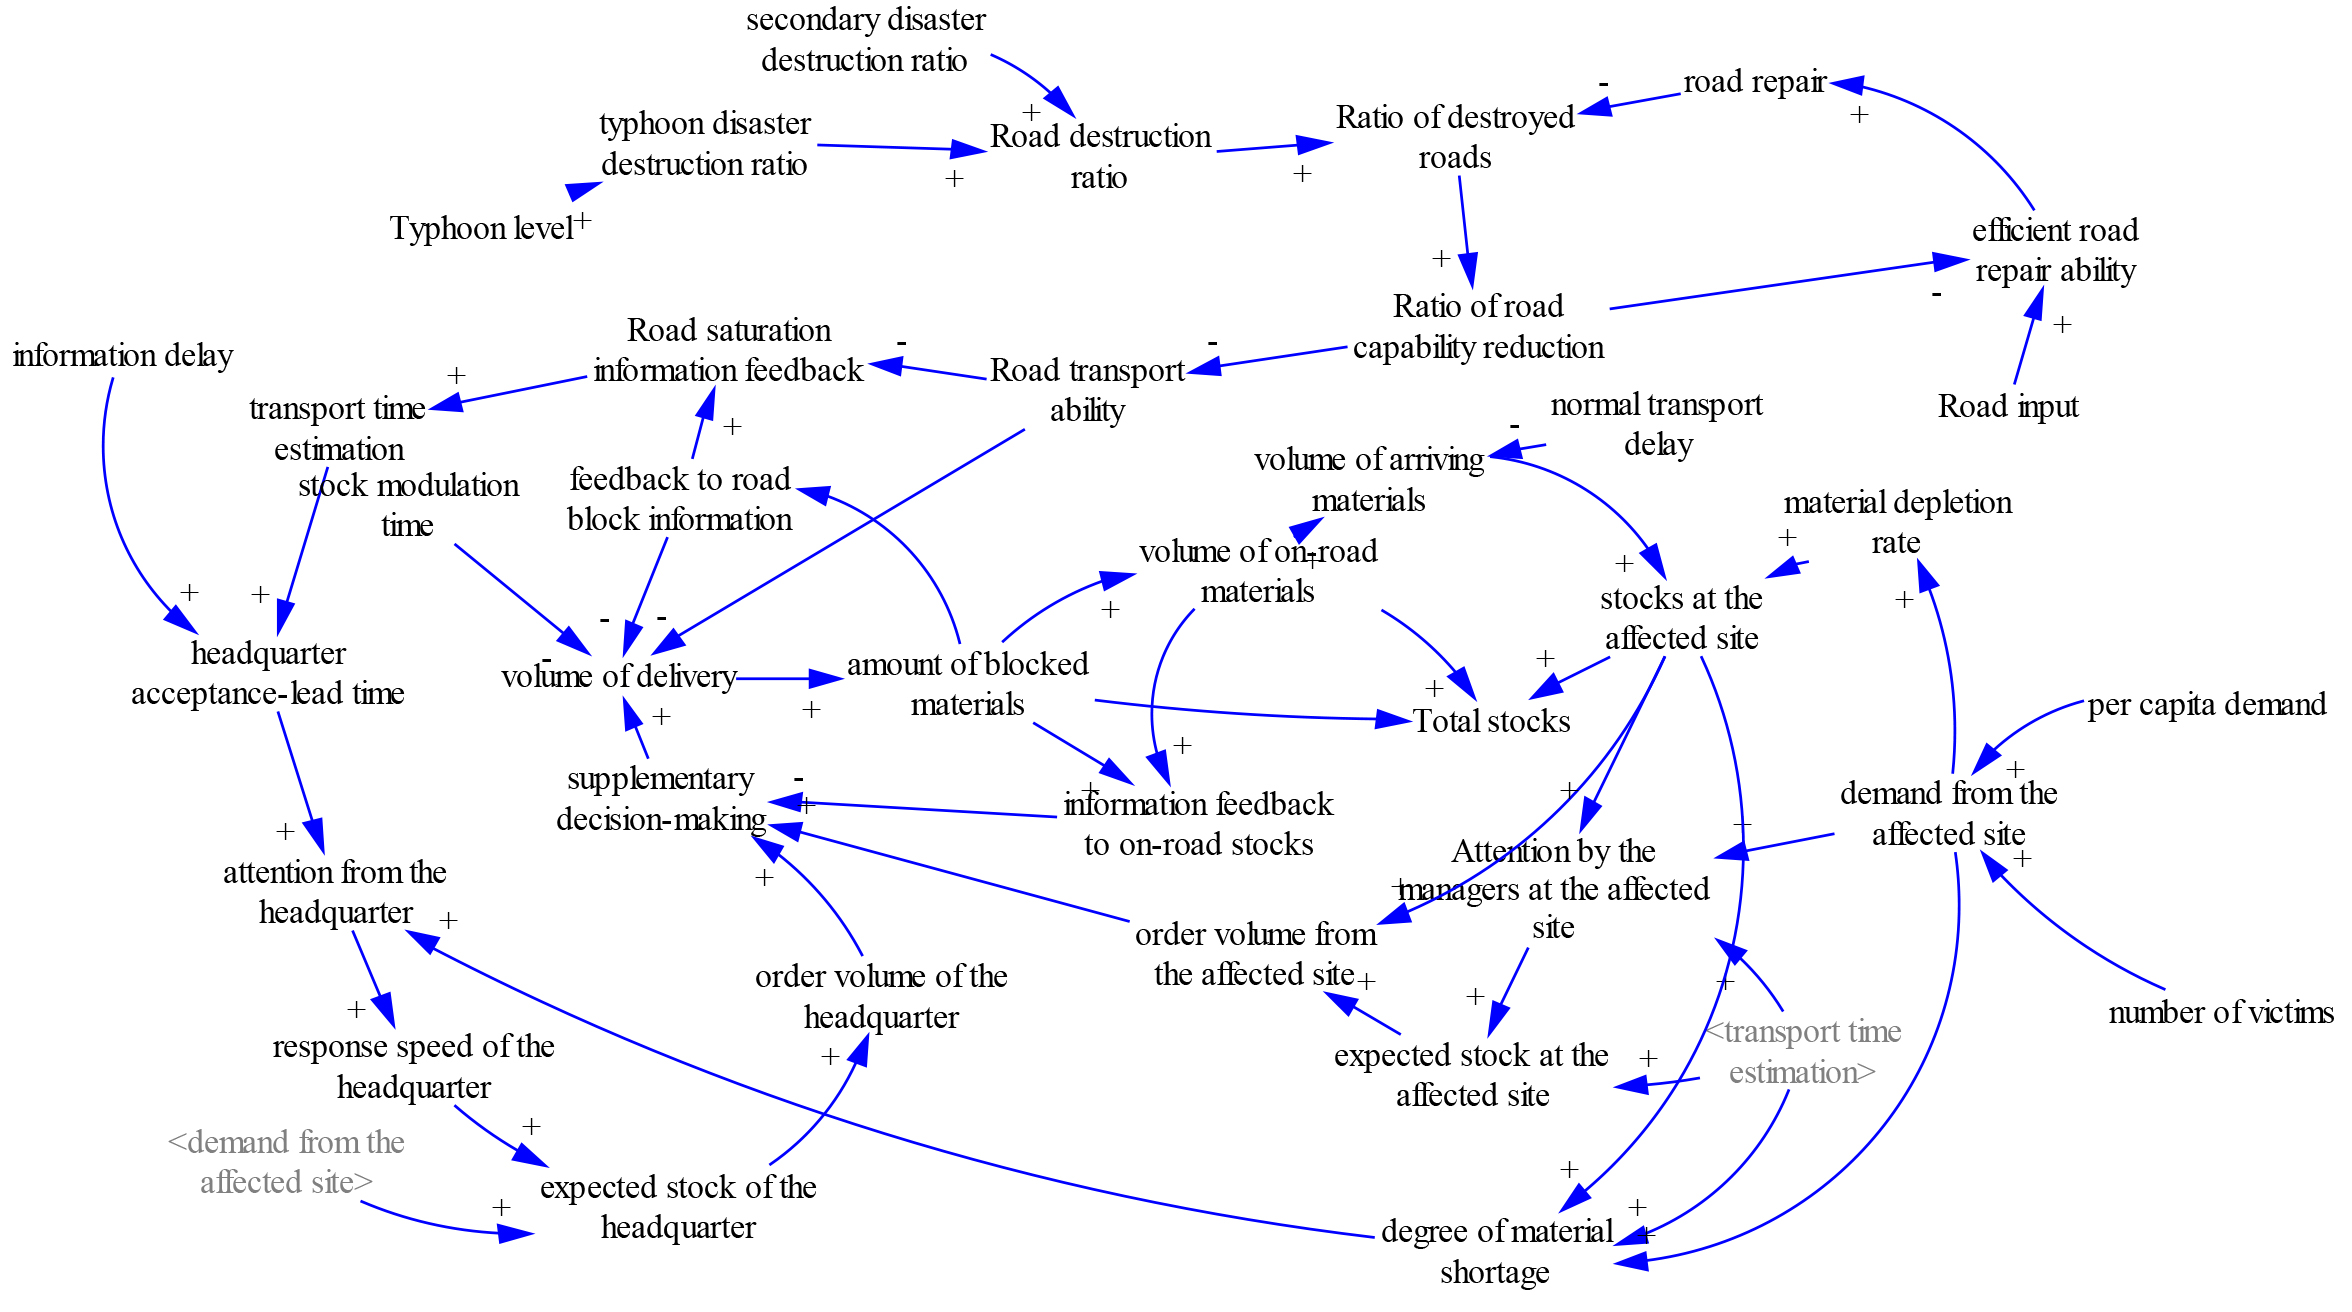
This module has seven feedback loops:
Road saturation information feedback —— + transport time estimation —— + headquarter acceptance-lead time —— + attention from the headquarter —— + response speed of the headquarter —— + expected stock at the headquarter —— + order volume of the headquarter —— + supplementary decision-making —— + volume of delivery —— + amount of blocked materials —— + road information feedback —— + Road saturation information feedback (positive feedback). Amount of blocked materials —— + volume of on-road materials —— + volume of arriving materials —— + stock at the affected site —— + order volume from the affected site —— + supplementary decision-making —— + volume of delivery —— + amount of blocked materials (positive feedback). Stocks at the affected site —— + extent of material shortage —— + attention from the headquarter —— + response speed of the headquarter —— + expected stock at the headquarter —— + order volume of the headquarter —— + supplementary decision-making —— + volume of delivery —— + amount of blocked materials —— + amount of on-road materials —— + volume of arriving materials —— + stocks at the affected site (positive feedback). Stocks at the affected site —— + order volume from the affected site —— + supplementary decision-making —— + volume of delivery —— + amount of blocked materials —— + amount of on-road materials —— + volume of arriving materials —— + stocks at the affected site (positive feedback). Ratio of destroyed roads —— + Ratio of road capability reduction —— - efficient road repair ability —— + road repair —— - Ratio of destroyed roads (negative feedback). Volume of delivery —— + amount of blocked materials —— + volume of on-road materials —— + information feedback to on-road stocks—— + supplementary decision-making —— -volume of delivery (negative feedback). Feedback to road block information —— - volume of delivery —— + amount of blocked materials —— + feedback to road block information (negative feedback).
We designed the concrete system flow graphs according to the causal loop diagrams (Fig. 2).
System dynamics flow diagram.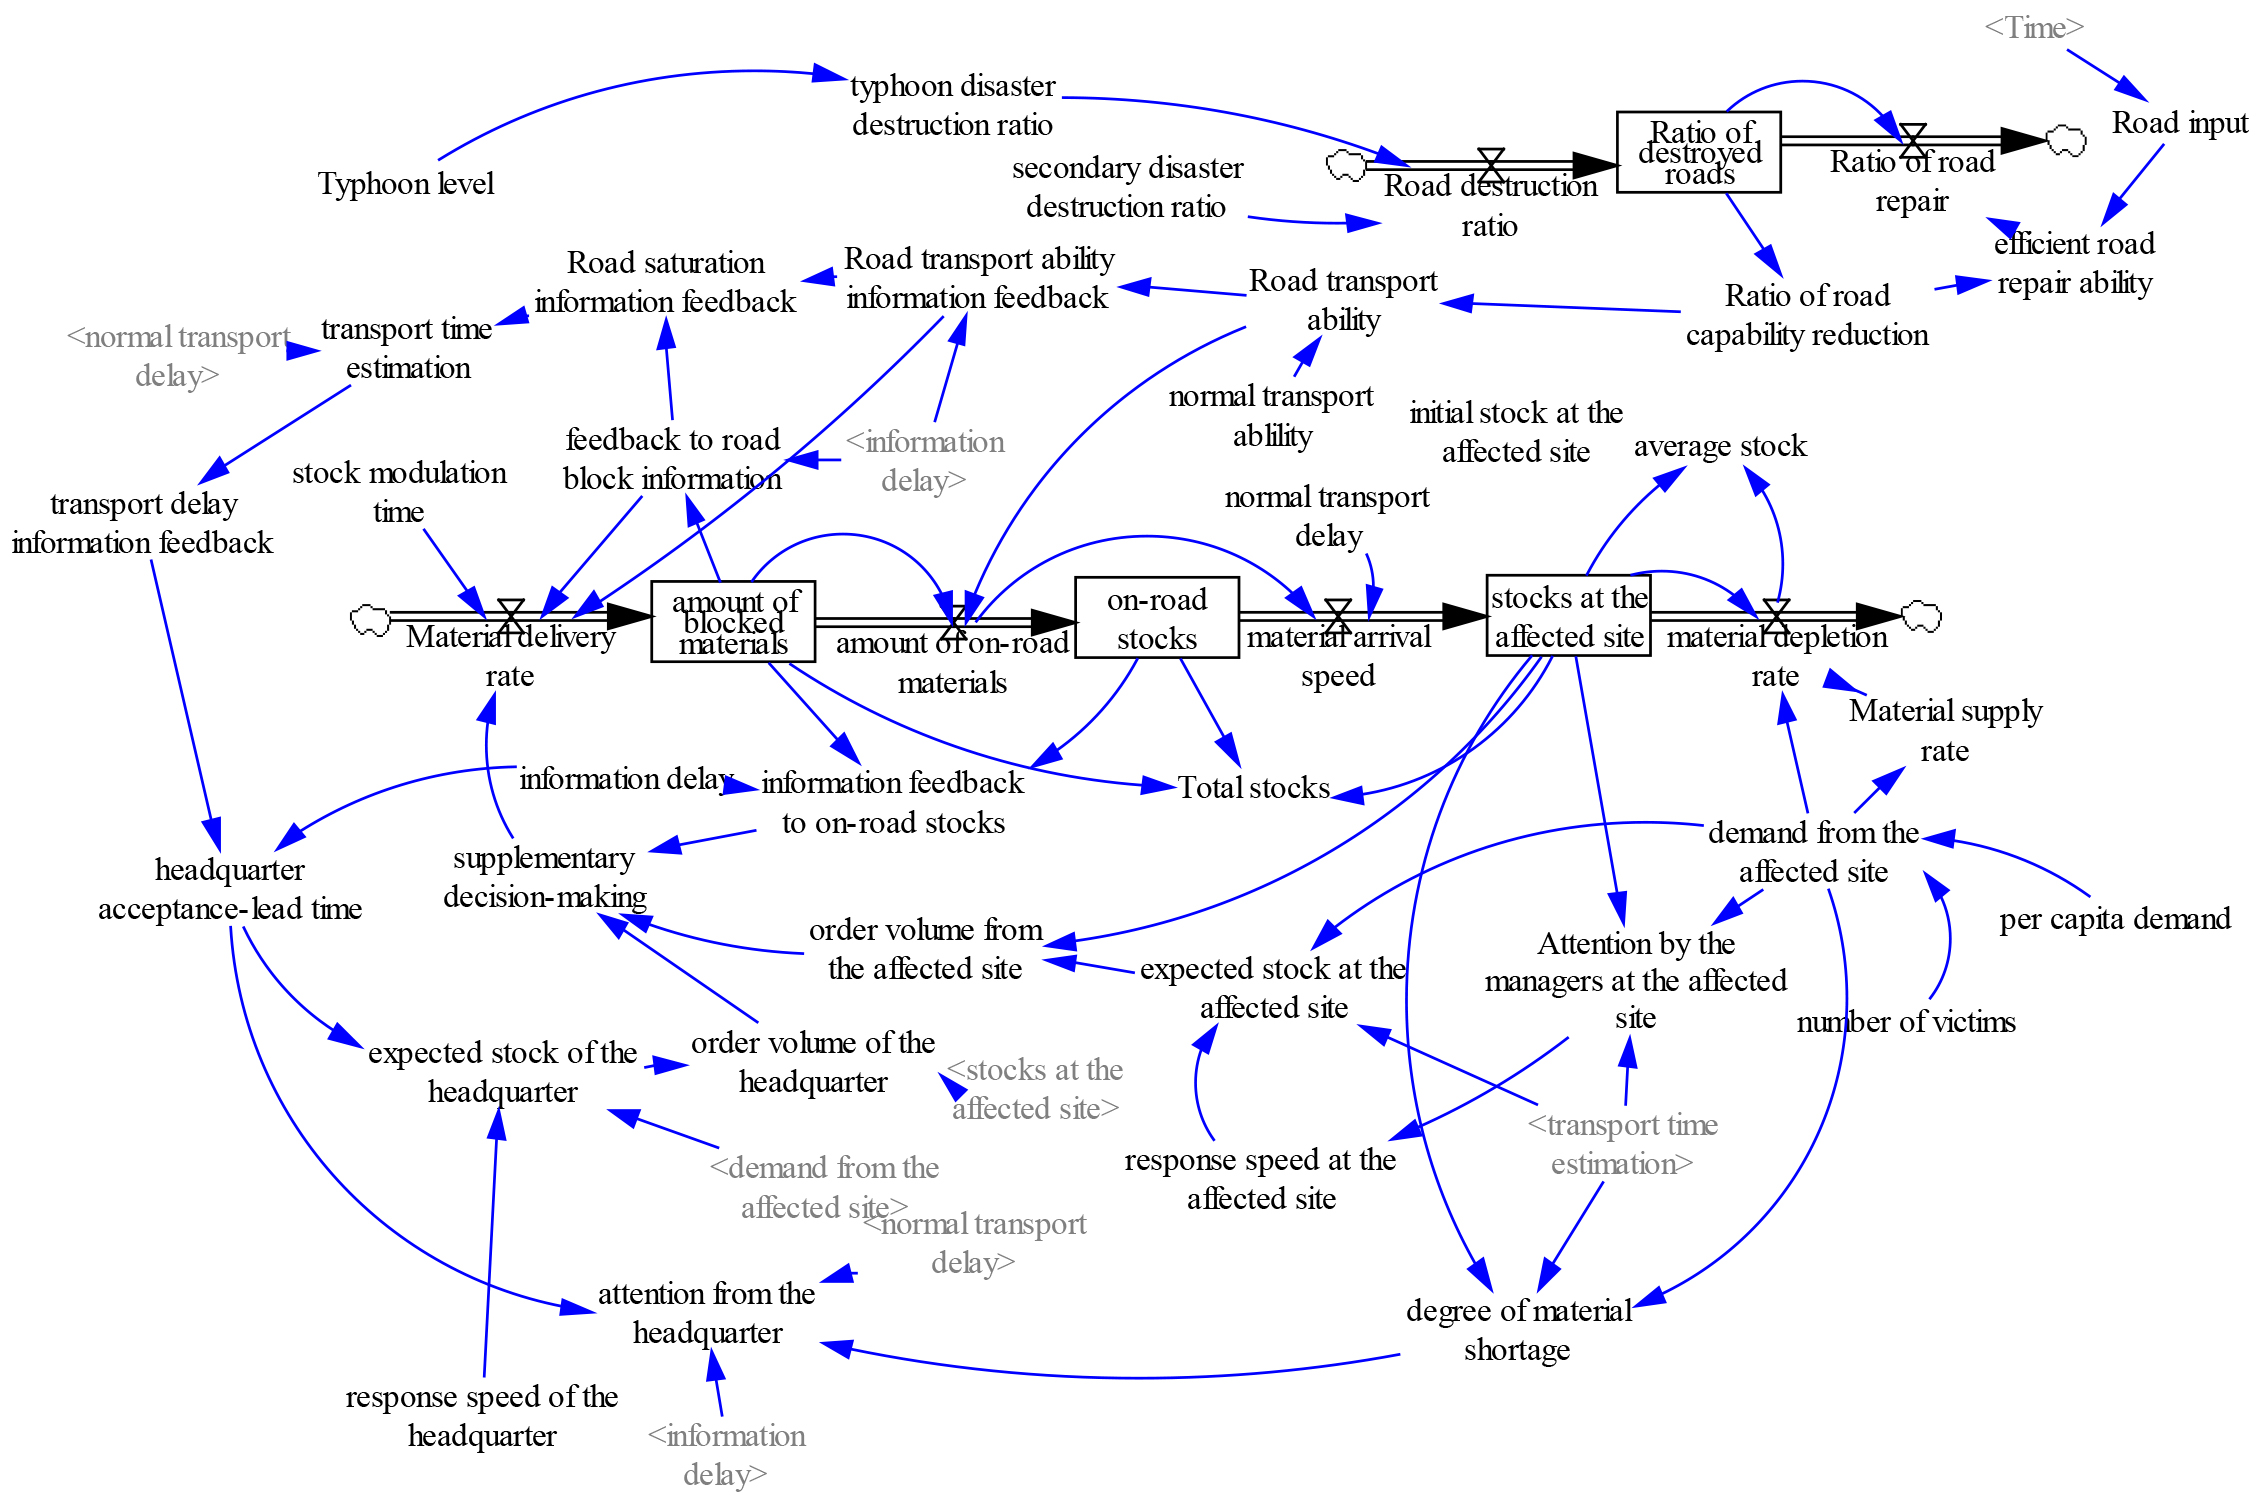
The main equations (the functions in the equations below are derived from the Vensim PLE software) and design descriptions of the model are as follows:
Road destruction ratio
Road destruction ratio
Road repair ratio
Road transport ability
Information feedback on the road transport ability
Road saturation information feedback
Estimation of transport time
Material delivery rate
Supplementary decision-making
Amount of blocked materials
Information feedback of road block degree
Amount of stocks at the affected site
Total stocks
Expected stocks at the affected site
Order volume from the affected site
Material shortage degree
Attention from the headquarter
Headquarter acceptance-lead time
Order volume from the headquarter
Expected stocks at the headquarter
Demand from the affected site
Material supply rate
Attention from the headquarter
Attention by the managers at the affected site
In this study, we focused on the Leizhou peninsula in the south most part of Mainland China. It faces oceans at three sides and has a coastline of 1180 Km. The major city Zhanjiang has a population of 9 million inhabitants. The Leizhou peninsula is located in a typhoon zone west of the tropical oceans in the southwest North Pacific. It is directly hitby typhoons from the westward path and northwestern path. This severe typhoon disaster zone is hit by typhoons in the summer at a rate of 2-3 typhoons every year. The Leizhou peninsula was stroke by typhoon Caihong from October 4 to 7 in 2015.
Based on these data, we set the parameters as shown in Table 1.
Case study parameters
Case study parameters
In system dynamics modeling and the simulation software Vensim PLE, the above constant variables were assigned and the variable expressions were used to run this model.
The simulated changes of road transport ability after the occurrence of the typhoon are shown in Fig. 3. The persistence of windstorms at the early stage of the typhoon disaster led to complete road block at the early stage and severe storm at the late stage. The initial value of material demand at the affected site mainly consisted of the unblocked population. At the late stage of the rescue and searching, the affected people were gradually discovered, which led to the gradual increase of material demand (Fig. 4).
Change of road transport ability.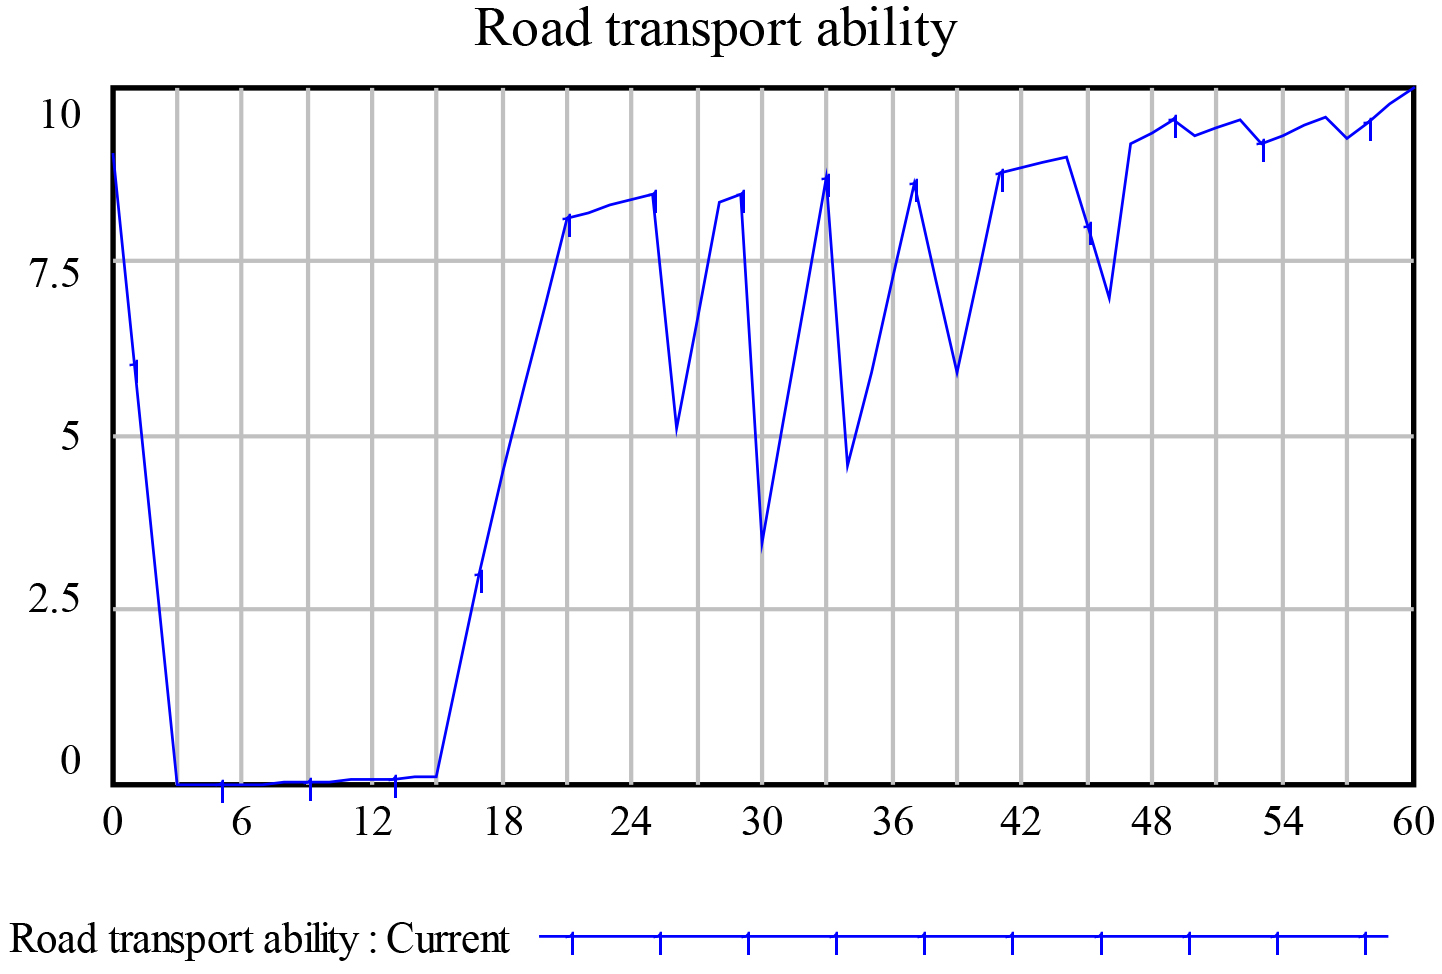
Increase of demand at the affected site.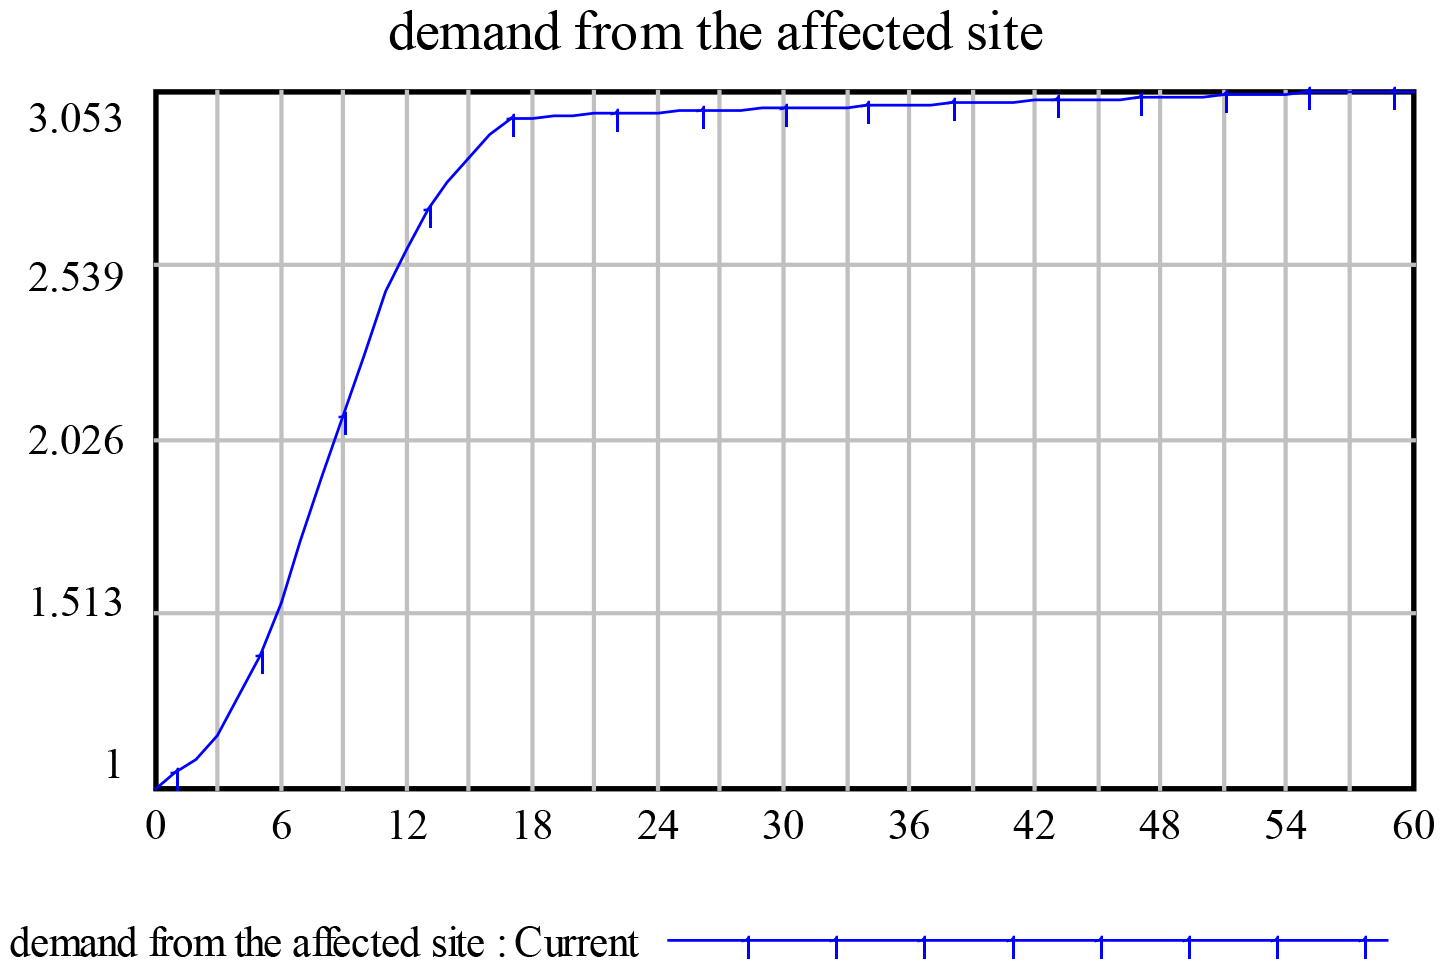
Effect of transport delay.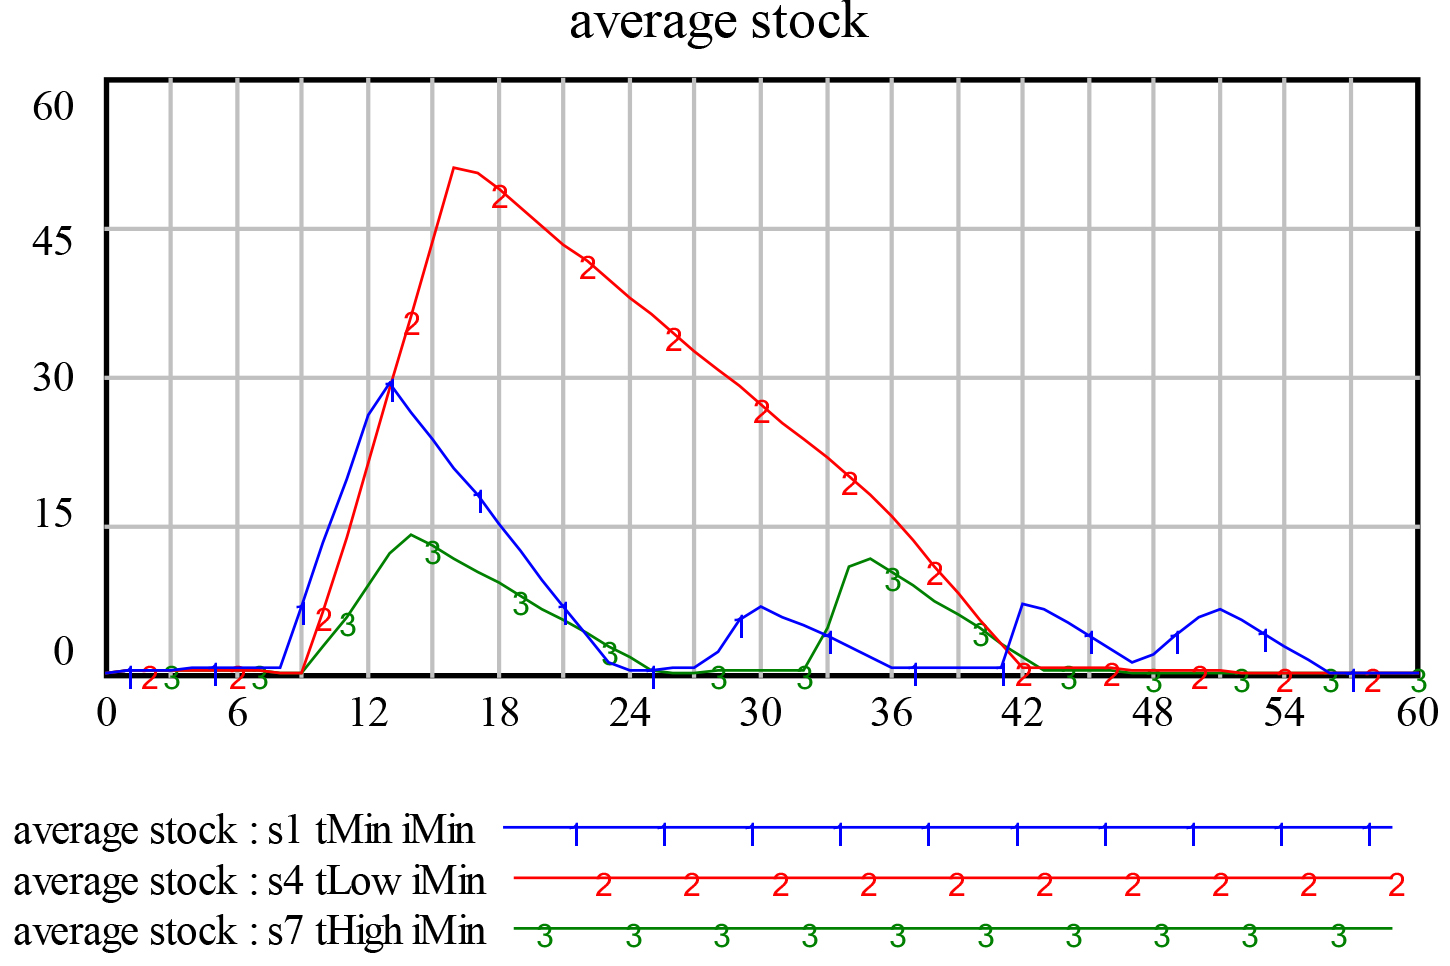
The data presented in Fig. 5 reveal show transport delay affects the average stock level of the whole system performance index when information delay was moderate. Evidently, the system average stock level significantly rises with the increase of the extent of the transport delay. With the decline of the extent of the transport delay, the average stock level significantly rises at the early stage of rescue and then stabilizes at the late stage. Thus, the transport delay would aggravate the volume of material delivery and thus the material stock level at the affected site rises, indicating that the transport delay has a positive feedback effect on the whole system.
Effect of information delay.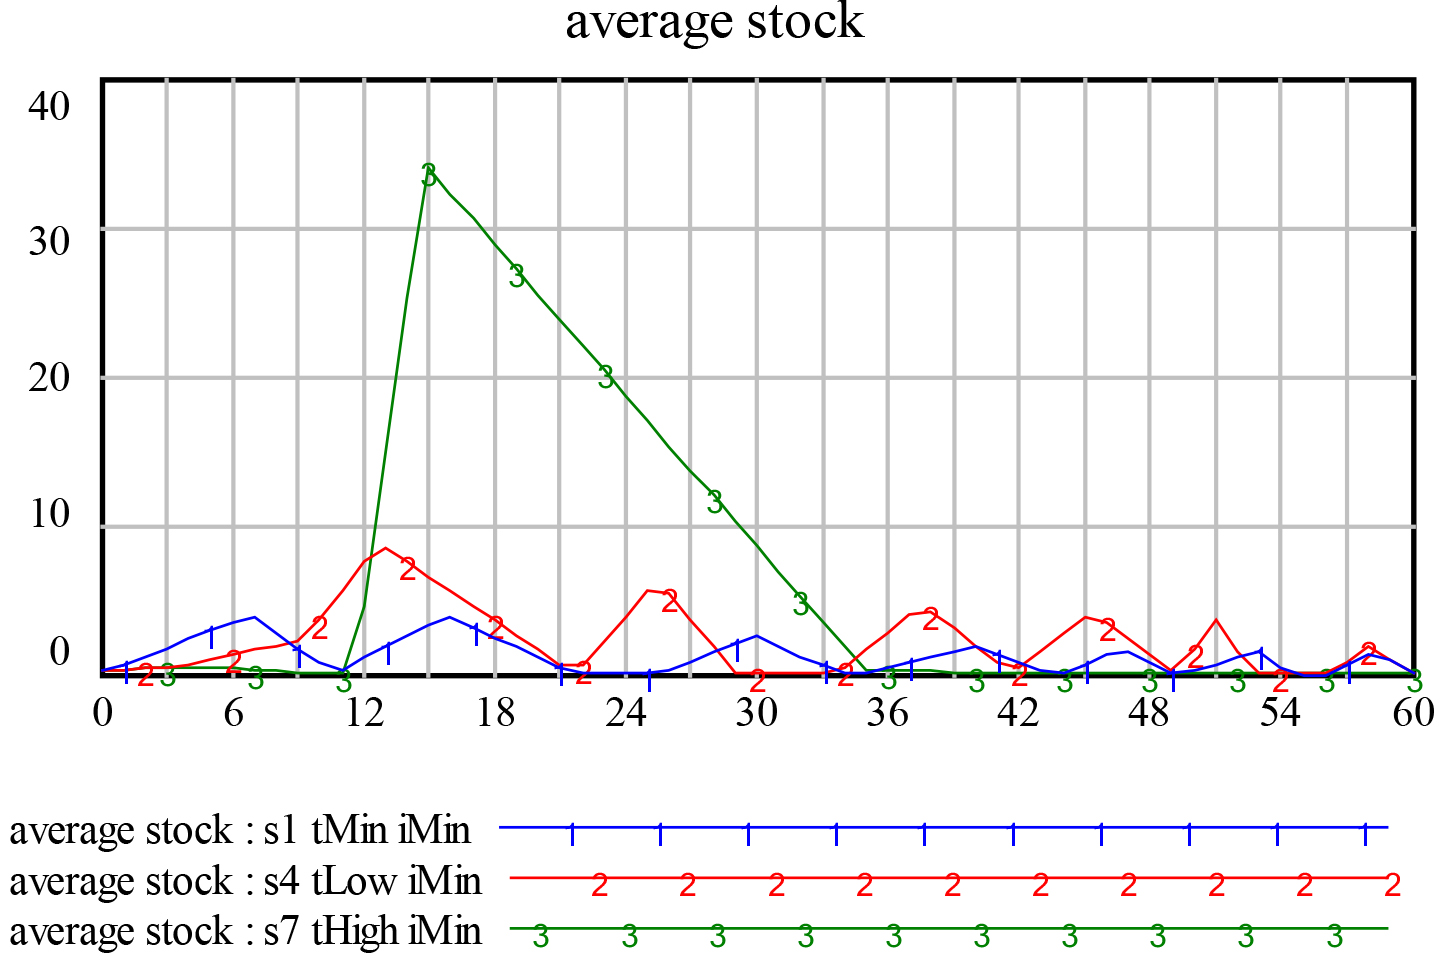
Change of information feedback to lead time.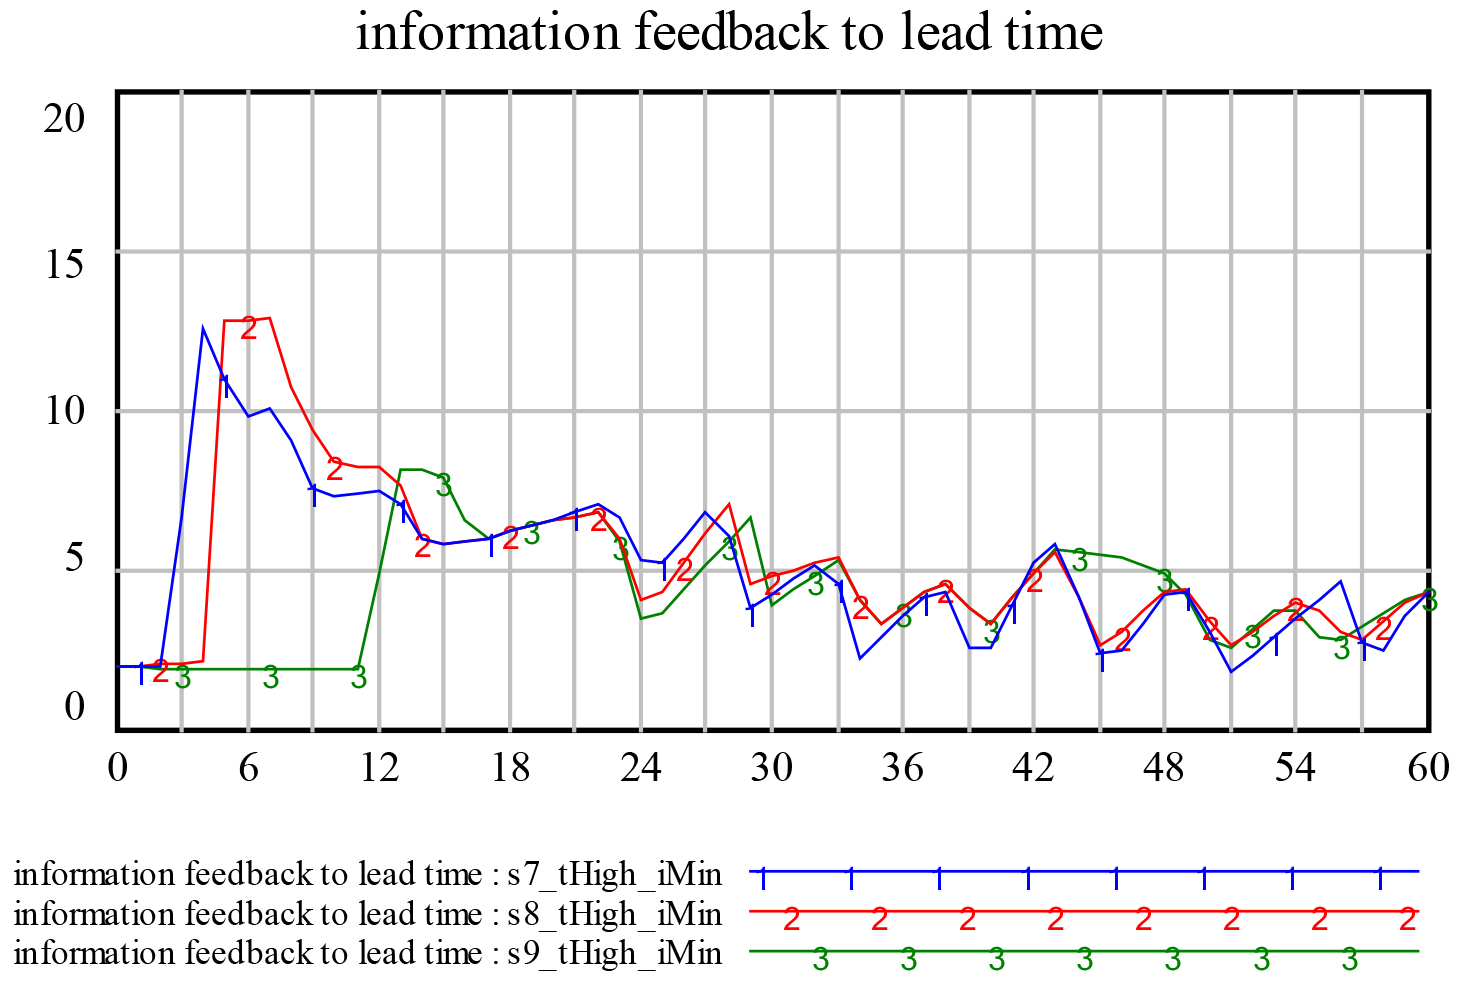
Change of information feedback to on-road stocks.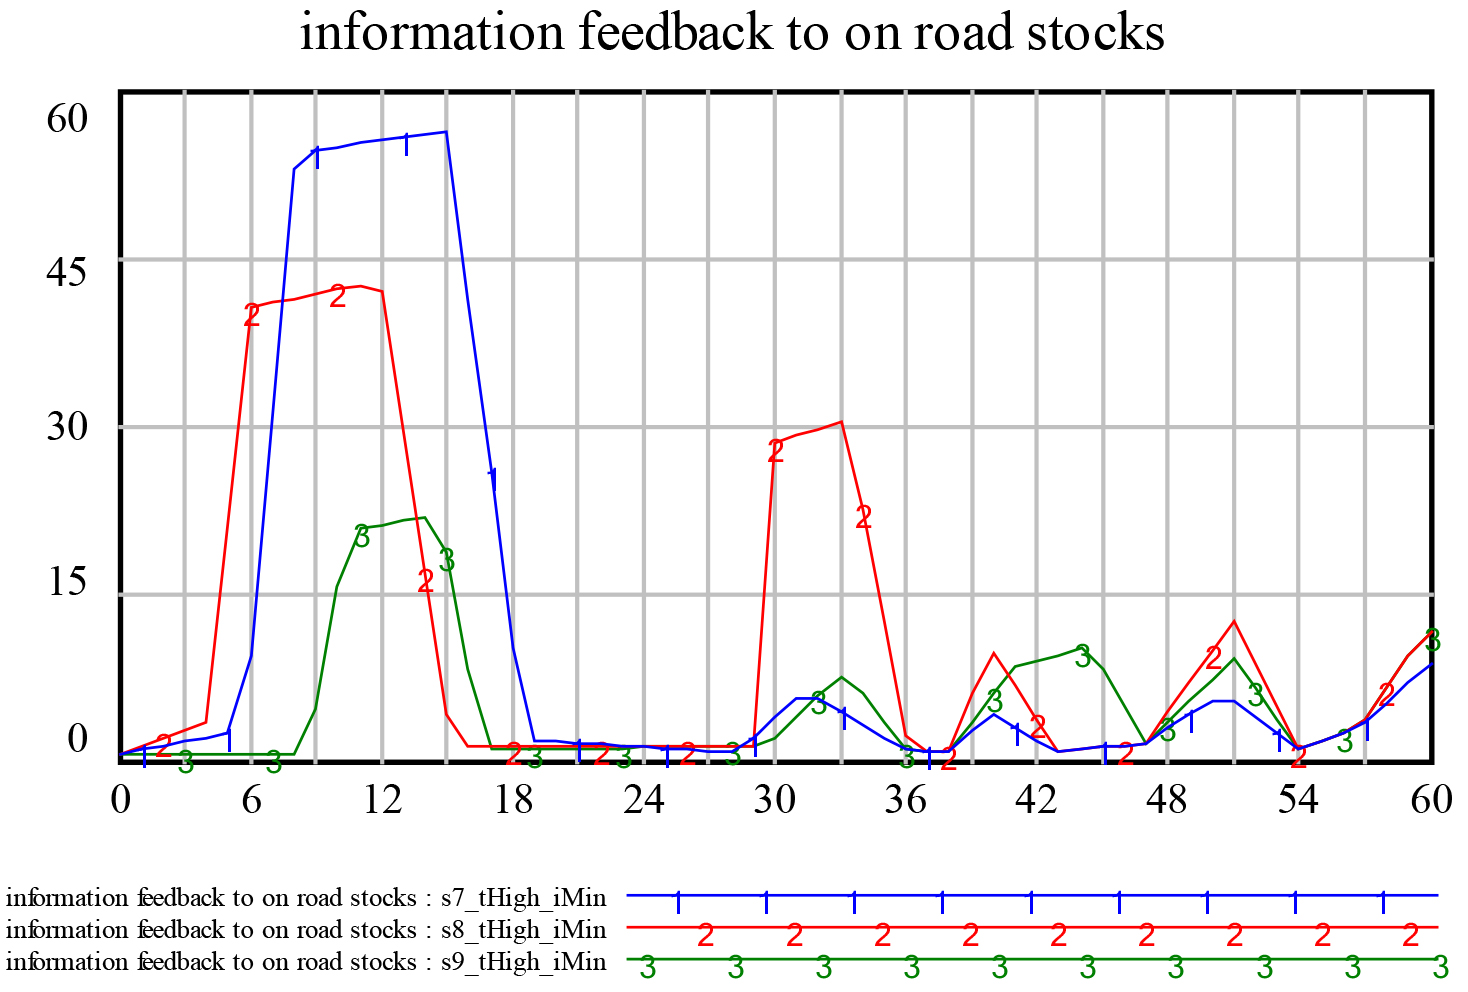
The impact of information delay is very complex (Fig. 6). The decision-maker at the relief headquarter should determine the expected stock level and volume of material delivery according to the extent of the current transport delay. However, due to the occurrence of information delay, the real value of this variable could not be noticed by the decision-makers in time, as they only know about the information feedback from the affected site. If the affected site could send feedback in time, or in other words the extent of the information delay is low, the upstream could organize and deliver materials at the faster speed.
The simulation results indicating that headquarter could promptly get relevant feedback information when the information delay level is very low are shown in Fig. 7. Clearly, the material delivery at the early stage did not largely contribute to the actual material supply. This is because the material accumulation on damaged roads was mainly reflected by the on-road stocks in the simulation results, but this negative feedback mainly acted on reducing the material delivery from the headquarter decision-makers. The effects of the information delay on the feedback mechanism are illustrated in Fig. 8. A prolonged information delay would destroy the information feedback mechanism and eventually increase the on-road stocks.
The above analyses suggest that in the emergency supply chain, if the information delay level is high, the information feedback would be affected and even delayed or blocked, ultimately affecting the replenishment strategy of the headquarter.
The emergency material distribution is a major step in the response to typhoon disasters. However, it is structurally complex and involves many aspects, including scheduling, transport and storage. This complexity is reflected not only by the elements, but also by the dynamic relations among the elements. Here, system dynamics was used to model the emergency material deployment following a natural disaster. We mainly developed an emergency material deployment model based on dynamic transport delay and information delay. In the empirical study, we simulated a typhoon attacking the Leizhou Peninsula in China, which validated the effectiveness and feasibility of the new model. We analyzed how road transport ability and demand at the affected site would affect the dynamic transport delay and information delay. The findings provide some reference for decision-making in emergency material deployment.
A series of models are proposed using a system dynamics approach to describe in detail the flow of emergency supplies and information during relief activities in typhoon disasters, and simulations are carried out to analyse issues such as replenishment strategies, information sharing, original inventory and adaptive adjustment. Information factors are introduced into the emergency supplies supply model, and the effectiveness of the fixed-value adjustment method for information delay and information response is realised through simulation. The application of this method is verified by comparing and analysing the various parameters involved through modelling and simulation.
Governments need a large amount of emergency supplies (including relief workers) to deal with typhoon events in order to mitigate the threats posed by the disaster and to ensure public health, safety and property. In typhoon disaster management, the effective provision of emergency supplies is a key factor in its success. Emergency supplies should be delivered to the disaster site in the shortest possible time, otherwise the negative impact of the event will be exacerbated and even more serious secondary disasters will occur, causing incalculable damage to society and people.
Therefore, in the aftermath of typhoon disasters, it is important to improve the efficiency of the government’s emergency material transfer and to carry out emergency material transfer in a timely manner, in order to shorten the duration of the damage and reduce the losses caused by the disaster.
This paper uses system simulation software to substitute the values of the assigned influencing factors into the simulation software to derive the development trend of the influencing factors of the typhoon disaster contingency plan, and discusses the changes of the contingency plan model in different periods in the face of the different conditions of each factor, and proposes dynamic response measures for these changes. Therefore, the model developed in this paper can be used as a reference for the government to reasonably adjust the emergency plan when responding to typhoon disaster events.
Footnotes
Acknowledgments
This work was supported by Novel coronavirus pneumonia prevention and control special research project in China’s Guangdong Provincial Education Department (No. 2020KZDZX1141) and Research project of Lingnan Normal University (No. ZL2029).