
Abstract
When using the support vector regression method to predict grain storage temperature, it is challenging to choose the appropriate model parameters. Generally, it is effective to examine the trend of grain storage temperature in different layers after ventilation intervention. To enhance the performance of a support vector machine, it is necessary to choose an appropriate parameter optimization algorithm. The adaptive particle swarm optimization algorithm completes the operation by continuously updating the particles in the spatial domain; after discussing its application principle in detail, the convergence effect is more optimal; and the algorithms are applied to parameter optimization for support vector regression models. After employing the adaptive particle swarm optimization algorithm, the evaluation indicators and experimental prediction results demonstrate that the APSO model has fewer errors, a higher tracking degree, superior generalization performance, and greater prediction accuracy. This is a useful resource for forecasting grain temperature trends.
Introduction
Granary is a special small-scale ecosystem. As stated previously, many factors determine the internal temperature. These factors include the environment outside the granary, the season, the weather, the region, the type of granary, and ventilation, among others. The process is multidimensional and uncertain. The large state-owned grain warehouses are susceptible to heat, insects, condensation, mildew and other problems, resulting in huge economic losses. Currently, these problems are reflected by granary temperatures, which means that the temperature of the granary is a significant indicator of grain condition. It The study of grain temperature change and constructing the prediction model of temperature evolution is an important research topic to reduce grain quality and quantity losses, as well as to solve the problem of grain storage security after production.
A number of temperature prediction models have been proposed [1, 2, 3, 4, 5, 6, 7]. Li et al. [1, 2, 3, 4] used a model based on deep learning and a time series model to predict the trend in stored grain temperature and pest occurrence. Wang et al. [5] used a combination of least squares and Fourier series to predict grain pile temperatures. Since China has large and deep grain storage facilities, the majority of papers on grain storage come from within the country, while information from abroad is scarce. Kumar et al. [7] propose a method for forecasting temperature that combines a new extreme learning machine and particle swarm optimization. Utilizing particle swarm optimization and statistical tools, a variety of sensor combinations that influence temperature are evaluated. This optimizes indoor energy usage but necessitates dynamic selection functions. Professor Wu, a member of the same research team as the author, investigated temperature and humidity migration, insect density, and the micro ecological environment of granaries using particle swarm optimization [9, 11]. Fung et al. [12], Aghelpour et al. [13], and Dai et al. [14] demonstrate the improved SVR algorithm’s application to climate, environmental temperature, and meteorology predictions. Hasanipanah, Xing, Cervantes, and Zheng [15, 16, 17, 18] describe methods for classifying data sets, predict air-overpressure caused by mine blasting, and predict dissolved gas contents in power transformers in their study on particle swarm optimization algorithm and SVR algorithm. Despite the complexity of large-scale grain pile temperature and the characteristics of grain storage in China, the foreign literature contains few studies on algorithms for predicting large-scale grain pile temperature.
In this paper, we investigate the prediction of the change trend in grain storage temperature in different layers following ventilation operations. On the basis of a traditional support vector machine (SVM), a self-adaptive particle swarm optimization-support vector regression (APSO-SVR) model for granary temperature prediction is presented under ventilation conditions. A comparison is made between this model and the particle swarm optimization-support vector regression model, and the advantages are demonstrated through experiments. The research demonstrates that the proposed model is capable of predicting and analyzing food security, providing theoretical support for future trend warning and decision-making, and meeting the requirements of safe grain storage and grain information.
Support vector regression
Support Vector Regression (SVR) employs a search for an optimal classification surface in order to minimize the error of all training samples on the classification surface. There is a substantial difference between support vector regression and classification problems in that the value range of variable y is changed from a fixed [
The definition of
Among them,
By introducing the penalty coefficient
Among them,
Among them,
Based on the above formula, the regression function can be expressed as follows:
In the case of nonlinear regression, the optimal regression function obtained by introducing the kernel function method is as follows:
For this study, data was selected from the simulation warehouse (high-flat warehouse) that was sampled between January 4, 2018 and December 29, 2018. The dimensions of the simulation warehouse are 6 m*16 m* 5 m. Temperature sensors installed in the warehouse are used to collect data.
From top to bottom, the warehouse is divided into three layers corresponding to grain depths of 50 cm, 250 cm, and 450 cm. According to the granary monitoring point sorting method specified by the national standard, the temperature sensors are arranged according to the following layout: the sensor is 0.5 m away from the wall in the horizontal direction, and the distance between the sensors is 5 m; the sensor is 0.5 m away from the wall in the vertical direction, and the distance between the sensors is 2 m. On each floor, eight temperature sensors are located, for a total of 24 temperature detection points. Figure 1 illustrates the basic situation in the simulation warehouse selected for this study.
Warehouse basic situation table
Warehouse basic situation table
To accurately study the temperature change and migration of the grain reactor, and to precisely determine the variation of the temperature field and the micro-flow, the temperature trend is analyzed based on the dimensions of the first, second, and third layers, in accordance with the principle of zonal stratification. The trend of data variation measured by temperature sensors in each layer is shown from Figs 1–3.
Temperature change diagram of the first layer sensor node.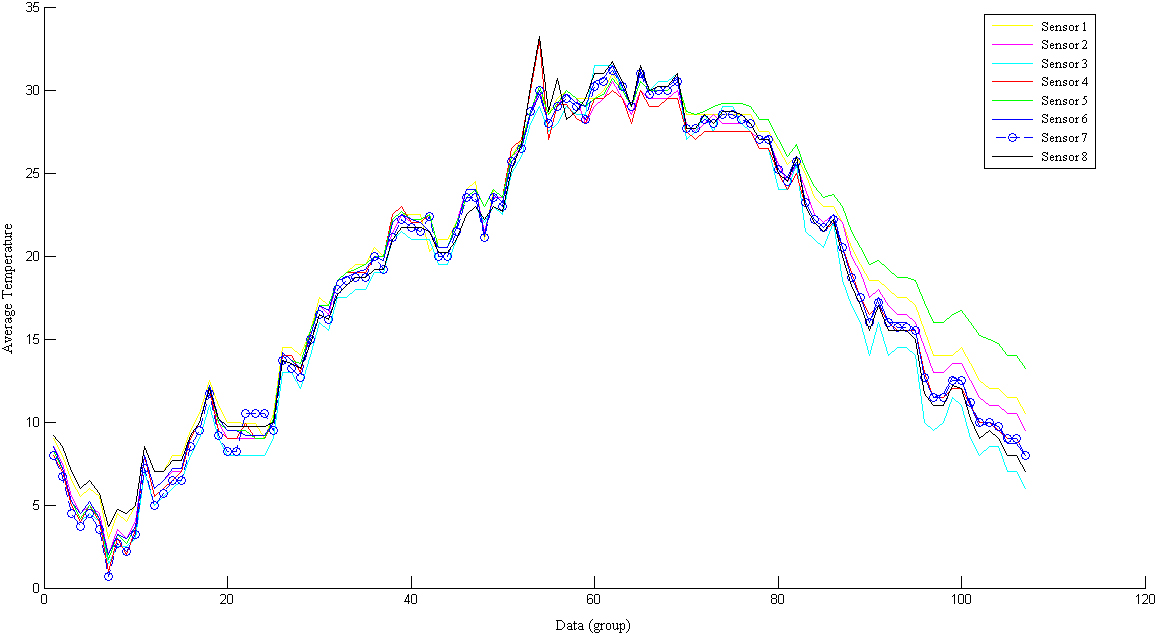
Temperature change diagram of the second layer sensor node.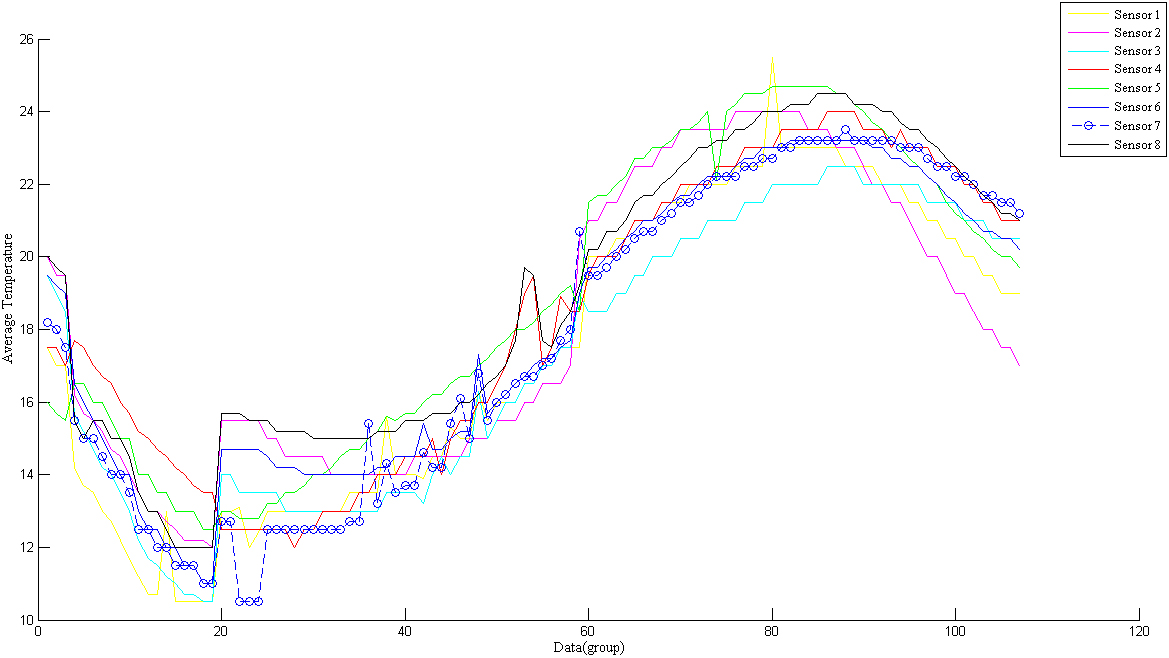
Temperature change diagram of the third layer sensor node.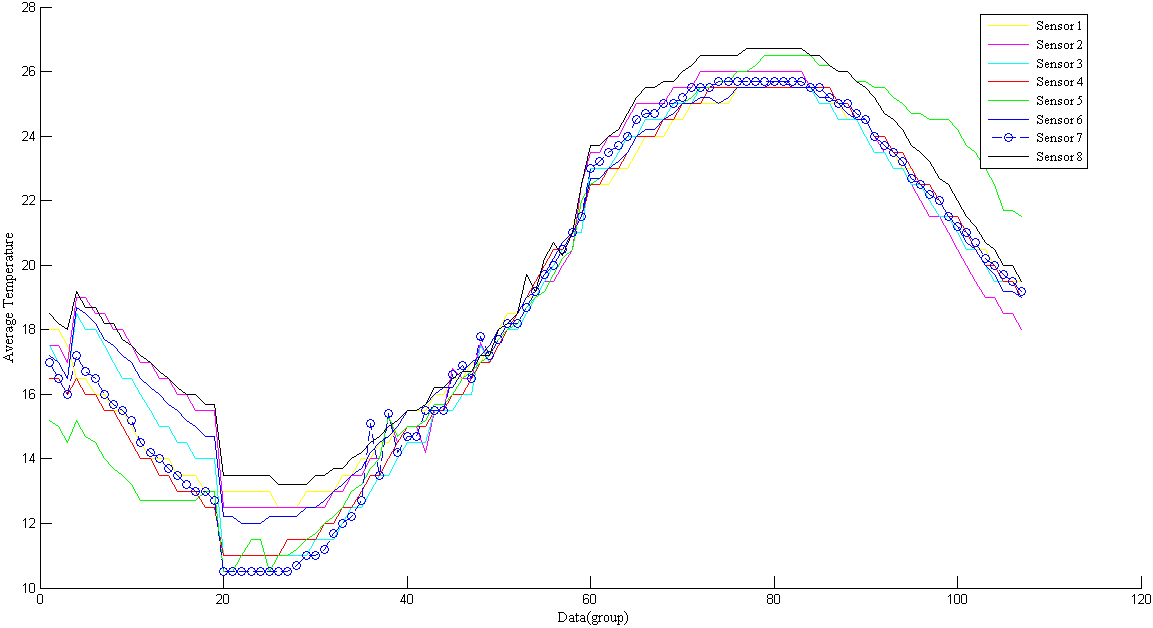
According to the above figures, the temperature trend of three horizontal cross-sections (layers) is the same as the average change in temperature of each layer. If the data volume is large enough, the whole change process is sinusoidal.
Temperatures will continue to decrease in winter. The temperature will continue to drop as the temperature field and micro air flow field inside the grain pile move and change alternately. As the seasons change, the temperature of the grain pile will rise with the external environment. At the beginning of June, the temperature begins to rise significantly. In September, the temperature begins to decline. During this stage, ventilation operations must be carried out based on the conditions in order to reduce excessive grain pile temperatures. We have found that the starting and ending times of each layer are different. This can be attributed to the different conditions within each layer, the temperature field and the micro airflow migration speed and law.
If the key parameters of the support vector machine algorithm can be successfully set, the traditional support vector machine model can provide good prediction results when applied to practical problems with small sample features. When the trained sample data is too small, overfitting usually takes place, and there is no complete and mature theory for selecting the parameters for support vector machines, which creates great difficulty in the research and development of classification and regression. In support vector machines, the four most important parameters are the kernel function, penalty factor, kernel width, and fitting error. These parameters play the following roles:
On the basis of a comprehensive analysis of the performance of SVM regression estimation method parameters, this paper proposes an adaptive particle swarm optimization-based method for optimizing key SVM parameters (APSO). The improved support vector regression method is used to predict and simulate grain temperature based on grain storage temperature data. The results indicate that, compared to the conventional support vector regression method, the enhanced support vector regression method has improved prediction accuracy and speed.
In this algorithm, a set of random particles is initialized, and the fitness values of each particle are calculated iteratively to find the optimal solution. Set a particle space with arbitrary dimensions consisting of m particles. In order to calculate the fitness value, the position of the i-th particle can be expressed as
In PSO, one of the important research directions consists of enhancing the convergence rate and preventing the algorithm from sinking into local optimum. Several improved PSO algorithms have been developed. In such improved schemes of the PSO algorithm, the usual measures include reasonable control over the algorithm parameters, the addition of new effective operators, and improvements to the topological structure of the population. In this study, the main purpose of PSO is to enhance the optimization characteristics of the algorithm by increasing the number of effective operators. In addition, it is important to adjust the parameters of the algorithm.
Based on the characteristics and principles of PSO, there are seven main parameters in the implementation.
The coefficient of inertia. This parameter is critical for balancing the global and local search capabilities of the algorithm. The higher the inertia coefficient, the better the global search ability and the worse the local search ability. Conversely, the smaller the inertia coefficient, the weaker the global search ability and the stronger the local search ability. The number of particles, also referred to as the population size. Furthermore, the number of particles affects the search ability and the processing time of the algorithm. The greater the number of particles in the search, the wider the search range, and the easier it is to find the global optimal solution. This, however, will result in more computational consumption. If the number of particles is small, the sample information will be less. This will mean that the algorithm will have less global information to work with, and the result will be more likely to sink into local optimum. Generally, the number of particles is between 20 to 40. The number of particles equal to 10 is usually sufficient for most problems to achieve satisfactory results. In the case of difficult problems or problems that belong to specific categories, the number of particles is larger, such as 100 or 200; The spatial dimension of the particle, which is the length of the solution, is related to the nature of the problem; The range of particles, each dimension can be set at a different range, based on the optimization problem; The maximum flight speed The constant terms Termination condition: Terminates when the minimum number of errors as well as the maximum number of cycles are met.
In light of the analysis of each parameter of the above particle swarm optimization algorithm, the article mainly optimizes the original particle swarm optimization algorithm from three perspectives:
(1) Using the fuzzy rule, the value of the inertia coefficient
(2) In PSO algorithm,
Among them,
(3) A variation factor is introduced in order to prevent the algorithm from falling into the local optimal solution. Once an accuracy is determined, when the average distance between the particles is less than the precision, the components in the particle velocity are re-initialized to destroy the original particle aggregation state, and the search update is performed again in the solution space, including particle speed updates and location updates. The corresponding update formula is as follows:
Increasing the mutation operator
Table 2 illustrates the improved adaptive particle swarm optimization algorithm and the original particle swarm optimization algorithm.
Comparison of APSO and PSO optimization results
Comparison of APSO and PSO optimization results
This is how a comparative analysis can be conducted: Compared to the particle swarm optimization algorithm, the test function 1 comparison result indicates that the two algorithms consistently find the optimal value when applied to the simple function. The comparison of test function 2 reveals that when the number of iterations is large, the complexity of the function is relatively high, the stability of the conventional particle swarm algorithm is reduced, and the convergence rate of APSO is significantly different from that of the conventional algorithm. The comparison result of test function 3 demonstrates that when complex functions are analyzed, the convergence speed of traditional particle swarm algorithms is significantly slower than that of ASO. The adaptive particle swarm optimization algorithm would be ideal for the next study.
Based on the results of the sample data analysis, the measured data set is selected as the sample data set. The same data normalization method is applied to the sample data as well, and the data is still normalized into the interval. Gaussian radial basis kernel function (RBF) has an excellent computational performance and is well suited to regression modeling using support vector machines. As a result, it is still used as a regression model kernel function and adaptive particles are applied. The group algorithm optimizes the penalty factor
In the initialization parameters of the APSO, the maximum evolution algebra is set to maxgen
Comparison of the fitness curve of the first layer PSO (left) and APSO (right) of the grain pile.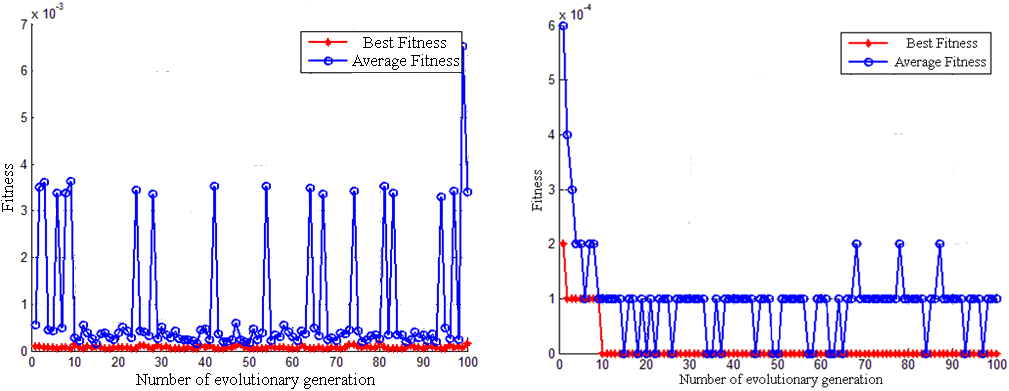
As a result of the above search process, Table 3 displays the results of the relatively best penalty factor
Comparison of APSO algorithm optimization results
Comparison of the PSO (left) and APSO (right) fitness curves of the second layer of the grain pile.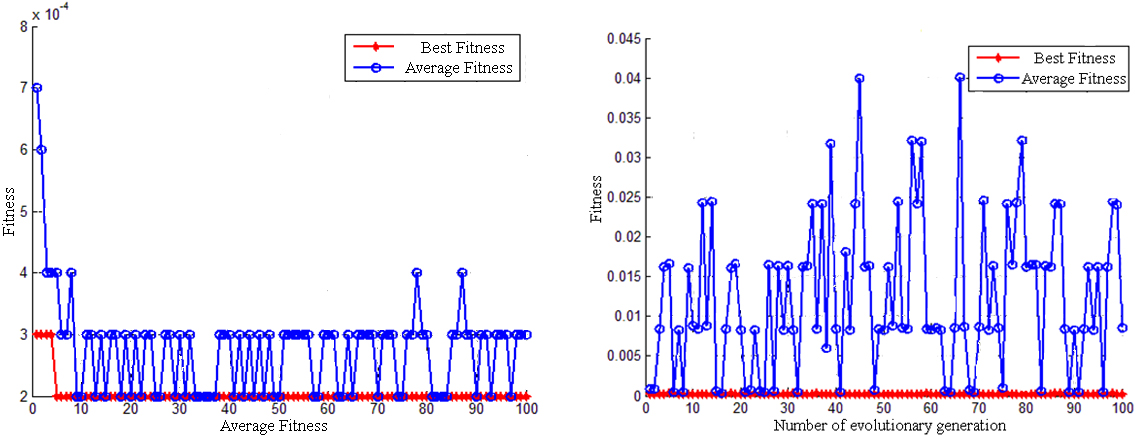
Comparison of the fitness curve of the third layer PSO (left) and APSO (right) of the grain pile.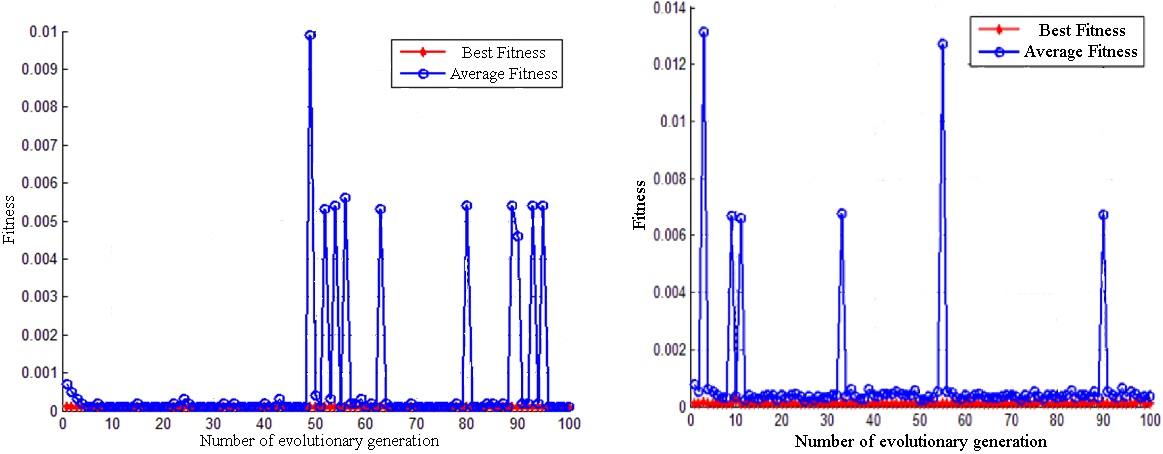
The simulation results reveal that for the adaptive particle swarm optimization algorithm, even though the average fitness value fluctuates slightly, the algorithm converges rapidly, and the optimal fitness can be achieved within 10 generations, which is quick and convenient.
On the basis of the three grain pile layers, the optimized support vector machine regression algorithm is employed to establish the model, and the prediction results are evaluated. Particle swarm optimization is used to optimize the parameters. Figures 7–9 illustrates the prediction results from comparing the actual value to the predicted value for three layers.
Comparison of actual and predicted values of APSO-SVR in the frist layer of grain reactor.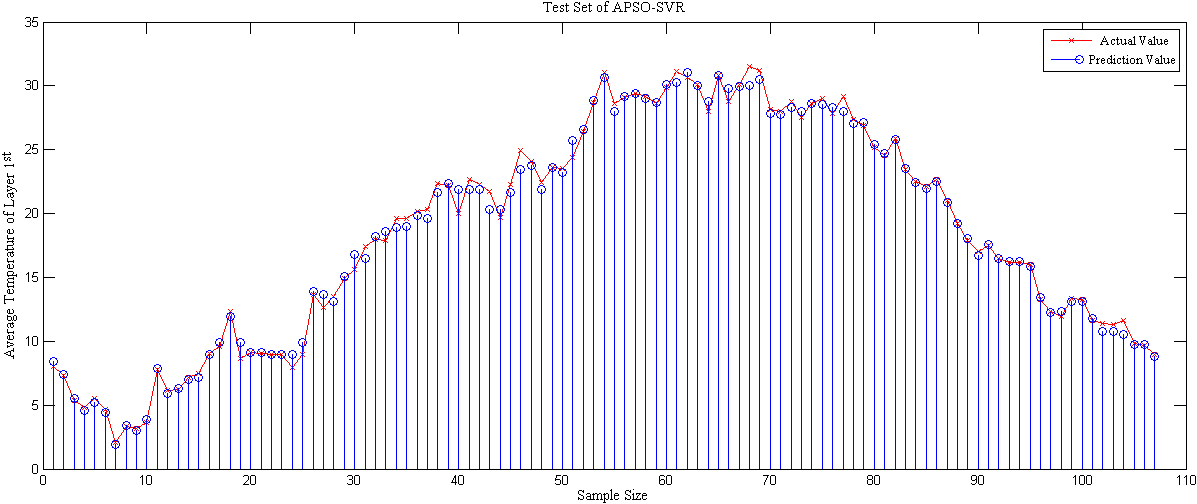
Comparison of actual and predicted values of APSO-SVR in the second layer of grain reactor.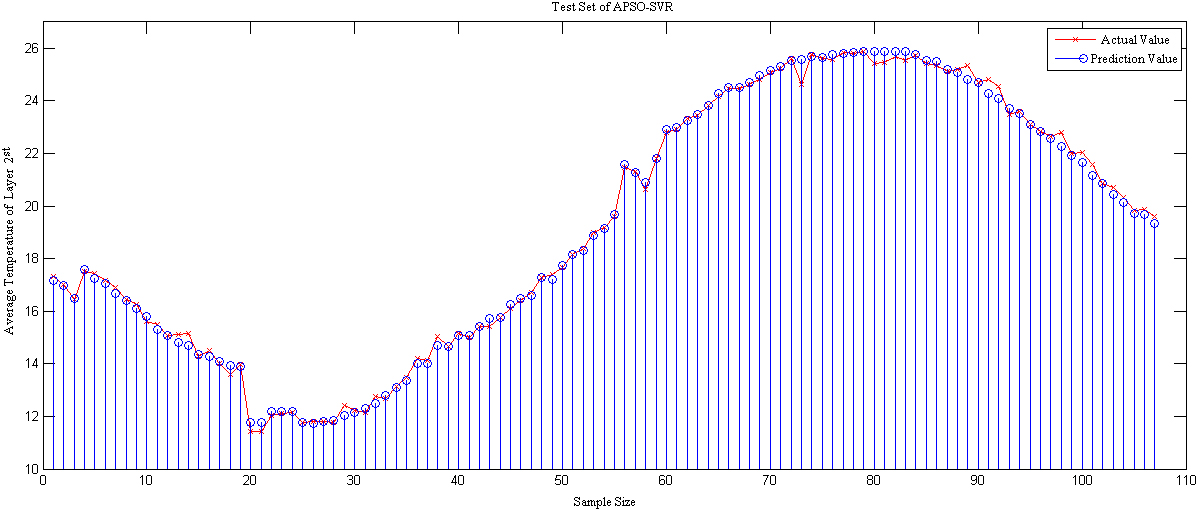
As depicted in Figs 7–9, the APSO-SVR model is more stable, has superior tracking performance for the test set, and is able to predict rapidly and precisely when the average temperature profile fluctuates substantially.
Using MAE and RMSE performance evaluation indicators, we can compare and analyze the models optimized using PSO and APSO heuristic algorithms. Table 4 summarizes the results.
Evaluation index of the first layer model of grain pile
Comparison of actual and predicted values of APSO-SVR in the third layer of grain reactor.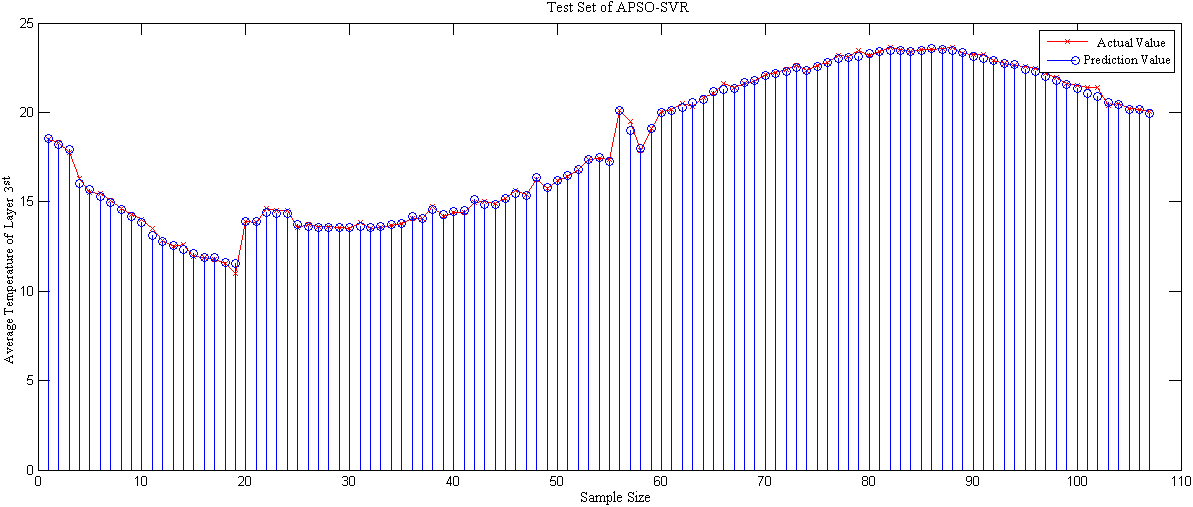
According to the above table, the MAE maximum value of the APSO-SVR model is 0.0127, the minimum value is 0.0079, the maximum RMSE is 0.0153, and the minimum value is 0.0103. The MAE of the PSO-SVR model is 0.0850, while the minimum value is 0.0108. Accordingly, the maximum RMSE value is 0.092 and the minimum value is 0.0126, indicating that the support vector machine regression model optimized using the adaptive particle swarm optimization algorithm has stronger stability, better generalization and tracking capabilities, and is better suitable for predicting grain storage temperatures in a non-linear manner.
The following conclusions can be drawn:
The adaptive particle swarm optimization algorithm can achieve the best fitness within 10 generations, showing excellent convergence performance with a simple algorithm and an ideal convergence effect. The optimal output of the penalty factor The APSO optimization model can serve as a useful reference when it comes to predicting the temperature field of grain piles because it has small error, high tracking degree, and superior generalization ability.
Footnotes
Acknowledgments
This research was supported by the “Jie Bang Gua Shuai” science and technology project of Henan Province (211110110500).