
Abstract
Based on the development of the 3D vascular printer, the forming process of ink from the nozzle to the rotating rod was studied. In this study, to online detect the ink flow from the nozzle during 3D bioprinting of tubular tissue, we established a geometric model according to the region of interest (ROI) of the ink flow picture of 3D printing of tubular tissue, selected description features of the ink contour, and studied how to select mathematical expressions of the features. Principal component analysis (PCA) was used to simplify the image features into 15 features. We used a back propagation (BP) neural network to predict the printing ink flow. The results show that the error between the actual ink flow rate and the flow rate based on the BP neural network is within 5%. The BP neural network can be used to monitor the quality status of the printing target in real time, evaluate the 3D bioprinting quality online, and predict the printing ink flow for the subsequent improvement of the 3D bioprinting accuracy of tubular tissue.
Introduction
The 3D bioprinting technology is one of the frontier research fields in tissue engineering, and its forming process and quality monitoring are the main research contents. The quality of traditional 3D bioprinting products is usually measured by manual observation and at laboratories, which requires specialized detection knowledge and professionals and is time-consuming and inefficient [1, 2, 3]. With the rapid development of computer technology and artificial intelligence, the automation degree improves, the demand for machine vision applications increases, and the quality inspection of products in various industries from the traditional manual inspection to machine vision inspection is the inevitable trend of automation development. Machine vision inspection has the characteristics of non-contact, sustainability, continuity, high precision and high efficiency and is especially suitable for 3D bioprinting [4, 5, 6].
Taking the tubular tissue formed by a bio-hydrogel material as the research object, we used the developed 3D bioprinter to study the forming process of ink from the nozzle to the rotating rod. The printing parameters, including the ink, nozzle diameter, temperature, and nozzle moving speed, were analyzed. We obtained irrelevant components of images and important characteristics by a principal component analysis (PCA). A prediction model of printing ink flow was established based on a back propagation (BP) neural network. The influence of printing parameters on the forming process of tubular tissue was studied, and the arrangement state of printing ink on the rotating rod was predicted. Based on this, we developed a visual monitoring system for tubular tissue printing to judge the quality of online tubular tissue forming and predict the print flow rate.
Geometric model of ink in the region of interest (ROI) of tubular tissue
In machine vision and image processing, the region of interest is called ROI [7]. The extraction of a contour is only the original description of an image, and the features of the image need to be further extracted. One or more features were extracted from the segmented image and were set as target features. These features are directly related to the flow rate and can be used to predict the flow rate of the ink for subsequent printing.
Under pressure, the ink can flow from the nozzle onto the rotating rod. In the actual printing process, the camera is always aligned with the printing area, and the relative position of the nozzle is fixed, so the geometric characteristics of the ink contour of the tubular tissue image can represent the characteristics of the tubular tissue image. Setting the printing movement direction of the nozzle as the
Geometric model of the ROI.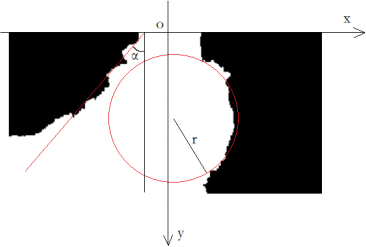
During the actual processing of the image, we selected the brightness of the image and the diameter of the inner circle of the image as the eigenvalues of the image and used the PCA to reduce the dimension of the image. A total of 12 eigenvalues of the image were extracted. We built a BP neural network for training to predict the image flow analysis [8, 9]. The brightness of the image, the radius of the tangent circle and the area of the tubular forming region were selected as the characteristic values.
Calculation of brightness
We took the extracted ROI as the computed image for the analysis [10]. Its brightness can be calculated by the following formula:
In the actual calculation, since the binarized image is composed of two kinds of data, i.e., 0 and 255, only the number of points with a statistical gray value of 255 needs to be calculated. The formula is as follows:
The radius of the middle circle can be obtained by calculating the radii of the smallest circumjacent circle and the largest circumjacent circle. It is assumed that the radii of the smallest and the largest circumjacent circles are
The calculation process of the minimum inner circle is as follows. It is assumed that the center of the circle is in the contour, and a point is at the same distance from all points in the contour. The radii of the minimum outer circle and the maximum inner circle can be obtained by calculating the position of this point [11].
The included angle of the right contour of the ink can be mainly determined by the included angle between the fitting line of the ROI contour and the vertical direction [12].
Regional characteristics
Regional features refer to the features proposed according to the segmented region itself [13, 14]. The regional area is the simplest feature of a region. Its calculation formula is as follows:
The peripheral geometric primitives of a region can provide many useful regional features. Figure 2(a) shows the minimum external rectangle of the target region parallel to the axes. This rectangle is the border of the target image and can be calculated using the maximum and minimum values of the abscissa and ordinate of this region. The parameters of this rectangle can be used to calculate the width, height and aspect ratio of the region. These border parameters are particularly critical for quickly determining whether an intersection exists between two regions [15]. However, since the minimum parallel axis sometimes cannot revolve the target region very closely, the minimum external rectangle needs to be defined in any direction, as shown in Fig. 2(b).
(a) Minimum external rectangle parallel to the axes; (b) Minimum external rectangle in any direction.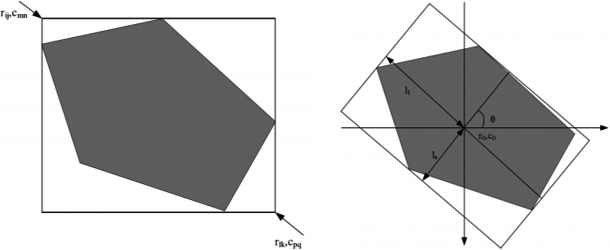
Contour features are generally curves formed by a series of points and represent the shape of an object in the image. The contrast of the edges of the contour, the contour is continuous. We can obtain the minimum outer and maximum inner circles in the ROI through contour features.
Closed contours form enclosed regions, so the moment and convex hull of regional features can be directly converted to contour features with sub-pixel precision. The moment of a closed non-self-intersecting contour is defined as:
Similar to the region, the normalized contour moment has rotation invariance, translation invariance and scale invariance, and the area surrounded by the contour is the same as the regional area [16]. The formulas for calculating the area and center of the contour are as follows:
The PCA extraction: PCA is generally used for dimensionality reduction of data. In image processing, an image can be regarded as a matrix, the size of which is equal to the resolution of the image. If each pixel value of the image is regarded as a feature, there can be tens of thousands of feature values. Therefore, in the actual operation process, an excessive amount of data can be caused. If a mathematical relationship exists between two variables, another variable can be used to represent the two variables [17]. By PCA, we can find all variables that are interrelated, remove duplicate variables, and represent the original variables using as few variables as possible. This facilitates the subsequent processing of the variables and reduces the amount of computation. The essence of image processing is to project the image into a high-latitude space [18]. As shown in Fig. 3, in the actual research process, the features of the whole image can be completely expressed by solving several principal components of the PCA.
Two sub-vectors of PCA model parameters.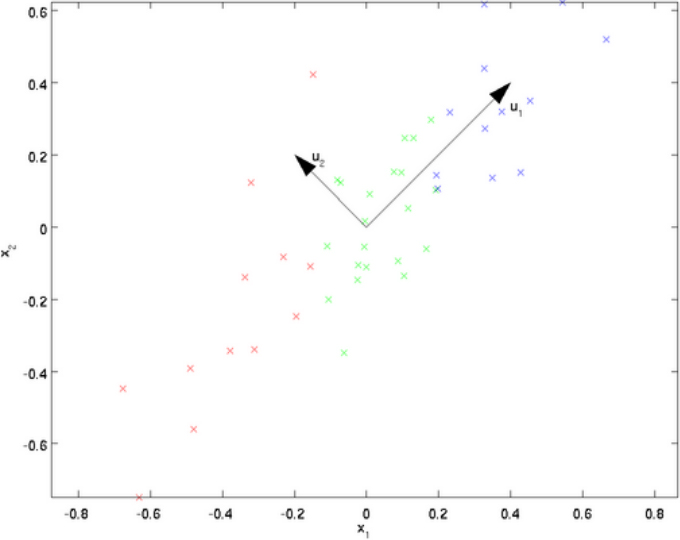
Through PCA, we can project image data into an optimized feature subspace, calculate its variance, and obtain the maximum component in the subspace. By obtaining an orthogonal change matrix
It is assumed that the original data
Each pixel in the image with a size of
The average vector can be expressed by:
Its cosquare matrix is:
For high dimensional data, assuming
Multiply both sides of Eq. (8) by x to get:
According to the above formula, the eigenvector is
BP neural network
An error BP neural network is a mathematical calculation method that imitates human neural networks. By training sample data and modifying the weight value of the neuron, the error of an objective function can be reduced, and the output value continuously approaches the desired output. It is a widely used neural network model in various fields, such as function approximation, data compression, time series prediction, and pattern recognition [20].
As shown in Fig. 4, a BP neural network consists of an input layer, hidden layer and output layer. The hidden layer can be one or multiple layers. The design of a BP neural network mainly includes the design of the network structure, the selection of input and output parameters and the design of the hidden layer. The number of hidden layers and the number of neurons in each layer directly impact the technology of the whole neural network. Too many layers easily lead to over-fitting operation and increase the amount of calculation. The number of the hidden layer is usually determined by an empirical formula.
Three-layer structure of a BP neural network.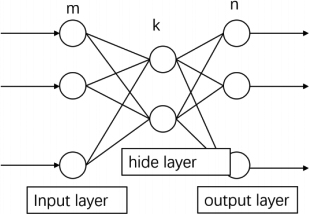
Flow chart of the BP neural network.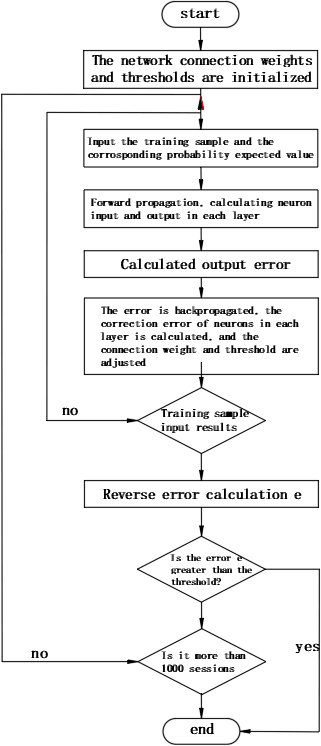
The initial weight value of a BP neural network is generally selected as a random number between
A BP neural network can be used to predict the ink flow. In the actual process, it is assumed that the output probability is 1, and the result of each output is 1* probability value. Real results are obtained. Through extraction, we can obtain 15 eigenvalues, which are used to predict the actual printing ink flow. The eigenvalues mainly include the printing pressure, gray mean, gray standard deviation and deviation, area in shape features, maximum fitting circle radius, angle
The number of the hidden layer is mainly determined using an empirical formula. The output is the ink flow rate. The expected error of BP neural network training is set to 0.001, and the maximum training number is set to 10000 times. The activation function is the sigmoid function. The ink flow rate is assumed to be linearly dependent on the printing pressure. The output ink flow is divided into 12 categories. The BP neural network is calculated by the TensorFlow software platform of Google. The calculation flow of the BP neural network is shown in Fig. 5.
Prediction results
According to the calculation process of the BP neural network shown in Fig. 5, the input data reaches the hidden layer through the activation function, and then the output data is obtained. The data is compared with the expected value to obtain the error. The difference between the obtained output value of the BP neural network and the actual expected value is large. It is necessary to calculate the error backward and modify the weight to reduce the error of the output value of the next BP forward. Figure 6shows the declining process of the predicted error of the ink flow in the 3D printing of tubular tissue.
Declining process of the predicated error.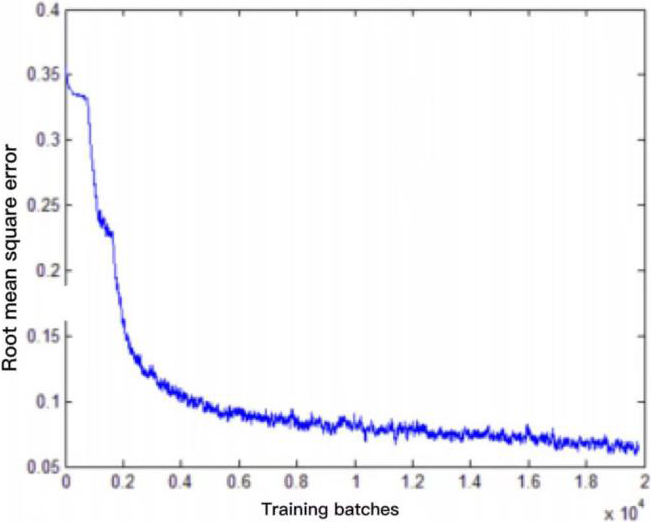
After the training, the BP neural network can be tested with test samples. The training error and validation error are shown in Fig. 7, and the actual fitting figure of the model prediction is shown in Fig. 8. The test results show that the accuracy of the prediction algorithm is 86.3%, and the time is 68.1 ms. The average processing time of each image is 0.91 ms.
Training error and verification error.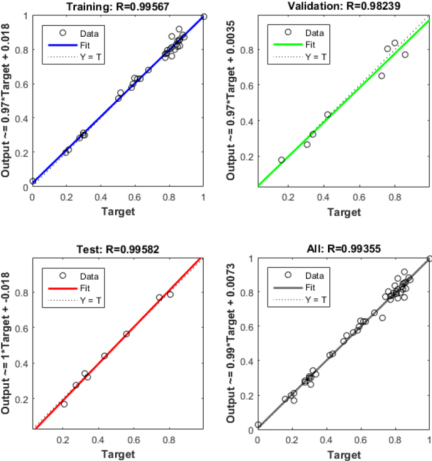
Actual fitting figure of the model prediction.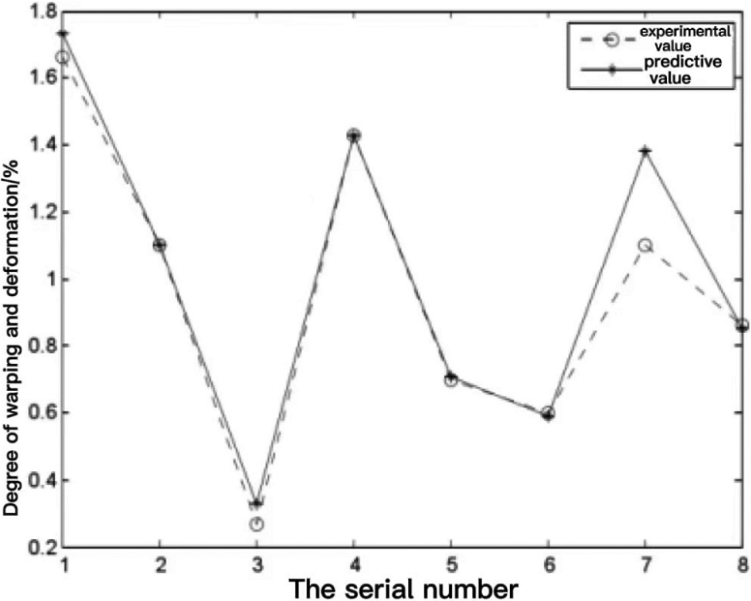
To online detect the ink flow from the nozzle in the 3D bioprinting process of tubular tissue, we established a geometric model based on the obtained ROI of the ink flow picture of 3D printing of tubular tissue, selected the description features of the ink contour, and studied how to select the mathematical expression of the features. The PCA was used to simplify the image features into 15 features. The BP neural network was used to predict the printing ink flow. The results show indicates an error between the actual ink flow rate and the flow rate based on the BP neural network of lower than 5%. Using this method, we can monitor the target quality of 3D bioprinting in real time, online evaluate 3D bioprinting quality and predict the printing ink flow to improve the accuracy of 3D bioprinting of tubular tissue.
Footnotes
Acknowledgments
This work was supported by the Key Projects of Hubei Provincial Natural Science Joint Innovation Fund (No. 2023AFD002).