
Abstract
We introduce a new dataset that links publicly reported data breaches and financial outcomes at the firm-level. First, we document three new facts about the incidence of data breaches: (i) heavy skewness in the distribution of the scale of data breaches, (ii) heterogeneity in records breached by sector, and (iii) differences in records breached between publicly traded and private firms. Second, while we find some evidence, using cross-sectional variation and controlling for time-varying observable firm inputs, that a 10% rise in breaches is associated with approximately a 0.2% decline in firm productivity, the result is sensitive to different specifications and datasets. Third, we show that the absence of more reliable estimates is driven by non-classical measurement error arising from sample selection problems in publicly reported breach data. We conclude by discussing the importance of developing reliable measurement approaches for answering policy questions in cyber security.
Introduction
The loss of industrial information and intellectual property through cyber espionage constitutes the “greatest transfer of wealth in history.” – General Keith Alexander.
Measurement is the first step that leads to control and eventually to improvement. If you can’t measure something, you can’t understand it. If you can’t understand it, you can’t control it. If you can’t control it, you can’t improve it. – H. James Harrington
Cyber security has become a pressing issue in the wake of several large-scale and high-profile data breaches in recent years. Historically, attacks were driven by financial gain, but attacks are increasingly motivated by espionage, whether for state or commercial purposes.1 The changing nature of these attacks has generated significant concern from corporate decision-makers and policymakers. One of the most concerning elements in this landscape arises from the fact that many system vulnerabilities and their magnitudes are not known, making it tough for researchers and policymakers to bound the range of possible outcomes. For example, using an index that gauges known and unknown vulnerabilities, Fig. 1 displays more than a doubling simply between 2011 and 2014, consistent with increasing concerns about cyber threats in the press [1].
Index of cyber security vulnerabilities, 2011–2014. Source: Index of cyber security. The cyber security index is a sentiment-based measure of the risk to infrastructure from perceived cyber security threats (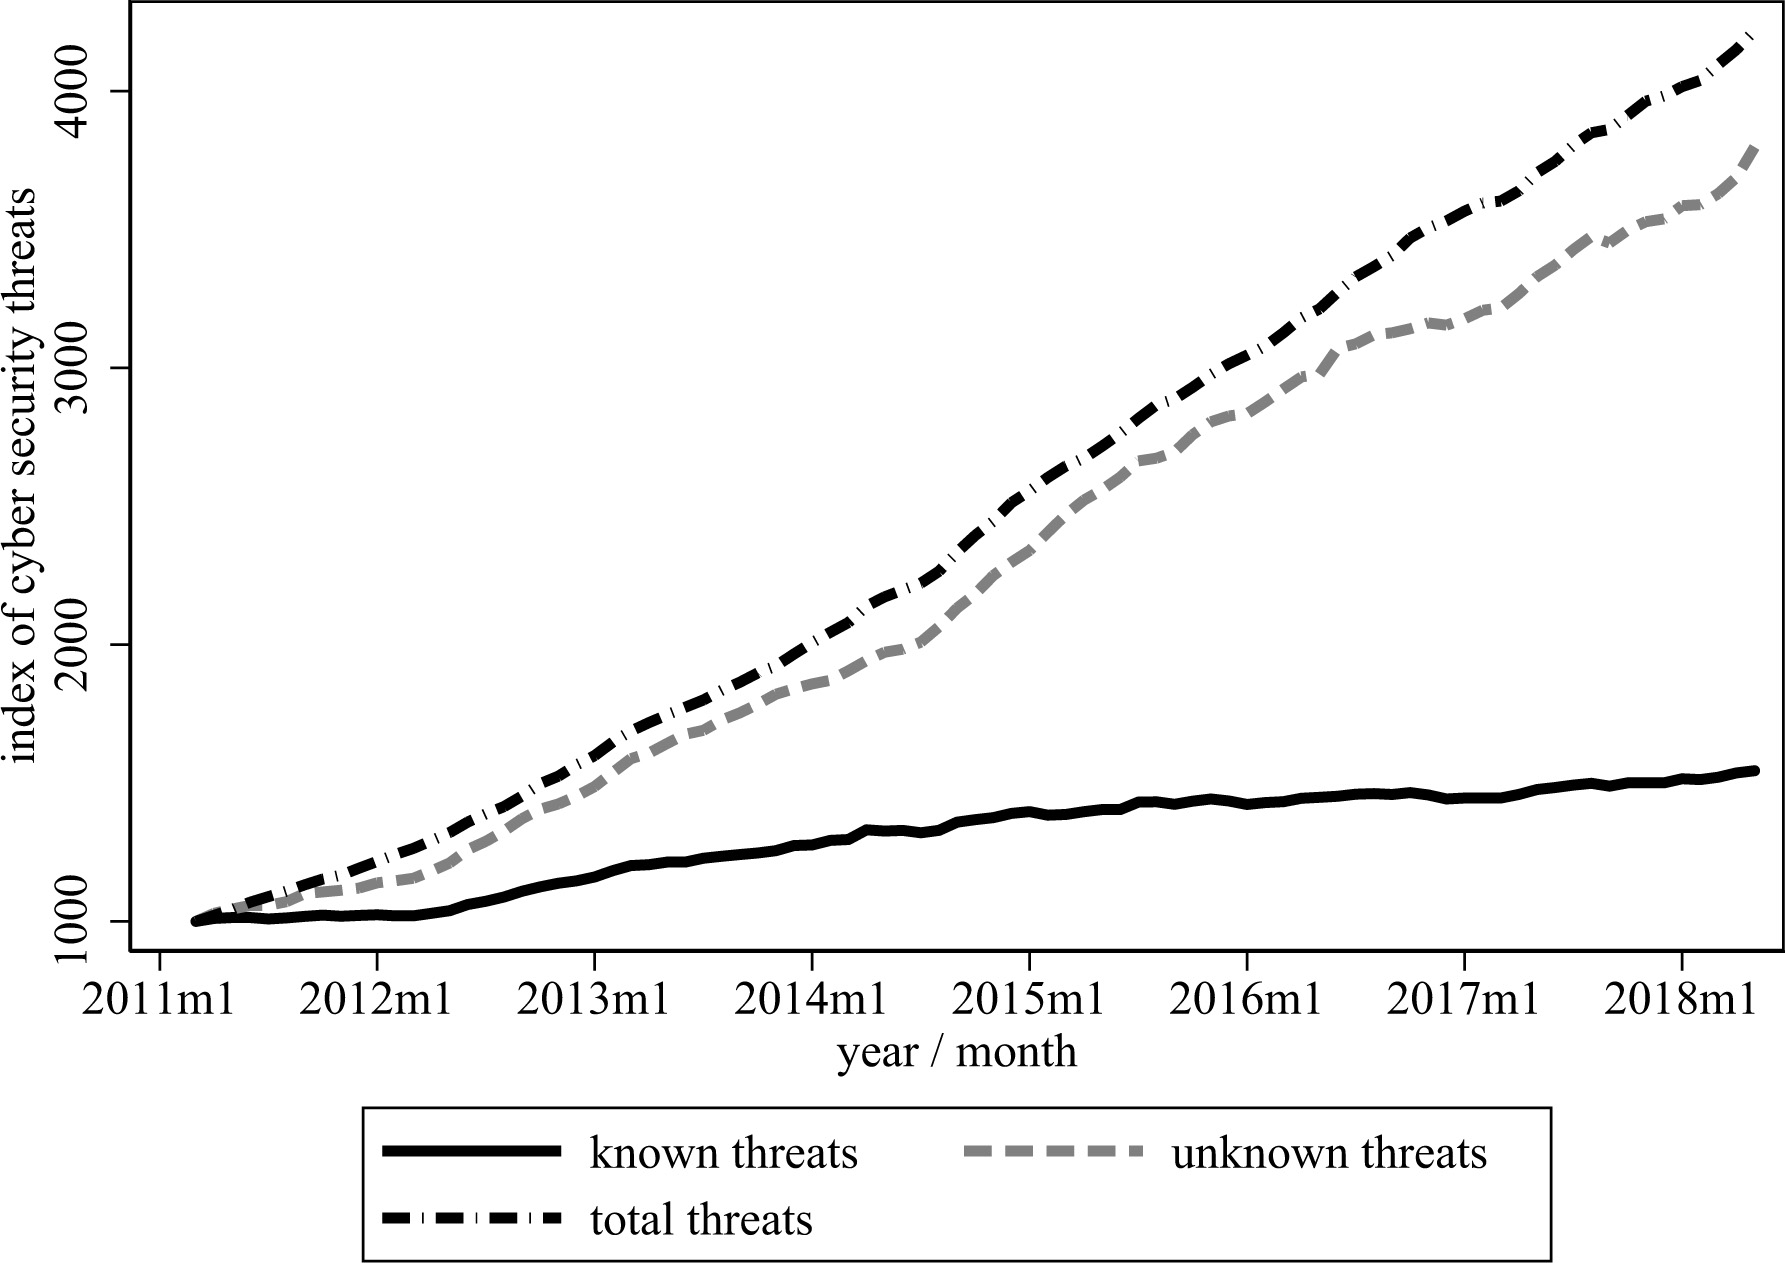
Despite the increasing importance of cyber security, little is known about its effects on firm-level investment and other economic outcomes. Part of the challenge is driven by the fact that there is no ready-to-use database containing both financial firm-level outcomes and cyber security information to estimate statistical models or calibrate computational models. Unfortunately, the lack of information has made it difficult for corporate and governmental decision-makers to determine the optimal allocation of both private and public funds towards cyber security or public policies that might bring benefits that are consummate with costs.
We document and characterize two major empirical challenges to statistical inference within the realm of the economics of cyber security at the firm-level. The first challenge is unobserved firm heterogeneity. On one hand, larger and more productive companies might be more likely to be targets of cyber security incidents because attackers have more to gain through a successful attack. On the other hand, larger and more productive companies may also tend to have better cyber security since they have more sophisticated risk management and larger information technology budgets, which are likely inputs towards information security. The magnitude of these two competing channels will determine the direction of the bias. The second challenge is sample selection. If not all cyber security incidents (including data breaches) are reported, and firms are less likely to report incidents during quarters or years when their profits and productivity are lower, then estimates of impacts of incidents will be biased towards zero.
The primary contribution of this paper is to bring new evidence to bear on the economics of cyber security by producing and analyzing the first panel database containing cyber and financial outcomes at the firm-level. Our study combines data on publicly traded firms from the available public data breach incident databases: the Privacy Rights Clearinghouse (PRC) and the US Department of Health and Human Services (HHS).2 In each of these databases, we identify publicly-traded firms and match them with their publicly available financial statements accessible through Compustat. Our main solution to unobserved firm heterogeneity is the inclusion of relevant financial variables (e.g., number of employees), which proxies for firm-specific characteristics that are correlated with unobserved productivity both in the cross-section and over time. We also present results using a fixed effects estimator, which removes time-invariant sources of variation across firms by exploiting only the within-firm changes in firm and information security outcomes. For all of our statistical analysis, we use Stata and its accompanying packages for regression analysis and basic descriptive characterizations.
Using cross-sectional variation, some of our estimates point towards a negative association between breaches and firm outcomes. For example, we find that a 10% rise in records breached is associated with a 0.2% decline in firm productivity and a 1.1% decline when we focus on the set of breaches due to thefts in the HHS data. These estimates are identified off of variation conditional on time-varying firm inputs, such as employment or capital. However, our sample sizes are small, meaning that standard assumptions needed for interpreting our estimates from a causal standpoint do not readily apply. We also show that adding panel information from PRC/HHS does not add any predictive information and, in fact, amplifies the selection problem that is already inherent in the data. While the HHS data is marginally more reliable because of the sector’s regulations for reporting breaches of proprietary patient information, it too is constrained in predictive power due to its sample size and possible selection.3
Our paper is closely related with a broader strain of research on the economics of privacy and information security [2, 3]. While there are a number of event studies that examine the behavior of stock prices following a cyber security breach at a company, these studies have produced conflicting results, as we will discuss in the next section. There are at least two reasons. First, there is incredible heterogeneity in the type of information that might be released in a breach. For example, the release of private consumer records, such as in the case of Equifax [4], is likely to undermine consumer trust, whereas malware attacks for manufacturing companies is more likely to reduce cash flow (rather than consumer trust) because of the nature of their products and services.4 The effects of different types of attacks may take longer to materialize for companies that rely more on intangible capital as a competitive advantage in the marketplace. Second, while many breaches take place without firm knowledge, reflected in the large uncertainty about firm vulnerabilities in Fig. 1, those firms that do detect incidents may not have an incentive to report the full magnitude of a breach, as was seen in the case of Yahoo [5]. Our study comes at an especially important time as policymakers and governments are debating changes to the legal framework surrounding the reporting of breach incidents [6].
Economics of cyber security
Information technology has fueled economic growth over the past three decades across industries [7], firms [8, 9], and individuals [10]. While information technology (IT) has helped promote global integration [11], greater firm-level innovation, [12], increased product variety [13], and lower costs of doing routine tasks [14], information security (or ‘cyber security’) has lagged. Many systemic vulnerabilities within infrastructure, logical, and software layers create risks for firms and individuals who use and rely on these technologies.
Unfortunately, there is little empirical content to ground sensible cyber security decision-making in the public and private sectors. While there is some evidence of a negative effect of breaches on firm outcomes, research thus far has produced ambiguous conclusions. Part of the reason for this ambiguity is due to the nature of the heavy-tailed distribution of data breaches (e.g. number of records affected), which reduces the reliability of least squares estimators since they focus only on the conditional mean, but, more importantly, a bigger gap is simply that there is also no available linked financial and cyber security outcome data for conducting causal inference.
Nonetheless, many event studies have emerged, estimating the impact of data breaches on stock prices within narrow windows. For example, a literature review of 45 studies found that roughly a quarter of the studies do not find a statistically significant association between breach incidents and stock prices [15]. Even among those studies that do find a negative association, there is wide dispersion in their estimated conditional correlations between breaches and stock prices. One reason is the fact that the type of information accessed in a breach may vary across companies. For example, some have found a statistically significant adverse effect among breaches involving unauthorized and confidential data, but no effect among data that is not confidential [16]. Another reason is that stock prices might not fully capitalize the risk inherent in cyber security breaches. For example, others have found that, while stock prices decline following an announcement of a breach, they tend to recover almost to trend after two days [17]. Moreover, there is also evidence that breached companies face a 1.13% lower stock return the first three days following the breach, but the stock rebounds by the 14th day [18].5
Other research has focused on changes in the frequency and distribution of cyber security incidents over time. For example, while several event studies reveal a negative association between stock prices and breaches, it is possible that the negative correlation is spuriously driven by a decline in the costs, or at least perception of risk among investors, over time [19]. For example, information security has become a major concern among chief executives, leading to expanded data security budgets. However, others have found that neither the severity nor frequency of data breaches has increased over the past decade [20]. Instead, those incidences that have attracted attention can be explained by the heavy-tailed statistical distributions underlying the specific incident [21]. Another study found that there is a stable power-law tail distribution of personal identity losses per information security incident [22].
An implication of a heavy-tailed statistical distribution is that the empirically observed incidents only represent a sub-set of all possible incidents, which makes it harder to recover causal effects in small samples. Consistent with the view that the impacts of breaches have heavy tails, some have found that the median cost of data breaches was substantially below the mean and, moreover, represented only 0.4% of the estimated annual revenues of the companies in the sample [23]. If the majority of incidents fall beneath this threshold, as the literature would suggest, then inferences drawn from the data provide a limited view of the true cost of data breaches.
Data linking certain categories of breach, their root causes and subsequent financial/economic impact on a business may assist in better cyber risk management. Some survey evidence exists accounting the cyber security incident and cost data that are more easily collected than others, how policymakers might improve data access, why previous policy-based efforts to do so have largely failed, and what differential ignorance implies for cyber security policy and investment in cyber defenses and mitigation [24]. This paper attempts to contribute to this growing understanding of what data could be collected, how, and what the limitations of such data collection may be.
While these event studies make important strides in identifying the presence (or lack thereof) of short-run financial effects on firms, they do not focus on long-run and dynamic considerations. Our study takes a step back by creating a firm-level database containing both data breaches and financial outcomes, and examining their conditional correlations. As we will discuss shortly, our primary aim is to characterize the data and illustrate several fundamental weaknesses that undermine the ability to use these publicly available datasets on breaches for causal inference. Unfortunately, the importance of privacy in cyber security is receiving heightened attention and scrutiny, which makes storing and securing data on breaches more costly and challenging for empirical analysis [25]. Understanding whether the increasing attention towards cyber security is a function of the salience versus substance is an important issue for disciplining regulation and policy.
Methods for estimating costs
The prevailing approach for estimating the costs of cyber security incidents is to gather estimated costs and number of breaches from a cross-section of companies. Many of these analyses are implemented using either qualitative surveys (e.g. those conducted by the Ponemon Institute) or self-reported incidence reports. The survey responses provide information on the estimated total breach damage and the number of records breached such that the cost per record is obtained by taking the ratio between the two. Some of the subjective elicitation studies (e.g., [26]) have been criticized (e.g., [27]), obtaining $201 per record breached cost from the full sample. Comparisons between studies have largely relied on simple measures of
These surveys are useful heuristics, and the efforts are laudable, but serious improvements are required to undertake robust econometric analyses relating to information security. The relationships are not micro-founded in any theories about organizational dynamics, nor are the implied cost estimates grounded in statistical inference. By averaging highly heterogeneous breaches and estimated costs together, these studies are challenged by fundamental identification problems arising from omitted variables bias. Specifically, these approaches fail to not only control for time-invariant sources of heterogeneity across companies, but also basic time-varying differences, such as employment and assets, that are correlated with the timing of data breaches and broader organizational decisions.
Deferring to simple measures of overall fit from the
Many studies use self-reported surveys and suffer from a variety of sampling and methodological problems [33]. For instance, self-reported incident reports are produced annually by the Federal Bureau of Investigation’s Internet Crime Complaint Center. These reports provide information on the number of incidents of various forms of Internet-related crimes, the demographics of those who reported being victim of an Internet-related crime and the losses due to the crime as reported by the person or company in question. There are many short-comings of the methodology used in these reports. Since only the companies or people who report the crime are included in the sample, then differences between the sample and population can bias out-of-sample extrapolations and aggregation exercises. Moreover, the method for estimating the losses incurred by each person or company are not provided, and likely differ across the reporting companies, again leading to unreliable total loss estimates [34].
Other studies use an accounting approach to measure the economic costs of security incidents. They assign values to particular activities affected by the breach and publicly report the aggregate quantities [35]. The wide variance of the estimates of the global cost of cyber-crime in these studies points to the inaccuracy of the methods used to make the estimates. One commonly cited paper by national security leaders claims global costs amounting to $445 billion while another, previously cited by the President of the United States, suggests over $1 trillion [36, 37]. In addition to the sample selection problems we pointed out above, these accounting exercises represent more about the “engineering costs” rather than the “economic costs”. In reality, there are many unobserved factors and frictions that are not taken into account absent a model that describes the relevant economic forces.6
Measurement and institutional context
Data sources and software
We use a combination of the Privacy Rights Clearinghouse (PRC) and the U.S. Department of Health and Human Services (HHS) databases of cyber security data breach incidents. These datasets document the incidence of cyber security data breaches based on geographic location and organizational entity. We extracted all relevant variables and manually created common identifiers for publicly-listed firms in these datasets with their publicly-available financials through Wharton’s Data Research Services Compustat (“Compustat”). In addition to providing measures of employment, capital, and revenue, among other financial outcomes, we also use Compustat to recover a time-varying measure of firm productivity by taking the residual from a regression of logged revenues on logged employment, capital, and materials.7
The PRC is compiled by a nonprofit corporation and contains records of breaches starting from 2005 with 5,391 separate breach incidents as of March 2017. The U.S. Department of Heath and Human Services catalogs all notifications of breaches of unsecured protected health information for incidents affecting 500 or more individuals. While the database contains 1,561 unique entries as of July 2016, only 87 are breaches for publicly traded companies that we are able to match. Though these datasets are the most extensive publicly available data, they cover only a small fraction of total information security incidents.8
For the PRC, we observe the name of the company breached, the date that the breach was made public, the total records stolen, the ascribed cause of the breach (one of eight categories: unintended disclosure, hacking or malware, payment card fraud, insider, physical loss, portable device, stationary device, unknown or other) and the firm’s industry (one of seven categories: nonprofit, healthcare and medical providers, government and military, educational institutions, businesses – retail/merchant, businesses – financial and insurance services, businesses – other).9
For the HHS dataset, we observe the name of the breached entity, breach submission date, the number of affected individuals, the type of breach (hacking/IT incident, improper disposal, loss, theft, unauthorized access/disclosure, unknown or other), the location of the breach (desktop computer, electronic medical record, email, laptop, network server, other portable electronic device, paper/films, or other), the type of covered entity (health plan, heath care clearing house or healthcare provider), the state in which the entity is located, whether a business associate was present, and a description of each incident. The HHS data offer an improved probability of detecting potential relationships, relative PRC, since the reporting is arguably cleaner and contains less measurement error. The healthcare sector has largely modernized and the publicly traded companies in our data generally have integrated technology into their services, providing fewer opportunities for mis-reporting. The healthcare sector has also been a major target of data breaches in recent years.10
While the PRC data contain many records for government departments and educational institutions, we restrict our sample to publicly listed companies so that we can link them with financial records from Compustat – between 2005 and 2016 for the PRC and between 2010 and 2016 for the HHS. Our Compustat sample contains publicly traded firms with non-zero employees and non-missing data on the number of employees, value of the capital stock, materials, and revenues at an annual frequency. We also hand-code each company with a unique identifier between the PRC/ HHS and Compustat databases. These constraints produce a sample of roughly 475 unique firm observations in the PRC. Throughout our descriptive statistics and ordinary least squares (OLS) regression analysis, we use Stata MP 15.0 [40] on an Intel(R) Core(TM) i5-3230M CPU @ 2.60 GHz, 2601 Mhz, 2 cores, and 4 logical processors with 8 GB of memory on Windows 10.
A final distinction that is important to point out is that there are many years that a company may not be observed in either database even if they are observed once. For example, a firm might incur a breach that is publicly reported in 2012, but they are not observed in 2010 in the cyber databases. Does this mean that they had no cyber incidents in 2010? Or, does it mean that they did not have a large enough incident that led to public recognition? There is a potentially major selection problem here – years a firm is not observed might not be “true” zeros in the sense that they had breaches that were simply not reported. We examine the following later, but note that setting values of breaches when the company is not observed in PRC/HHS to zero is not valid given the presence of non-random reporting of breaches.
Distribution of breaches, (non) Compustat and non-Compustat healthcare firms. Sources: Department of Health and Human Services, 2010–2016. The figure plots the logged number of records breached (in thousands) between firms that are covered by Compustat (i.e., publicly traded firms) and firms that are not covered in Compustat (i.e., private organizations in HHS). The distributions are partitioned into four categories: the pooled sample, breaches where an business associate is hit, breaches where the health plan is hit, and breaches where the healthcare provider is hit. The figure documents big differences in the mean and standard deviation of breaches within firms covered by Compustat, relative to those only in the HHS data, which reflects the fact that many private healthcare companies are smaller practices.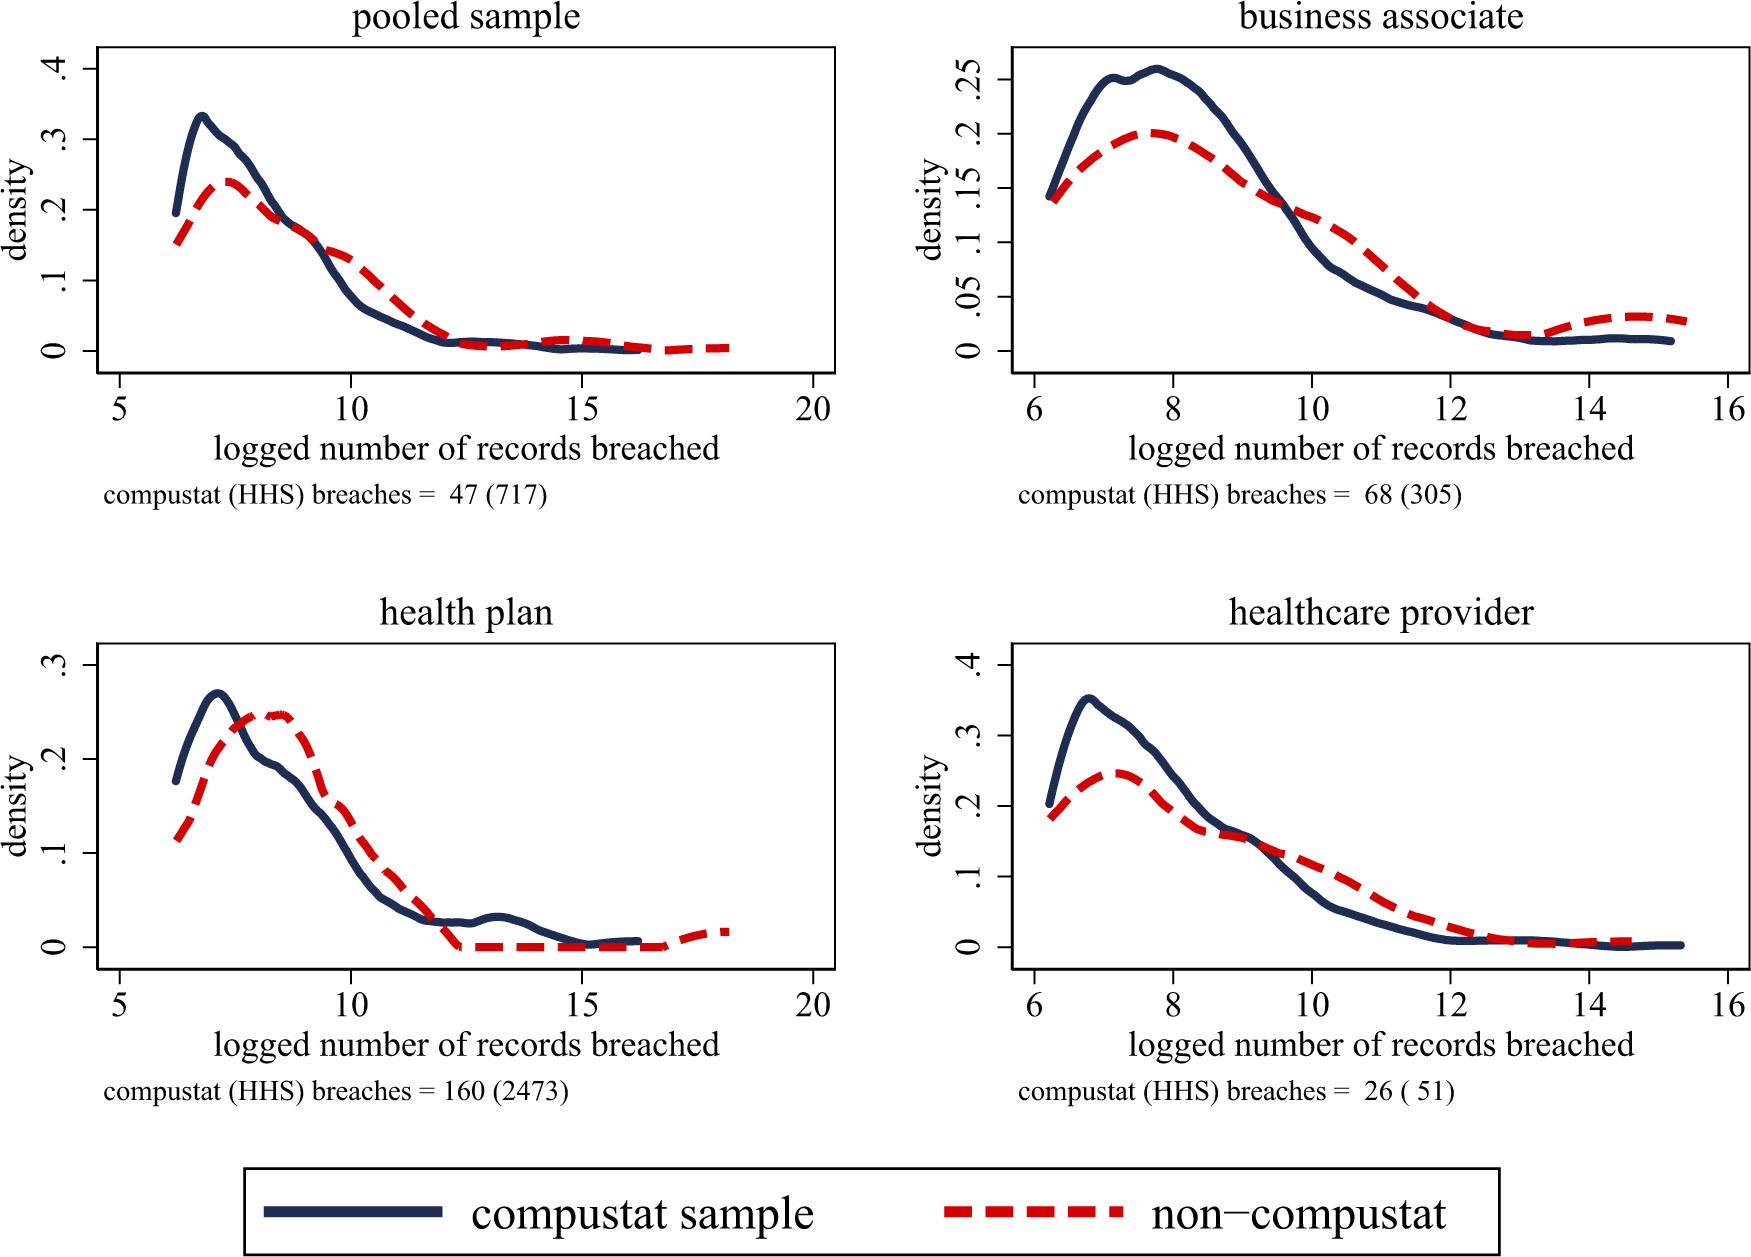
We now turn towards a comparison between both the PRC/HHS datasets and Compustat to better understand the type of firms that we are capturing. Figure 2 plots the distribution of records affected in breaches (in logarithms of thousands of affected records) between firms that we are able to match between the Department of Health and Human Services (HHS) data and Compustat with those firms that are only in the HHS data. We also plot the distributions of logged records breached separately based on the type of breach: all companies, a breach against a business associate, a breach against a health plan, and a breach against a healthcare provider. In other words, we plot the distribution of records breached for all companies observed in the HHS data with those that match into the set of publicly traded companies through Compustat.
The data points towards three facts. First, Compustat firms have many more records affected per breach, on average, than their non-Compustat counterparts. For example, pooling all types of breaches together, Compustat firms have, on average, 716,515 records breached over the observed time series, whereas non-Compustat firms have 47,033 records breached – approximately 6% as large as their counterparts. Second, the bulk of the records breached are those involving health plans, rather than business associates or healthcare providers. For example, Compustat firms have, on average, over 2.4 million records breached. One reason for some of these stark differences is the fact that the median healthcare company is actually quite small – for example, there are many health facilities with just a few doctors. Third, publicly traded companies display considerably more dispersion in their records breached. For example, the standard deviation for the non-Compustat sample is 440,461, whereas it is 6,876,867 – over 15 times as large.
Differences in financial outcomes between PRC/HHS and Compustat samples
Differences in financial outcomes between PRC/HHS and Compustat samples
Notes. – Sources: Compustat (2005–2016), Privacy Rights Clearinghouse (2005–2016), and Department of Health and Human Services (2010–2016). The table reports the average and standard deviation of breaches, cash-on-hand, employees, capital, research and development, and revenue across the three major samples: PRC, HHS, and Compustat (inclusive of companies that were matched).
Distribution of breaches, (non) Compustat and Private Rights Clearinghouse Firms. Sources: Privacy Rights Clearinghouse, 2005–2016. The figure plots the logged number of records breached (in thousands) between firms that are covered by Compustat (i.e., publicly traded firms) and firms that are not covered in Compustat (i.e., private organizations in PRC). The distributions are partitioned into six categories: a pooled sample and separate groups by major sector. The figure documents big differences in the mean and standard deviation of breaches within firms covered by Compustat, relative to those only in the PRC data.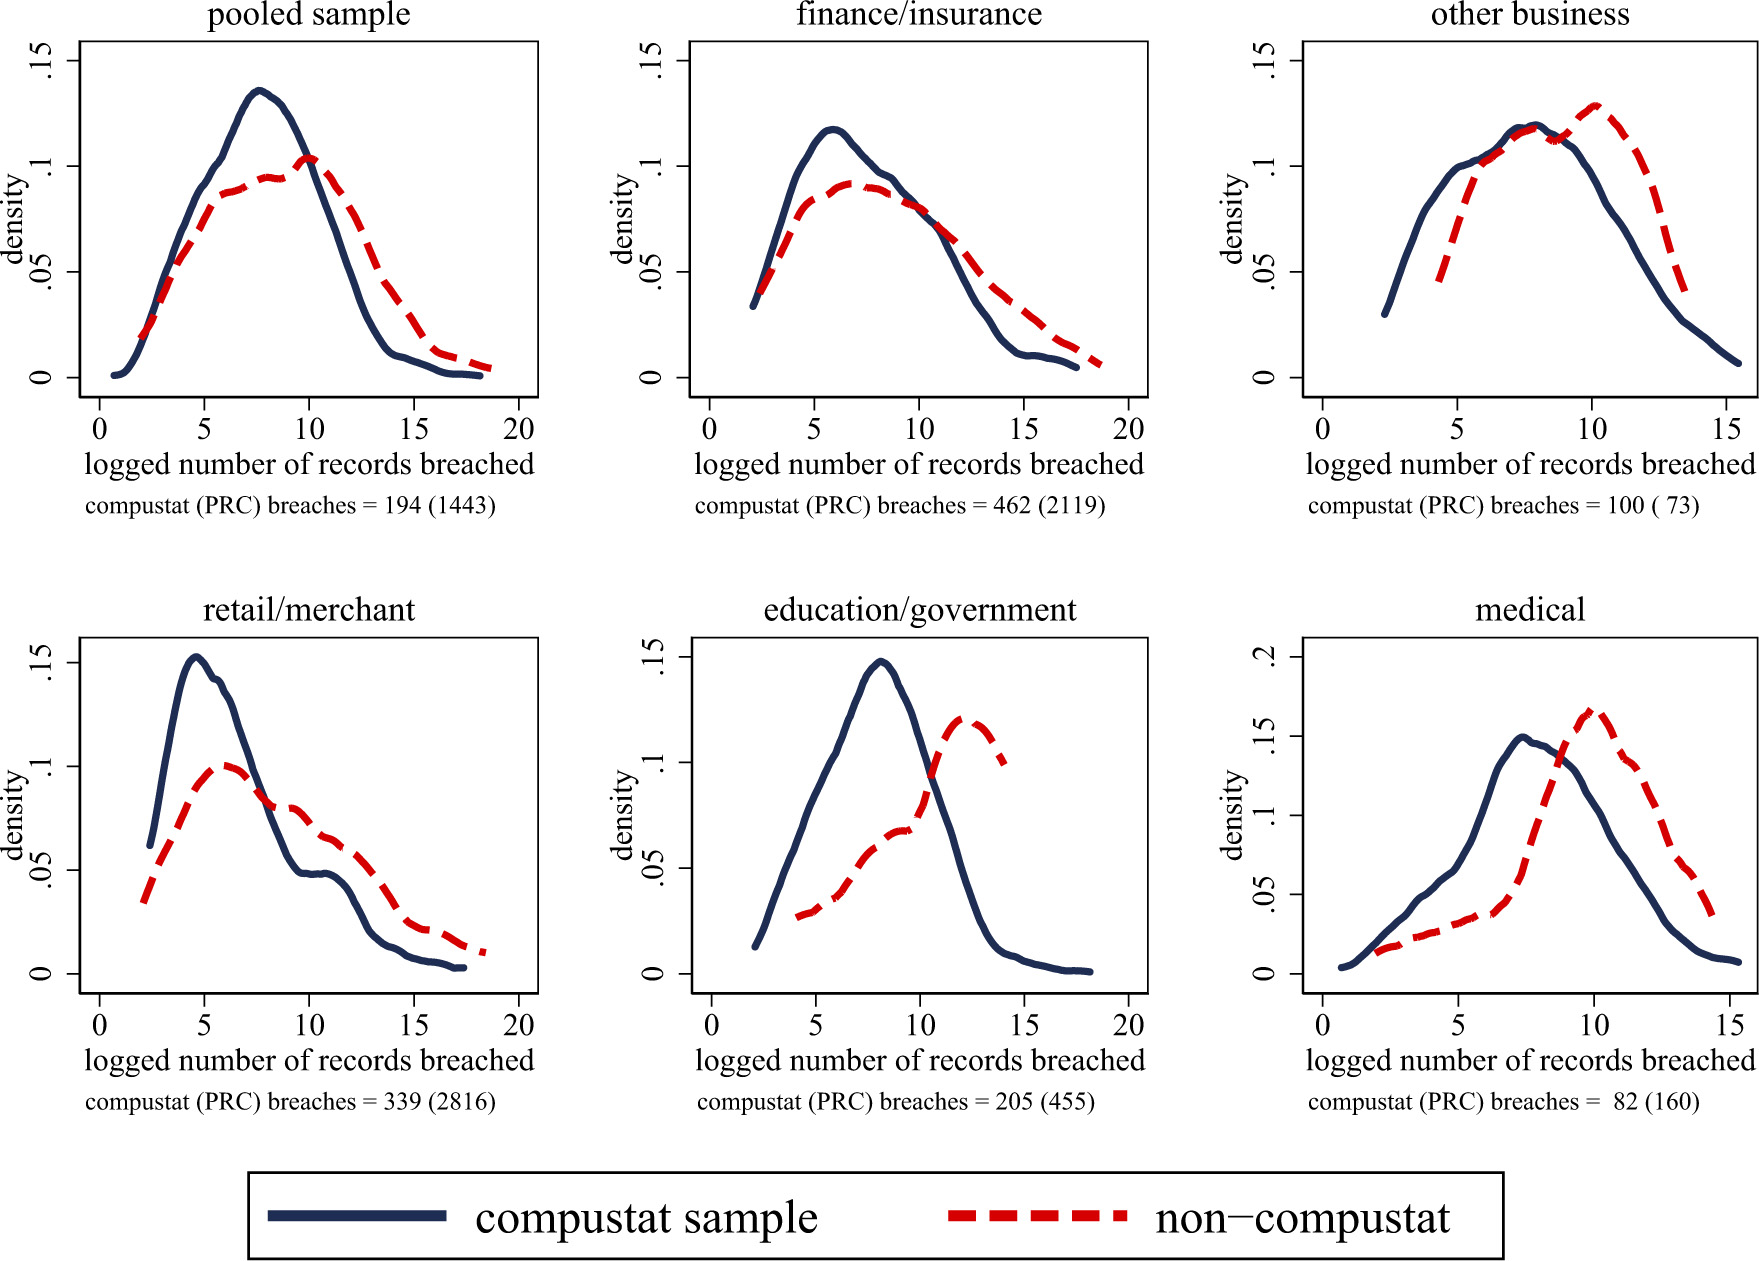
We also implement a similar exercise for firms in the PRC dataset separately by major industry, which is documented in Fig. 3. We again find significant differences in the mean number of records breached covered in the Compustat versus PRC-only samples. For example, in the pooled sample, we find an average (standard deviation) of 1,442,697 (10,162,010) among Compustat firms, whereas it is 194,011 (2,301,437) among PRC-only organizations. These orders of magnitude differences again reflect the fact that publicly traded companies tend to experience cyber security attacks of a greater scale, relative to their private counterparts, except for in the “other business” sector. Companies in the finance/insurance and retail/merchant sectors are also the biggest targets by far, although the sample of medical companies in the data is limited.
We finally turn towards a more detailed look at the differences in financial outcomes between the companies covered in the Compustat dataset overall and our specific PRC and HHS datasets. We document these differences in Table 1. The sample of PRC and HHS publicly traded firms that we are able to match with Compustat are much larger than the average size of firms covered by Compustat, but are not in either the PRC or HHS data. For example, publicly traded firms in the PRC sample have roughly 87,000 employees, whereas those in the HHS sample have over 72,000, but the remaining firms in Compustat only have 10,000. We see similar differences across other financial performance measures. For example, capital stock, research and development expenditures, and revenue are all orders of magnitude larger in the linked PRC/HHS-Compustat sample versus those that remain in Compustat.
Distribution of breaches between PRC and HHS samples. Sources: Privacy Rights Clearinghouse Database (2005–2016) and Department of Health and Human Services (2010–2016). The figure plots the logged number of breaches in both the PRC and HHS datasets.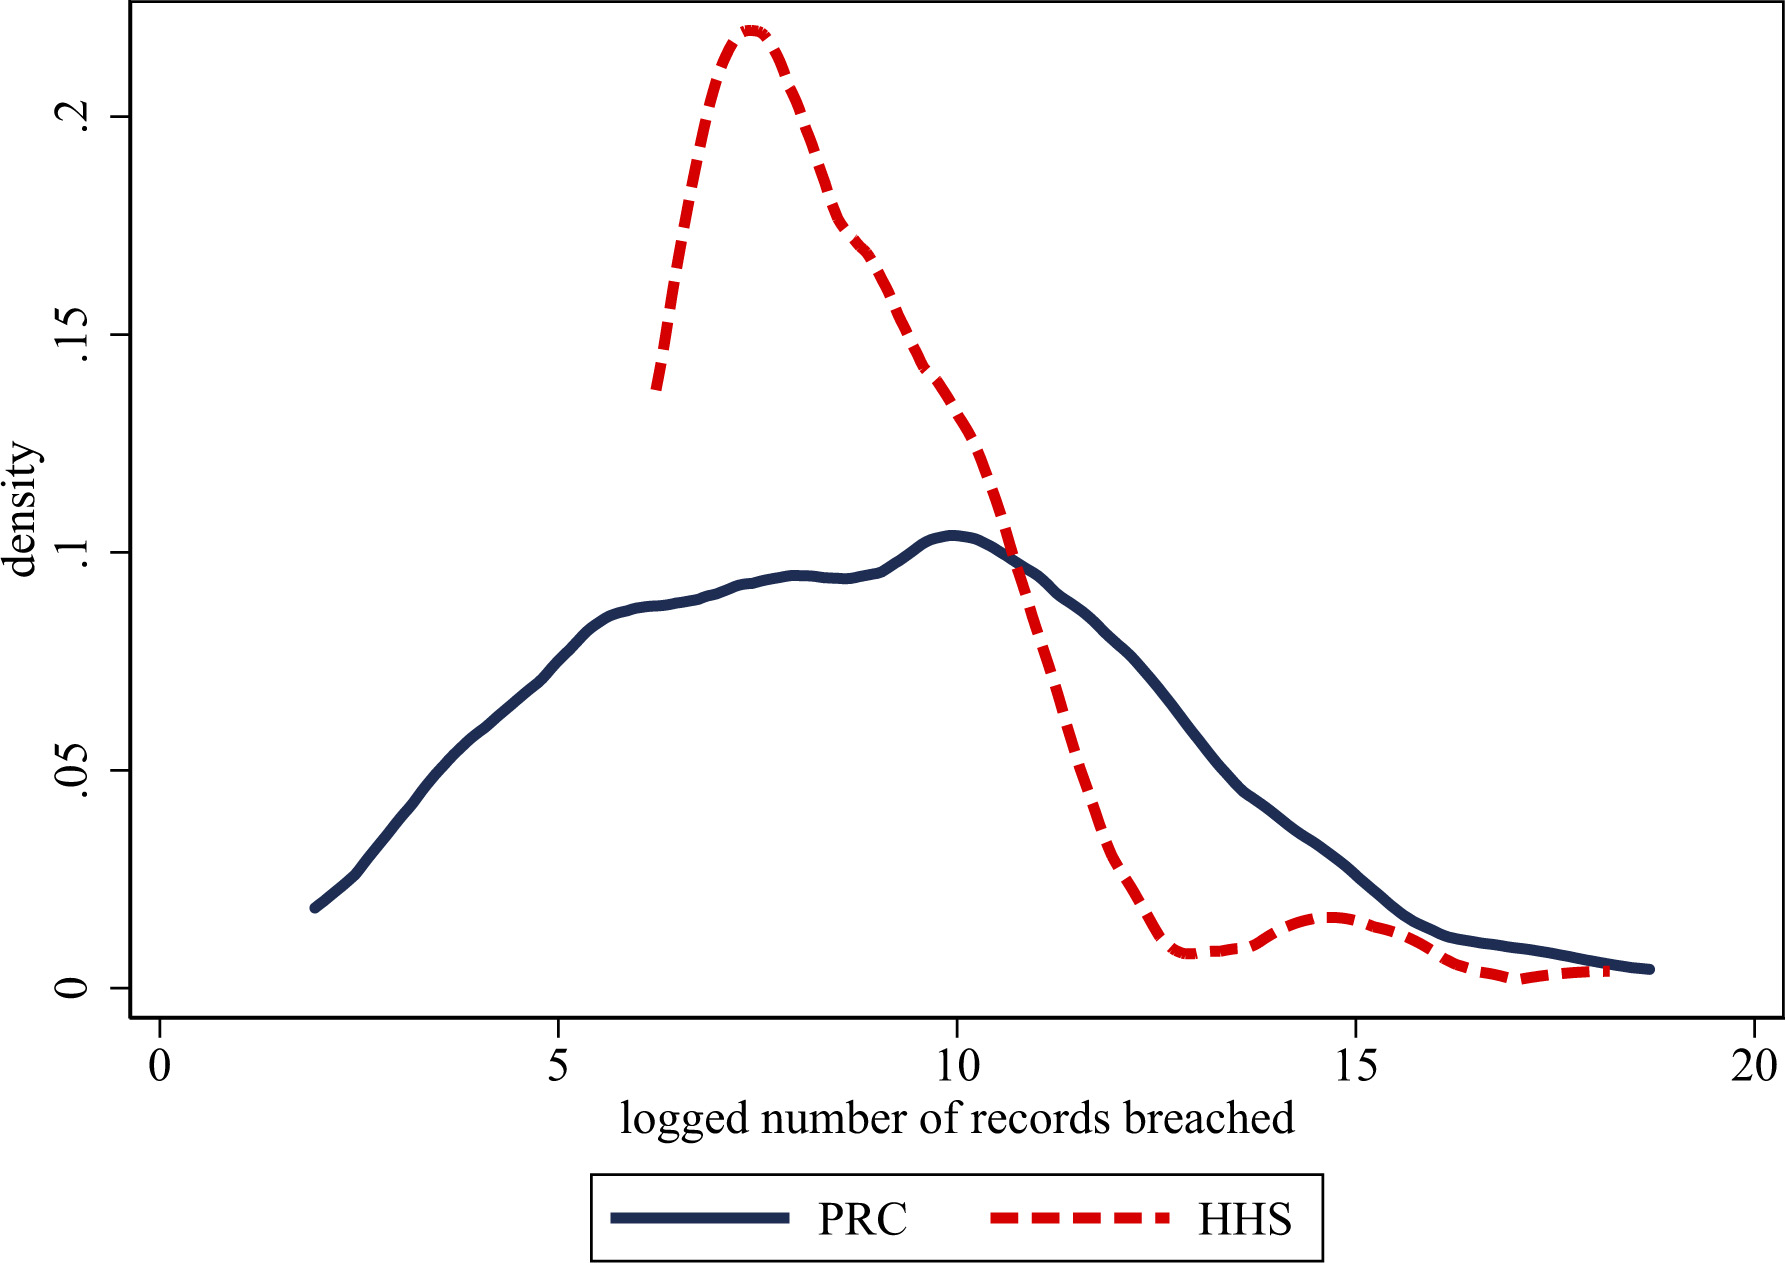
Records breached (in 10,000s) and distribution of breaches, 2005–2015. Sources: Privacy Rights Clearinghouse Database Community, and Department of Health and Human Services. The figure plots the mean annual number of breaches in tens of thousands restricted to the set of publicly traded companies in the corresponding databases.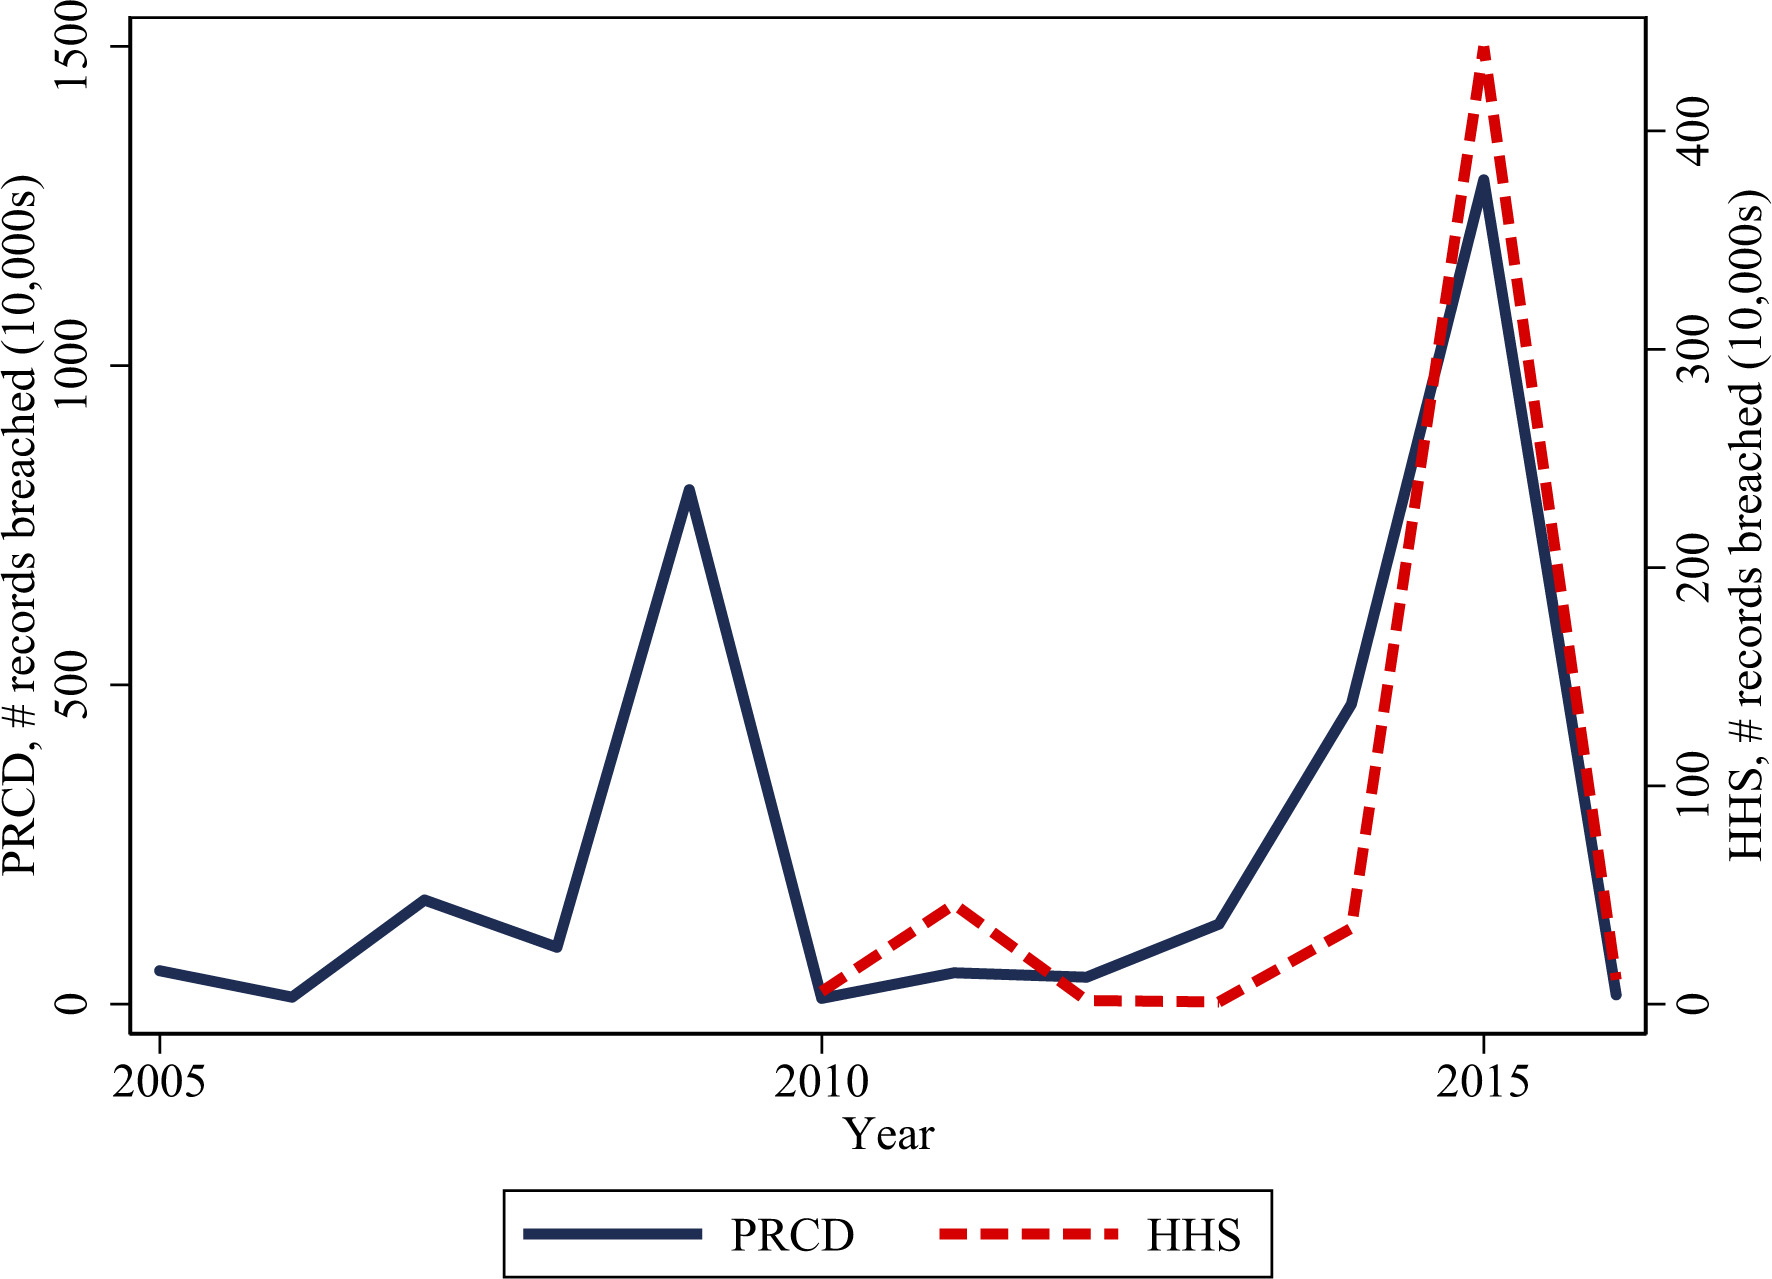
Aside from making our sample more transparent for the results that follow, we view this as an important exercise because the PRC and HHS datasets are typically used as the “go-to” samples for cyber security work simply due to data availability. However, if the goal is to understand how data breaches affect major firms in the U.S. economy, then these basic descriptive results suggest that the PRC and HHS are not necessarily reliable samples. One reason we might be especially interested in the performance of these large firms is because of network externalities [3]. If, for example, a major bank is breached and credit card numbers are released, this can have profound effects on consumer confidence and spending in the aggregate economy, thereby impacting economic growth.
Having compared companies in the entire Compustat dataset with those observed in ours, we now provide several descriptive facts about our data. Figure 4 plots the distribution of these breaches between the two datasets. Because healthcare companies are only required to report breaches that involve a certain number of patients, the distribution for the HHS dataset is truncated. However, the PRC still produces a larger average number of records affected per breach per firm (1,442,697 versus 801,525). The distribution of records breached in the PRC adheres slightly more to a normal distribution (Shapiro-Wilk test for rejecting normality
Cyber security breach types and location in healthcare companies. Sources: Department of Health and Human Services. The figures plot the logged number of records breached by the type of data breach (i.e., how it took place) and the location of the breach (i.e., on the electronic medium it took place on).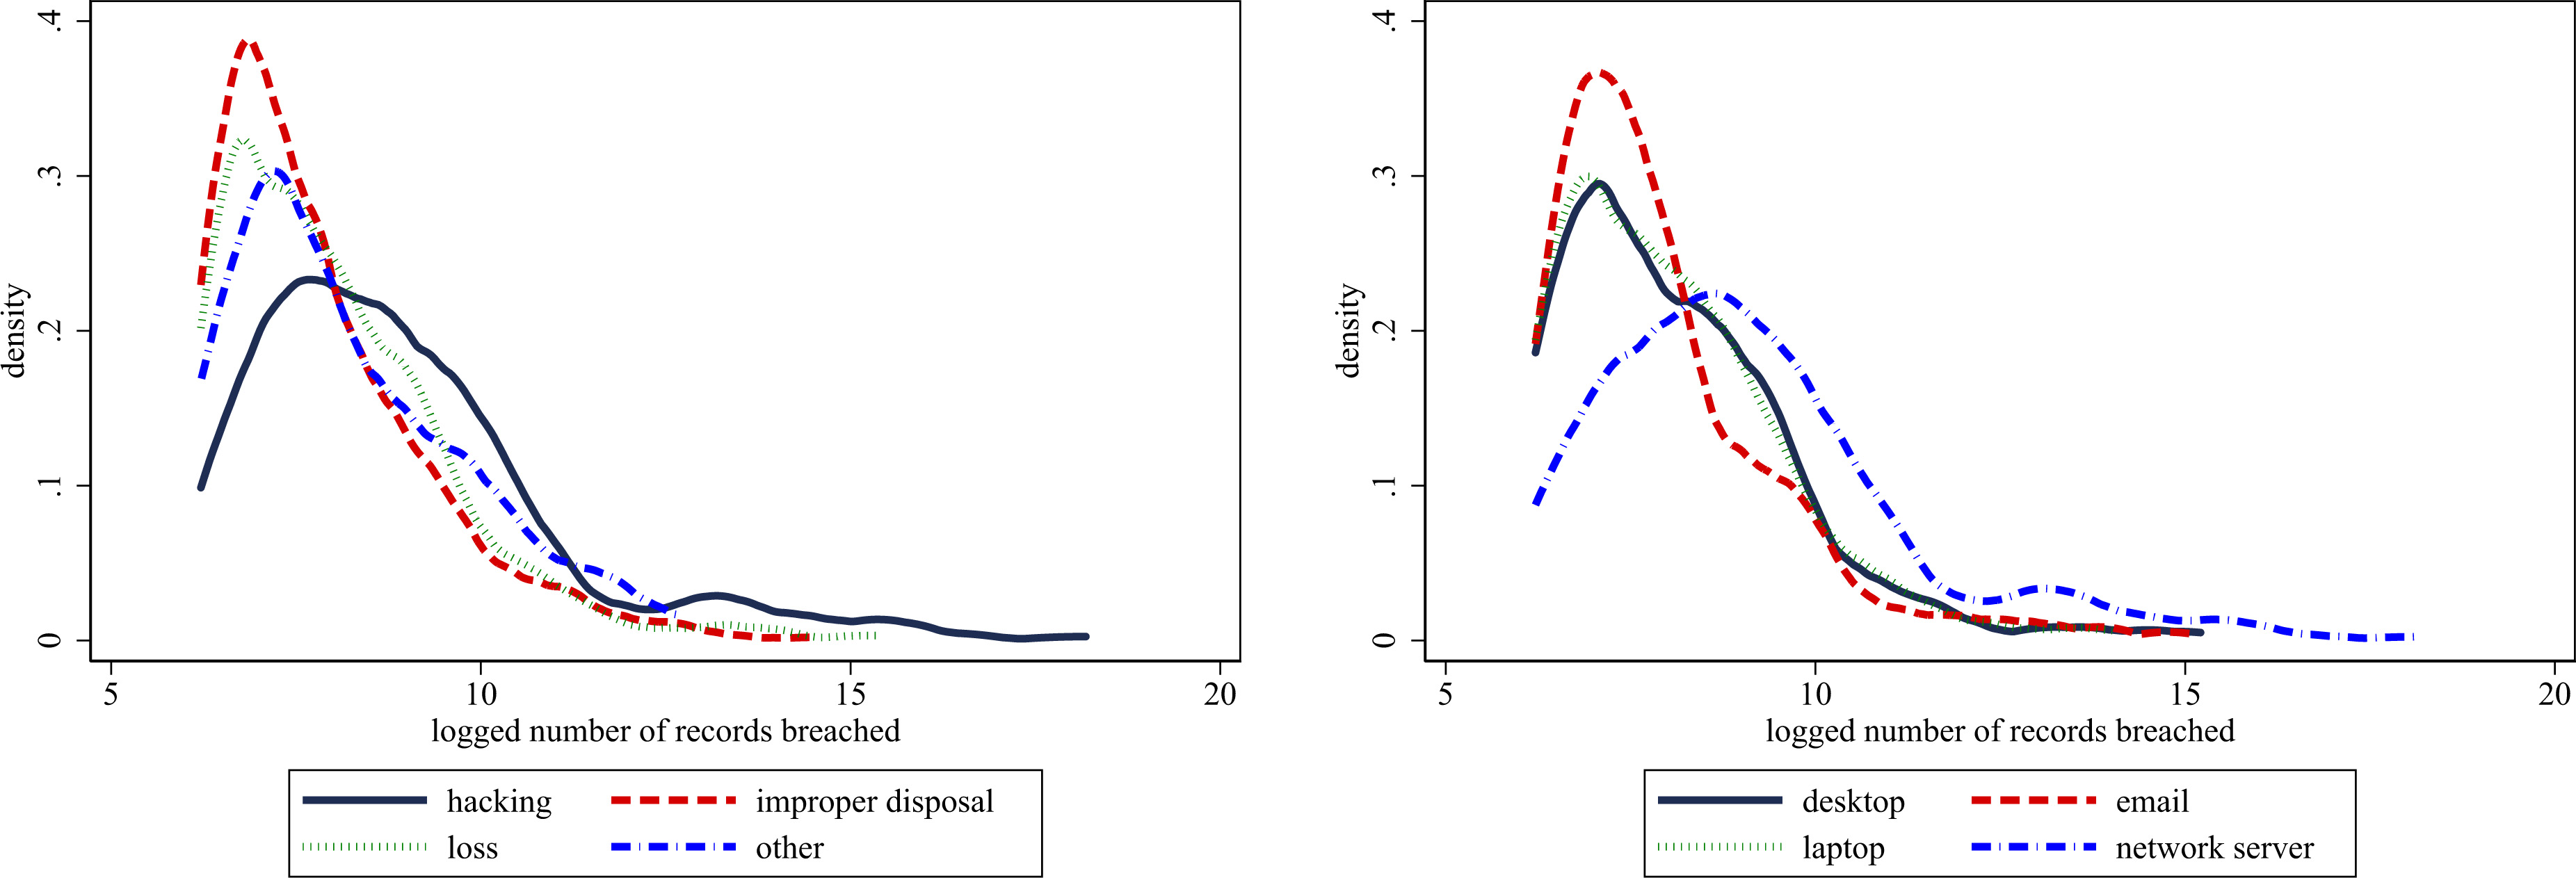
Cyber security breach types across sectors. Sources: Privacy Rights Clearinghouse. The figure plots the logged number of records breached by the type of breach.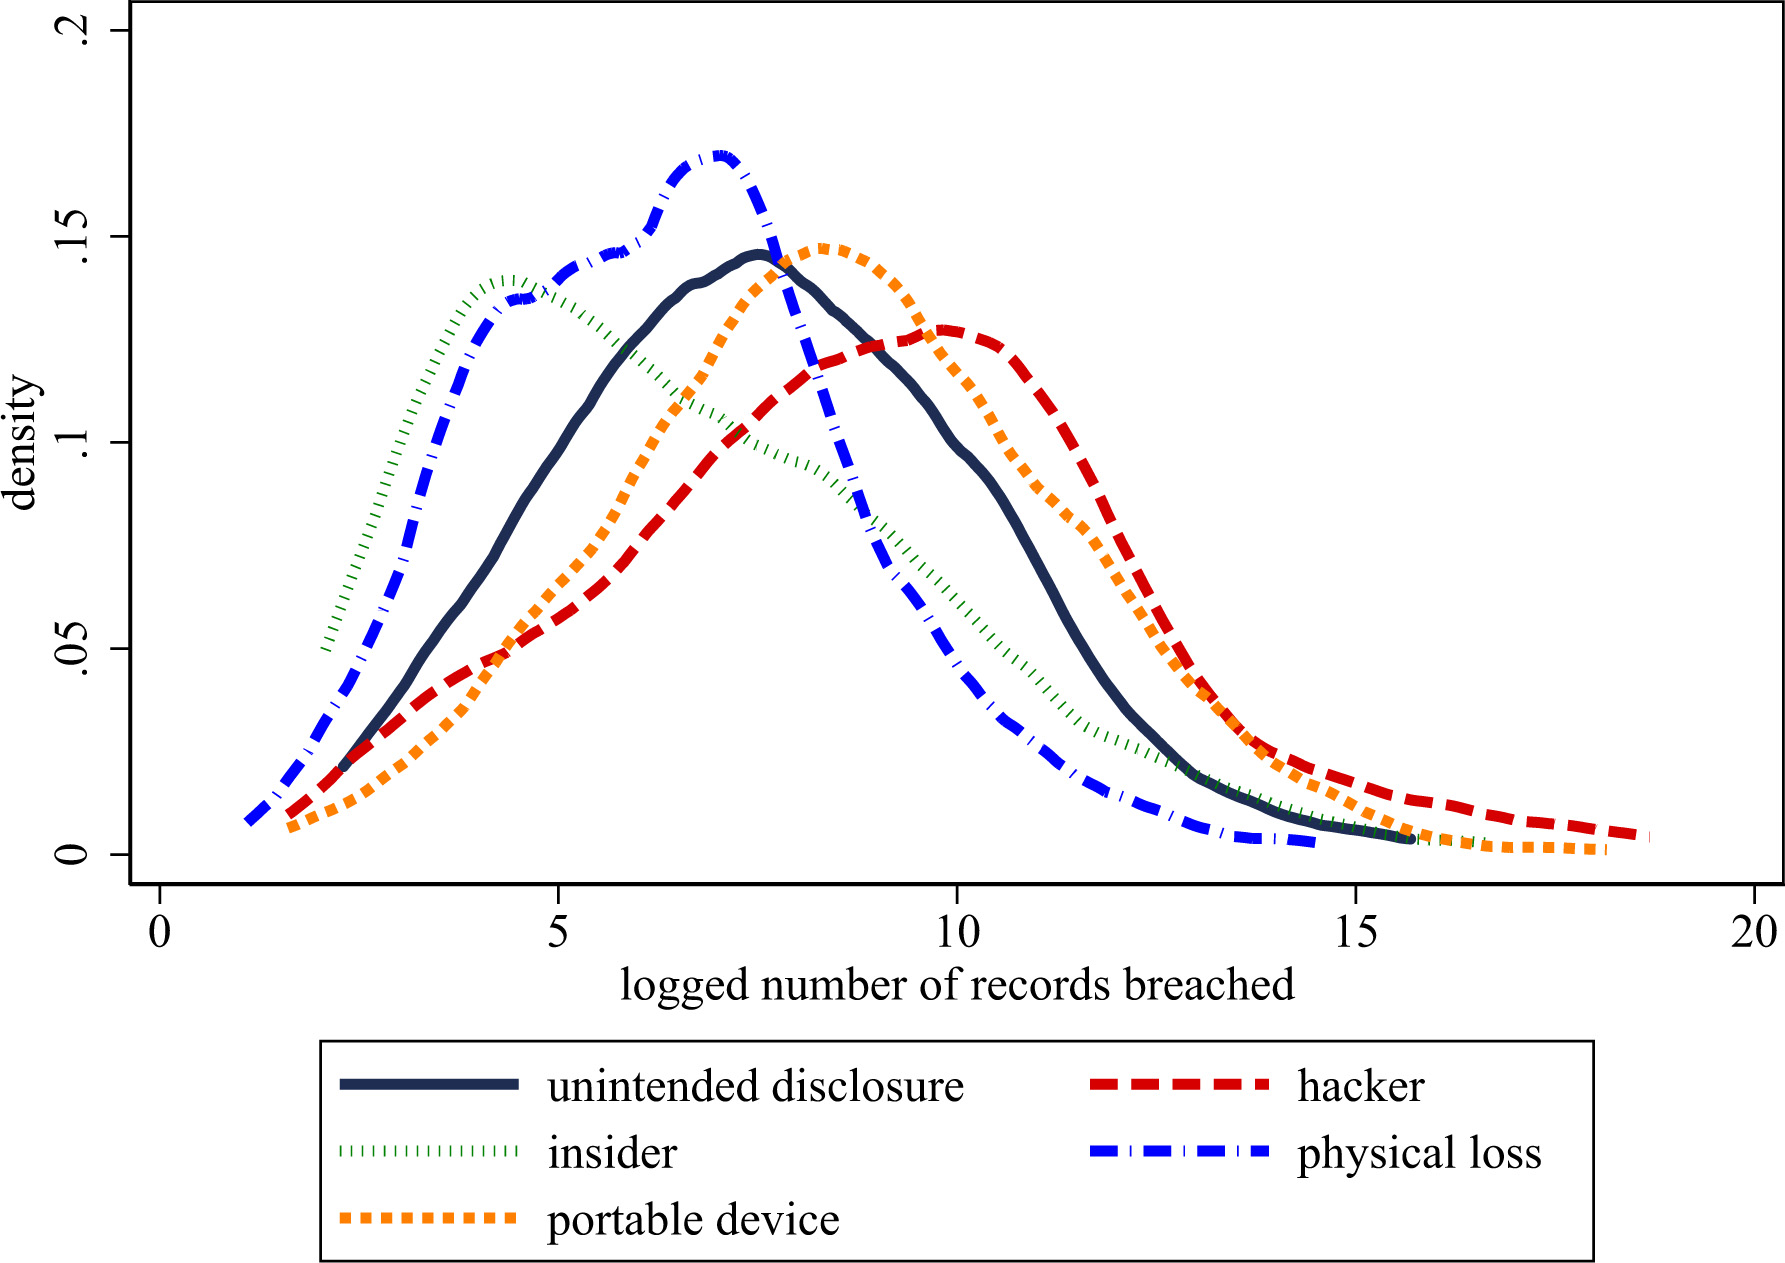
We turn towards plotting the number of breaches (in ‘0,000s) from 2005–2016 in Fig. 5. One immediate observation is that the number of records breached in each of the databases is not smooth; there are large year-to-year swings that are based on, for example, one or just a few very large incidents. For example, Anthem Inc. had several large breaches in the sample: 1,023,209 records in 2010 and 839,711 records in 2014. Even though the year-to-year averages seem to represent relatively random fluctuations – partially because of sample selection issues, which we discuss later – the probability of facing a breach at a firm-level is likely endogenous.
We now turn towards differences in the type and location of breaches. There are four general categories for breach type (hacking, improper disposal, loss/theft, and miscellaneous) and there are four general categories of the location of a breach (desktop, email, laptop, and network server). Figure 6 displays these distributions. Panel A shows that malicious hacking attempts are by far the most frequent form of data breaches with an average of 488,676 records affected per breach. While records are still breached through human error, e.g., improper disposal or loss, these statistics reflect the growing concern that hacking is becoming more common. These results from the HHS are also consistent with those from the PRC in Fig. 7, which again overwhelmingly shows that hacking attempts are the most common cause of data breaches. Panel B shows that breaches are most common via the network. These breaches affect an average of 512,581 records per incident with the next closest among desktops with 44,649 records breached. The fact that networks are the most common port of entry for hackers might reflect that it is easier to go unnoticed in a larger network, rather than through a particular computer.
Conceptual framework
Information security arguably falls within a broader umbrella of organizational practices, which have an already well-known association with productivity at the firm-level [9, 41, 8]. We now develop a formal framework for understanding the potential importance of information security within a firm by specifying a stylized model of production at the firm-level. Suppose that firms have a production function that relates various inputs, such as capital and labor, with output
where
Our inclusion of information security in the production function captures the increasingly important role of maintaining safe and secure data in organizations.12 There are various reasons that information security might matter for an organization. For example, information security might matter for maintaining an organizational brand and trust with consumers. In these cases, information security is closely related with prior contributions that have modeled intangible and/or organizational capital [42, 43, 44]. Similarly, information security might matter for an organization’s internal data infrastructure. In these cases, information security plays a role of coordination, especially among disparate business units [45]. However, we do not need to take an explicit stance on the mechanism.
We normalize the production function to labor. Letting lower case letters denote the transformed log variables (e.g.,
where
where
Practically, while we do not observe the quality of information security, we do observe the number of data breaches, which is a proxy for the opposite of information security. We would, therefore, expect to see a negative association between breaches and various measures of firm outcomes, namely various measures of productivity. Unfortunately, the size of our sample limits the amount of heterogeneity we can allow for, but we would also expect to find that data breaches are more costly for firms in industries that have greater complementarity between information security and capital.
We now consider variants of Eqs (2) and (3) through regressions of the form
where
Consistent identification of
The second identification concern is a dynamic selection problem that arises from the fact that data breaches might respond to a rise in firm outcomes. That is, if a firm experiences a surge in sales or profitability, malicious actors may respond by increasing their attacks against the company. While in theory we can address both concerns by including firm fixed effects to remove time-invariant heterogeneity across companies, in practice we found that fixed effects estimators failed due to a lack of variation. We address this concern by controlling for relevant firm characteristics, such as employment or capital, that are likely to co-move with firm outcomes. To the extent information security incidents spike in response to firm outcomes, our identifying assumption is that they do so in a way that is captured by movements in employment or capital.
While we are well aware of these potential identification problems, and thus caution readers to interpret these as conditional correlations, we want to underscore that this is, to our knowledge, the first time that gradients between breaches and firm outcomes have been estimated for a comprehensive set of companies. In this sense, the fact that we point out major flaws with the publicly reported data breaches is a starting point for what we hope will be a more rigorous and comprehensive data gathering process in the future.
There are at least two reasons that our measure of breaches could contain sample selection problems. The first is that many companies do not know that they are bre-
| Dep. var. = | ln (revenue per worker) | ln (capital per worker) | Total factor productivity | |||||||||
|---|---|---|---|---|---|---|---|---|---|---|---|---|
| PRC | PRC | HHS | HHS | PRC | PRC | HHS | HHS | PRC | PRC | HHS | HHS | |
| ln (breaches) | 0.02 |
0.00 |
|
0.05 |
|
|
|
0.02 | 0.00 |
|
|
0.04 |
| [0.01] | [0.00] | [0.07] | [0.03] | [0.01] | [0.00] | [0.05] | [0.01] | [0.00] | [0.00] | [0.01] | [0.03] | |
| ln (employment) | 0.12 |
|
0.37 |
|
0.18 |
|
0.30 |
|
|
|
0.01 |
|
| [0.04] | [0.09] | [0.13] | [0.07] | [0.06] | [0.13] | [0.11] | [0.06] | [0.01] | [0.07] | [0.01] | [0.08] | |
| R-squared | 0.05 | 0.99 | 0.23 | 0.99 | 0.05 | 1.00 | 0.18 | 1.00 | 0.01 | 0.90 | 0.05 | 0.84 |
| Sample size | 546 | 546 | 83 | 83 | 465 | 465 | 83 | 83 | 465 | 465 | 83 | 83 |
| Firm FE | No | Yes | No | Yes | No | Yes | No | Yes | No | Yes | No | Yes |
| Year FE | No | Yes | No | Yes | No | Yes | No | Yes | No | Yes | No | Yes |
Heterogeneity in cyber security outcomes by breach type
ached. Those that do often do not find out that they were breached until several months or years after. For example, Mandient, an incident response survey, reports that it took companies roughly 205 days in 2014 to detect data breaches. We, therefore, use annual (rather than quarterly) financial data.14
The second is that companies do not have a strong incentive to report all of their incidents except in jurisdictions where such reporting is mandatory. Even if there was comprehensive legislation in place, as is seen in the case of the healthcare sector where there are some mandatory disclosure laws and associated regulations, companies may still not report if the probability of getting caught and/or the fines associated with getting caught are sufficiently low.
While the first form of sample selection will tend to attenuate the estimates due to the potentially weak mapping between the time a breach is discovered and the financial outcomes of the firm, the second sample selection problem behaves as non-classical measurement error and can create bias. Anecdotal evidence suggests that larger companies may tend to have a stronger incentive not to report the full scale of their breaches. Take, for instance, the data breach(es) on Yahoo. In late 2016, Yahoo announced two incidents involving the compromise of data for over 500 million and one billion Yahoo accounts respectively. These breaches were alleged to have occurred in 2013. Subsequent to their initial announcement of 500 million accounts, Yahoo’s stock price fell by 4.4% in just a few months, totaling $1.7 billion in market value.15 Verizon, which was in the process of acquiring Yahoo, also reduced their offer from $4.83 billion to $4.48 billion, or 7.25%. Later in 2017 it was announced that the incident previously claimed to have affected 1 billion account had in fact affected 3 billion accounts. If larger companies have a stronger incentive not to report, then we will underestimate the effect of data breaches on firm outcomes. Moreover, if it takes time to detect, assess and report incidents – and these details can change over time – then estimates on the effect of the incidents will be underestimated or overestimated accordingly.
Cross-sectional and panel estimates
We begin by detailing our main estimates of Eq. (4) in Table 3. We focus first on the estimates obtained from our PRC sample of firms. In the cross-section, controlling for logged employment, we find that a 10% rise in breaches is associated with a 0.2% rise in revenue per worker, a 0.2% decline in capital per worker, and a null association with total factor productivity. Once we add firm and year fixed effects, these correlations vanish even further to null and statistically insignificant associations in every case.
We now turn towards our estimates obtained from our HHS sample of firms. In the cross-section, we find that a 10% rise of breaches is associated with a 0.5% decline in revenue per worker, 0.3% decline in capital per worker, and a 0.2% decline in TFP. While the first two correlations are not statistically significant at conventional levels, the TFP estimate is significant at a 1% level. However, once we add firm and year fixed effects, our estimates all become statistically insignificant.
Panel estimators are well-known to introduce bias when there is serially uncorrelated noise measurement error – that is, the signal is highly correlated over time [47, 48]. Our interpretation of the data is that a firm’s incentive to report a breach is effectively serially uncorrelated noise. That is, sometimes a particularly large breach is publicly reported, other times it is not, but in both cases the noise is correlated with underlying firm fundamentals. If the incentive to misreport were simply time-invariant, then fixed effects would help. However, even in such cases, there is simply too small of a sample to do serious inference with fixed effects.
We, therefore, turn towards the HHS data, which appears more reliable (given it is based on state-level mandatory incident reporting) despite its smaller size. We specifically look for evidence of heterogeneity in the treatment effect of breaches using only the cross-section when partitioning by the type of breach. Table 3 documents these results. We find that a 10% rise in records breached is spuriously associated with a 1.5% rise in revenue per worker for hacks, but a 1.6% decline in capital per worker and 0.2% decline in TFP. We underscore, however, that our sample consists of nine observations and is, therefore, not a credible estimate. When we restrict the sample to breaches due to theft and losses, we find that increases in breaches are generally associated with declines in revenue per worker and TFP, most notably a plausible 1.1% decline in TFP associated with a 10% rise in records breached.
Discussion of the limitations
The data on which we have based our analysis is constrained in two ways. The first major constraint is the completeness of publicly available cyber security incident databases, broadly speaking, and data breach incident databases, more narrowly. Neither PRC nor HHS contain the full universe – or anywhere near it – of incidents. In fact, it is likely that the public data represents only a very small fraction of overall incidents [6]. To the extent that the missing observations and incomplete nature of the data is random, it will only produce larger standard errors. Normally, such measurement error is innocuous, but since our sample is so small it is likely to induce bias.
However, what concerns us even further is the fact that the companies that do not report, or those who do report simply a subset of the actual breaches that occurred, may do so systematically in ways that are correlated with unobserved heterogeneity. Our results from the the HHS sample are marginally more reliable and likely driven by the fact that companies are required to report certain types of incidents under section 13402 (e) (4) of the HITECH Act. With the European Union’s General Data Protection Regulation and Directive coming into effect in 2018, which include mandatory data breach notification rules, we hope this will provide a future data source with incidents across many industries.
In both cases, however, we tested our concerns for sample selection more formally by replacing instances when a given company is not observed in the PRC or HHS dataset with a value of zero for records breached. If, for example, both databases are the entire universe of breaches, it is safe to infer that there are zero breaches when a company is not observed in them. However, when implementing this diagnostic, we recovered estimates that were even more noisy and centered at zero with
We also are required to assume that records are additively separable. Our heterogeneity analysis indicates that there are substantial differences in the correlations between breaches and firm outcomes based on the nature of the breach, meaning that our assumption of homogeneous effects merely through the inclusion of logged records breached generates a form of heterogeneous treatment effects. A related issue arises from the fact that not all information lost is equally harmful. If, for example, emails from a CEO are released, that could affect firm outcomes much more than a rank-and-file worker’s information might simply because the former is much more visible to shareholders and the public. We are aware of these problems, but simply due to sample size constraints are unable to resolve them.
The second major constraint is that our estimates are based solely on the set of publicly traded firms. However, large publicly traded companies often comprise many establishments, which increases the noise-to-signal ratio in causal inference since a cyber security incident, including data breaches, might occur only at a single establishment, leaving the bulk of the firm unscathed. To the extent that data breaches affect the local establishment more than the overall firm, then focusing only on the large companies could add measurement error. Future analysis can match based on establishments using Dun and Bradstreet data, but our results more generally point towards the conclusion that neither the PRC or HHS publicly reported datasets are even useful for causal inference.16
As a final note, we also used data from the Veris Community Database, which contains an additional set of cyber security incidents (including a sub-set of data breaches). However, the data were less comparable to those in the PRC and HHS and did not add any predictive power in our regressions. To keep our analysis as transparent and simple as possible, we use the PRC to obtain a broad cross-section of companies and the HHS to narrow in on an industry that is most at risk by data breaches specifically.
Conclusion
Despite the increasing concerns and perceived damages associated with emerging cyber security incidents, there is no causal evidence on their potential long-run economic effects. The only available studies that speculate over the costs use either: (i) self-reported cost data where companies are asked about how much they think attacks cost them, or (ii) aggregate data where engineering cost estimates are applied to large swaths of the population. We address this empirical gap by producing the first panel dataset containing both financial and data breach incidents at a firm-level using data from the Privacy Rights Clearinghouse (PRC) and Department of Health and Human Services (HHS) from 2005 to 2016. The dataset enables us to provide, to our knowledge, the first descriptive evidence to date on the operational and financial health (e.g., cash flow and assets) of companies joint with their histories of data breaches.
The first part of our paper began by documenting several descriptive statistics about breaches – the types of breaches, their location, and incidence in publicly traded companies. The majority of breaches tend to take place either directly through an individual’s desktop computer or through email, which is consistent with the anecdotal evidence about employee inattentiveness to phishing scams and other behaviors (e.g. picking up and using USB thumb drives infected with malware). We also examined the differences between the set of publicly traded companies with reported breaches and the entire universe of publicly traded companies. We find that the companies contained in our sample are roughly 10 times larger – as measured by employees or assets – than the average company in Compustat, suggesting that only the most visible of publicly traded companies get their breach covered and reported.
The second part of our paper examined the association between breaches and firm outcomes. Using cross-sectional variation, our results suggest that a 10% rise in records breached is associated with a 0.2% decline in firm productivity. We find massive heterogeneity in the treatment effects when we partition by the type of breach, but are unable to determine whether the dispersion is spurious due to small sample sizes, particularly in the HHS data. For example, we also found that a 10% rise in records breached is associated with a 1.1% decline in firm productivity for the set of breaches due to theft. In either case, our cross-sectional estimates are non-trivial in light of other treatments that influence firm productivity [32].
Despite suggestive evidence on the negative association between breaches and firm outcomes, our data is plagued by serious sample selection problems. In particular, our results are based only off of the instances when the company is observed reporting a breach. Periods when the company does not have a reported breach does not necessarily indicate that the company indeed had zero breaches; rather, it indicates that the company simply was not caught on public record with the breach. When we instead set records breached to zero in years that the company did appear as having any publicly reported breaches, we find that there is no association between breaches and firm outcomes, indicating that there is a selection problem. Our results point towards an acute need for developing more comprehensive data on cyber security incident outcomes at the firm-level.
Decision-makers in firms and policy makers in governments require evidence in order to make well-informed decisions regarding information security investments. However, the requisite evidence is not available for econometric analysis given the data deficiencies identified in this paper. Mandatory breach notification rules, such as those coming into effect in the EU in 2018, might provide future data sources that remedy these deficiencies. Until that point, data deficiencies will persist and, in turn, effective investment decision-making for information security will continue to be hampered.
Footnotes
See Verizon’s Data Breach Investigations Report (
We also experimented with the VERIS Community Database, but it did not add any predictive power to our analysis. We, therefore, omit it for simplicity.
Equifax has, since then, launched a “free-for-life” service that offers consumers the ability to lock and unlock their Equifax credit report as an attempt to rebuild consumer trust (
When the financial cost from data breaches are deemed ‘material’, publicly-listed companies report these costs in their quarterly financial filings to the U.S. Securities and Exchange Commission. Such past incidents have typically resulted in costs that equate to a small fraction of annual revenues (
While there are many ways to compute measures of productivity, this specification assumes a Cobb-Douglas production function among the three inputs, taking the residual as unexplained variation in revenue based on the inputs. There are other more recent approaches [![]() ], but for the sake of simplicity we defer to the more transparent method.
], but for the sake of simplicity we defer to the more transparent method.
There are a few entries that include multiple firms, which we omit from the analysis since there is no way to reasonably infer the fraction of the reported total accounts breached that correspond to each of the included firms.
We assume the usual regularity assumptions on the production function – that the factor shares are bounded by zero and one.
For instance, the Bureau of Labor Statistics (BLS) forecasts that employment in cyber security will grow 18% from 2014 to 2024, which is much more rapid than the average. Starting salaries are roughly $91,000 and many expect them to continue rising (
We also recognize our parametric assumption about the functional form between breaches and firm outcomes. Given that the distribution of breaches is skewed, we also implemented (but do not report for brevity) regressions that include higher-order terms and splines. Splines may be an effective strategy, but they require sufficient numbers of observations within each partition of the distribution. Our use of the term
A separate concern is that the cyber security incidents tend to reflect multiple sources of security failures. For example, an attack may involve not only lost records, but also fraud and a shock to the networks that bring company operations to a halt. While the solution is to simply condition on these different measures – that is, the continuous measure of records lost and the discrete measures of the type of attack – there is simply not enough within-firm variation in the available data to separately identify the coefficients, let alone on any single coefficient.
Acknowledgments
Christos Makridis thanks Columbia SIPA for their doctoral fellowship in cyber security studies. We also thank Jay Healey at SIPA for comments on an early version of the draft and Herb Lin and the Stanford Cybersecurity Initiative for feedback. An earlier version of the paper was titled: “The Economic Effects of Cyber Security Failures on Firms: Evidence from Publicly Reported Data Breaches”.