






Abstract
A country’s price competitiveness is generally proxied by the real effective exchange rate of its currency. In this article we present a novel three-market breakdown (domestic, euro-area and non-euro area markets) of this measure, with an application to the four main euro-area countries. Price-competitiveness developments are indeed found to be heterogeneous across markets, thereby confirming the usefulness of this decomposition. In particular, we find that in the 1999–2018 period only Germany recorded comparable (large) gains in both euro and non-euro area markets. France posted a larger gain, and Spain marked a smaller loss, in euro-area markets; conversely, Italy’s mild improvement was greater in non-euro area markets. Finally, competitiveness in the domestic market and that in non-euro area markets are found to be the main, equally important, drivers of overall developments since 1999 in Italy and in Germany.
Keywords
Introduction2
This study focuses on the measurement of price-competitiveness developments in the four main euro-area economies. We start from the standard definition of a country’s price-competitiveness indicator (PCI) – or real effective exchange rate (REER) for non-euro area countries according to the Eurosystem’s taxonomy – as a weighted geometric average of nominal exchange rates vis-à-vis its main trading partners or competitors (the nominal PCI or the nominal effective exchange rate, NEER, respectively), deflated by relative prices or costs. As in [1, 2], the weighting scheme encompasses both competitive pressures in the domestic market and export-based competition in foreign markets, such that the overall PCI can also be expressed as a weighted average of an import-based PCI and an export-based PCI. Moreover, the overall PCI can be centred on specific subgroups of competitors, in particular euro-area or non-euro area trading partners.
Many international institutions, such as the IMF [3] and the BIS [4], and central banks, such as the Bank of Italy [1], the ECB [2], the Bank of England [5] and the Federal Reserve Board [6], construct and publish overall PCIs, using a similar, standard methodology. Methodological differences (for example, in the number of competitors considered or in the updating frequency of the employed trade weights) are highlighted in Table A1 in Annex 1. To our knowledge, in addition to the Bank of Italy, only the ECB publishes PCIs disaggregated by subgroups of trading partners.
One significant difference across institutions concerns the choice of the price and/or cost index employed to deflate the nominal PCI or NEER. There is indeed consensus both in the trade literature and in the policy debate that no optimal deflator exists. Discussions on the various alternative cost and price indices employed to deflate the NEER are found, for example, in [7, 8], yet both theoretically and empirically, no index proves to be superior. In particular, the following deflators are commonly used, each of which has both general advantages and shortcomings as for the measurement of a country’s external competitiveness.
Consumer price indices (CPIs) are rapidly available on a monthly basis for most advanced and emerging economies. They are constructed with fairly homogeneous methodologies across countries and on the basis of comparable baskets. They include goods that are acquired by households for consumption, as well as services (many of which are non-tradable), excluding capital and intermediate goods, which are heavily traded. Moreover, they are subject to distortions owing to fiscal measures. Producer price indices (PPIs) too are monthly indicators, yet they are compiled by fewer economies than CPIs and are often less timely. They refer to prices received by domestic producers for their output, generally with some sectoral disaggregation (typically, mining, manufacturing, utilities, construction and agriculture). They are less affected by taxes and subsidies than CPIs.3
Gross domestic product (GDP) deflators refer to all sectors and to all types of goods and services, but they are subject to significant composition effects between the public and private sectors. Moreover, they are only available on a quarterly basis with a significant delay relative to the reference period and may be subject to significant revisions. Unit labour costs in manufacturing (ULCMs) refer solely to one sector, which however is the one tradable goods are usually identified with. They ignore additional components of production costs, so that their evolution may be affected by the possible substitution between material inputs, intermediate services, labour and capital. Furthermore, they are available on a quarterly basis, generally only for advanced economies, and are subject to strong backward revisions. Unit labour costs in the total economy (ULCTs), on the one side, comprehensively include all sectors of the economy, so are less affected by input substitution; on the other side, they share the remaining drawbacks of ULCMs, in addition to the possible bias owing to potentially large sectoral composition effects.
In particular, the ECB publishes PCIs deflated by the CPI, the GDP deflator and the ULCT [2]. The Bank of Italy constructs PCIs deflated by the PPI of domestically sold manufactures [1]. The latter prices may be considered as a proxy for cost developments that encompasses all production cost pressures. Moreover, they are more likely to capture the whole sector of tradable goods, which is a broader concept than traded goods, since some tradables may turn out not to be actively traded internationally specifically because of competitiveness issues. In other terms, the basket of products represented in producer prices of manufactures sold on the internal market is more likely to capture the whole spectrum of potential supply to domestic and foreign markets.
Developments of alternately deflated PCIs can differ – and have differed – substantially for a number of countries, as discussed in [10, 11, 12], and as shown in Fig. 1A of Annex A for the four main euro-area countries.4 For example, according to the Bank of Italy’s PPI-based indicator, in the period 1999Q4-2009Q4 price competitiveness in Italy deteriorated by about six percentage points; the loss was much more pronounced (approximately 18 points) according to the ECB’s ULCT measure. [12] argues that this discrepancy was in part due to sharply falling labour shares in Italy’s main trading partner, Germany, which excessively penalised Italy’s relative ULCT, whereas it pushed up Italy’s relative PPI to a much lower extent, given that other cost components partly offset the labour dynamics. Another case-study is Spain. Since the end of 2009 Spain’s price competitiveness has improved by an impressive 20 percentage points if measured according to the ULCT-based PCI, yet only by around 3 according to the PPI-based measure. Labour shedding has indeed contributed to improve Spain’s overall price competitiveness, but the relative cost of other production factors and the evolution of mark-ups has dampened this effect. These examples imply that a comprehensive analysis of price and cost competitiveness should be based on a range of alternately deflated indicators (on this, see also [14, 15]). Yet this aim goes beyond the scope of this article.
Indeed, herein we examine PCIs from a different angle relative to the existing literature and which is independent from the choice of the appropriate PCI deflator. In particular, we consider subgroups of export markets, rather than subgroups of competitors, and derive measures of export-based competitiveness in specific markets (in particular, in euro-area and non-euro area markets). To our knowledge this is the first attempt to achieve this type of breakdown. This addition enables assessing price-competitiveness trends of a given economy in specific geographical areas, taking into account pressures from all countries that export to that region, instead of competitiveness developments in world markets against selected trading partners. A country’s price competitiveness performance may differ across markets for an array of heterogeneous factors;5 the analysis of these factors, however, goes beyond the scope of this study, which is centred solely on measurement issues.
In summary, we show that overall PCIs can be conveniently broken down according to a three-market perspective (domestic; euro-area; non-euro area). This allows gauging the role of each component in driving aggregate price-competitiveness trends of the four main euro-area countries, namely France, Germany, Italy and Spain. These four countries are an interesting case-study since they all display a non-negligible economic size and, despite being bound by a common currency (the euro), have recorded different export performances since 1999 (e.g. [18]); heterogeneous price-competitiveness developments may indeed be behind these dynamics.
The split between euro vs. non-euro area export outlets shows that in the overall 1999–2018 period only for Germany price-competitiveness developments were comparable in the two export markets, where significant gains were recorded. Instead, for France and Spain developments were relatively more favourable in the euro-area market; France recorded a larger gain and Spain posted a slightly smaller loss in the euro-area market than elsewhere. In contrast, Italy is the only economy that marked a better performance in non-euro area markets. Differences are much starker when focussing on the pre-global financial crisis period (1999–2007). Finally, price competitiveness in the domestic market and that in non-euro area markers is found to have contributed broadly equally to aggregate price-competitiveness dynamics in Italy and in Germany.
The structure of the article is the following. Section 2 first describes the standard methodology underlying the construction of the Bank of Italy’s PCIs and then explains the algebra underlying the new set of measures we here introduce. Section 3 discusses price-competitiveness developments in the four main euro-area countries since 1999 according to the standard aggregate (i.e. on all world markets) PCIs. Section 4 breaks the analysis down into euro and non-euro export markets, according to the novel set of indicators put forward in this article. Section 5 wraps up the analysis by applying a three-market decomposition of aggregate price-competitiveness developments, in order to gauge the main drivers of the latter in the four countries of interest. Section 6 concludes.
This section first recaps the methodology underlying Bank of Italy’s current PCIs, described more in detail in [1, 19, 20], which cover 61 countries, listed in Table B1 in the Annex, at a monthly frequency since January 1992. This section next describes the novel breakdown of export-based indicators in euro and non-euro markets, thus implementing the three-market decomposition of overall PCIs.
A recap of the current methodology
The starting point is the nominal effective exchange rate (NEER), or nominal PCI for euro-area countries, which is calculated as the weighted geometric average of bilateral nominal exchange rates. Omitting time subscripts for simplicity, the NEER of reporting country
where
The overall weight
where
The import weight of competitor country
where
The export weight of competitor
where
The double-weighted export weight measures both the direct competition faced by reporting country
As is common practice in the literature, bilateral trade flows in some fixed reference period are employed to compute the weights (
The PCI of a country
where the last equal sign follows from Eq. (1) and
Finally, Eqs (2)–(5) can be combined to obtain an alternative interpretation of the “overall” PCI, expressed as a geometric weighted average of an export-based competitiveness indicator (
In order to construct market-restricted indicators, the starting point is the export-based PCI for country
where the inner summation also considers competitive pressures of local producers by competitor
By inverting the two summations and using the definition
where recall that
So, for example, the export-based PCI of country
Here
where
The aggregate (i.e. on all markets) export-based PCI of country
where
Lastly, the log-version of Eqs (6) and (11) underpin a three-market view of PCIs based on the following decomposition:
As mentioned in Section 1, this decomposition is independent of the choice of the deflator. The PCIs discussed hereon are all deflated by the PPI of manufactures sold domestically. In principle, one could explore the possibility of employing PPIs of manufactures sold in foreign (i.e. euro-area and non-euro area) markets, in order to capture price discrimination across markets, for the first and second terms in Eq. (12) and import prices for the third term. As discussed in [19], there are several arguments against this choice. First, these price indices refer by definition to traded goods, as opposed to tradables, so that in a sense they are inherently unfit for a forward-looking analysis of sustainable price developments. Second, they are available only for a limited number of countries, namely EU members and in some cases for short time spans (the same applies to overall-sales producer price indices, which are a weighted average of domestic-sales and foreign-sales producer prices). Third, these indices would still not appropriately measure pricing to market due to different countries’ invoicing currency choices. Finally, the alternative option of resorting to unit values is unpalatable since they are known to be biased deflators. In particular, changes in unit value indices may be due to variations in composition: the bias in these indices is thus tied to changes in the mix of goods exported and to the poor quality of data on quantities (e.g. [21]).
In this section we appraise price-competitiveness developments in the four main euro-area countries between 1999 and 2018 (Table 1; Fig. 1, panel a) by looking at overall worldwide PCIs that take into account both import and export-based competitive pressures on all markets. We restrict the analysis in this article to post-1999 developments, although our series are available since 1992, in order to focus solely on the homogeneous period following the adoption of the euro.
Since the inception of the Economic Monetary Union France, Germany, and to a much lesser extent, Italy have recorded a gain in price competitiveness, according to the Bank of Italy’s PCIs; conversely, Spain has marked a substantial loss. Spain’s overall performance deserves a few remarks. Since 1999 this country has undergone a process of significant catching-up, reflected in its stellar goods export performance (e.g. [18]). The disconnect between the rise in its foreign sales and its unfavourable price-competitiveness developments, when measured on a PPI basis, have been marked as the “Spanish paradox”. [22] shed light on this disconnect by showing that non-price competitiveness factors, such as company size, R&D spending, product diversification, product and process innovation were behind Spain’s high export growth since 1999.
Price-competitiveness developments are, however, found to be heterogeneous across sub-periods. In the years prior to the global financial crisis, all countries except Germany lost price competitiveness. Germany is a clear outlier relative to its peers, and its price-competitiveness gain in this period has been object of much discussion. The governance structure of German labour market institutions, underpinned by flexible contracts and mutual agreements between trade unions, employer associations and work councils, which led to the decentralization of wage bargaining to the firm level, has been highlighted as a key explanation of Germany’s wage, and therefore price, moderation in this period (e.g. [23]); other explanations refer to a very intense offshoring of its production processes relative to its main trading partners (e.g. [12]). The recessionary years then featured price-competitiveness gains in all four countries, due to both cyclical factors and to structural reforms that were pushed through in these, and the following, years (e.g. [14]). The post-2010 years were characterised by further gains for all countries bar Spain, which went back to experiencing a slight loss.
Price-competitiveness developments in the four largest euro-area countries by sub-period (percentage changes of annual averages)
Price-competitiveness developments in the four largest euro-area countries by sub-period (percentage changes of annual averages)
Source: Authors’ calculations. Notes: A positive (negative) change indicates a loss (gain) in price competitiveness.
Price competitiveness in the four largest euro-area countries. a. Developments (indices 1999 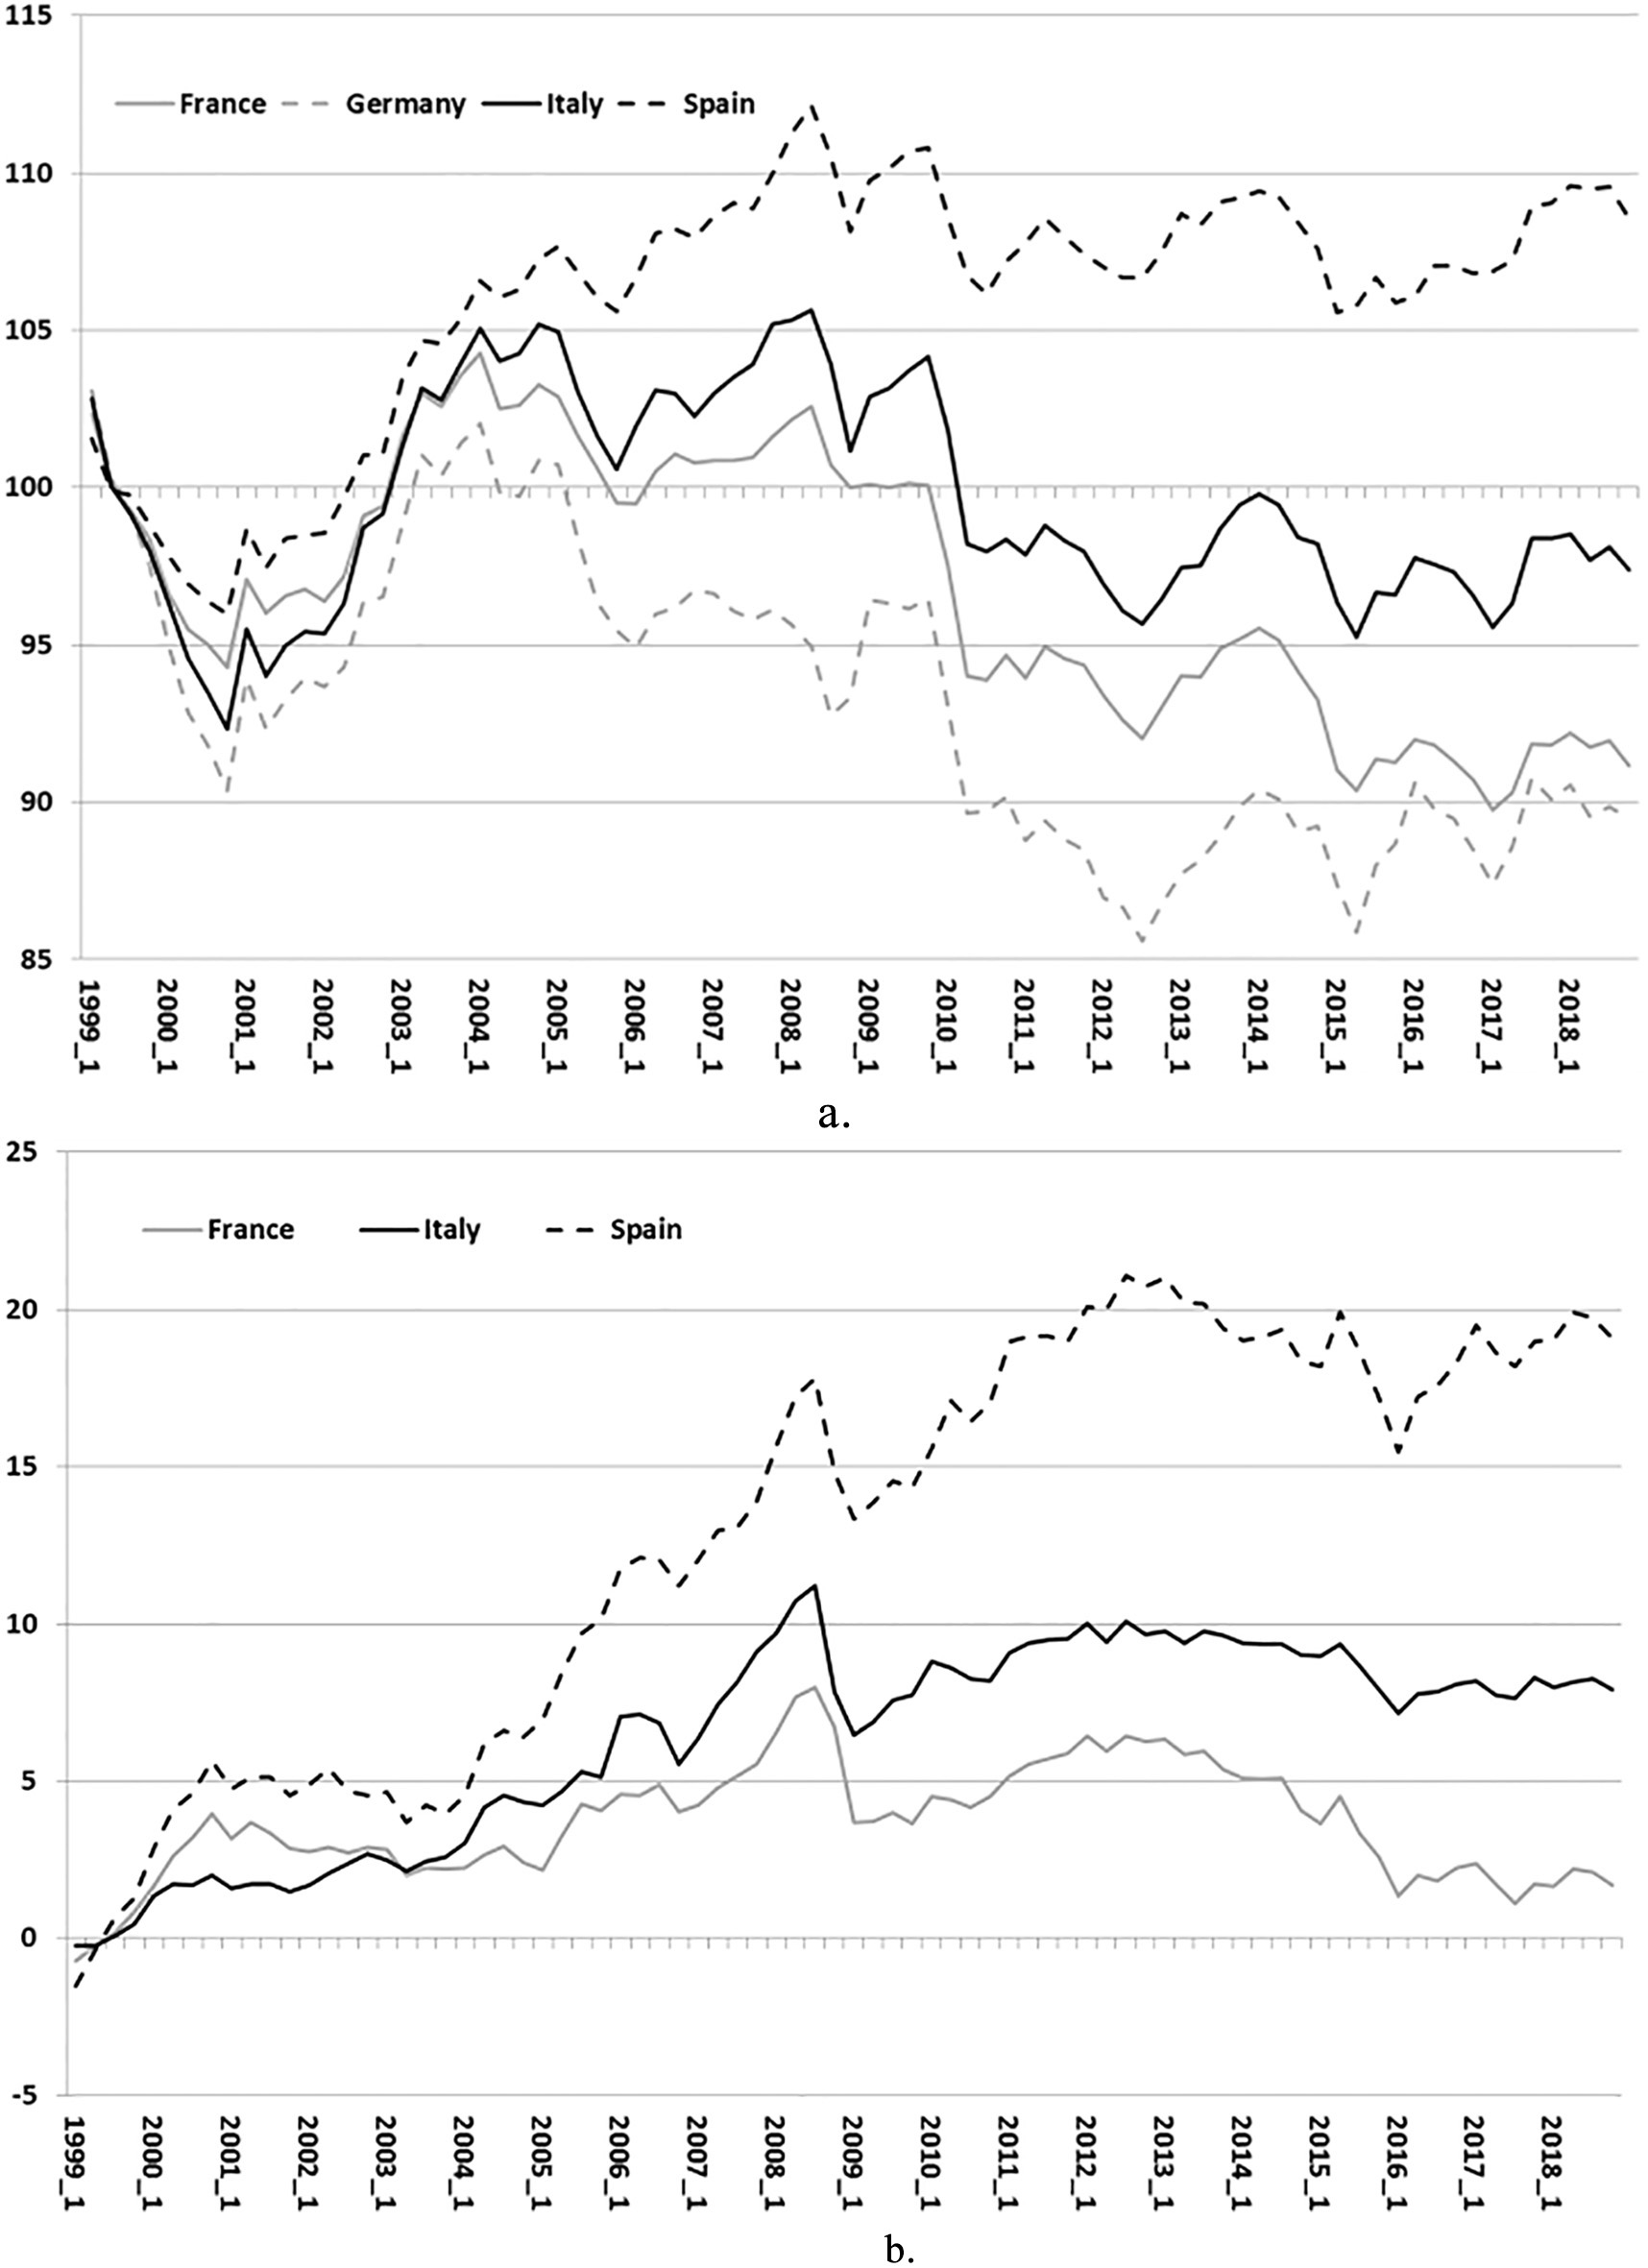
Given these dynamics, vis-à-vis Germany the three other euro-area countries progressively lost ground until 2008 (Fig. 1, panel b). The gaps temporarily closed during the Great Recession, but then widened again until 2012–2013. Since then, the differentials relative to Germany have decreased, thereby confirming that after the sovereign debt crisis across Europe a recovery in competitiveness vis-à-vis Germany was determined by relative-price adjustments. Focusing on Italy and Spain, between 1999 and the third quarter of 2012 their PCIs had cumulated a competitive loss of 10.1 and 21.1 percentage points, respectively, relative to Germany. The shortfall reached a minimum in the first quarter of 2016 to end up at 7.9 and 19.1 percentage points, respectively, in the fourth quarter of 2018.9
In addition to aggregate indicators computed vis-à-vis all 60 trading partners, the Bank of Italy, similarly to the ECB, provides indicators vis-à-vis subsets of competitors, for instance the euro-area members. Only the set of trading partners is restricted; they are still assumed to compete, as is the case for the aggregate measure, on all markets.
In Section 2 we have provided the algebra to develop a novel set of indicators. Instead of being competitor-based, these measures are market-based: they capture competitiveness dynamics of a given reporting country vis-à-vis all competitors in selected countries/areas (“markets”). These indicators refer only to export-based competitiveness (that is, to PCIs that are constructed using solely export weights and not also import weights, as is the case of the overall PCIs described in the previous section) since a market-based disaggregation is not meaningful for import competition, which by definition only takes place in the domestic market. The following example helps clarifying the difference between the competitor-based and the market-based disaggregations. The competitor-based measure for Italy vis-à-vis euro-area partners simply relates Italy’s PPIs to those of euro-area competitors, as the corresponding nominal exchange rates are fixed to unity, and weighs the resulting relative prices across all markets. Conversely, the market-based measure for Italy in euro-area markets compares Italy’s PPIs to those of all 60 competitors, taking into account the corresponding exchange rates, yet the weighting only refers to euro-area markets.
To our knowledge, no other institution produces market-based indicators, yet they are essential to shed light on the drivers of export growth in selected markets. Indeed, they have evolved differently at business-cycle frequencies compared to competitor-based measures (Fig. 2). On the basis of this newly developed set of indicators, it is possible to compare export-based competitiveness dynamics of Italy, France, Germany and Spain in euro-area markets, as opposed to those in non-euro area markets (Table 2; Fig. 3).
Export-based price-competitiveness developments in euro-area and non-euro area markets by sub-period (percentage changes on annual averages)
Export-based price-competitiveness developments in euro-area and non-euro area markets by sub-period (percentage changes on annual averages)
Source: Authors’ calculations. Notes: A positive (negative) change indicates a loss (gain) in price competitiveness.
Export-based price-competitiveness developments: market-based vs. competitor-based disaggregation a. Euro area markets/competitors (indices 1999 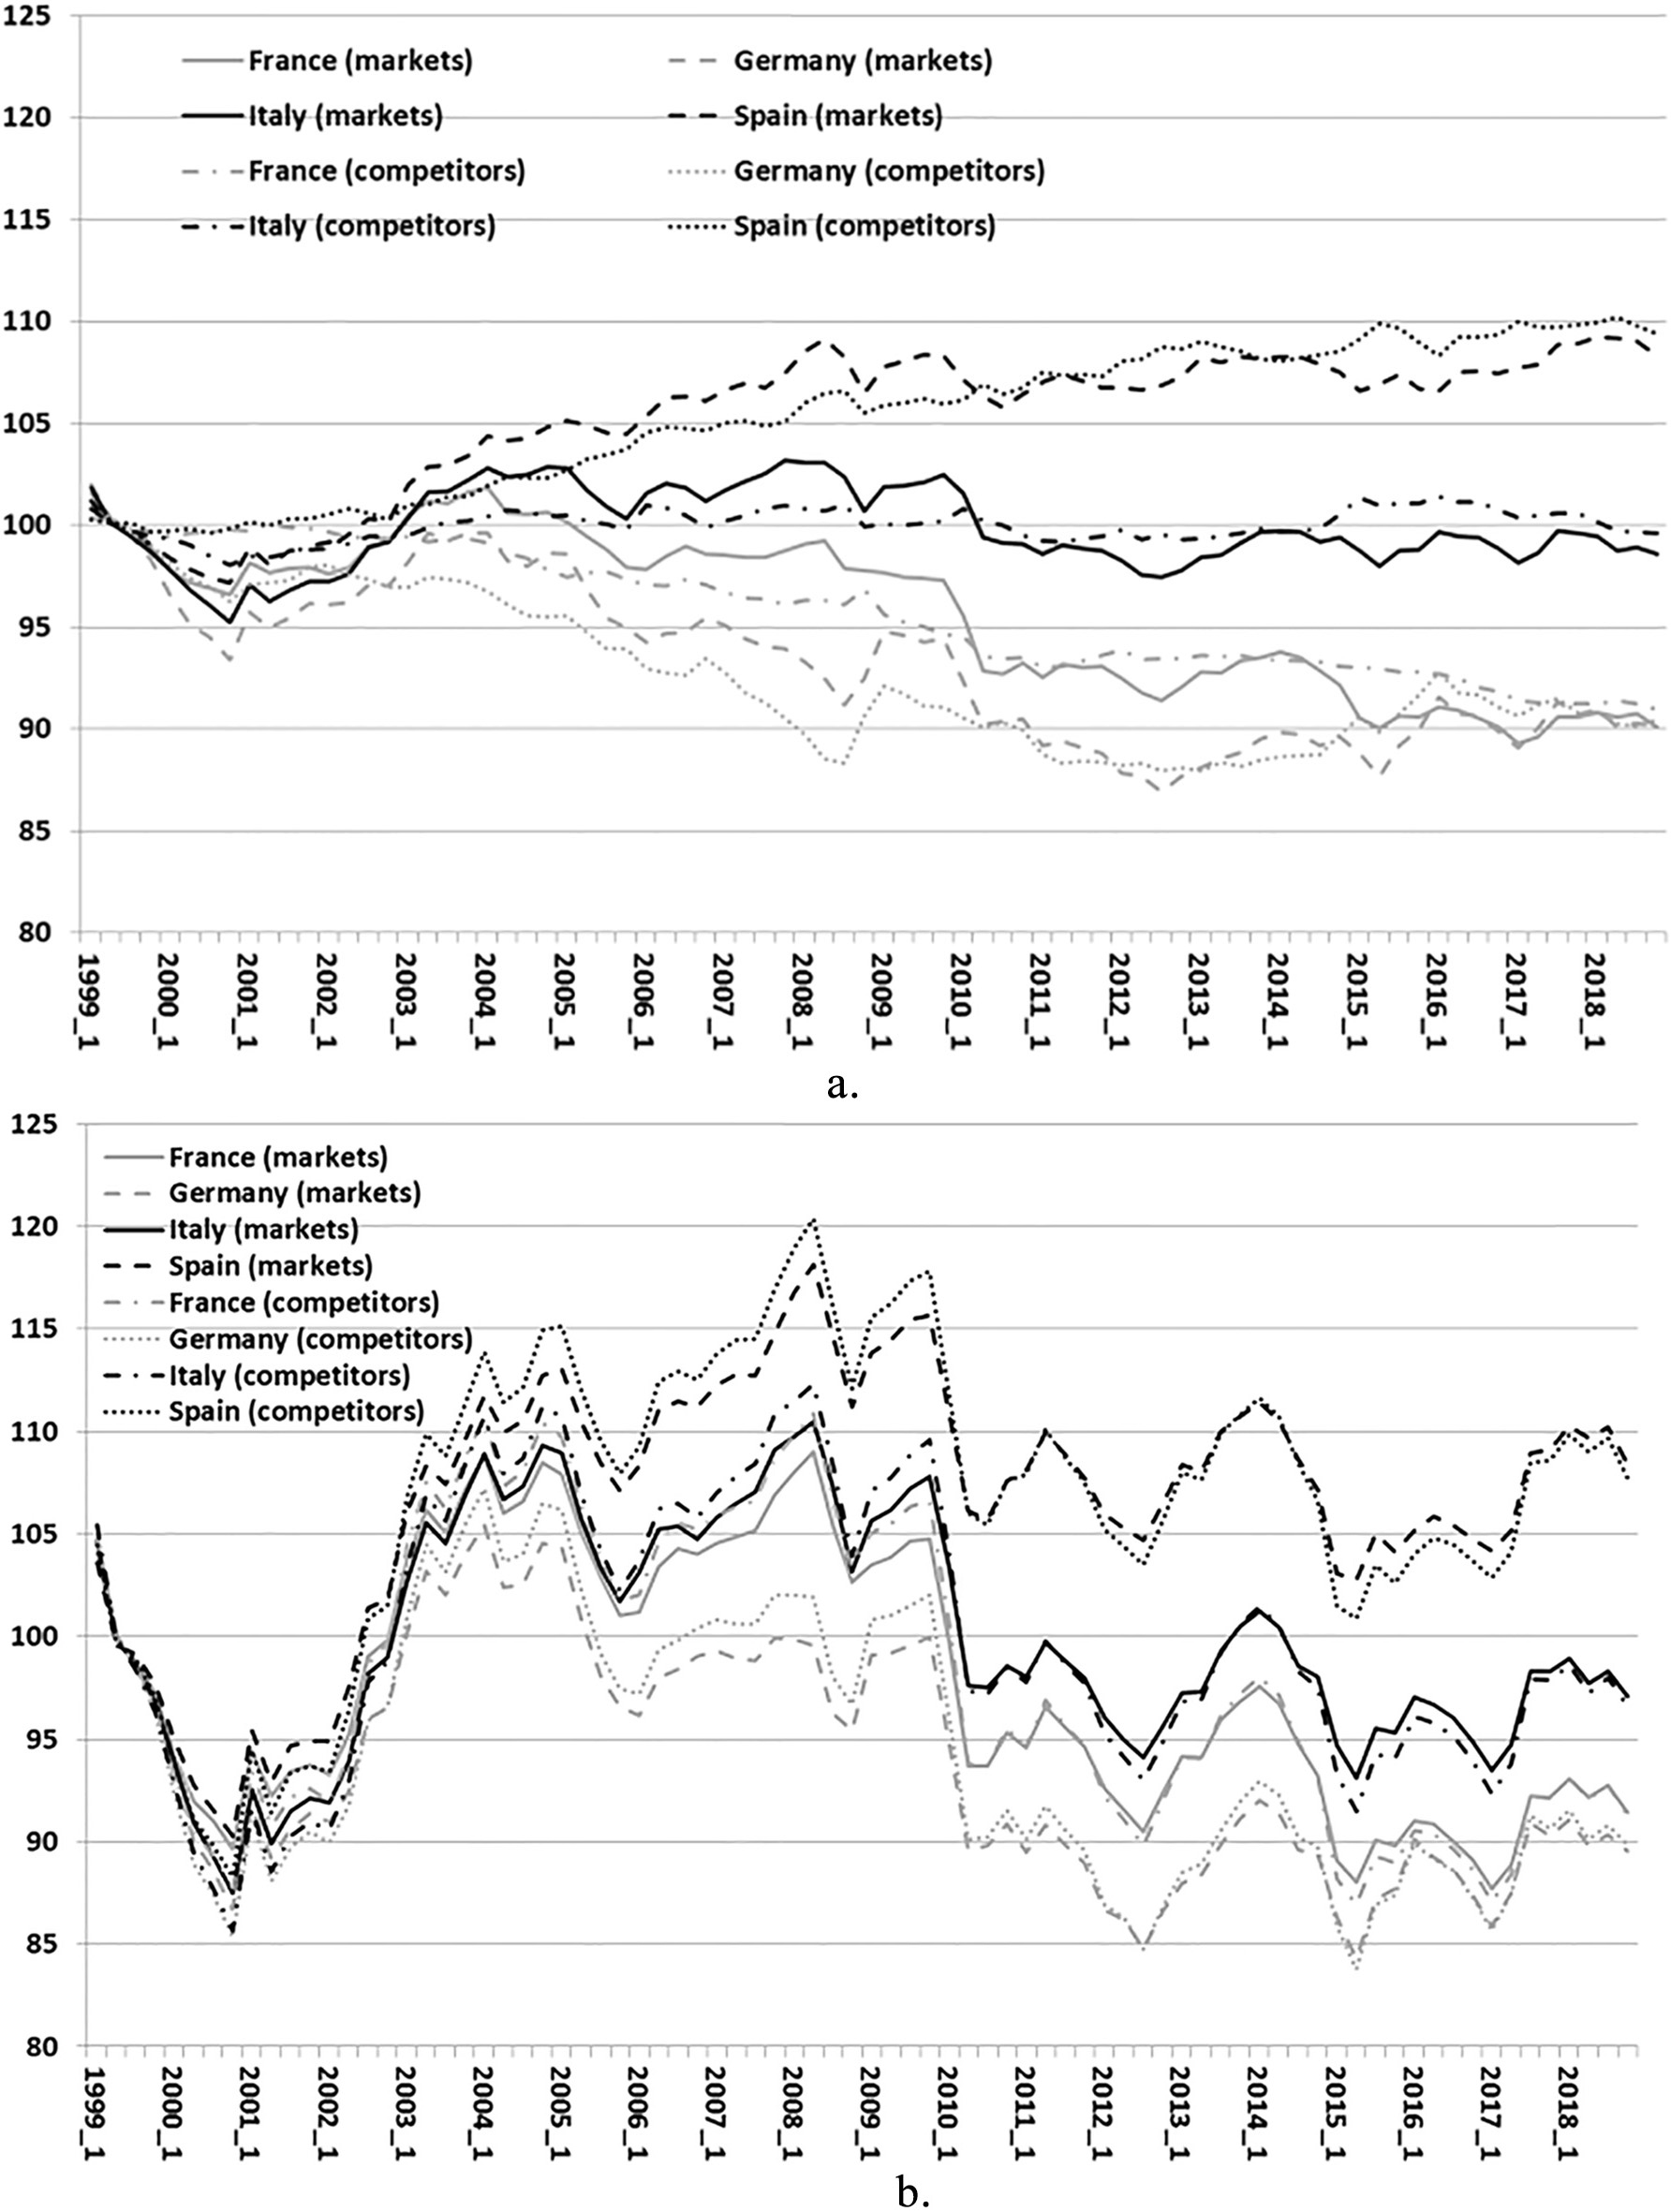
Export-based price-competitiveness developments in euro-area and non-euro area markets. a. Euro-area markets (indices 1999 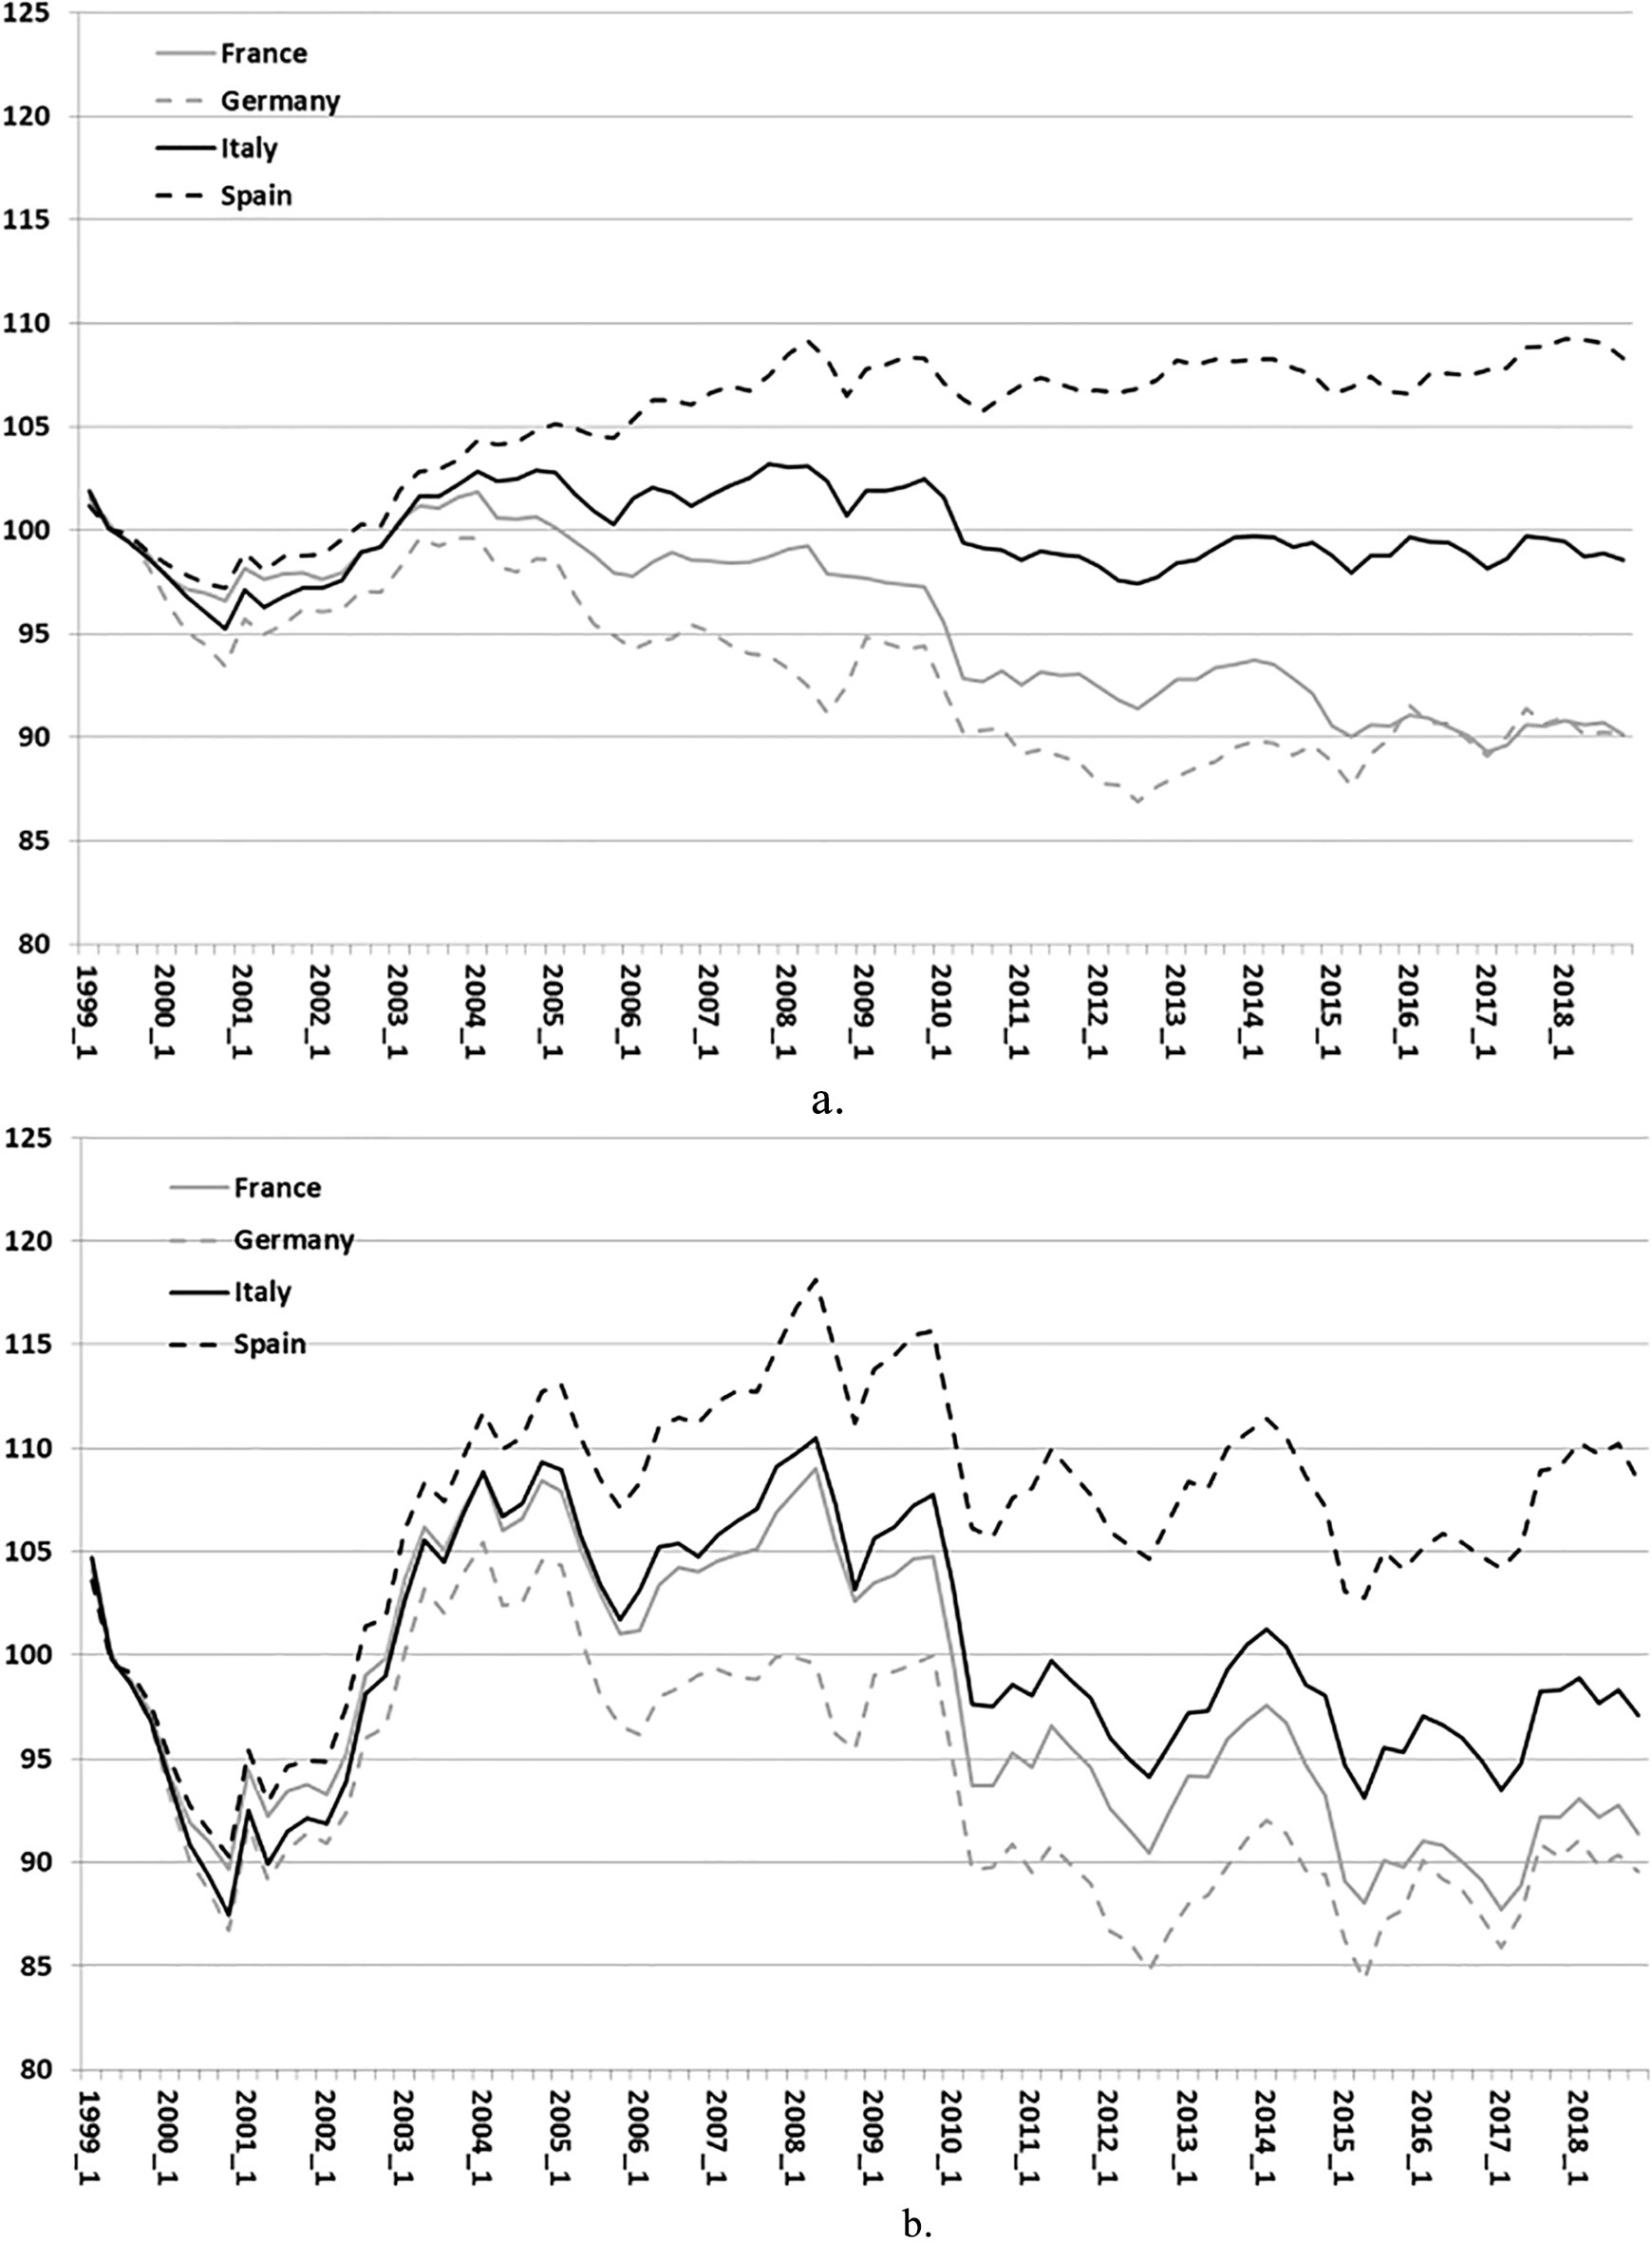
First, the export-based price-competiveness performance in the two sets of markets is found to be very heterogeneous across the four countries. Italy’s overall gain since 1999 was driven by a modest improvement in both euro and non-euro area markets, yet to a larger extent in the latter (2 percentage points). Spain’s performance was poor in both sets of destinations, yet more so in non-euro area markets (where it lost nearly 10 percentage points). France’s gain was higher in euro-area markets (9.5, against 7.6 in non-euro area markets), whereas Germany’s was very balanced between the two sets of markets, gaining almost 10 percentage points from each.
Seen from a different angle, in the overall 1999–2018 period in both euro and non-euro area markets France, Germany and Italy achieved a price-competitiveness gain (although to a much lower extent for Italy) against a sharp loss for Spain. These results would suggest that the non-price factors found to drive Spain’s favourable export dynamics since 1999, mentioned in Section 3, were relevant both for sales to the euro area and to those outside the euro area.
Second, developments again differ by sub-period. In the years prior to the eruption of the global financial crisis, France, Italy and Spain lost export competitiveness in non-euro area markets, in connection with the appreciation of the nominal effective exchange rate of the euro (as sourced by the ECB), whereas Germany recorded a broad stability. In euro-area markets competitiveness developments mirrored those of relative prices among the four economies; France and, more starkly, Germany ended up improving their competitiveness, whereas Italy and, more significantly, Spain reported a deterioration. During the Great Recession all four countries recorded competitiveness gains in both sets of export markets. After 2010 the substantial improvement continued in non-euro area markets, where the weight of non-euro area competitors is larger and where therefore the benefit of the nominal depreciation of the euro was greater, except for Spain. France stood out as marking the largest improvements in both sets of markets. This has led to a “French puzzle”, given the country’s recent modest export performance relative to its main euro-area peers despite its favourable price-competitiveness developments. [24] argue that one plausible explanation is the shift abroad of many French enterprises, which is not captured by standard macroeconomic PCIs. In the period 2010–2018 Germany and Italy’s gains were comparable in the non-euro area market, whereas Italy’s was relatively larger in the euro-area market.
Finally, in euro-area markets the export-based competitiveness gaps of France, Italy and Spain relative to Germany rose until 2008, to a varying and increasing extent across the three countries (Fig. 4, panel a). The differential continued to widen in Spain until 2013, broadly stabilising thereafter. Conversely, after peaking in the course of 2008, the gap levelled out in Italy and decreased in France. On average in 2018 Spain’s gap vis-à-vis Germany was of nearly 19 percentage points, Italy’s stood at 8.5 points, whereas France even recorded a tiny advantage over Germany.
Export-based price-competitiveness differentials with respect to Germany. a. Euro-area markets (differences in indices 1999 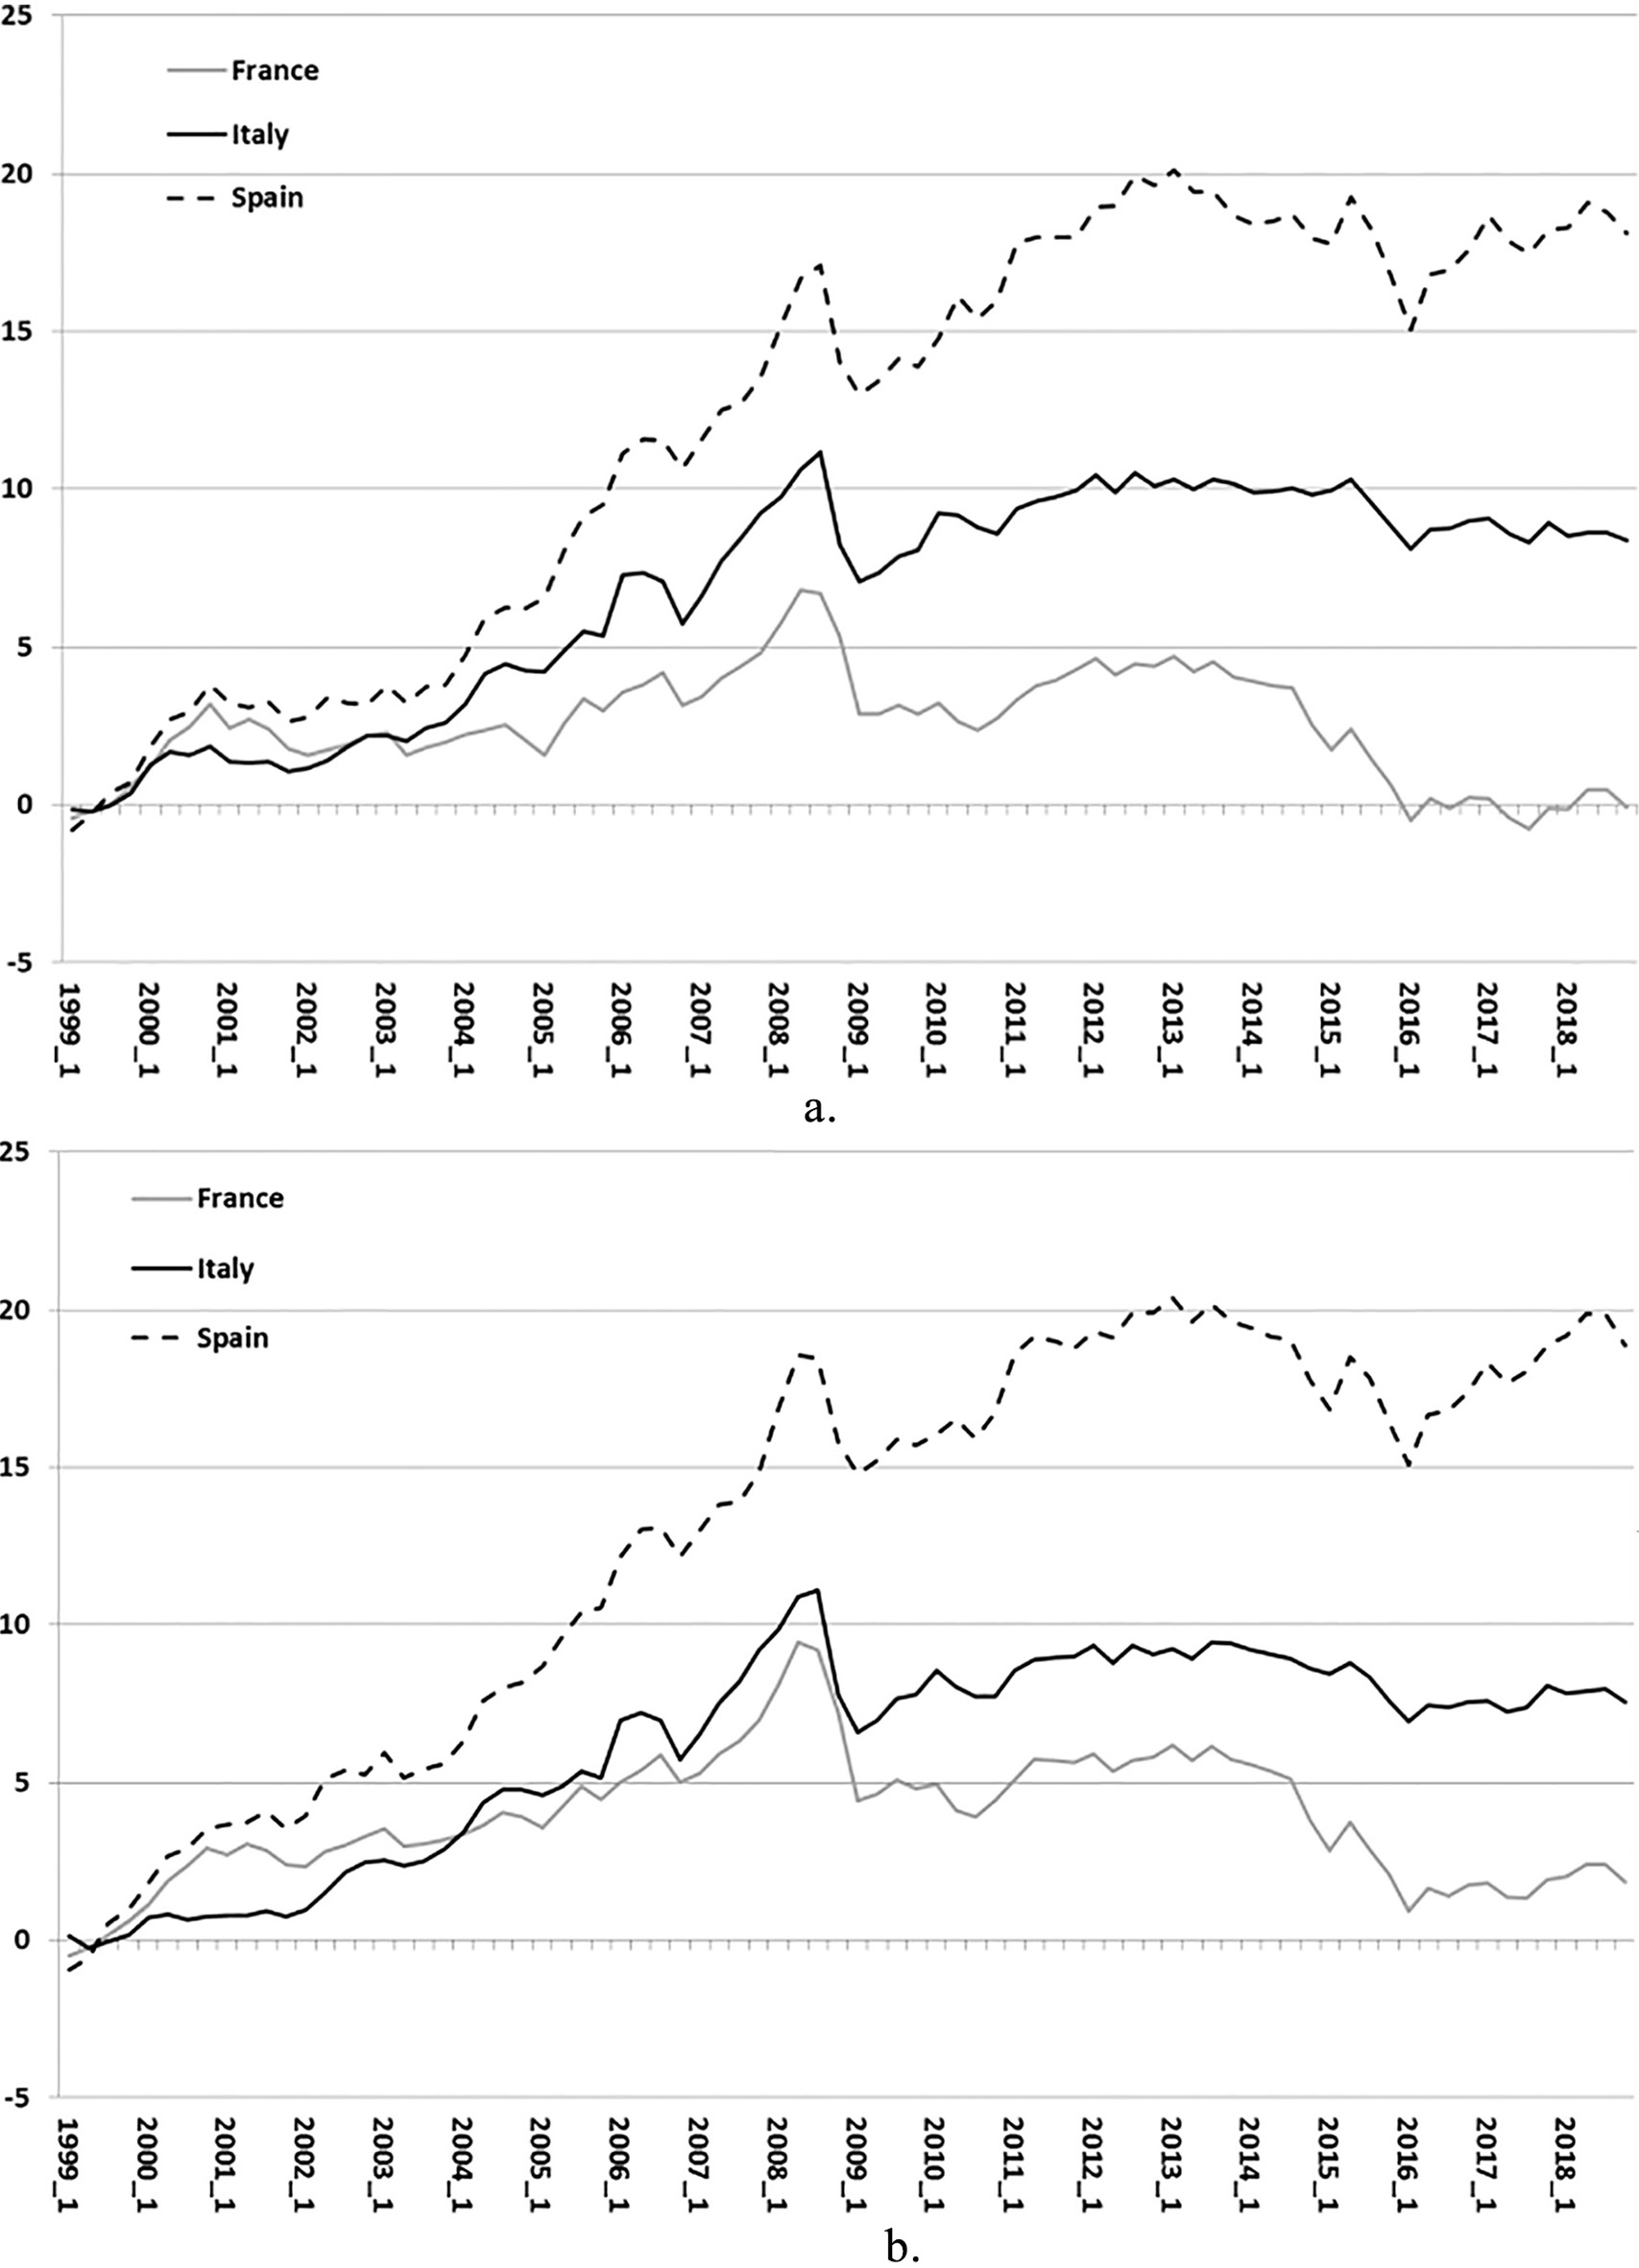
Concerning non-euro area markets, developments vis-à-vis Germany were similar, for each country, to the corresponding dynamics observed in euro-area markets, although the size of the gap was different in Italy and in France (Fig. 4, panel b). In particular, on average in 2018 Italy’s export-based competitiveness differential was only slightly smaller than that reported for euro-area markets, standing at 7.8 percentage points, whereas France’s gap was negative, albeit contained (over 2 points).
A decomposition of overall price competitiveness by market. a. France; b. Germany; c. Italy; d. Spain. (percentage-point contributions; averages by period). Source: Authors’ calculations. Notes: Positive (negative) bars indicate a loss (gain) in price competitiveness. Each bar is obtained by adding up the annual log changes of the corresponding sub-indicator, thereby disregarding compounding.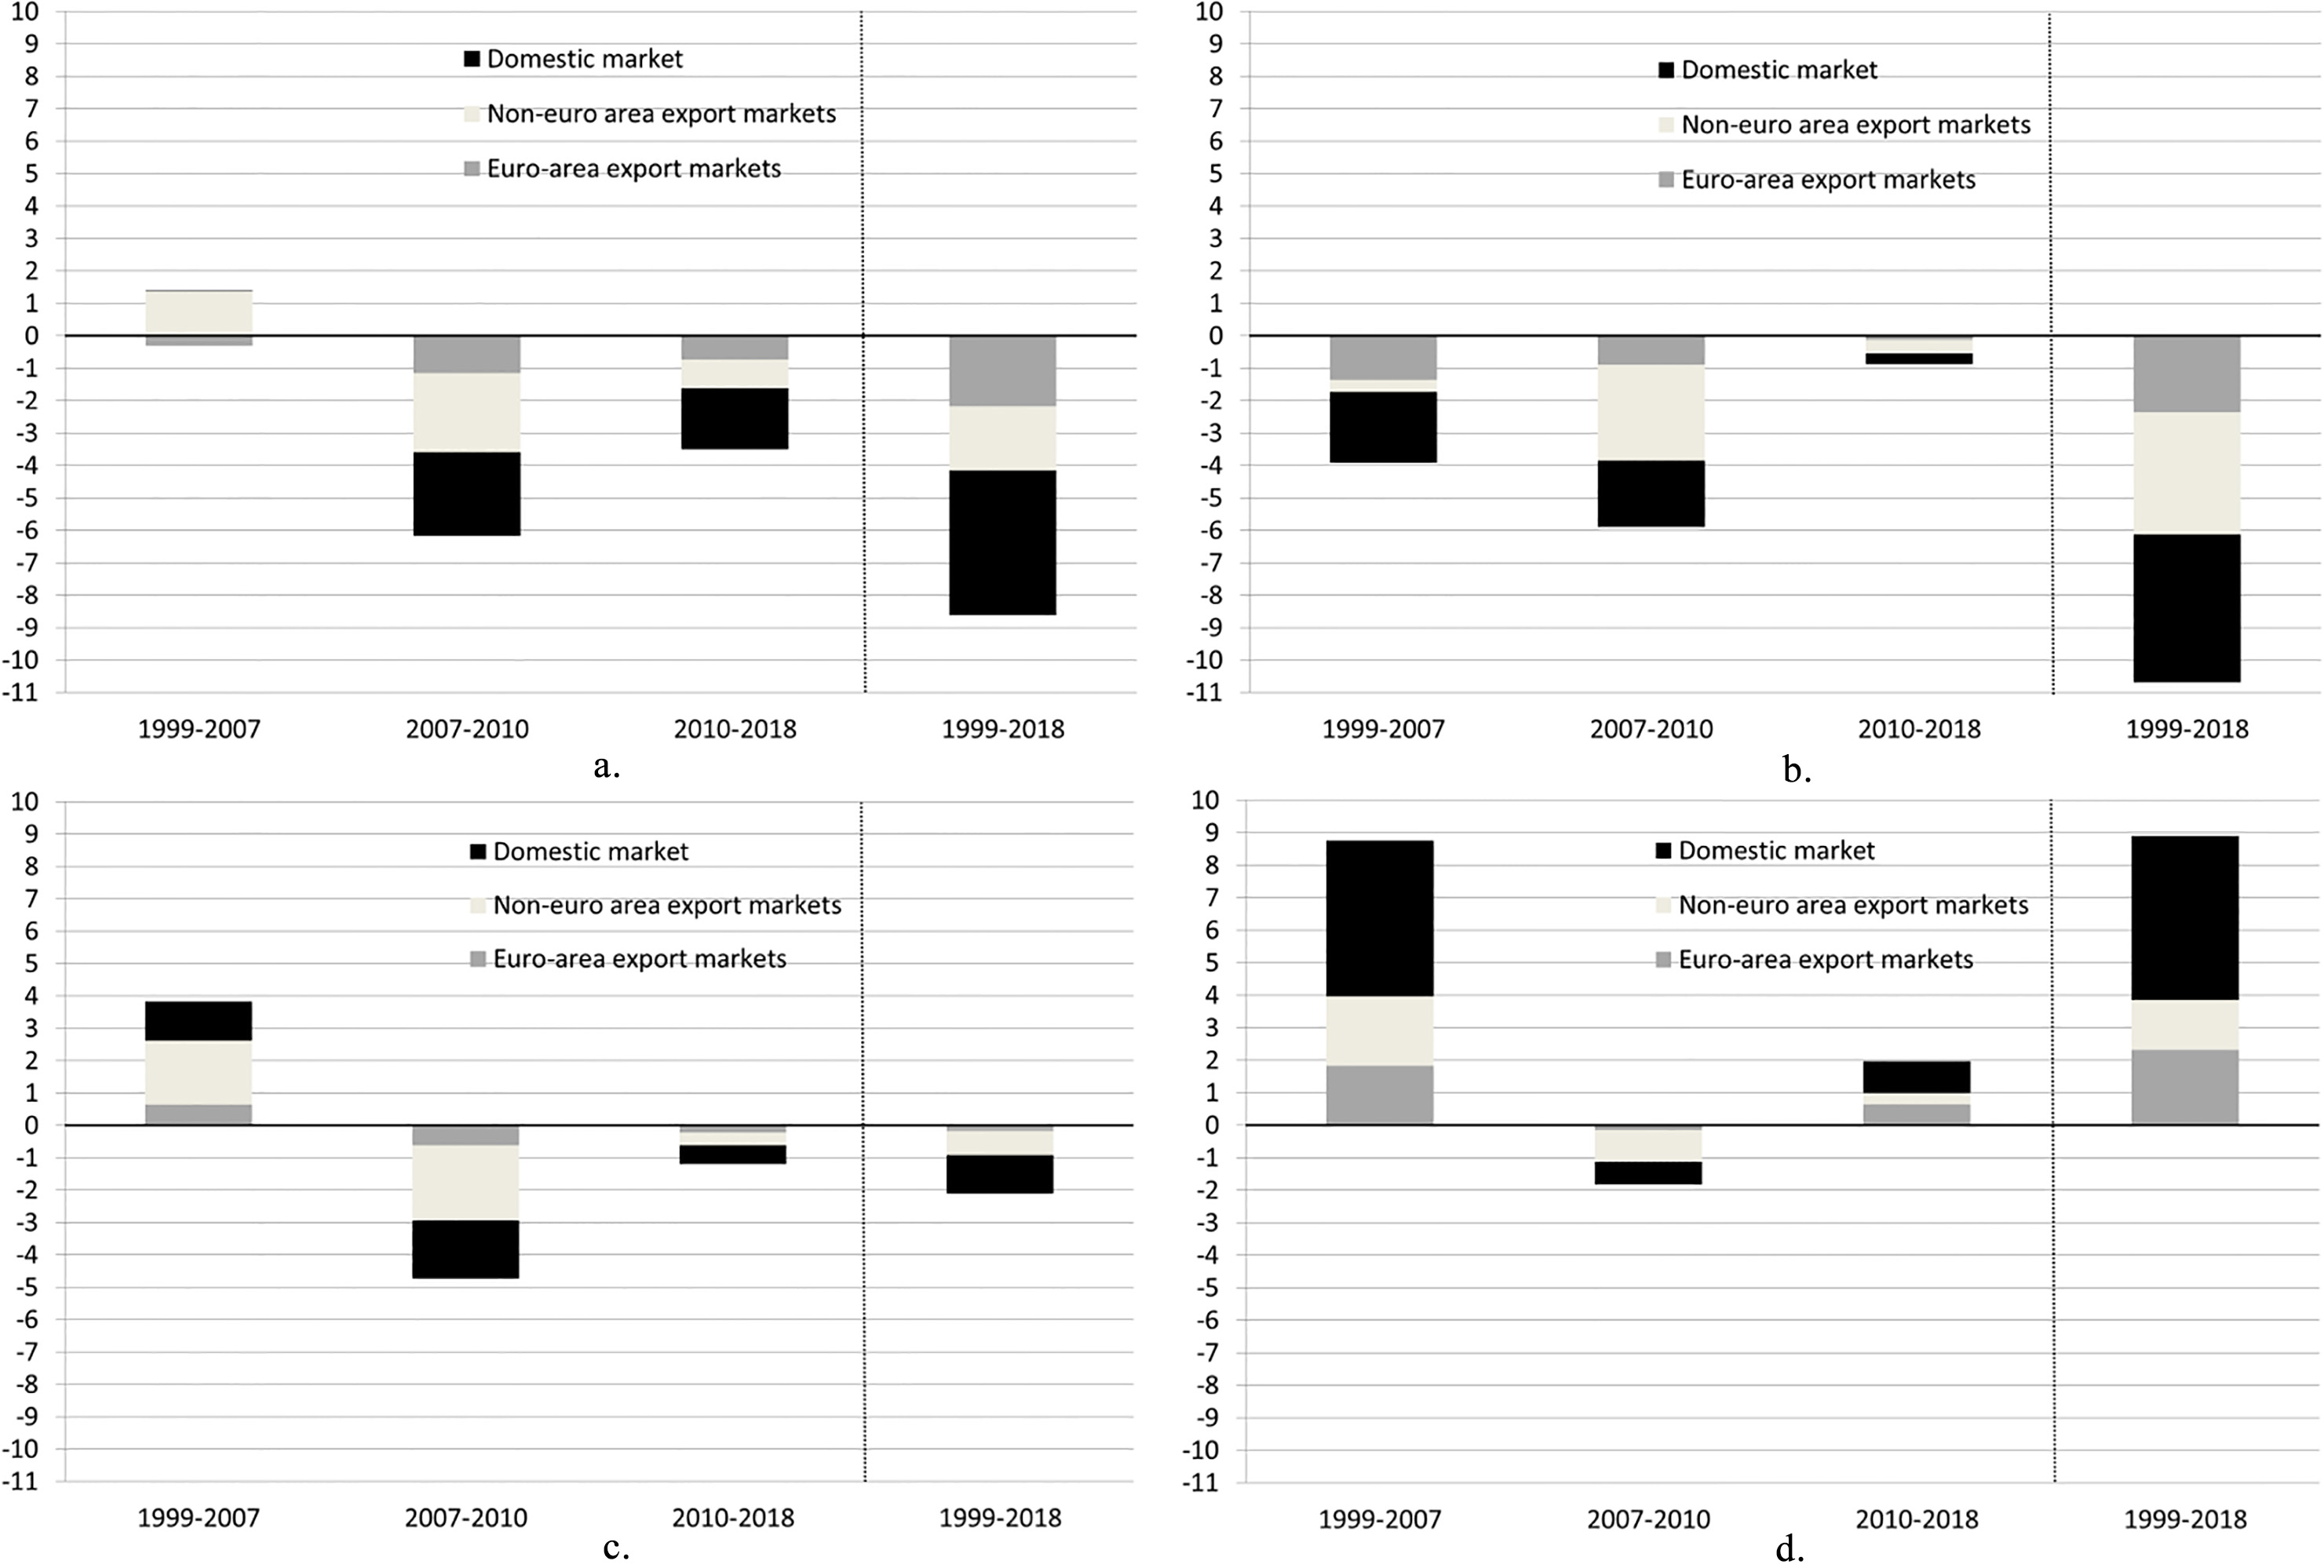
The overall PCI of a given reporting country can be decomposed into three components (the three square brackets in Eq. (12) in Section 2), each referring to a different market: a) the domestic market, in which domestic producers compete with foreign exporters; b) euro-area export markets, in which all countries compete against each other; c) non-euro area markets, in which again all countries compete against each other. Figure 5 depicts the contribution of each component by sub-period in the four main euro-area countries.
Several facts stand out. First, all three components generally display the same sign (within country and sub-period), so that export-based competitiveness developments (i.e. the sum of the two differently-shaded grey bars in Fig. 5) are magnified by those in the domestic market. Viewed from a different angle, this also means that differences across countries in overall competitiveness developments are larger than differences in export-based competitiveness alone. Second, the contribution of export-based competitiveness in euro-area markets tends to be the smallest in absolute value across the four countries. This is plausibly due to the fact that in euro-area markets the weight of euro-area competitors (including local producers), against which the nominal exchange rate is fixed, is very high, and therefore the resulting indicators are more stable over time than the non-euro area export-based measure, as seen in Fig. 3. Third, in each sub-period non-euro area export markets typically turn out to be the main driver of overall price-competitiveness developments in Italy, France and Germany. Turning to the overall 1999–2018 period, instead, competitiveness in the domestic market and export-based competitiveness in extra-euro area markets are the main drivers of, and contribute roughly equally to, aggregate price-competitiveness developments in Italy and in Germany.
Conclusions
This article develops a novel decomposition of price-competitiveness indicators (PCIs), which enables to correctly disentangle export-based competitiveness developments in euro-area vs. non-euro area markets, as well as those in the domestic market. We implement this decomposition within the set of PCIs computed by the Bank of Italy, which uses domestic-sales manufacturing producer prices as the relevant deflator. According to these new measures and focusing on the four main euro-area countries, whereas Germany’s substantial gain in export-based price competitiveness in the 1999–2018 period is found to be quite balanced between euro and non-euro markets, in France it was relatively larger in euro-area markets. In contrast, Italy’s mild improvement was larger in the non-euro area market, whilst Spain’s deterioration was smaller in euro-area markets. These findings point to the usefulness of considering market breakdowns when analysing price-competitiveness developments, since they can differ significantly across export outlets. Finally, in the overall 1999–2018 period competitiveness in the domestic market and export-based competitiveness in non-euro area markets equally shaped the aggregate competitiveness developments observed in Italy and in Germany.
A note of caution to the analysis here presented is warranted. Bank of Italy’s PCIs are based on one particular price index, yet, as discussed and shown in Fig. A1 in Annex A, it is now common knowledge that competitiveness developments vary significantly according to the price or cost index employed to deflate NEERs or nominal PCIs. In general, therefore, a complete assessment of competitiveness trends should be based on the examination of a set of differently deflated PCIs.
Footnotes
We are grateful to the editor Charles Renfro and to an anonymous referee, as well as to Andrea Brandolini, Justas Dainauskas, Silvia Fabiani, Martin Schmitz, Roberto Tedeschi, Francesco Zollino and all participants of the EER-HCI workshop held at the European Central Bank in January 2019 for comments to previous versions of this article. Any error is the responsibility of the authors. The views here presented are those of the authors, and not of the institution represented. This article is based on the 8th July 2019 Bank of Italy data vintage and on R version 3.3.3 software.
As for the ability of alternative PCIs to explain export dynamics in the four main euro-area countries, see [12]. More recent research has further pointed out that export performance is better understood when considering relative PPIs (or relative unit labour costs) in conjunction with profit margins [ ], so that PCIs alone, however deflated, are insufficient to explain export developments.
On the one hand, enterprises choose ex ante which outlays to penetrate, how much to sell and at what price, according to their pricing strategies and to the strength of demand in the various destination markets (see, for example [16]). On the other hand, not all firms export to all markets, and especially small and less innovative firms typically export only to the closest markets, so as to contain trading costs. For some stylised facts concerning external trade and productivity across EU countries based on micro-aggregated data, see [].
See Annex B for details on the computation of the weights
On average in 2018 the competitiveness gap vis-à-vis Germany stood at 19.4 points in Spain, 8.1 in Italy and 1.9 in France.
Annex A. A comparison of different methods used by selected organizations to calculate PCIs
Updating a similar table in [1], in Table A1 we provide a summary of the different methodologies underlying the computation of overall PCIs across international institutions, as well as details on any available sub-indicators.
Figure A1 provides developments of PCIs of the four largest euro-area countries based on different price and cost indices since 1999.
A comparison of different methods to calculate price-competitiveness indicators
Institution
Trade Basis
Maximum number of trading partners
Weighting methods
Update of weights
Indicators provided
Deflators
References
Bank of Italy
Manufactured goods (SITC 5–8)
60
Weighted average of import and double export weights (including weighted third market effects)
Average weight fixed over three years, updated every ten years
Overall PCIs; import-based and export-based PCIs; euro and non-euro area trade partner-weighted PCIs; euro and non-euro area market export-based PCIs
PPI
This paper and Felettigh et al. (2016), and indicators available at:
European Central Bank
Manufactured goods (SITC 5–8)
58 (CPI only) 38
Weighted average of import and double export weights (including weighted third market effects)
Average weight fixed over three years, updated every three years
Overall PCIs; import-based and export-based PCIs; euro and non-euro area trade partner-weighted PCIs
CPI, PPI, GDP deflator, ULCM, ULCT (PPI and ULCM not publicly available)
Schmitz et al. (2012)
Table A1. continued
Institution
Trade Basis
Maximum number of trading partners
Weighting methods
Update of weights
Indicators provided
Deflators
References
European Commission DG ECFIN
Total goods
41
Double export weights (including weighted third market effects)
Annual weights, updated yearly
Overall PCIs
CPI, GDP deflator, Export prices, ULCM, ULCT
European Commission (2014)
Bank of International Settlements
Manufactured goods (SITC 5–8)
59
Weighted average of import and double export weights (including weighted third market effects)
Average weight fixed over three years, updated every three years
Overall PCIs
CPI
Klau and Fung (2006) and subsequent update available at
International Monetary Fund
Manufactured goods (SITC 5–8)
Manufactured goods (SITC 5–8), commodities (overall weight in global markets), and services (same weights as manufacturing except for countries where tourism is important)
26 163
Weighted average of import and double export weights (including weighted third market effects)
Weighted average of import and double export weights (including weighted third market effects) for manufacturing, simple weights for other categories
Average weight fixed over three years, updated at irregular intervals
Overall PCIs
ULC CPI
Bayoumi et al. (2005)
Table A1. continued
Institution
Trade Basis
Maximum number of trading partners
Weighting methods
Update of weights
Indicators provided
Deflators
References
Federal Reserve Board
Total goods (excluding gold and military items from exports, oil from imports when possible)
25
Fixed weighted average of import and double export weights (including third market effects)
Annual weights, updated yearly
Overall PCIs
CPI
Loretan (2005)
Bank of England
Manufactured goods and services
42
Fixed weighted average of import and double export weights (including third market effects for manufacturing)
Annual weights, updated yearly
Overall PCIs
CPI
Lynch and Whitaker (2004) and subsequent update available at
PCI developments in the four main euro-area countries according to different deflators (indices 1999Q1 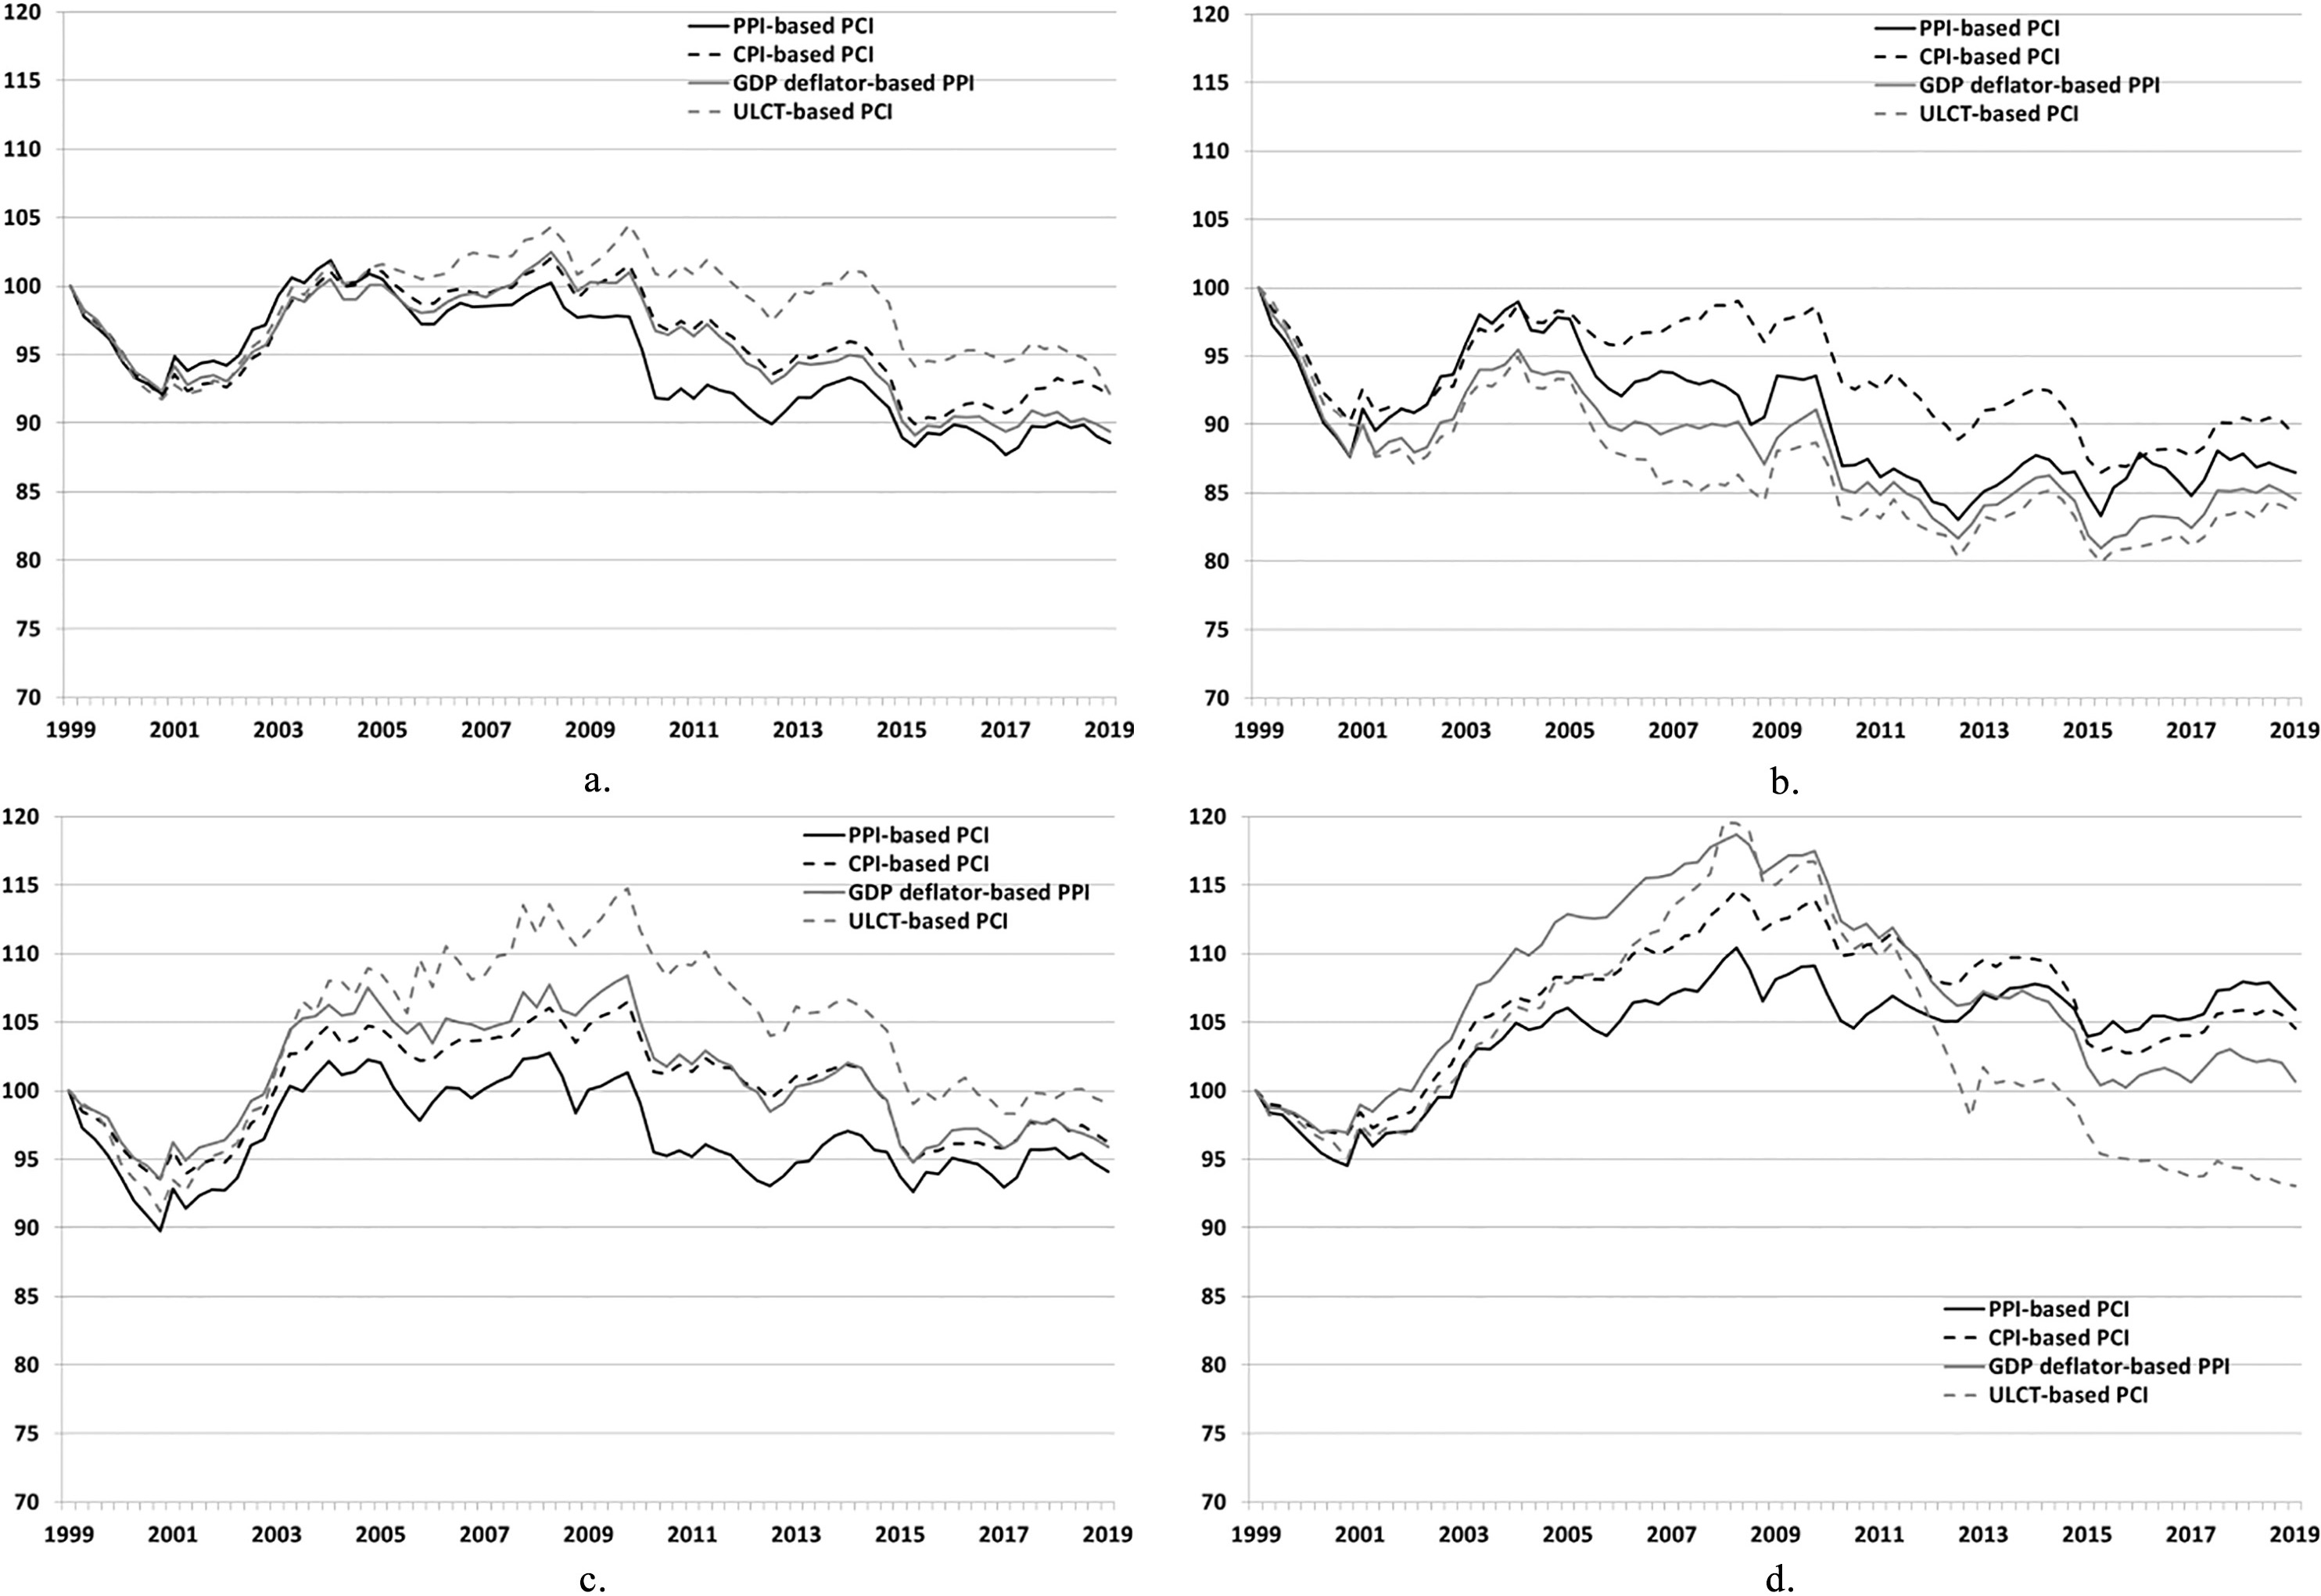
Annex B. Additional information on the Bank of Italy’s PCIs
Concerning the price index employed to deflate Bank of Italy’s PCIs, the following hierarchy of sources for producer price indices (PPIs) is employed: Eurostat/ECB, OECD, IMF (International Financial Statistics) and Datastream. For all OECD countries, and for the most recent years at least, PPIs of manufactured goods sold in domestic markets are used; for all remaining countries and/or previous periods manufacturing, industrial or total PPIs or wholesale price indices (WPIs) are employed,10
Wholesale price indices have a less broad coverage of products and industries than PPIs, and are less conceptually aligned with the system of national accounts [9].
The price indices and sources underlying the Bank of Italy’s 61 PCIs
Country
Deflator
Source
Euro-area
Austria
PPI, domestic sales of manufactures
ECB
countries
Belgium
PPI, domestic sales of manufactures
Eurostat
Cyprus
PPI/PPI, domestic sales of manufactures
IMF/ Eurostat
Estonia
CPI/PPI/PPI, domestic sales of manufactures
IMF/IMF/ Eurostat
Finland
PPI, domestic sales of manufactures
ECB
France
PPI, domestic sales of manufactures
ECB
Germany
PPI, domestic sales of manufactures
ECB
Greece
PPI, domestic sales of manufactures
ECB
Ireland
PPI, domestic sales of manufactures
ECB
Italy
PPI, domestic sales of manufactures
Istat
Latvia
CPI/PPI/PPI, domestic sales of manufactures
IMF/IMF/ Eurostat
Lithuania
CPI/PPI/PPI, domestic sales of manufactures
IMF/IMF/ Eurostat
Malta
CPI/PPI, domestic sales of manufactures
IMF/ Eurostat
Netherlands
PPI, domestic sales of manufactures
ECB
Portugal
PPI, domestic sales of manufactures
Eurostat
Slovakia
PPI, dom. sales of ind. goods /PPI/PPI, dom. sales of manuf.
ECB/Eurostat
Slovenia
PPI, domestic sales of manufactures
ECB
Spain
PPI, domestic sales of manufactures
ECB
Non Euro-area
Bulgaria
CPI/PPI/PPI, domestic sales of manufactures
IMF/IMF/ECB
EU countries
Croatia
CPI/PPI/PPI, domestic sales of manufactures
IMF/IMF/ECB
Czech Republic
PPI, domestic sales of manufactures/
ECB
Denmark
PPI, domestic sales of manufactures
OECD/ECB
Hungary
PPI/PPI, domestic sales of manufactures
IMF/ECB
Poland
PPI/PPI, tot. sales of manuf./PPI, dom. sales of manuf.
IMF/OECD/ECB
Romania
PPI/PPI, domestic sales of manufactures
IMF/ECB
Sweden
PPI/PPI, tot. sales of manuf./PPI, dom. sales of manuf.
IMF/OECD/ECB
United Kingdom
PPI/PPI, domestic sales of manufactures
IMF/OECD
Non EU countries
Algeria
CPI
IMF
Argentina (*)
CPI/PPI/PPI
IMF/IMF/Datastream
Australia (*)
PPI/PPI, total sales of manufactures
IMF/OECD
Brazil
PPI, industry
Central Bank of Brasil
Notes: PPI
Table B1, continued
Country
Deflator
Source
Canada
PPI, total sales of manufactures
OECD
Chile
WPI/PPI, total sales of manufactures
IMF/OECD
China
CPI/PPI/PPI
IMF/National Bureau of Statistics China/IMF
Colombia
PPI/PPI, domestic sales of manufactures
IMF/OECD
Ecuador
WPI/CPI/PPI
IMF/IMF/IMF
Hong Kong SAR (*)
CPI/PPI
IMF/IMF
India
WPI
IMF
Indonesia
WPI/ WPI of total manufactures
IMF/OECD
Israel
WPI/PPI, domestic sales of manufactures
IMF/OECD
Japan
PPI/PPI, domestic sales of manufactures
IMF/OECD
Kuwait
WPI
IMF
Malaysia
CPI/PPI
IMF/IMF
Mexico
PPI/PPI, domestic sales of manufactures
IMF/OECD
Morocco
WPI/CPI/PPI
IMF/IMF/IMF
New Zealand (*)
PPI, domestic sales of manufactures
OECD
Nigeria
CPI
IMF
Norway
PPI, domestic sales of manufactures
OECD
Pakistan
WPI
IMF
Peru
WPI
IMF
Philippines
CPI/PPI
IMF/IMF
Russia
PPI/PPI, domestic sales of manufactures
IMF/OECD
Saudi Arabia
CPI
IMF
Singapore
WPI
IMF
South Africa
PPI, domestic sales of manufactures
OECD
South Korea
PPI, domestic sales of manufactures
OECD
Switzerland
PPI/PPI, domestic sales of manufactures
IMF/OECD
Taiwan
WPI
Datastream
Thailand
PPI
IMF
Turkey
PPI, dom. sales of ind. goods/ PPI, dom. sales of manuf.
OECD/OECD
United States
PPI, total sales of manufactures
OECD
Bank of Italy’s trade weights are based on flows of manufactured goods only, which are less subject to non-market practices, typical of agricultural goods, and to large price volatility, as is the case for raw commodities. Two matrices of fixed weights are used: the first, based on 1999–2001 bilateral trade data for 61 countries and their exports to the residual aggregate “rest of the world”, is employed to calculate PCIs for the January 1992 – December 2004 period; the second matrix, based on 2009–2011 data, is employed for indicators as of January 2005. The two series are then chain-linked in January 2005.11
As a result, whenever the period of interest includes January 2005, PCIs change also due to the switch between the two sets of weights.
The trade weights, as well as
The weight of selected countries in the four largest euro-area economies’ trade baskets
A. 1999–2001
Country
Italy
France
Germany
Spain
Import weights
Double export weights
Overall weights
Import weights
Double export weights
Overall weights
Import weights
Double export weights
Overall weights
Import weights
Double export weights
Overall weights
Bulgaria
0.4
0.2
0.3
0.1
0.1
0.1
0.1
0.1
0.1
0.1
0.1
0.1
Brazil
0.7
1.1
0.9
0.3
1.0
0.6
0.3
1.0
0.7
0.3
1.2
0.7
Canada
0.3
1.2
0.8
0.3
1.2
0.8
0.3
1.2
0.8
0.2
0.7
0.4
Switzerland
3.7
2.6
3.1
2.7
2.7
2.7
4.4
3.1
3.7
1.9
1.7
1.8
Colombia
0.0
0.1
0.1
0.0
0.1
0.1
0.0
0.1
0.1
0.0
0.2
0.1
Denmark
0.5
0.9
0.7
0.6
1.0
0.8
1.7
1.3
1.5
0.6
0.8
0.7
United Kingdom
7.2
7.3
7.3
9.0
9.0
9.0
7.6
8.4
8.1
8.3
8.4
8.3
Hong Kong SAR
1.3
1.3
1.3
1.3
1.4
1.4
1.8
1.4
1.6
1.2
1.1
1.2
Croatia
0.5
0.4
0.4
0.0
0.1
0.1
0.2
0.2
0.2
0.0
0.1
0.1
Hungary
0.9
0.9
0.9
0.6
0.7
0.6
2.5
1.2
1.8
0.4
0.6
0.5
Japan
3.3
4.7
4.1
2.7
4.8
3.7
4.5
5.2
4.9
2.6
3.4
3.0
Morocco
0.2
0.3
0.2
0.8
0.7
0.7
0.1
0.2
0.1
0.4
0.8
0.6
Mexico
0.1
1.0
0.6
0.1
0.9
0.5
0.4
1.2
0.8
0.2
1.2
0.6
Poland
1.1
1.4
1.3
0.6
1.1
0.9
2.5
2.0
2.2
0.4
1.0
0.6
Russia
0.4
1.1
0.8
0.1
0.8
0.5
0.4
1.3
0.9
0.1
0.6
0.3
United States
5.5
12.3
9.3
7.5
12.1
9.8
6.8
13.5
10.6
3.9
8.6
6.0
South Africa
0.3
0.5
0.4
0.1
0.5
0.3
0.5
0.6
0.6
0.2
0.4
0.3
Sum of these countries
26.3
37.3
32.5
27.0
38.1
32.6
34.0
42.2
38.7
20.9
30.8
25.3
Remaining extra-euro area countries
12.6
17.0
15.1
8.9
16.8
12.9
15.3
17.9
16.8
9.5
14.1
11.5
Euro-area countries
61.1
45.7
52.5
64.2
45.1
54.5
50.8
39.9
44.5
69.6
55.1
63.2
Total
Weight of the export-based PCI in the overall PCI (
56.3
57.2
50.7
44.1
Table B2, continued
B. 2009–2011
Country
Italy
France
Germany
Spain
Import weights
Double export weights
Overall weights
Import weights
Double export weights
Overall weights
Import weights
Double export weights
Overall weights
Import weights
Double export weights
Overall weights
Bulgaria
0.6
0.3
0.4
0.2
0.2
0.2
0.3
0.2
0.2
0.1
0.2
0.2
Brazil
0.5
1.3
0.9
0.2
1.1
0.7
0.4
1.2
0.8
0.5
1.3
0.9
Canada
0.2
0.8
0.6
0.4
0.9
0.6
0.3
1.0
0.7
0.2
0.6
0.4
Switzerland
4.1
2.9
3.5
2.9
2.5
2.7
4.3
3.0
3.6
2.7
2.1
2.4
Colombia
0.1
0.2
0.1
0.0
0.2
0.1
0.0
0.1
0.1
0.0
0.2
0.1
Denmark
0.6
0.7
0.6
0.6
0.8
0.7
1.3
1.1
1.2
0.8
0.7
0.7
United Kingdom
3.9
4.8
4.4
4.4
5.7
5.0
4.4
5.8
5.2
5.0
5.3
5.2
Hong Kong SAR
1.2
1.2
1.2
0.9
1.3
1.1
1.4
1.5
1.4
0.9
0.9
0.9
Croatia
0.5
0.4
0.5
0.1
0.1
0.1
0.1
0.2
0.2
0.0
0.1
0.1
Hungary
1.3
1.1
1.2
1.0
1.0
1.0
2.9
1.2
1.9
1.3
0.9
1.1
Japan
1.6
3.3
2.5
1.4
3.7
2.5
2.4
3.8
3.2
1.3
2.3
1.8
Morocco
0.2
0.4
0.3
0.7
0.7
0.7
0.0
0.2
0.1
1.1
1.3
1.2
Mexico
0.2
0.9
0.6
0.1
0.8
0.4
0.4
0.9
0.7
0.2
1.1
0.6
Poland
2.8
2.4
2.5
2.0
2.0
2.0
4.6
3.0
3.7
1.7
1.9
1.8
Russia
1.2
2.3
1.8
0.1
1.8
0.9
0.5
2.7
1.8
0.1
1.1
0.6
United States
3.2
7.8
5.7
3.4
8.2
5.7
4.6
9.0
7.2
3.0
5.8
4.3
South Africa
0.2
0.6
0.4
0.1
0.6
0.4
0.5
0.7
0.6
0.3
0.5
0.4
Sum of these countries
22.2
31.3
27.2
18.4
31.7
24.7
28.3
35.7
32.6
19.2
26.4
22.6
Remaining extra-euro area countries
22.0
27.0
24.7
15.2
27.8
21.2
23.2
29.0
26.6
17.6
22.4
19.8
Euro-area countries
55.8
41.7
48.1
66.4
40.5
54.1
48.5
35.3
40.8
63.2
51.2
57.6
Total
Weight of the export-based PCI in the overall PCI (
54.4
58.6
47.4
46.6