
Abstract
Background:
Cell or tissue specific background may influence the consequences of expressing the Huntington’s disease (HD) mutation. Aggregate formation is known to occur in skeletal muscle, but not heart of the R6/2 fragment HD model.
Objective:
We asked whether aggregate formation and the expression and subcellular localization of huntingtin species was associated with mitochondrial dysfunction.
Methods:
We analyzed levels of soluble HTT and HTT aggregates, as well as important fission and fusion proteins and mitochondrial respiratory chain activities, in quadriceps and heart of the R6/2 N-terminal fragment mouse model (12 weeks, 160±10 CAG repeats).
Results:
Soluble mutant HTT was present in both tissues with expression higher in cytoplasmic/mitochondrial than nuclear fractions. HTT aggregates were only detectable in R6/2 quadriceps, in association with increased levels of the pro-fission factor DRP1 and its phosphorylated active form, and decreased levels of the pro-fusion factor MFN2. In addition, respiratory chain complex activities were decreased. In heart that was without detectable HTT aggregates, we found no evidence for mitochondrial dysfunction.
Conclusion:
Tissue specific factors may exist that protect the R6/2 heart from HTT aggregate formation and mitochondrial pathology.
INTRODUCTION
Huntington’s disease (HD) is a progressive movement disorder with dementia and behavioural abnormalities [1]. HD is caused by a CAG repeat expansion mutation in the huntingtin gene (HTT), encoding for the large huntingtin protein (HTT). Striatal and extra-striatal, e.g., cortical, degeneration and aggregate formation constitutes the neuropathological signature of HD. However, HTT is ubiquitously expressed and there is also evidence indicating that mutant HTT causes a peripheral phenotype, for instance in skeletal muscle [2].
The CAG expansion length explains a substantial proportion of the variability of the age-at-onset of motor signs of HD [3–5]. However, a large portion of variability in age-at-onset remains unexplained and likely results from other factors, both genetic and environmental [6]. Similarly, tissue and cell-type specific backgrounds likely contribute to the differential vulnerability of some cell-types, e.g., striatal neurons, while the mutated gene is expressed ubiquitously. Identifying these factors and their associated biological processes could provide additional targets for therapeutic interventions that may modify disease progression. Naturally occurring variability in genes relevant for fission and fusion significantly influenced motor age-at-onset independent of the CAG repeat expansion [4]. These findings indicate that mutant HTT influences mitochondrial biology. No single role of HTT in mitochondrial function has emerged; however, several lines of evidence in different model systems and human material point towards a role in fission and fusion regulation [7–12], a key element in mitochondrial quality control. Fission and fusion are mainly controlled by pro-fission and pro-fusion proteins. Important factors are the pro-fission dynamin-related protein (DRP1) and the pro-fusion proteins mitofusin 1 (MFN1), mitofusin 2 (MFN2) and optic atrophy 1 (OPA1) [13, 14]. In support of this notion, reducing DRP1 activity in HD models improved the HD phenotype suggesting mitochondrial quality control pathways may be treatment targets for HD disease modification [8]. However, absolute DRP1 protein levels do not necessarily reflect its enzymatic activity. The activity of DRP1 is regulated by a variety of post-translational modifications including phosphorylation, S-nitrosylation, SUMO (small ubiquitin-like modifier)ylation, ubiquitination, and O-GlcNAcylation, in response to diverse cellular stimuli [15, 16]. Phosphorylation at the amino acid residue Ser616 (position in human DRP1) leads to DRP1 activation and mitochondrial fragmentation [17, 18]. Once activated DRP1 is recruited from the cytosol to mitochondria to induce mitochondrial fragmentation [16, 20].
In the present study we investigated the relationship between the expression of mutant HTT, the occurrence of HTT aggregates and mitochondrial biology in skeletal muscle and heart from the R6/2 fragment model. In that model, loss of skeletal muscle mass is a consistent feature [21, 22]. If a differential relationship existed between mutant HTT species and a biological phenotype in skeletal muscle and heart, e.g., mitochondrial dysfunction, this contrast could serve as a model to understand tissue specific factors that protect against or promote an HD phenotype. We expected that mutant HTT is expressed in skeletal muscle and heart and hypothesised that the mitochondrial phenotype differs in the two tissues depending on the HTT protein phenotype, i.e., the nuclear versus cytoplasmic/mitochondrial expression and aggregate formation that has been reported for R6/2 skeletal muscle but not the heart [23–26].
MATERIALS AND METHODS
Animals
R6/2 mice (B6CBATg(HDexon1)62Gpb/1J) and their corresponding wild-type B6CBAF1/J were purchased from Jackson Laboratory. The R6/2 fragment model contains exon 1 with expanded CAG repeats of the human HTT gene [27]. For genotyping and for determination of the CAG repeat length (160±10) DNA was extracted from tail biopsies [27]. Mice at 12 weeks were killed by cervical dislocation, quadriceps and heart were dissected and immediately snap-frozen in liquid nitrogen and stored at – 80°C. For immunohistochemistry tissues were snap-frozen in liquid nitrogen-cooled 2-methylbutane and stored at – 80°C. For electron microscopy 12-week-old mice were perfused with 4% paraformaldehyde and tissues were immediately fixed in 2.5% glutaraldehyde. All work was performed according to local regulations and EU Directive 2010/63/EU.
Antibodies
For western blotting, the following antibodies were used: anti-DRP1 (dynamin-1-like protein, BD 611112) 1:1000 and anti-OPA1 (optic atrophy protein 1, BD 612606) 1:1000 from BD Biosciences. Anti-MFN1 (anti-mitofusin1, ab126575) 1:500, anti-MFN2 (mitofusin-2, ab50838) 1:1000; anti-NDUFA9 (NADH dehydrogenase [ubiquinone] 1 alpha subcomplex subunit 9, ab14713) 1:3000; anti-SDHA (succinate dehydrogenase [ubiquinone] flavoprotein subunit, ab14715) 1:10000; anti-UQCRC2 (cytochrome b-c1 complex subunit 2, ab14745) 1:6000; anti-MTCO1 (cytochrome c oxidase subunit 1, ab14705) 1:6000; anti-ATP5A (ab14748) 1:6000 and anti-citrate synthase (ab129095) 1:1000 from Abcam. For detection of the phosphorylation state anti-Phospho-DRP1 (Ser616) (3455, Cell Signaling) 1:1000 was used. For analysis of HTT aggregates the S829 (1:3000) antibody, kindly provided by Gillian Bates (UCL, UK), was used. As secondary antibodies goat anti-mouse IgG (H + L)-HRP (1:3000, 1706516, Bio-Rad), goat anti-rabbit IgG (H + L)-HRP (1:10000, 111-035-003, Jackson ImmunoResearch) or rabbit anti-goat IgG (H + L)-HRP (1:10000, R21459, Life Technologies) were used.
For immunohistochemistry the S829 antibody (1:400 in PBS, 5% horse serum, 0.05% Tween) and as secondary antibody donkey anti-sheep IgG (H + L) Alexa fluor 488 (1:400 in PBS, A11015, Thermo Fisher) were used.
Total protein extraction, gel electrophoresis, and western blot
These methods were performed as described previously [28]. Tissues (whole quadriceps, whole heart) were lysed using a tissue lyser (Qiagen) in homogenization buffer (320 mM sucrose, 1 mM K+ EDTA, 10 mM Tris/HCl, pH 7.4, 1μg/ml pepstatin, 1μg/ml leupeptin and 1 mM PMSF) followed by repeated centrifugation at 600×g at 4°C. The supernatant was used for protein analysis. For western blot analysis protein samples were denatured in NuPAGE LDL sample buffer (NP0008, Thermo Fisher) and analyzed on 9% Bis-Tris gels in MOPS buffer (50 mM MOPS, 50 mM Tris base, 0.2% SDS (w/v), 0.1 mM EDTA, pH 7.3) followed by western blotting on PVDF membranes in transfer buffer (25 mM bicine, 25 mM Bis-Tris, 1 mM EDTA, 20% methanol (v/v), pH 7.2). Analyses of HTT aggregates were performed on 6% Bis-Tris gels. Assembly of oxidative phosphorylation complexes was analyzed using blue native gel electrophoresis with 4–16% gradient gels as described previously [29]. Protein extractions for analysis of the phosphorylation state were performed in RIPA buffer (10 mM Tris base, 0.1% SDS (w/v), 1% Triton X-100 (v/v), 1% Na-deoxycholate (w/v), 5 mM EDTA, pH 7.4) containing phosphatase inhibitors (PhosSTOP, 04906837001, Sigma-Aldrich). For visualizing the total protein load the membrane was incubated with MemCode, (Pierce Reversible Protein Stain Kit, Rockford, USA) for PVDF membranes or Ponceau solution (2% Ponceau S (w/v), 3% trichloroacetic acid (w/v)) for nitrocellulose membranes (Bio-Rad). Data analysis was performed by densitometric quantification using the ImageQuant TL software (GE Healthcare). For normalization of protein levels or OXPHOS complexes the total protein load was used.
Erenna Singulex SMC immunoassay for mutant HTT detection
The MW1 antibody was developed by Dr. Paul Patterson and is specific for the polyglutamine stretch of HTT [30]. 2B7 antibody generation and characterization were as previously described [31]. The 2B7 antibody binds to the first 17 amino acids of HTT [32]. The 2B7 antibody was conjugated to magnetic particles (MPs), to a final concentration of 25μg/mg of MPs, and the MW1 antibody was labeled to a final concentration of 1μg/μl, using the Erenna capture and detection reagent labeling kits from Merck-Millipore, following the manufacturer’s instructions. Conjugated/labeled antibodies were diluted in Assay Buffer (02-0474-00, Merck-Millipore) to 1:1200 and 1:4000, respectively, prior to performing the assay.
The immunoassay was largely performed as previously described [33]. In brief, mouse tissue samples were pre-diluted in artificial CSF (aCSF) with 1% Tween-20 (v/v) and complete protease inhibitor (11 697 498 001, Roche) to a concentration of 10μg/ml of total protein. Pre-diluted tissue samples and 2B7 antibody coupled to MPs were added to assay buffer containing 6% BSA (w/v), 0.8% Triton X-100 (v/v), 750 mM NaCl and complete protease inhibitor in a 96-conical assay plate (P-96-450V-C, Axygen). The plate was sealed and incubated on a shaker at room temperature for 1 h. Samples were washed on a magnetic rack, using a HydroFlex Microplate 8 Channel Washer (Tecan), in 1x Erenna Wash Buffer (02-0111-03, Merck-Millipore). Afterwards MPs were incubated with MW1 detection antibody for 1 h at room temperature. Samples were again washed in 1x Erenna Wash Buffer on a magnetic rack in a HydroFlex washer. The antibody-antigen complex was transferred to a new 96-conical assay plate to eliminate nonspecific binding events to the plastic. After buffer aspiration the Elution Buffer B (02-0297-00, Merck-Millipore) was added to the plate for 5 min of incubation while shaking. The eluted detection antibody was transferred to a Nunc 384-well analysis plate (264573, Sigma-Aldrich) and neutralized with Buffer D (02-0368-00, Merck-Millipore). The analysis plate was spun down to eliminate foaming and bubble formation, sealed, and subsequently analyzed with the Erenna Immunoassay System (Merck-Millipore).
Subcellular fractionation
For the Singulex assay tissues were lysed as described previously [34] but with buffer conditions suitable for the assay. All steps were performed on ice and at 4°C. 50 mg of tissue was minced using sharp scissors, suspended in 300μl of STM buffer (250 mM sucrose, 50 mM Tris-HCl pH 7.4, 5 mM MgCl2, 1μg/ml pepstatin, 1μg/ml leupeptin and 1 mM PMSF) and homogenized for 1 min at 1000 rpm using a Potter S homogenizer (Sartorius B. Braun). The homogenate was decanted into a 1.5-ml tube, remaining tissue fragments were re-suspended in 300μl of STM buffer and homogenization was repeated. The homogenates were combined, incubated for 30 min on ice and vortexed for 15 s. After taking 40μl of the total lysate (TL) for analysis the homogenate was centrifuged for 15 min at 800×g. The pellet was the nuclear fraction and the supernatant the cytoplasmic/mitochondrial fraction. The pellet was washed in 300–500μl of STM buffer, vortexed for 15 s and centrifuged for 15 min at 500×g. The washing step was repeated and the pellet finally re-suspended in 200–500μl of NET buffer (20 mM Hepes pH 7.9, 1.5 mM MgCl2, 0.5 M NaCl, 0.2 mM EDTA, 1% Triton X-100 (v/v), 1μg/ml pepstatin, 1μg/ml leupeptin and 1 mM PMSF). The nuclear fraction was lysed by sonification, centrifuged at 9,000×g for 30 min and the resultant supernatant was the final nuclear fraction (NF). The cytoplasmic/mitochondrial fraction was centrifuged at 800×g for 10 min to remove cell debris and the supernatant was the final cytoplasmic/mitochondrial fraction (CM). For subcellular fractionation into cytoplasmic and mitochondrial fractions, the cytoplasmic/mitochondrial fraction was further purified as described [34].
Electron microscopy
Two ultra-thin sections from different areas were used for electron microscopy. For quadriceps tissue the sections were prepared in longitudinal orientation to the fiber. Images of ultra-thin sections per sample were taken with a Jeol 1400 Transmission Electron Microscope (JEOL GmBH). For the heart, the samples were taken from the left ventricle. For quantification five images per sample of n = 10 animals for quadriceps tissue and n≥5 animals for heart tissue at×12,000 magnification were used. Images were exported to a tablet-PC (iPad2, Apple) and the mitochondrial area and number were evaluated using the Glow Draw application (The Othernet, LLC © Daniel Cota), followed by quantification using ImageJ software (ImageJ 1.46r, Wayne Rasband, National Institutes of Health, USA). The median of individual results from each of the five images was calculated for the mitochondrial area and number [35]. Data acquisition and all analyses were done blinded to the genotype.
Immunohistochemistry
Quadriceps sections were cut in transverse orientation to the fiber direction at 10μm. Sections were fixed for 10 min in acetone, washed with PBS followed by drying for 1 h at room temperature. The following procedures were performed in a humidified chamber: sections were blocked in blocking solution (5% goat serum (v/v) in PBS) for 45 min followed by incubation overnight at 4°C with the primary antibody. Sections were washed with PBS-T (0.05% Tween (v/v) in PBS) and incubated with the secondary antibody for 1 h in the dark at room temperature. Sections were embedded in Citifluor AF1 (R1320, Agar Scientific) containing DAPI (5μg/ml, DAPI dilactate, D3571, Life Technologies).
mRNA isolation and quantitative real-time PCR
mRNA was isolated with the RNeasyPlus Mini Kit (74134, Qiagen) and 2μg of RNA was reverse-transcribed into cDNA with the iScript cDNA synthesis kit (Bio-Rad). Quantitative real-time PCR (qPCR) was performed in a 96 well plate using SYBR® green supermix with the CFX384 Touch Real-Time PCR Detection Systems (Bio-Rad) as previously described [28, 35]. For each gene qPCR reactions of all samples were measured on the same plate in triplicates including water as negative control and a standard curve (mixture of all samples used on this plate) to determine the specific primer efficiencies. Primer sequences are listed in Supplementary Table 3. For gene expression analysis in muscle samples Poldip3 (polymerase (DNA-directed), delta interacting protein 3) and Metap1 (methionylaminopeptidase 1) were used as reference genes (R6/2 muscle: mean CV 0.17 and mean M Value 0.49), and Sdha (Succinate dehydrogenase [ubiquinone] flavoprotein subunit) and Metap1 for heart samples (mean CV 0.16 and mean M Value 0.46). The reference genes were selected according to Hellemans and colleagues [36] with homogenous stable cDNA level mean CV < 0.25 and mean M value < 0.5. Data were analyzed with the Bio-Rad CFX manager software (Bio-Rad). For each gene the normalized expression (ΔΔCt) was calculated using the relative quantity ΔCt and the quantities of the reference genes as normalization factor. ΔCt was calculated using the following formula: ΔCt (GOI,sample) = EGOICt (min) –Ct (sample) for GOI = gene of interest, E = primer efficiency, Ct (min) = Ct for the sample with the lowest Ct for GOI and Ct (sample) = Ct for the sample. As cut-off for significance alpha = 0.05 was used.
Mitochondrial DNA copy number
The DNA was isolated with Puregene Core Kit A (Qiagen) as instructed by the manufacturer. The mitochondrial DNA copy number was determined with quantitative real-time PCR with the CFX384 Touch Real-Time PCR Detection Systems (Bio-Rad) as previously described [28]. The mitochondrial DNA copy number was calculated relative to the nuclear DNA using the formula: 2(CtnDNA - CtmtDNA) [37]. For detection of the mtDNA the D-loop region was used. As reference B2 m (beta-2-microglobulin) encoded on the nuclear DNA was used [38–40]. Primer sequences are listed in Supplementary Table 4.
Enzyme activity assays
Tissue lysates were prepared as described previously [28]. Briefly, extractions were performed in homogenization buffer (320 mM sucrose, 1 mM K+ EDTA, 10 mM Tris/HCl, pH 7.4, 1μg/ml pepstatin, 1μg/ml leupeptin and 1 mM PMSF) using a tissue lyser (Quiagen) at 4°C. After centrifugation (600×g, 10 min at 4°C) the supernatant was used.
Measurements of the activity of the respiratory chain subunits and of citrate synthase were performed as described previously [28, 41–44].
ATP assay
The amount of ATP was determined by using the ATP assay kit from Abcam (ab83555, abcam) as instructed by the manufacturer. The amount of ATP was calculated according to standard concentrations.
Data and statistical analysis
All data were evaluated blinded to the samples’ genotype. Statistical analysis was performed using GraphPad Prism (version 5.00 for Windows, GraphPad Software, San Diego California USA). We used animals of both sexes and examined the data for protein levels. We did not observe significant differences between the sexes (data not shown) thus we pooled all data for further data analyses. Data with samples size n < 4 were shown as means±SEM for biological replicates (number of animals) or means±SD for technical replicates. Data with samples size n≥4 (number of animals) were represented as box plots with whiskers showing the minimum and maximum value of all the data. Data in Tables 1 and 2 were shown as means±SEM. Analysis of two groups was done with an unpaired t-test or with a Welch’s unequal variances t-test.
mRNA level of mitochondrial pro-fission and pro-fusion genes in quadriceps and heart tissue of transgenic and wt animals. As reference genes Poldip3 and Metap1 for quadriceps and Sdha and Metap1 for heart samples were used
a) Unpaired t-test, b) Welch’s unequal variances t-test.
Analysis of mitochondrial mass in quadriceps and heart tissue of transgenic and wt animals. As mitochondrial mass marker the activity of citrate synthase, mtDNA copy number, Tfam mRNA and protein levels were used
a) Unpaired t-test, b) Welch’s unequal variances t-test.
RESULTS
Soluble mutant HTT is present in heart and quadriceps, while aggregates are only detectable in quadriceps
We first examined whether soluble mutant HTT was expressed. Using the antibody combination 2B7/MW1 with the Singulex assay [31, 45] there was clear evidence of soluble mutant HTT expression in total lysates of transgenic (tg) quadriceps (Fig. 1A), and tg heart muscle (Fig. 1D). We then investigated the distribution of total soluble mutant HTT in different cellular compartments. To this end we analyzed an enriched nuclear (NF) and cytoplasmic/mitochondrial fraction (CM) from quadriceps of tg mice (Fig. 1B), and tg heart (Fig. 1E). The cytoplasmic/mitochondrial fractions contained no detectable histone H3, a nuclear protein. The nuclear fractions were clearly enriched and contained no detectable GAPDH, a cytosolic protein, while some mitochondrial content remained since NDUFA9, a mitochondrial protein, was detectable at low levels. In tg quadriceps (Fig. 1C) the cytoplasmic/mitochondrial fraction clearly contained more soluble mutant HTT than the nuclear fraction (tg P < 0.0001). In tg heart mutant HTT was only detectable in the cytoplasmic/mitochondrial fraction with western blot using the 1C2 antibody that binds to polyQ repeats [27, 46] (Fig. 1F).
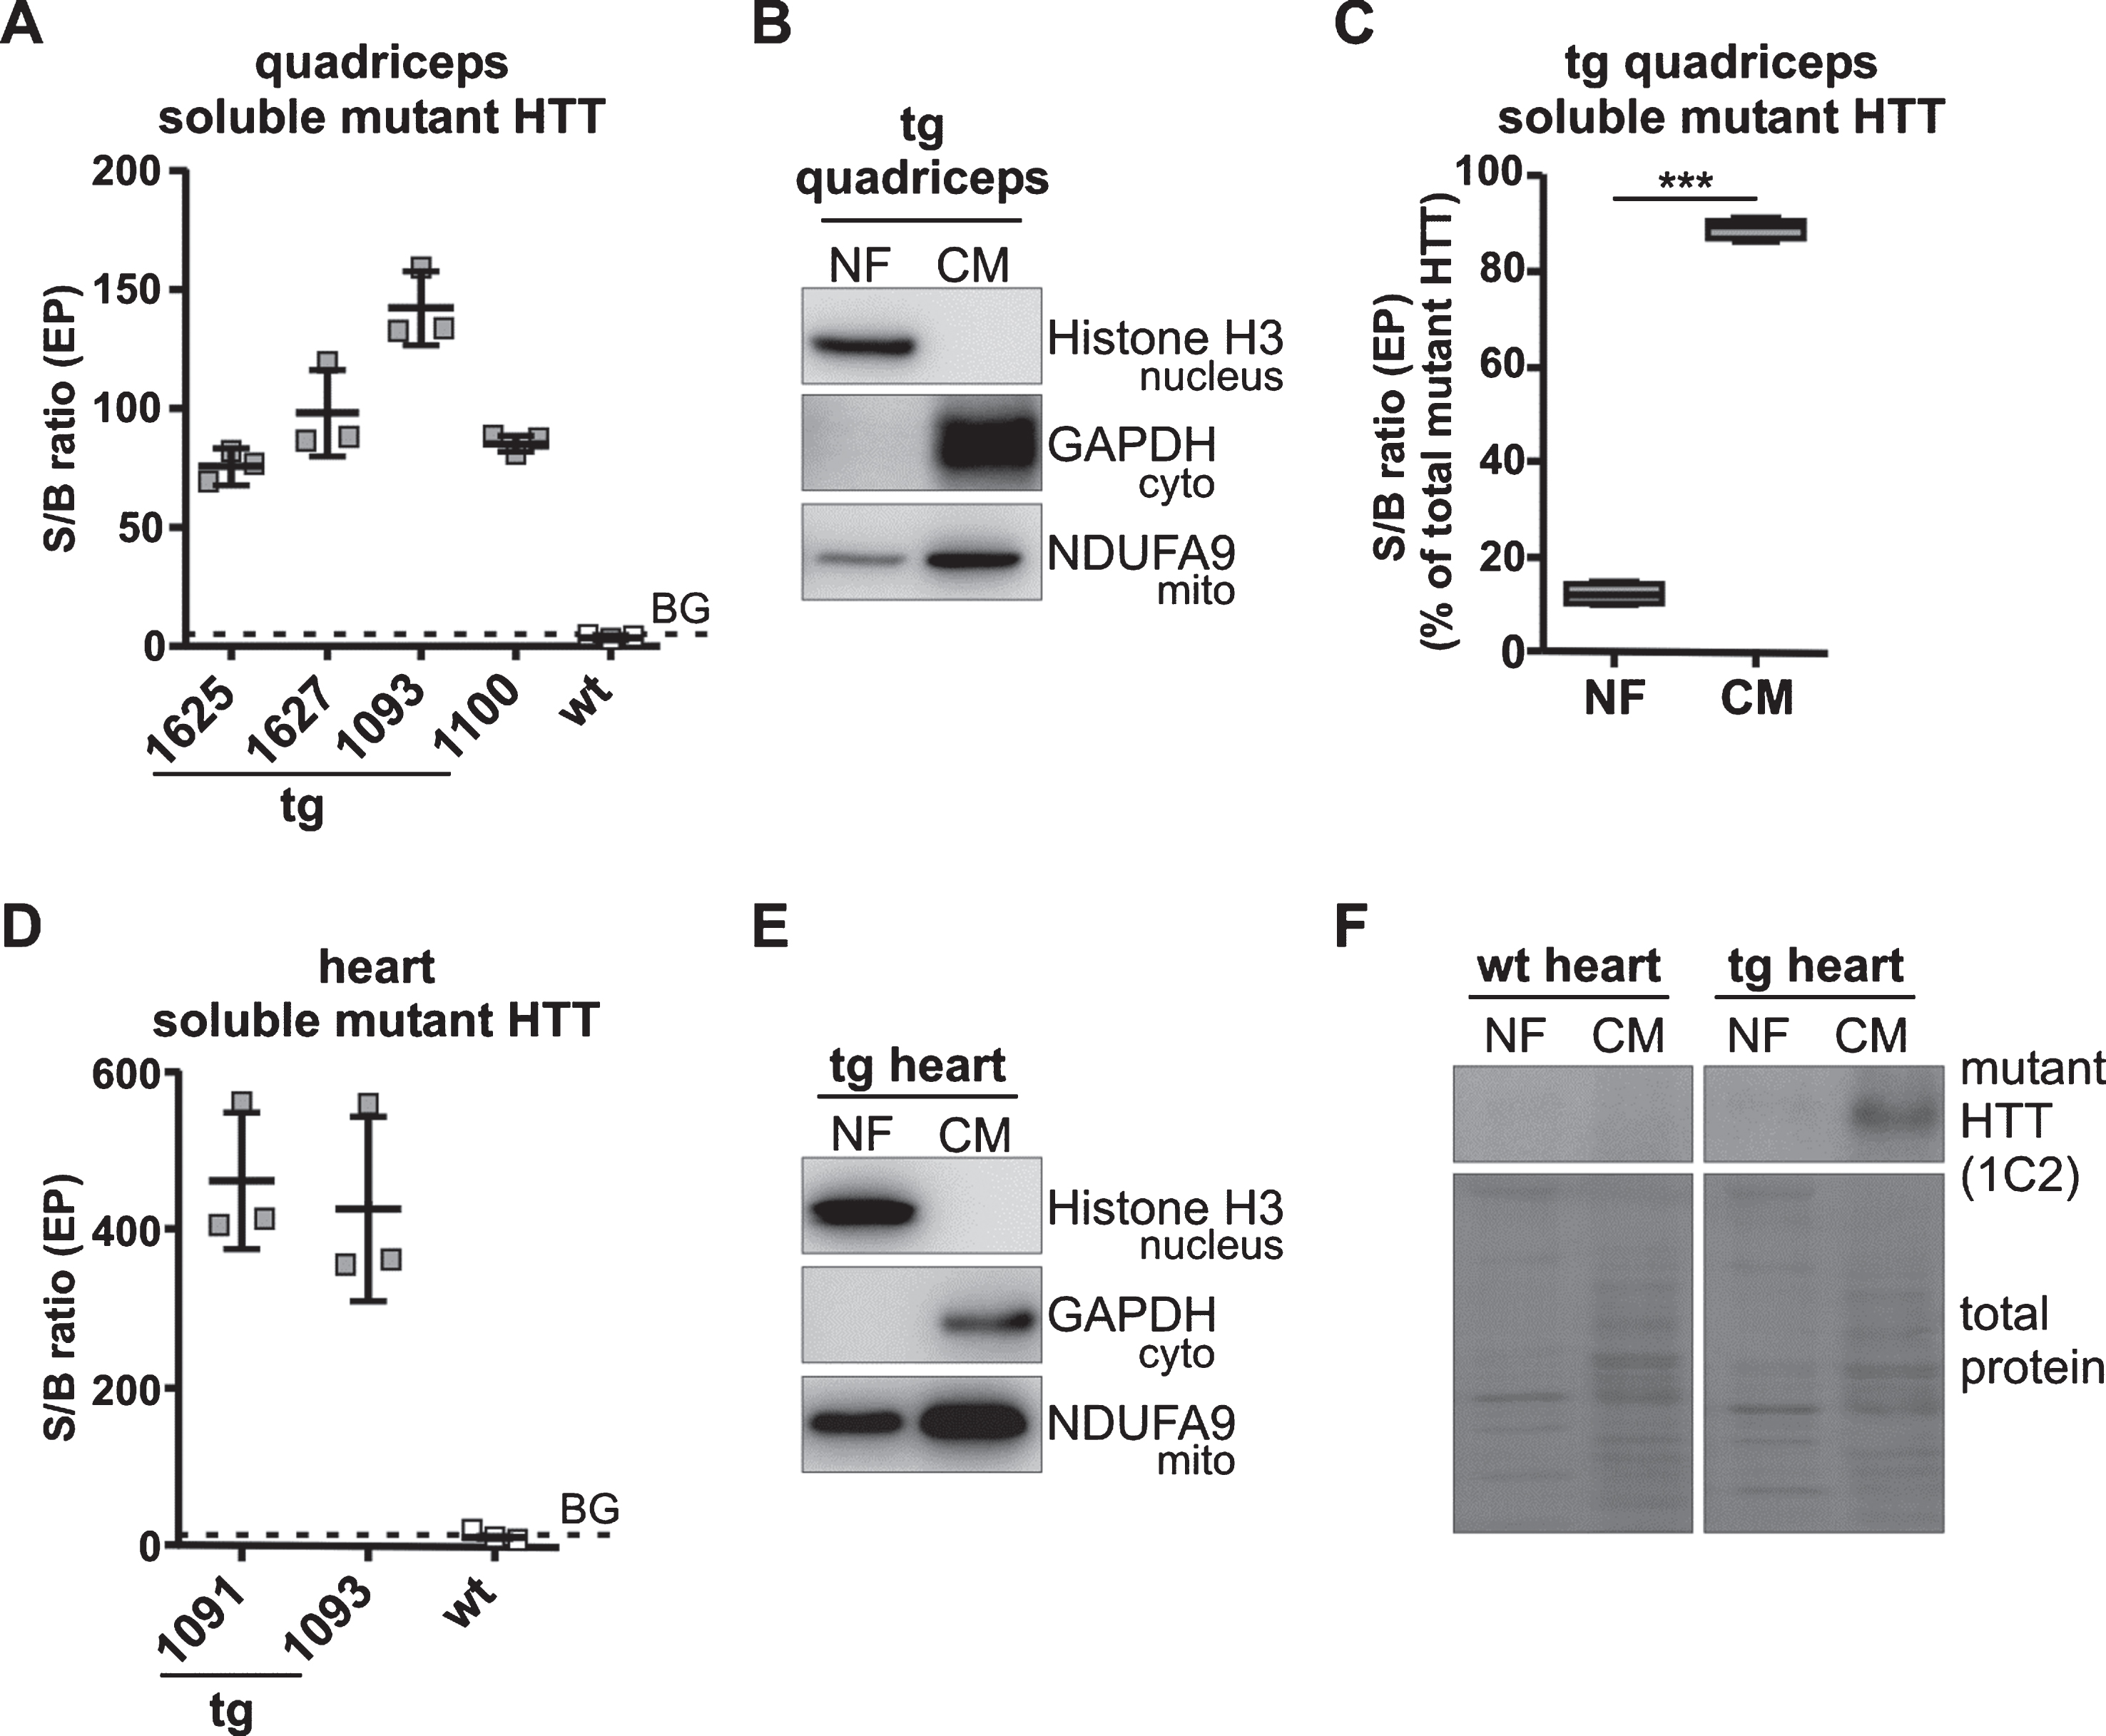
Soluble mutant HTT is detectable in quadriceps and heart of 12-week-old R6/2 mice. A) Soluble mutant HTT was detected in tg quadriceps using the Singulex assay. Data are presented as scatter plot with means±SD from N = 3 technical replicates. Because they were technical replicates data were evaluated without statistical analysis. B) Representative western blots of subcellular fractionations of tg quadriceps shows highly enriched nuclear and cytoplasmic/mitochondrial fractions. Purity of the fractions was analyzed by histone H3 (nuclear protein, 17 kDa), GAPDH (cytosolic protein, 40 kDa) and NDUFA9 (mitochondrial protein, 40 kDa). C) In tg quadriceps soluble mutant HTT was detected mainly in the cytoplasmic/mitochondrial fraction. For analysis of subcellular fractions the Singulex assay was used. Data are presented as box plots with whiskers from minimum to maximum from n = 4 animals. Statistical test: t-test, ***P < 0.0001. D) Soluble mutant HTT was detected in tg heart using the Singulex assay. Data are presented as scatter plot with means±SD from N = 3 technical replicates. Because they were technical replicates data were evaluated without statistical analysis. E) Representative western blots of subcellular fractionations of tg heart shows highly enriched nuclear and cytoplasmic/mitochondrial fractions. Purity of the fractions was analyzed using the same antibodies as in B). F) In tg heart soluble mutant HTT was detected exclusively in the cytoplasmic/mitochondrial fraction at a molecular weight of >95 kDa. Western blots of subcellular fractions oftg or wt heartwere analyzed using the 1C2 antibody which detects polyQ repeats. As loading control the full-length membrane is shown with total protein load. The total protein load was determined by staining the membrane with Ponceau S solution. Antibody characterization and full-length blots are shown in Supplementary Figure 3. wt, wild-type mice; tg, transgenic mice; NF, nuclear fraction; CM, cytoplasmic/mitochondrial fraction; BG, background; S/B ratio, signal to background ratio; EP, event photons.
The formation of HTT aggregates is a hallmark event in the pathogenesis of HD. We next examined whether HTT aggregates were detectable in quadriceps and heart muscle of tg mice. To this end we used two different methods, immunohistochemistry and western blot. We used the S829 antibody, which was raised against the N-terminal exon 1 HTT protein and was shown to detect aggregates in R6/2 mice [23, 47]. In quadriceps of tg mice aggregates were detectable on western blot (Fig. 2A) and also by confocal microscopy on tissue sections (Fig. 2B, D; Supplementary Figure 2). We then investigated the fractions enriched for nuclear or cytoplasmic/mitochondrial content. This revealed that aggregates were present in quadriceps of tg mice with levels much higher in the nuclear fraction than in the cytoplasmic/mitochondrial fraction (Fig. 2C). 3D analysis of a section using confocal microscopy with z-stacking also demonstrated aggregates predominantly near the nucleus but very often aggregates appeared in close vicinity to nuclei rather than within them (Fig. 2D).
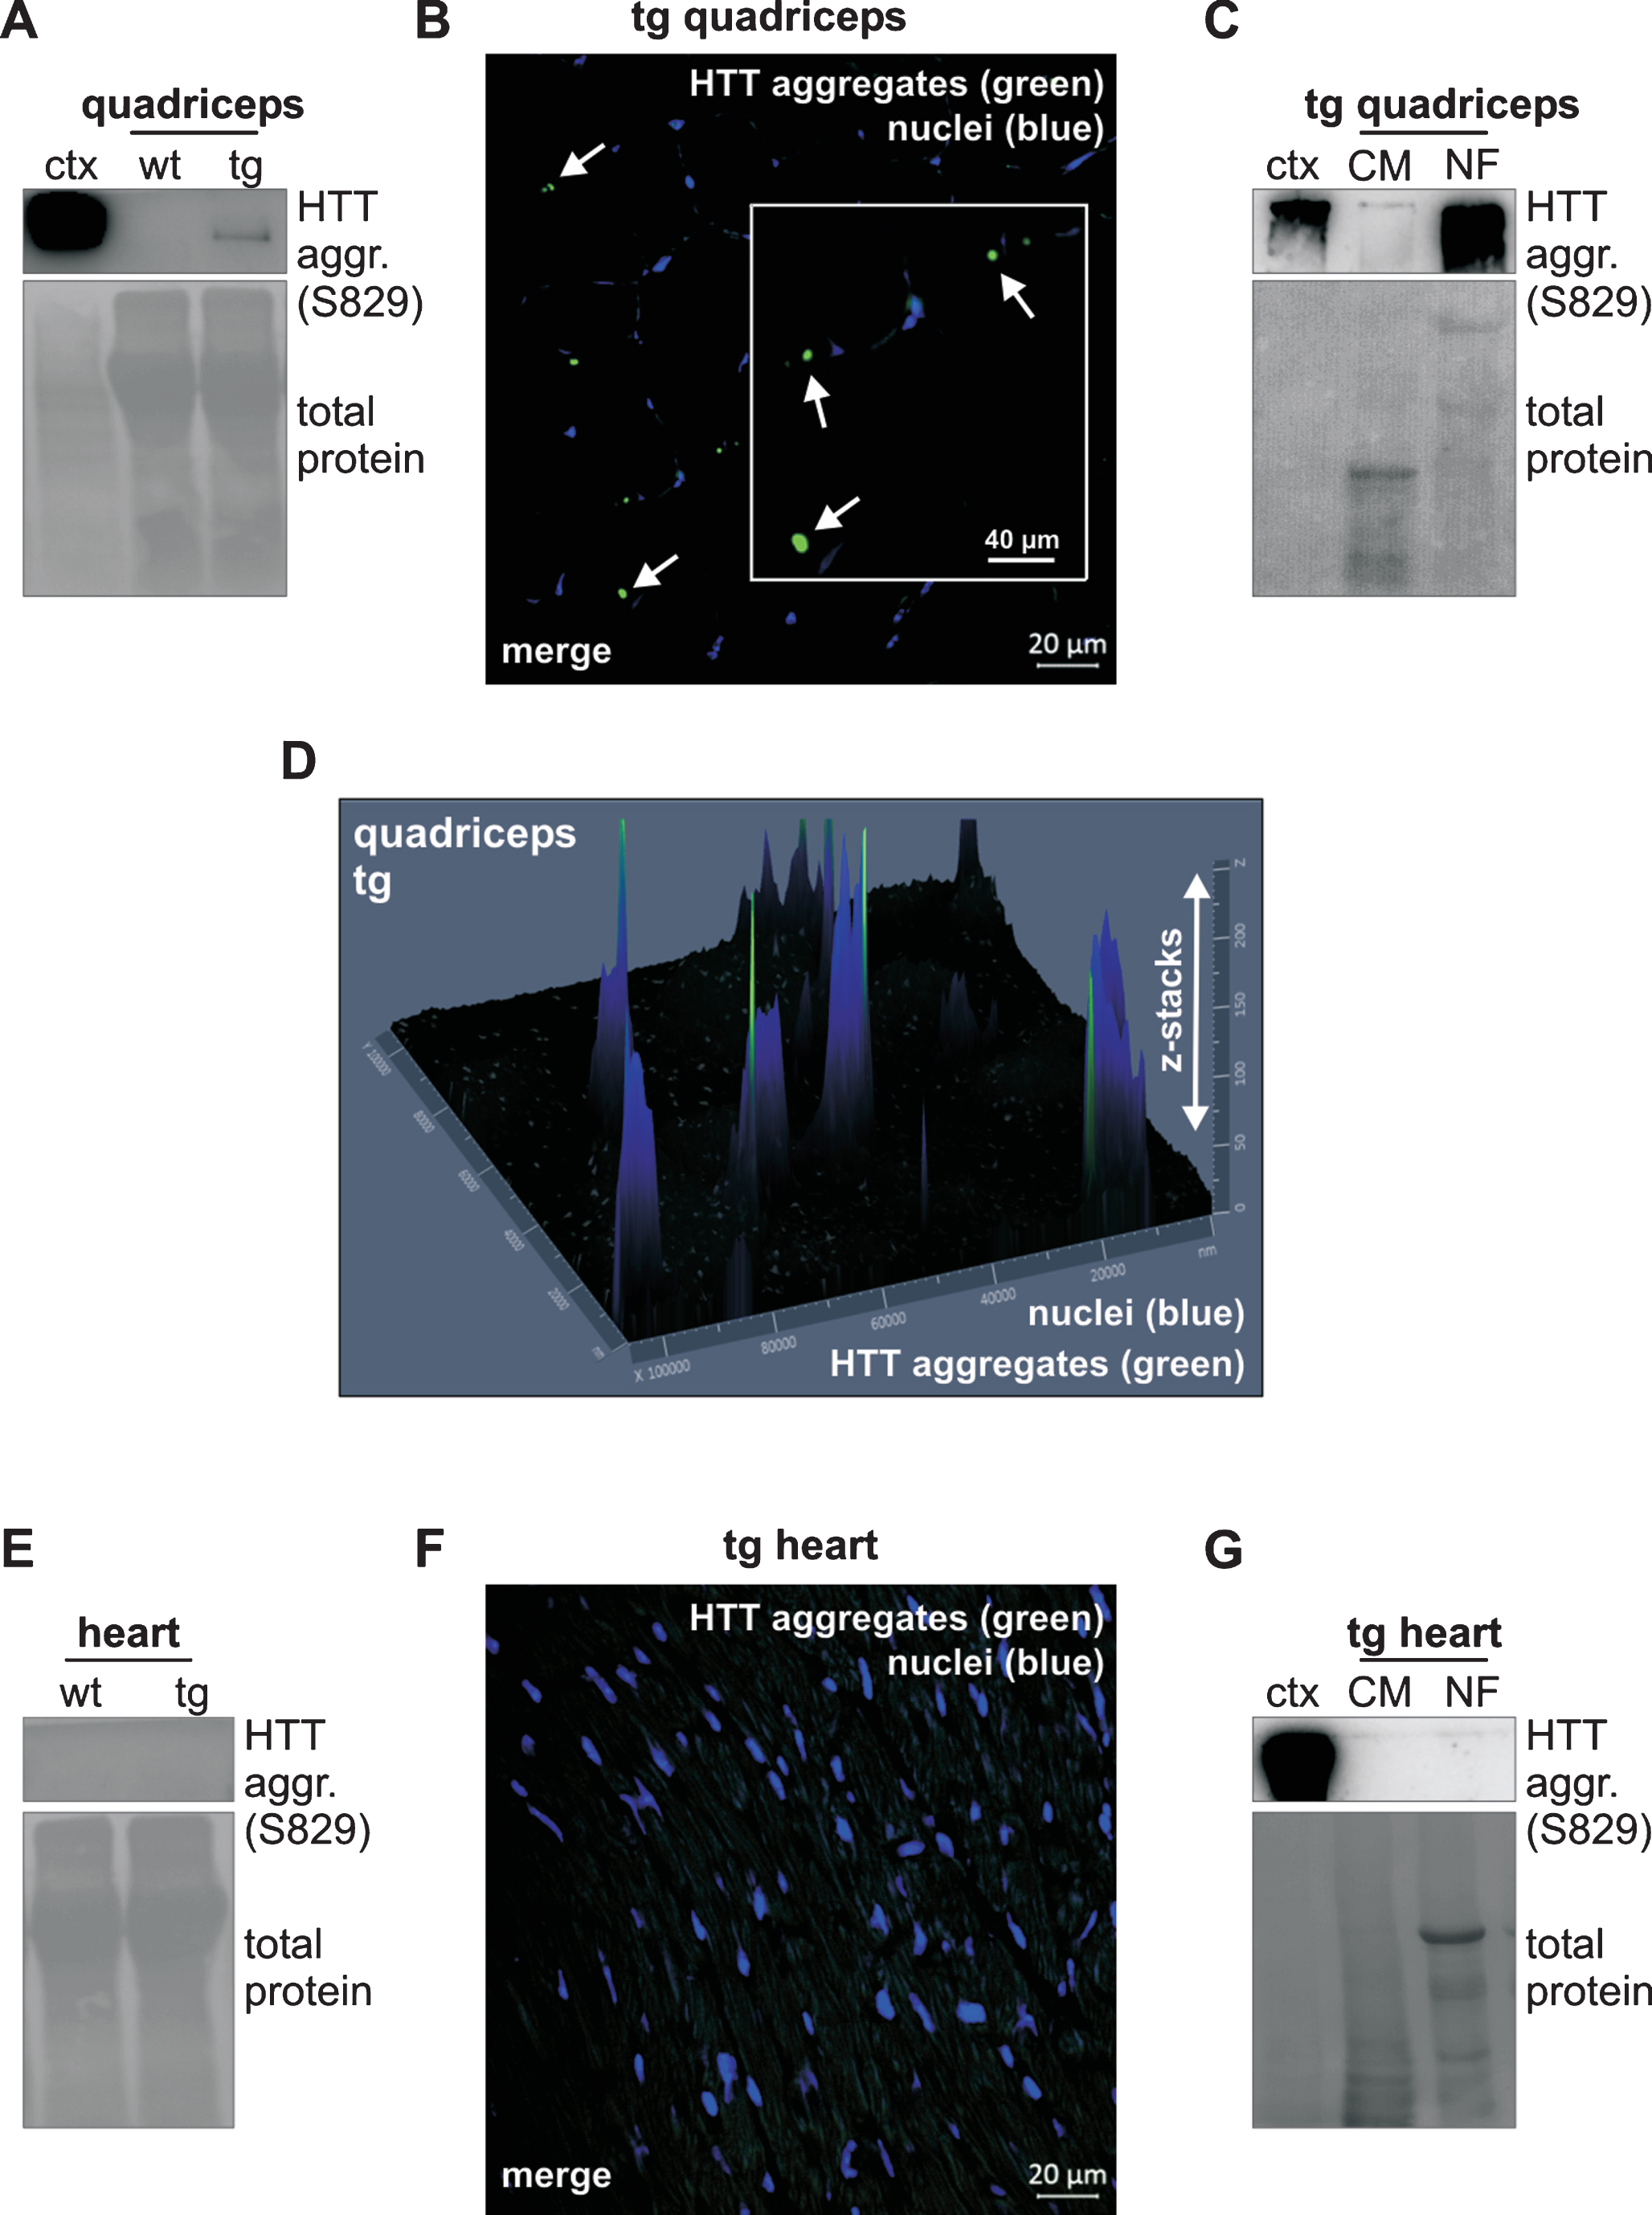
HTT aggregates are detectable only in quadriceps of 12-week-old R6/2 mice. A) Western blots of quadriceps lysates analyzing HTT aggregates using the S829 antibody show HTT aggregates in tg mice. HTT aggregates were detected in the stacking gel. Cortex lysates of tg mice were used as antibody control. As loading control the full-length membrane is shown with total protein load. The total protein load was determined by staining the membrane with Ponceau S solution. B) Immunohistochemistry of quadriceps tissue sections shows HTT aggregates in tg mice. HTT aggregates were detected with the S829 antibody. Primary antibodies were detected with Alexa 488 nm conjugated secondary antibodies and nuclei were detected with DAPI. HTT aggregates are indicated by arrows. C) Western blots of subcellular fractionations shows HTT aggregates mainly in the nuclear fraction of tg quadriceps.HTT aggregates were detected with the S829 antibody. As loading control the full-length membrane is shown with total protein load. The total protein load was determined by staining the membrane with Ponceau S solution. Cortex lysates of tg mice were used as antibody control. D) 3D analysis of an immunohistochemical section of tg quadriceps using confocal microscopy with z-stacking demonstrates aggregates in close vicinity to nuclei rather than within them. E) Western blots of heart lysates analyzing HTT aggregates using the S829 antibody show no HTT aggregates in tg mice. As loading control the full-length membrane is shown with total protein load. The total protein load was determined by staining the membrane with Ponceau S solution. F) Immunohistochemistry of tg heart tissue sections done as in B) shows no HTT aggregates. G) Western blots of subcellular fractionations in tg heart detects no HTT aggregates. HTT aggregates were analyzed using the S829 antibody. As loading control the full-length membrane is shown with total protein load. The total protein load was determined by staining the membrane with Ponceau S solution. Cortex lysates of tg mice were used as antibody control. Antibody characterization and full-length blots are shown in Supplementary Figure 3. wt, wild-type mice; tg, transgenic mice; aggr., aggregates; ctx, cortex tissue lysates of tg mice; NF, nuclear fraction; CM, cytoplasmic/mitochondrial fraction.
In heart total lysates of tg mice (Fig. 2E, F; Supplementary Figure 2), HTT aggregates were not evident using western blot or confocal microscopy. Furthermore, aggregates were not detectable in the enriched nuclear or the cytoplasmic/mitochondrial fractions in heart of tg mice (Fig. 2G).
Fission and fusion protein imbalance is only observed in quadriceps of R6/2 mice
Mitochondria form a dynamic network that undergoes fission and fusion to remain functional in the context of environmental and metabolic stress. We investigated protein levels of DRP1, OPA1, MFN1 and MFN2 in quadriceps and heart of R6/2 and wt mice. DRP1 protein levels were significantly increased in tg quadriceps (P < 0.01; Fig. 3A, B), whereas MFN2 protein levels were decreased compared to wild-type (wt) mice (P < 0.01). OPA1 and MFN1 protein levels were similar in tg and wt mice. In contrast to quadriceps, in heart fission and fusion protein levels were similar in tg and wt mice (Fig. 3C, D).
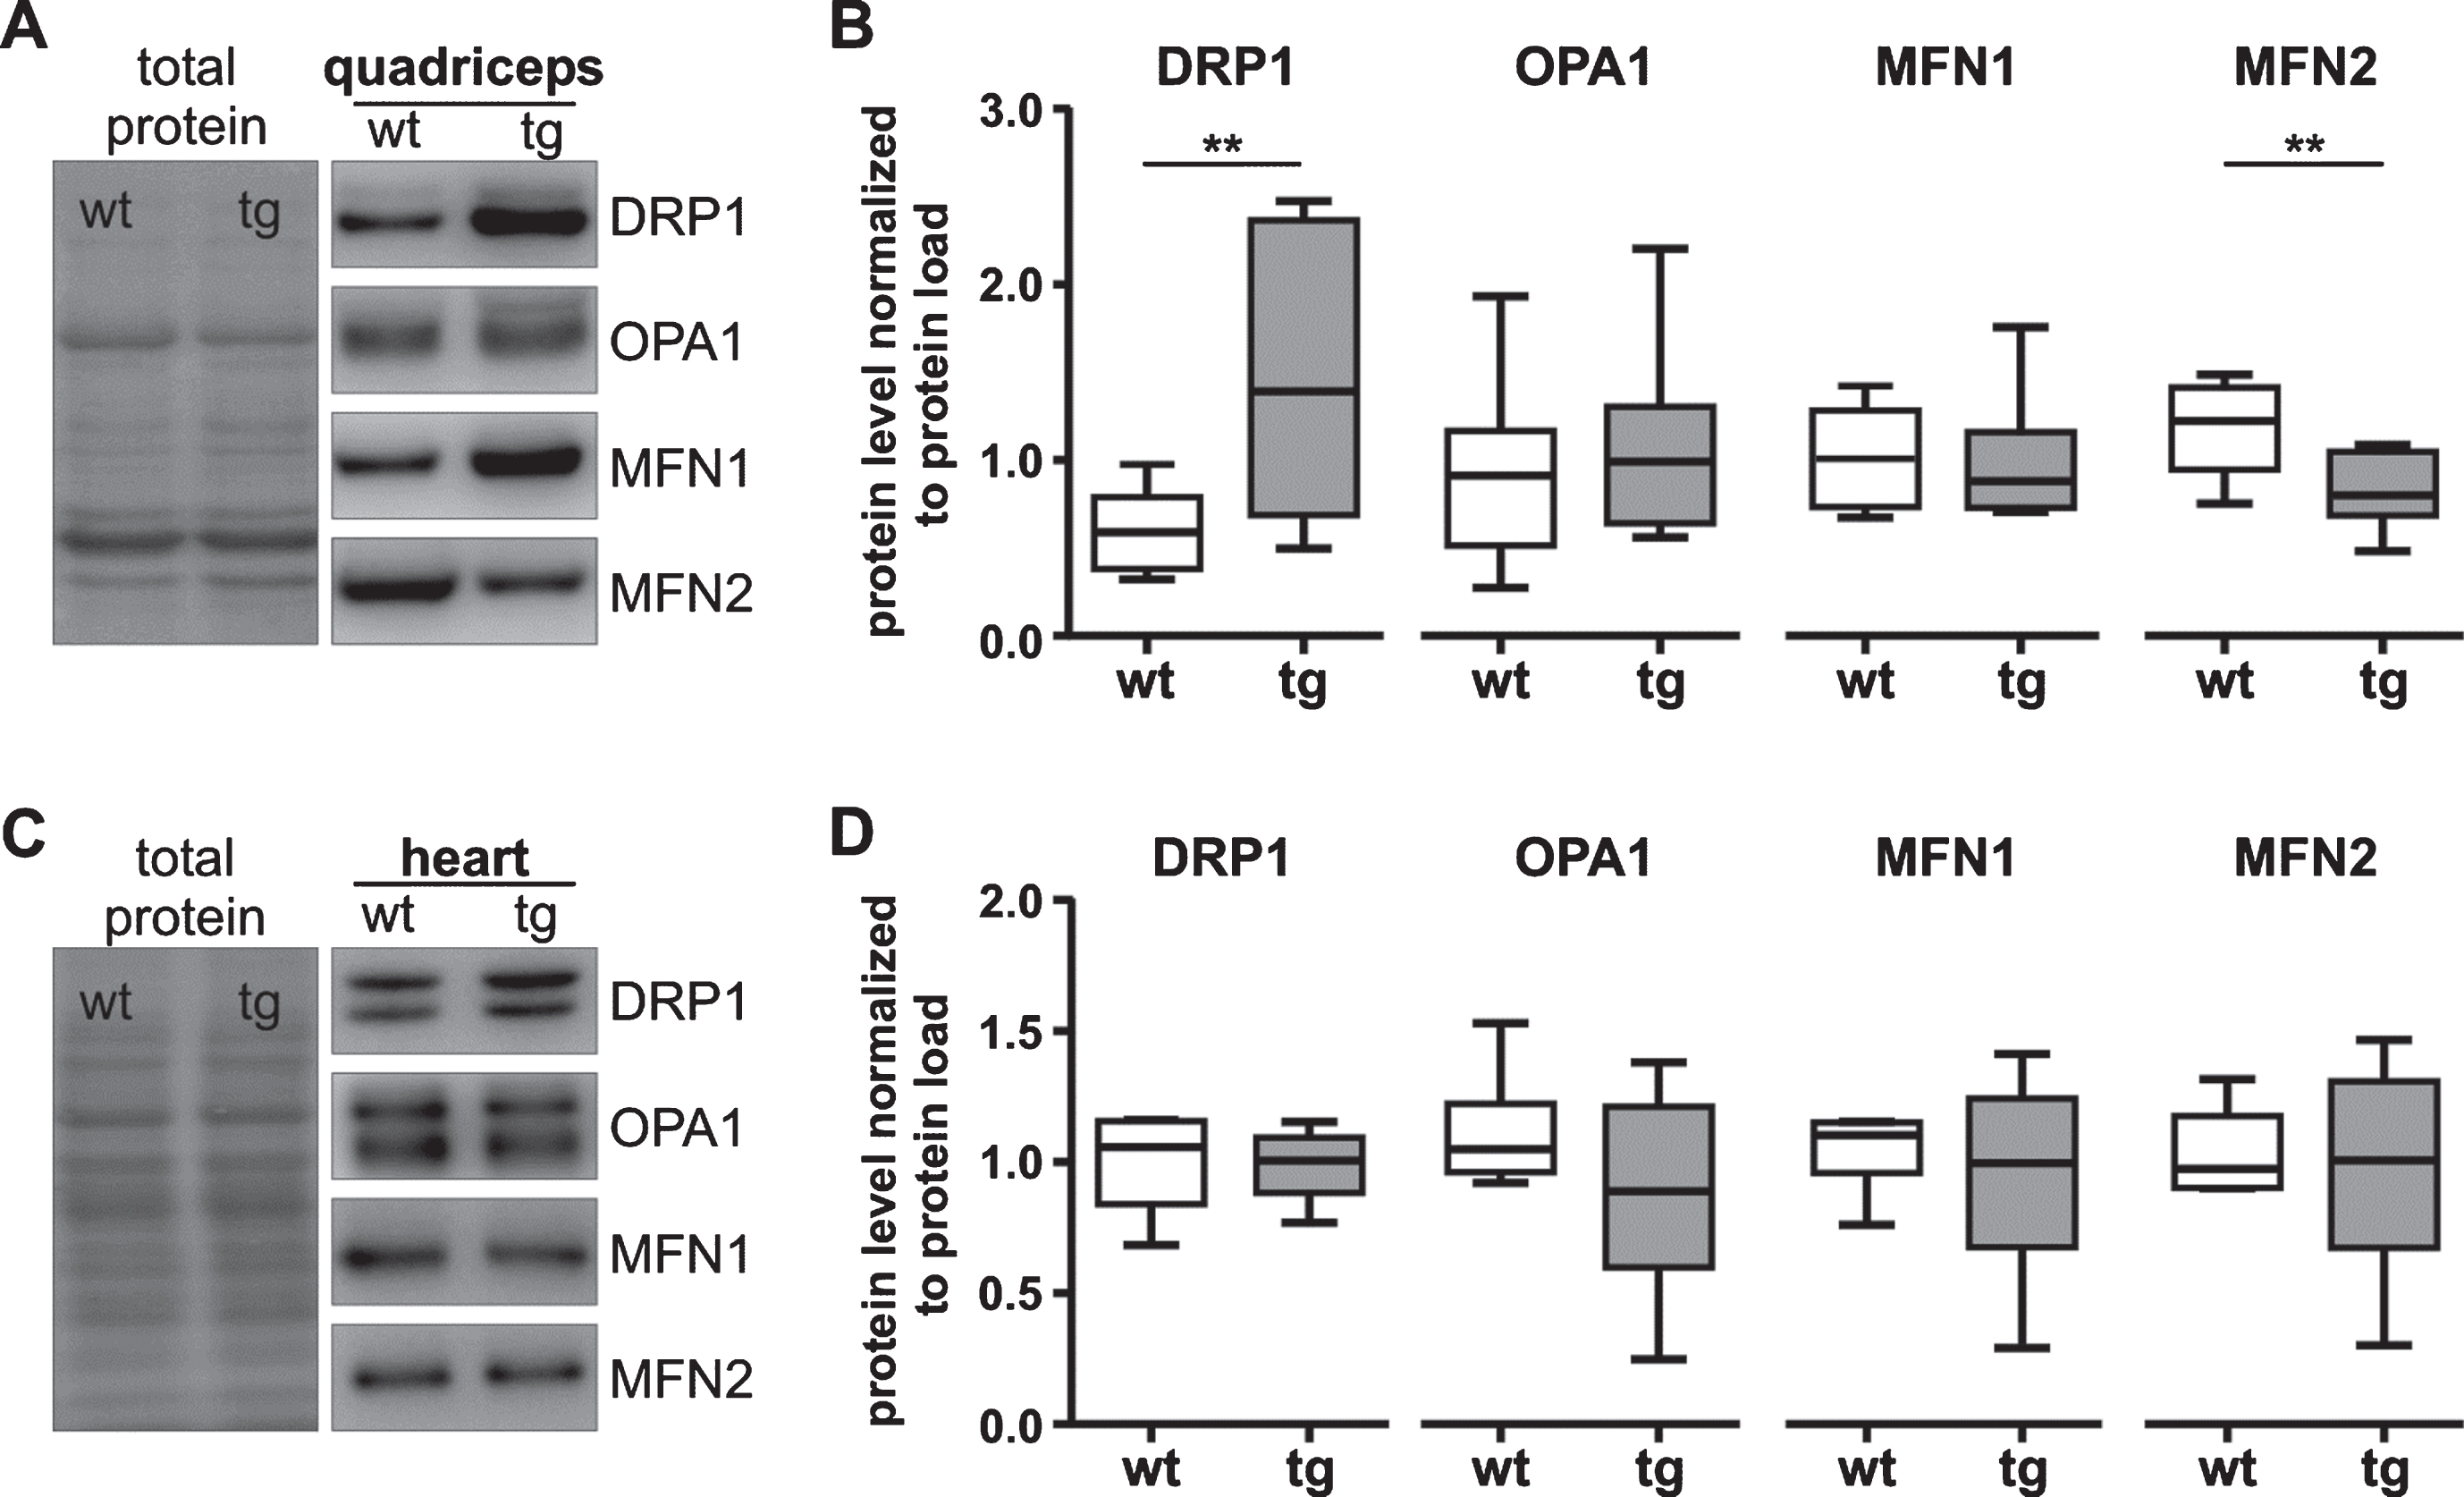
Fission and fusion protein levels are imbalanced only in quadriceps of 12-week-old R6/2 mice. A-D) Representative western blots (A, C) and quantification (B, D) of fission (DRP1, 79–84 kDa) and fusion (OPA1, 80–100 kDa; MFN1, 84kDa; MFN2, 86 kDa) proteins in quadriceps (A, B) or heart (C, D) of tg or wt mice. As loading control the full-length membrane is shown with total protein load. A, C). The total protein load was determined by staining the membrane with MemCode. For quantification protein levels were normalized to total protein load. Data are presented as box plots with whiskers from minimum to maximum from n≥9 animals (composed of n≥4 male and n≥4 female mice per genotype, B) or n = 6 animals (composed of n = 3 male and n = 3 female mice per genotype, D). Statistical test: t-test or Welch’s unequal variances t-test (for DRP1 quadriceps), **P < 0.001. Antibody characterization and full-length blots are shown in Supplementary Figure 4. wt, wild-type mice; tg, transgenic mice.
At the mRNA level, compared to wt, levels of Dmn1l and Mfn1 were significantly increased in tg quadriceps (Dmn1l P < 0.01; Mfn1 P < 0.01), while Opa1 mRNA level were decreased (P < 0.0001; Table 1). In tg heart Opa1 transcripts were decreased (P < 0.05). The poor correlation of mRNA levels to protein levels can be presumably explained by post-transcriptional mechanisms involved in conversion of mRNA to protein, which are not well defined. In addition proteins may differ substantially in their in vivo half-life [48].
Active phosphorylated DRP1 is increased only in quadriceps of R6/2 mice
Absolute DRP1 protein levels do not necessarily reflect its enzymatic activity. We next examined the amount of active DRP1 by using an antibody, which detects active phosphorylated DRP1 (p-DRP1). To confirm the specificity of the antibody we first treated HEK293 cells with the protonophor CCCP (carbonyl cyanide m-chlorophenyl hydrazone) to induce fission [49]. We detected an increase of p-DRP1, whereas absolute DRP1 level remained similar (Supplementary Figure 1), indicating that an increase in p-DRP1 signal reflects the increase of DRP1 enzymatic activity induced by CCCP.
In lysates of tg quadriceps we observed increased p-DRP1 levels (P < 0.01) and an increased p-DRP1/DRP1 ratio compared to wt mice (P < 0.05) indicating that active DRP1 levels were elevated (Fig. 4A, B). We then performed subcellular fractionations for evaluating the distribution of DRP1 between the cytosolic and the mitochondrial compartment. DRP1 levels were higher in the quadriceps mitochondrial fractions of tg mice (69±7%) than those of wt (31±10%; Fig. 4C, D). In heart of tg mice levels of p-DRP1 were non-significantly lower (P = 0.07) in whole tissue lysates compared with wt; however, the p-DRP1/DRP1 ratio was similar in tg and wt hearts (Fig. 4E, F). In the mitochondrial fraction amounts of DRP1 were low with 8% in wt and 5% in tg hearts (Fig. 4G, H). In summary, higher levels of active DRP1 than in controls were only evident in tg quadriceps. In heart tissue, the active DRP1/total DRP1 ratio was similar to controls.
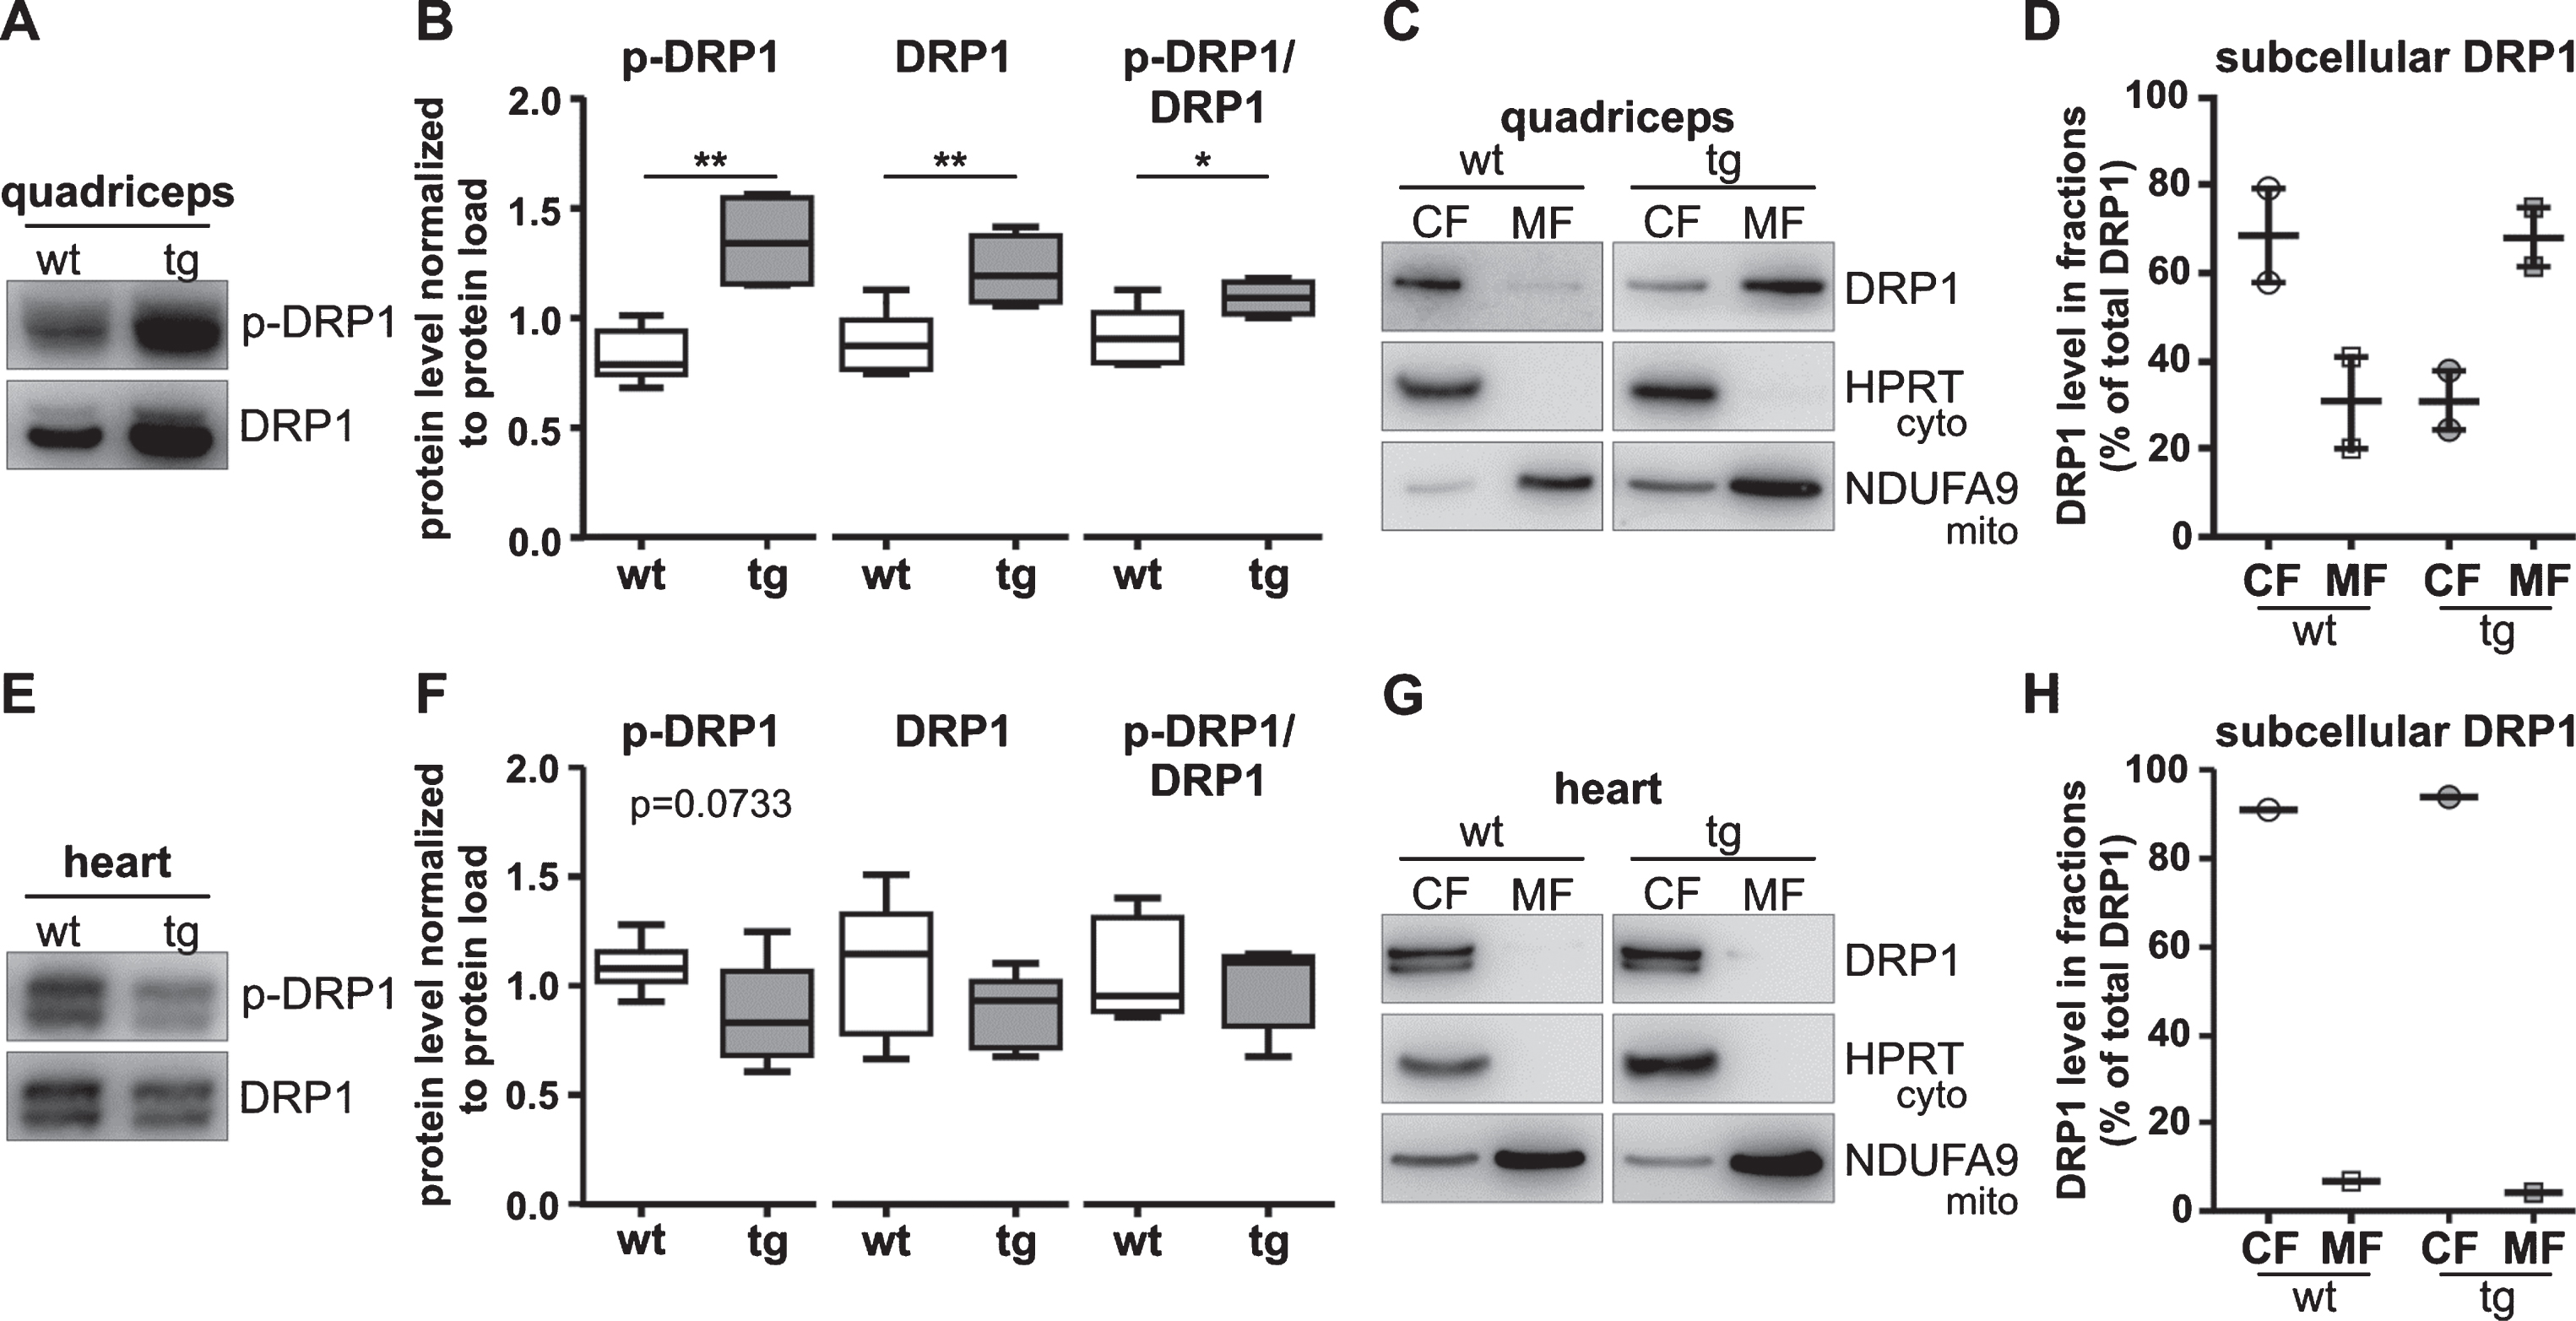
Active DRP1 levels are increased only in quadriceps of 12–week-old R6/2 mice. A, B) Representative western blots (A) and quantification (B) of quadriceps using the p-DRP1 (DRP1-Ser616) and DRP1 antibody show increased p-DRP1 in tg mice. Protein levels were normalized to total protein load or a ratio of p-DRP1 to DRP1 was calculated. Data are presented as box plots with whiskers from minimum to maximum from n≥4 animals (composed of n≥2 male and n≥2 female mice per genotype). Statistical test: t-test, *P < 0.05, **P < 0.001. C, D) Representative western blots (C) and quantification (D) of subcellular fractions of quadriceps show increased levels of DRP1 in mitochondrial fractions of tg mice. HPRT (25 kDa) was used as cytosolic and NDUFA9 (40 kDa) as mitochondrial marker.DRP1 level in fractions were calculated relative to the total DRP1 amount. Data are presented as scatter plot with means±SEM from n = 2 male animals per genotype. Due to low sample number data were evaluated without statistical analysis. E, F) Representative western blots (E) and quantification (F) of heart using the p-DRP1 (DRP1-Ser616) and DRP1 antibody show no significant difference in p-DRP1 level. Protein levels were normalized to total protein load or a ratio of p-DRP1 to DRP1 was calculated. Data are presented as box plots with whiskers from minimum to maximum from n≥5 animals (composed of n≥3 male and n≥2 female mice per genotype). Statistical test: t-test, P≤0.1 is indicated by the corresponding P-value. G, H) Western blots (G) and quantification (H) of subcellular fractions of heart using same antibodies as in C) show no increased DRP1 level in the mitochondrial fraction of tg mice. Data are presented from n = 1 male animal and were evaluated without statistical analysis. Antibody characterization and full-length blots are shown in Supplementary Figures 1, 3, and 4. wt, wild-type mice; tg, transgenic mice; CF, cytoplasmic fraction; MF, mitochondrial fraction.
Mitochondrial mass
Changes in the balance of mitochondrial pro-fission (p-DRP1/total DRP1) and pro-fusion factors (MFN1, MFN2, OPA1) can lead to abnormal mitochondrial network shape. We used electron microscopy to examine ultra-structural mitochondrial morphology and to analyze the size and number of mitochondria. We did not observe differences in cristae morphology in tg quadriceps or heart compared to wt (Fig. 5A, D). After quantification, we observed a non-significant increase in the amount of mitochondria in tg quadriceps (P = 0.07), whereas the size was similar to wt tissue (Fig. 5A-C). Mitochondrial size and number in heart tg mice were similar to controls (Fig. 5D-F).
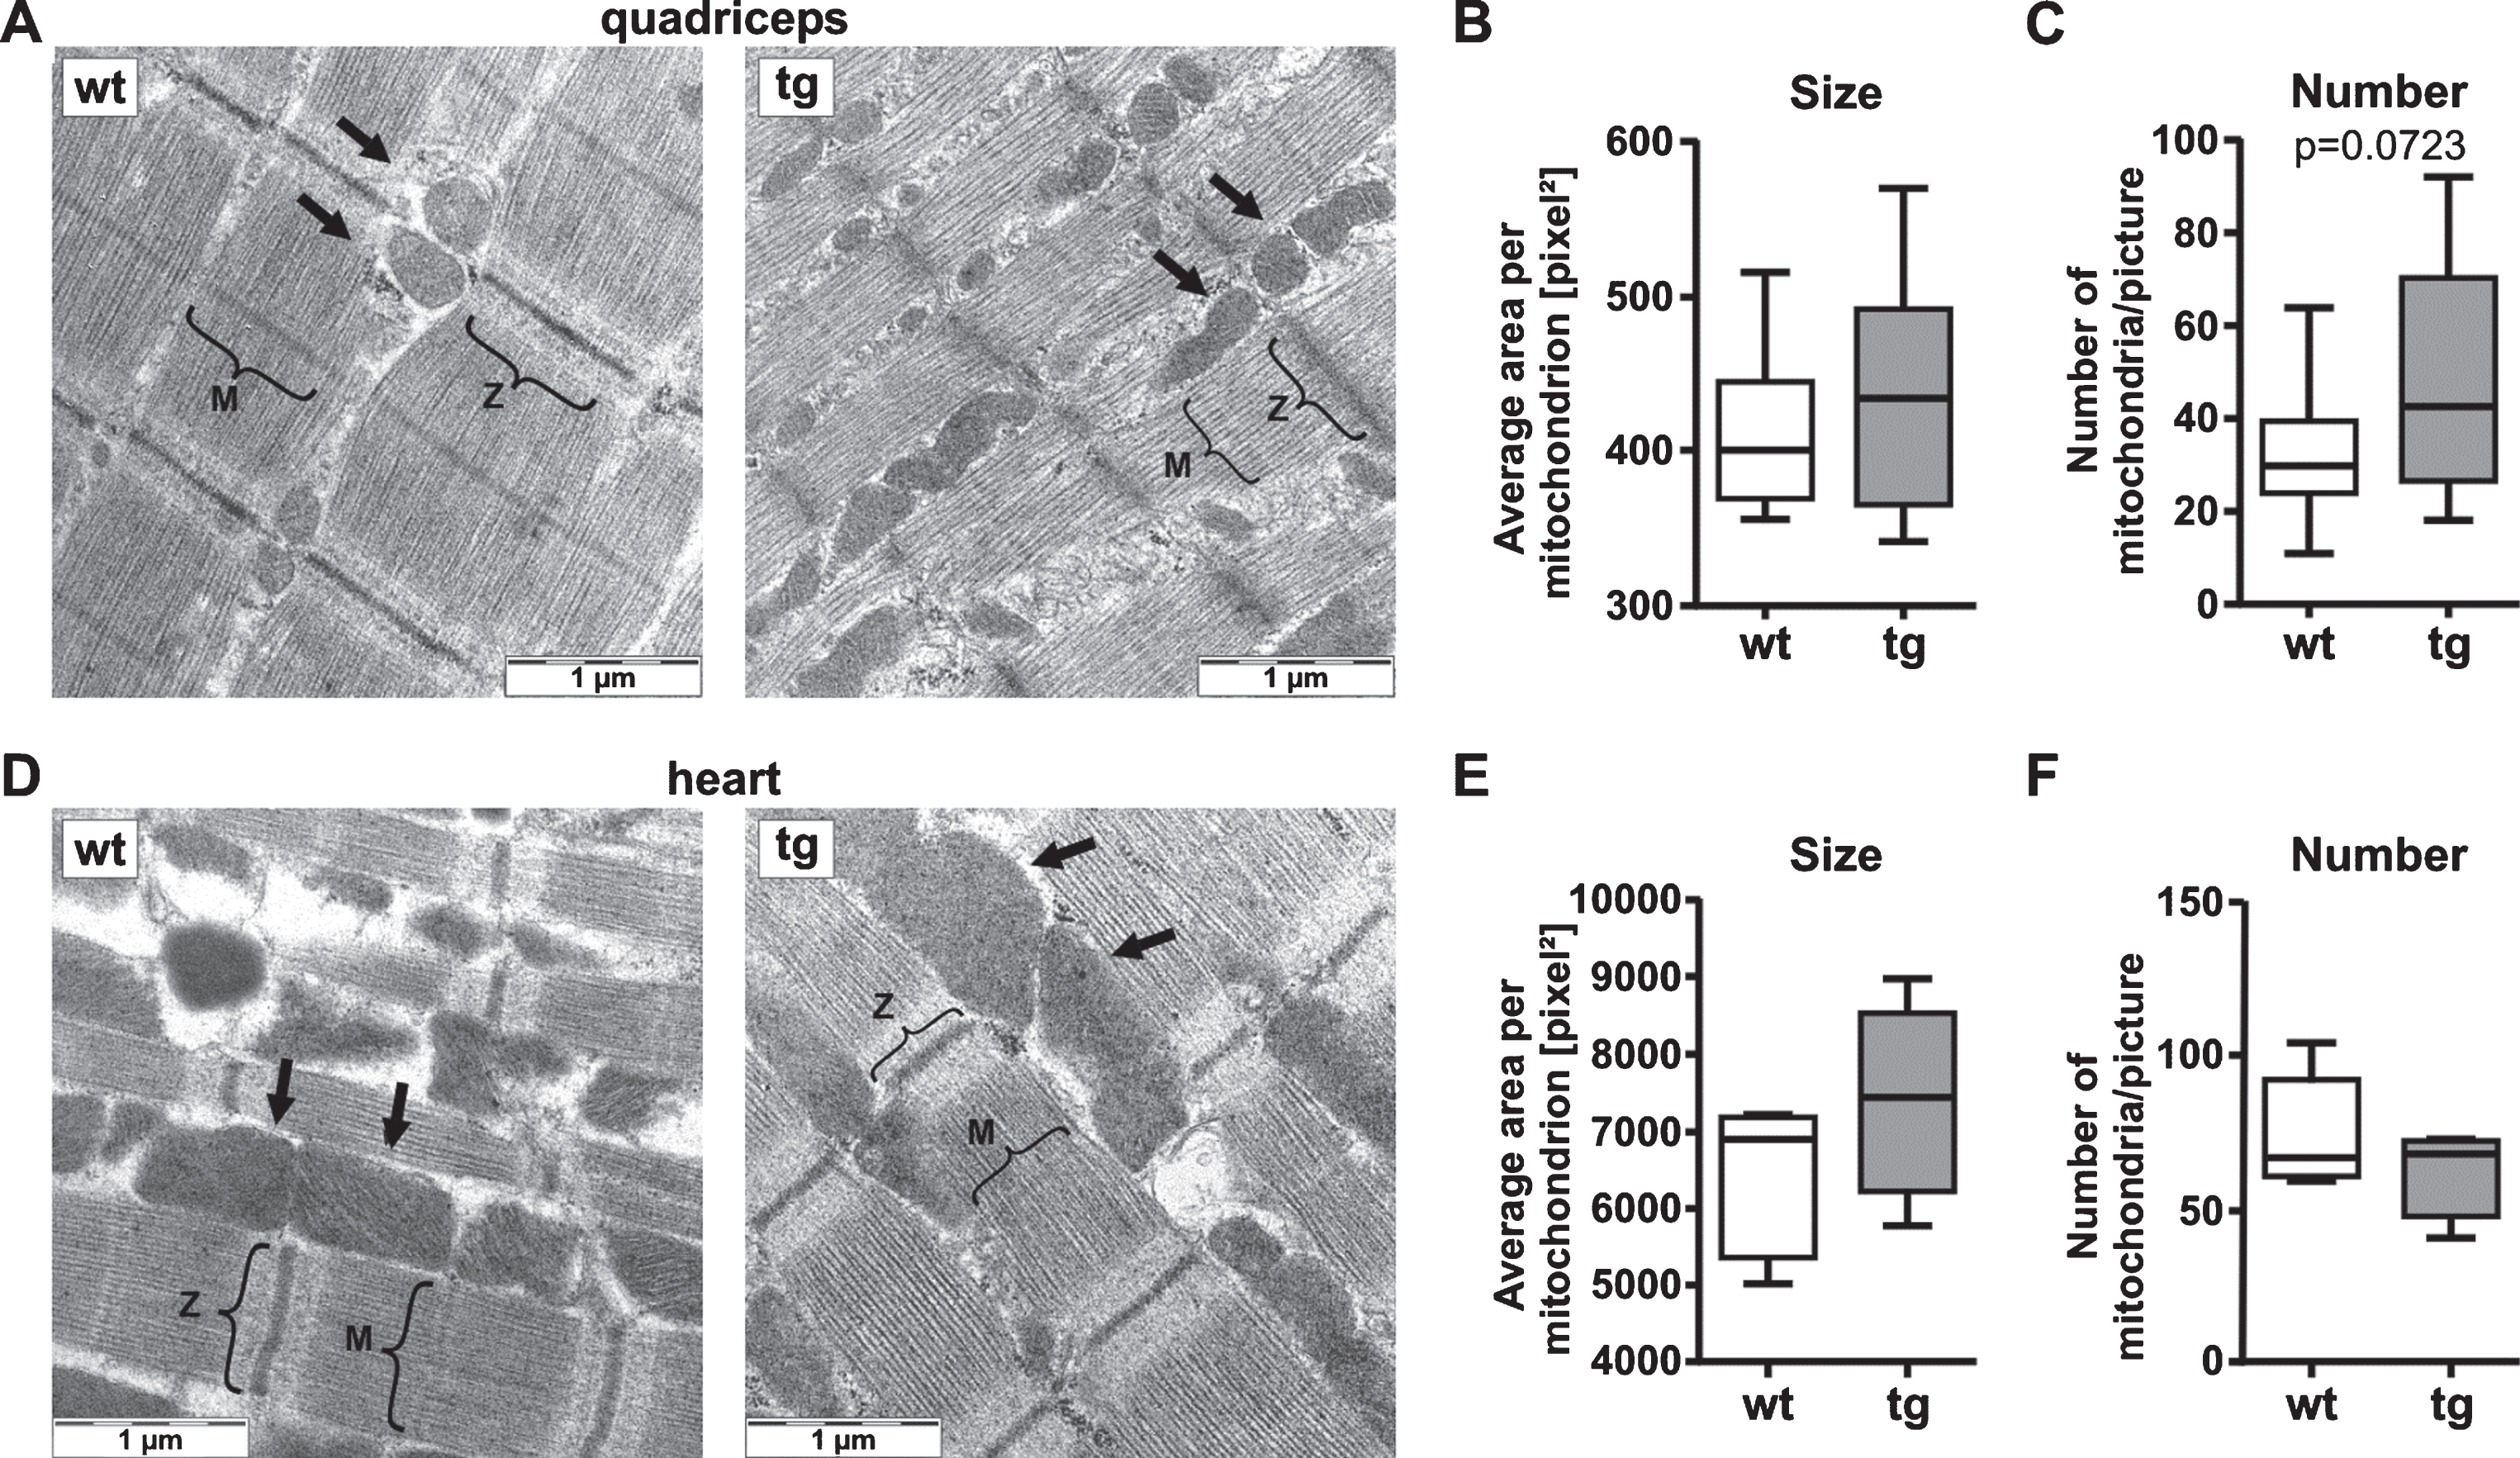
Electron microscopy of quadriceps of 12-week-old tg mice shows a non-significant increase in mitochondrial number. A-C) Analysis of mitochondrial shape and number in quadriceps of wt or tg mice. Representative electron microscopic images of wt and tg quadriceps with 40,000×magnification are shown in A, M: M-line, Z: Z-disk, arrows: mitochondria. The mitochondrial size is presented as average area per mitochondrion in pixel2 (B), the number of mitochondria is presented as mitochondria per picture (C). For quantitative analysis five images per sample at 12,000×magnification was used. For quadriceps tissue the sections for electron microscopy were prepared in longitudinal orientation to the fiber. D-F) Analysis of mitochondrial shape and number in heart of wt or tg mice. Representative electron microscopic images of wt and tg heart with 40,000×magnification are shown in A, M: M-line, Z: Z-disk, arrows: mitochondria. The mitochondrial size is presented as average area per mitochondrion in pixel2 (B), the number of mitochondria is presented as mitochondria per picture (C). For quantitative analysis five images per sample at 12,000×magnification was used. Data are presented as box plots with whiskers from minimum to maximum from n = 10 animals (composed of n = 5 male and n = 5 female mice per genotype, B and C) and n≥5 animals (E and F). Statistical test: t-test, P≤0.1 is indicated by the corresponding P-value. wt, wild-type mice; tg, transgenic mice.
In order to assess mitochondrial mass we analyzed citrate synthase activity, mitochondrial (mt) DNA copy number and Tfam (mitochondrial transcription factor A) mRNA expression or protein level. TFAM is an important regulator for mtDNA transcription and mtDNA copy number [50, 51]. Compared to wt tissue, citrate synthase activity, mtDNA copy number or Tfam mRNA levels were similar in tg quadriceps and heart (Table 2).
The activity of complex I and complex IV is decreased in quadriceps of R6/2 mice
An imbalance in mitochondrial fission and fusion can affect oxidative phosphorylation capacity and reduce ATP levels [52]. Therefore we next examined the activity of the respiratory chain complexes I, II/III and IV with spectrophotometry. To control for variations of mitochondrial mass we normalized our data to citrate synthase activity. In addition, we examined ATP levels in all tissues. In tg quadriceps we observed decreased complex I and complex IV activities (P < 0.05), whereas the activity of complex II/III was similar to wt. However, ATP levels were similar in tg and wt quadriceps (Fig. 6A). In tg heart tissue the respiratory chain activity and ATP levels were similar to wt (Fig. 6B).
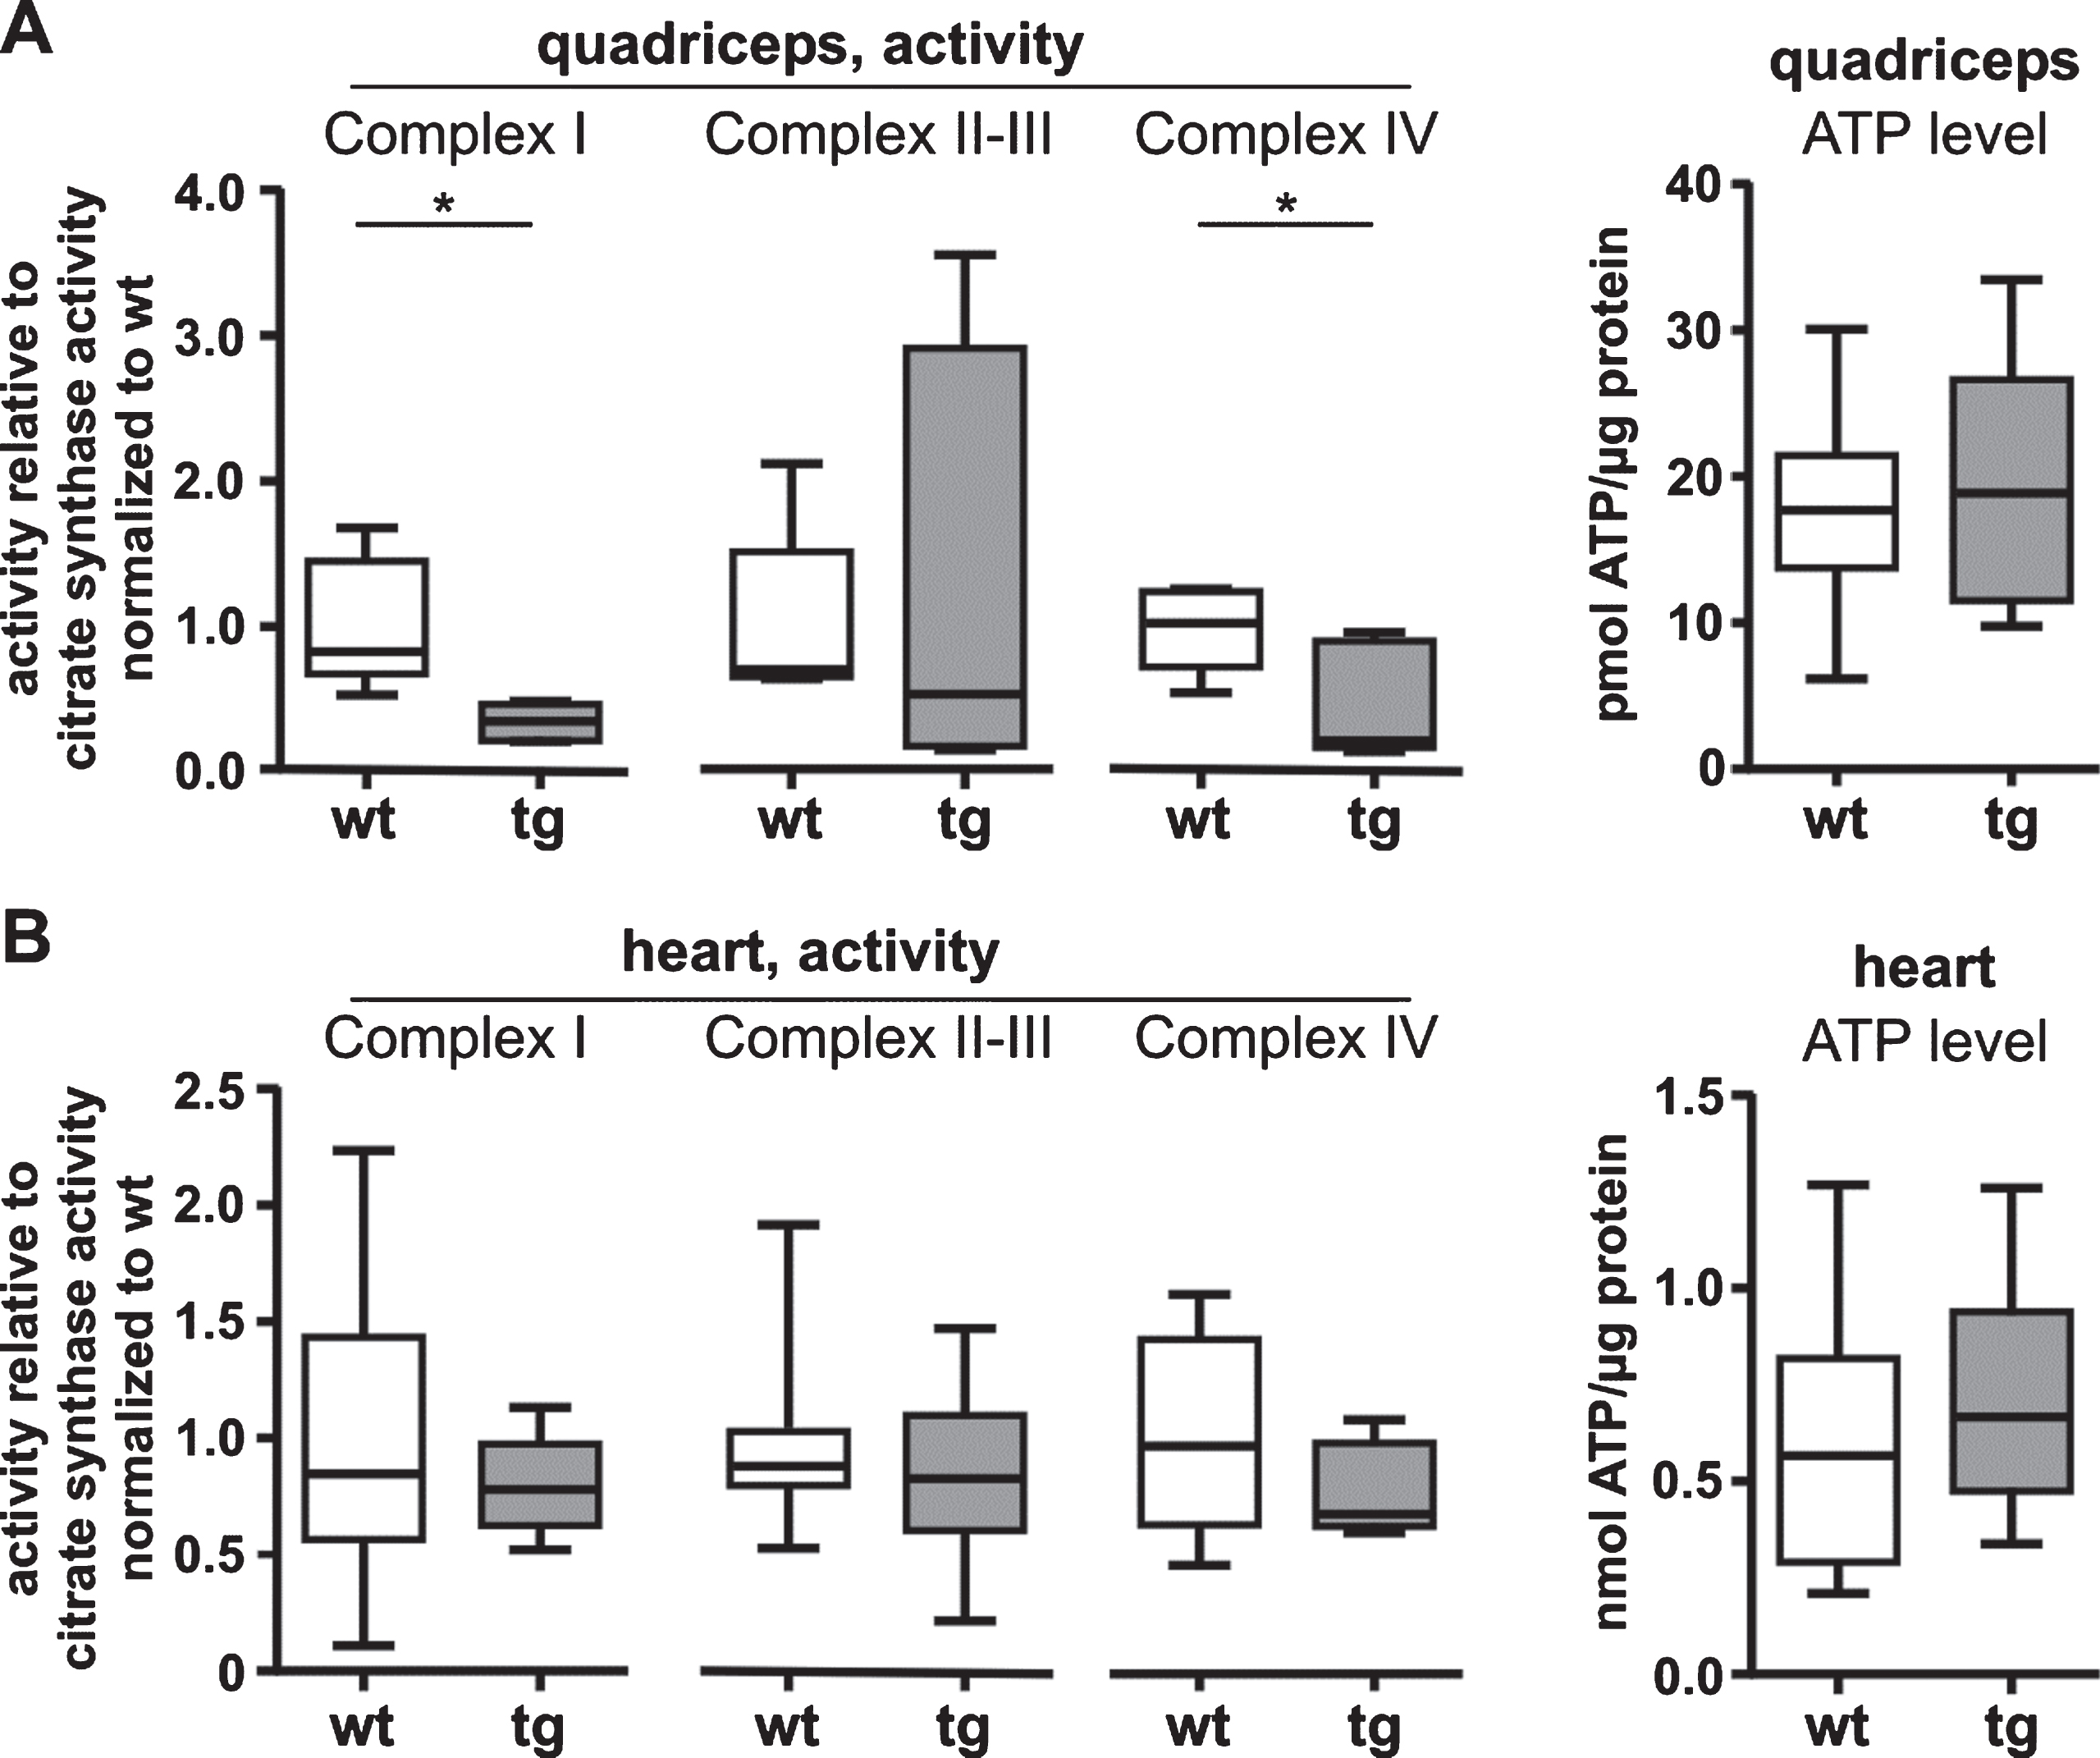
Activity of respiratory chain complex I and complex IV is decreased in quadriceps of 12-week-old R6/2 mice. A) Complex I and complex IV activities were decreased in quadriceps of tg mice while complex II-III activity was similar to wt mice. Activities were μmol/min/mg for complex I and complex II-III, and in k/min/mg for complex IV. Data were normalized to citrate synthase activities and to each wt (to the SEM of wt = 1). ATP level in quadriceps of tg mice were similar to wt mice. ATP level were normalized to the total amount of protein. B) Complex I, complex II-III and complex IV activities of tg heart were similar to wt. Activities were normalized to citrate synthase activities and to each wt (to the SEM of wt = 1). ATP level in heart of tg mice were similar to wt mice. ATP level were normalized to the total amount of protein Data are presented as box plots with whiskers from minimum to maximum from n≥4 animals (composed of n≥2 male and n≥2 female mice per genotype, A and B) or n≥7 animals (composed of n≥4 male and n≥3 female mice per genotype, C and D). Statistical test: t-test or Welch’s unequal variances t-test (complex I and complex IV activity in heart), *P < 0.05. wt, wild-type mice; tg, transgenic mice.
In addition to the analysis of respiratory chain complex activities we assessed the assembly of the complexes using blue native gel electrophoresis. In tg quadriceps levels of complex III assembly were increased compared to wt (P < 0.05). Complex assembly was similar in heart of tg and wt mice (Supplementary Tables 1 and 2).
DISCUSSION
In this study we examined the subcellular localization of mutant HTT, and mitochondrial dynamics and function in skeletal and heart muscle of late-stage R6/2 mice. Soluble mutant HTT was present in both muscle tissues with soluble mutant HTT expression higher in cytoplasmic/mitochondrial than nuclear fractions. However, HTT aggregates were only detectable in R6/2 quadriceps, in association with increased levels of the pro-fission factor DRP1 and its phosphorylated active form, and decreased levels of the pro-fusion factor MFN2. In addition, respiratory chain complex activities were decreased. In heart, despite similarly high, or even higher, levels of soluble mutant HTT, there were no detectable HTT aggregates and no evidence for mitochondrial dysfunction. This suggests that R6/2 heart is protected from HTT aggregate formation and mitochondrial pathology.
Using the very sensitive Singulex assay [31, 45] we showed that soluble mutant HTT was present in R6/2 heart and skeletal muscle samples. This is in accord with studies showing that soluble mutant HTT is expressed in a variety of non-CNS tissue of R6/2 mice, e.g., skeletal muscle, liver and spleen [45].
Consistent with data from brains of R6/2 and HdhQ150 mice, levels of HTT were highest in cytoplasmic/mitochondrial fractions [53, 54]. This indicates that full-length HTT, or fragments following cytoplasmic processing or CAG-repeat length-dependent aberrant splicing of HTT exon 1, can shuttle between the cytoplasm and the nucleus [55–60]. It is unknown whether HTT contains a nuclear localization signal. However, HTT contains multiple HEAT (huntingtin, elongation factor 3, the PR65/A subunit of protein phosphatase 2A and the lipid kinase Tor) repeat sequences [61]. Proteins harboring HEAT domains often mediate protein-protein interactions and intracellular transport, including nucleocytoplasmic shuttling [62]. HTT contains a nuclear export signal (NES) in the C-terminal region, which is strictly conserved among species [55]. In addition HTT has within the first N-terminal 17 amino acids a translocated promoter region that acts as nuclear export signal [58]. Increasing polyQ expansions reduce its nuclear export and cause nuclear accumulation and aggregation of HTT [58].
The formation of intra-nuclear HTT aggregates is a pathological hallmark in human HD brains [63]. Consistent with previous findings we detected aggregates in total lysate of R6/2 exon 1 fragment model skeletal muscle but not heart [23–26]. Also in HdhQ150 mice aggregates have been detected in a wide range of peripheral tissues at 22 months of age, such as skeletal muscle, liver and kidney [64], while similar to our findings in heart of HdhQ150 mice aggregates could not be identified contrary to a previous study in the R6/2 model in which ubiquitin immunostaining of the left ventricle was found without direct evidence of HTT aggregation [64]. In vitro studies have shown that aggregation will not occur until the monomer concentration exceeds a certain critical concentration [65]. The aggregation process of the exon 1-derived fragment occurs in a time, concentration and polyQ repeat length dependent manner [65]. It is possible that N-terminal mutant exon 1-derived protein concentrations do not exceed that critical concentration in heart muscle samples. In contrast to in vitro aggregation kinetics [65] high amounts of soluble mutant HTT in vivo do not always correlate with the presence of aggregates. In R6/2 testis high levels of the soluble form have been detected but no aggregates were observed. In contrast, other tissues as for example liver with similar expression levels of soluble mutant HTT were characterized by aggregate formation [45]. This discrepancy suggests that many factors such as the ability of cells to divide, cell specific expression levels and subcellular distribution of mutant HTT may determine whether aggregation occurs [66]. Furthermore, age-dependent aggregate formation may differ between tissues. In R6/2 mice aggregates have been detected in, e.g., striatum at 2 weeks of age, in cortex at 4 weeks and in skeletal muscle at 8 weeks of age [23]. This supports the notion that some tissues are more prone to aggregation than others.
We found highest aggregate levels in the nuclear fraction of R6/2 skeletal muscle. However, HTT aggregates were often localized adjacent to the nuclei rather than within them, and cytoplasmic aggregates were also clearly present, similar to findings in cortex of zQ175 mice [67] and striatum of R6/2 mice [68]. Nuclear and cytoplasmic HTT aggregates can interfere with nucleocytoplasmic protein and mRNA transport, which has been shown in striatum and cortex of both R6/2 mice and zQ175, in human HD post-mortem brain tissue and in cell models expressing mutant HTT exon 1 [54, 69]. Aggregate-mediated disruption of nucleocytoplasmic transport may thus be a critical event leading to pathology by affecting a number of cellular processes. We therefore next asked whether the presence of aggregates was associated with a biological phenotype. Similar to aggregate formation, abnormal fission and fusion was limited to R6/2 skeletal muscle in which levels of total and activated DRP1 were increased, concomitant with reduced MFN2 levels, and a complex I and IV deficiency. This is similar to what has been observed in HD lymphoblasts and Hdh(Q111) striatal cells [12] lending further support to the notion of a shift of the fission and fusion balance towards fission in HD. In contrast, in tg heart, in which there was no detectable aggregate formation there was no evidence of any mitochondrial phenotype.
In summary, abnormal mitochondrial fission and fusion and respiratory chain defects were only evident in tg skeletal muscle that had HTT aggregates. Fission and fusion maintain mitochondrial homeostasis and are essential for mitochondrial quality control [70]. Mitochondrial quality control is tightly associated with mitochondrial protein homeostasis which is maintained by mtUPR, a signaling pathway linking mitochondria with the nucleus [71]. Inhibition of the nucleocytoplasmic transport by mutant HTT aggregates may lead to severe defects in mitochondrial quality control pathways and impact the ability to respond to stress. The striking differences in aggregate formation and mitochondrial function between skeletal muscle and heart in the R6/2 model indicate that differences in these tissues may have a substantial modifying effect on HD pathogenesis. The underlying mechanisms of disease modification may warrant further exploration.
CONFLICT OF INTEREST
We have no conflicts of interest.
Footnotes
ACKNOWLEDGMENTS
We thank Nathalie Birth, Jaqueline Hallitsch, Thomas Lenk and Medea Müller for technical assistance, and Dr Andreas Neueder for helpful comments on the manuscript. Further we thank the animal facility and the electron microscopy unit (head Prof. Walther) at Ulm University for their help.
This work was supported by CHDI Foundation (A-7328) to M.O.